Attached files
| file | filename |
|---|---|
| 8-K - FORM 8-K - EVERSOURCE ENERGY | tm2034838d1_8k.htm |
| EX-99.2 - EXHIBIT 99.2 - EVERSOURCE ENERGY | tm2034838d1_ex99-2.htm |
| EX-99.1 - EXHIBIT 99.1 - EVERSOURCE ENERGY | tm2034838d1_ex99-1.htm |
Exhibit 99.3
2020 Third Quarter Results November 4, 2020
Safe Harbor Statement 1 All per - share amounts in this presentation are reported on a diluted basis. The only common equity securities that are publicly traded are common shares of Eversource Energy. The earnings and EPS of each business do not represent a direct legal interest in the assets and liabilities of such bu siness, but rather represent a direct interest in Eversource Energy's assets and liabilities as a whole. EPS by business is a non - GAAP (not determined using generally accepte d accounting principles) financial measure that is calculated by dividing the net income or loss attributable to common shareholders of each business by the wei ght ed average diluted Eversource Energy common shares outstanding for the period. Earnings discussions also include non - GAAP financial measures referencing 2020 earnin gs and EPS excluding certain acquisition costs and second quarter 2019 earnings and EPS excluding the NPT impairment charge. Eversource Energy uses these no n - GAAP financial measures to evaluate and provide details of earnings results by business and to more fully compare and explain 2020 and 2019 results with out including these items. Management believes the acquisition costs and the NPT impairment charge are not indicative of Eversource Energy’s ongoing costs and perf orm ance. Due to the nature and significance of these items on net income attributable to common shareholders, management believes that the non - GAAP presentatio n is a more meaningful representation of Eversource Energy’s financial performance and provides additional and useful information to readers in anal yzi ng historical and future performance of the business. Non - GAAP financial measures should not be considered as alternatives to Eversource Energy’s consolidated net income a ttributable to common shareholders or EPS determined in accordance with GAAP as indicators of Eversource Energy’s operating performance. This document includes statements concerning Eversource Energy’s expectations, beliefs, plans, objectives, goals, strategies, as sumptions of future events, future financial performance or growth and other statements that are not historical facts. These statements are “forward - looking statem ents” within the meaning of the Private Securities Litigation Reform Act of 1995. Generally, readers can identify these forward - looking statements through the use of w ords or phrases such as “estimate,” “expect,” “anticipate,” “intend,” “plan,” “project,” “believe,” “forecast,” “should,” “could” and other similar expressions. Fo rward - looking statements involve risks and uncertainties that may cause actual results or outcomes to differ materially from those included in the forward - looking statemen ts. Factors that may cause actual results to differ materially from those included in the forward - looking statements include, but are not limited to: cyberattacks or breache s, including those resulting in the compromise of the confidentiality of our proprietary information and the personal information of our customers; disruptions in the capit al markets or other events that make our access to necessary capital more difficult or costly; the negative impacts of the novel coronavirus (COVID - 19) pandemic on our customers, vendors, employees, regulators, and operations; changes in economic conditions, including impact on interest rates, tax policies, and customer demand and payment ab ility; ability or inability to commence and complete our major strategic development projects and opportunities; acts of war or terrorism, physical attacks or grid distu rba nces that may damage and disrupt our electric transmission and electric, natural gas, and water distribution systems; actions or inaction of local, state and fede ral regulatory, public policy and taxing bodies; substandard performance of third - party suppliers and service providers; fluctuations in weather patterns, including extreme weat her due to climate change; changes in business conditions, which could include disruptive technology or development of alternative energy sources related to our cu rre nt or future business model; contamination of, or disruption in, our water supplies; changes in levels or timing of capital expenditures, changes in laws, regulations o r r egulatory policy, including compliance with environmental laws and regulations; changes in accounting standards and financial reporting regulations; actions of rating ag enc ies; and other presently unknown or unforeseen factors. Other risk factors are detailed in Eversource Energy’s reports filed with the Securities and Exchange Commission (SEC). They ar e updated as necessary and available on Eversource Energy’s website at www.eversource.com and on the SEC’s website at www.sec.gov. All such factors are difficult to pr edict and contain uncertainties that may materially affect Eversource Energy’s actual results, many of which are beyond our control. You should not place undue relia nce on the forward - looking statements, as each speaks only as of the date on which such statement is made, and, except as required by federal securities laws, Eversour ce Energy undertakes no obligation to update any forward - looking statement or statements to reflect events or circumstances after the date on which such statement is made or to reflect the occurrence of unanticipated events.

2 3Q 2020 3Q 2019 3Q Change 9M 2020 9M 2019 9M Change $0.60 $0.61 ($0.01) $1.33 $1.32 $0.01 0.36 0.33 0.03 1.13 1.07 0.06 (0.04) (0.05) 0.01 0.22 0.18 0.04 0.07 0.06 0.01 0.11 0.08 0.03 0.03 0.03 0.00 0.01 0.04 (0.03) 1.02 0.98 0.04 2.80 2.69 0.11 0.00 0.00 0.00 0.00 (0.64) 0.64 (0.01) 0.00 (0.01) (0.04) 0.00 (0.04) $1.01 $0.98 $0.03 $2.76 $2.05 $0.71 Electric Distribution Electric Transmission Ex. NPT Impairment (Non - GAAP) Natural Gas Distribution Parent & Other (Non - GAAP) Water Distribution Third Quarter and First Nine Months EPS Results EPS, Ex. NPT Impairment, Columbia Gas Asset Acquisition Costs (Non - GAAP) Columbia Gas Asset Acquisition Costs Reported EPS (GAAP) NPT Impairment
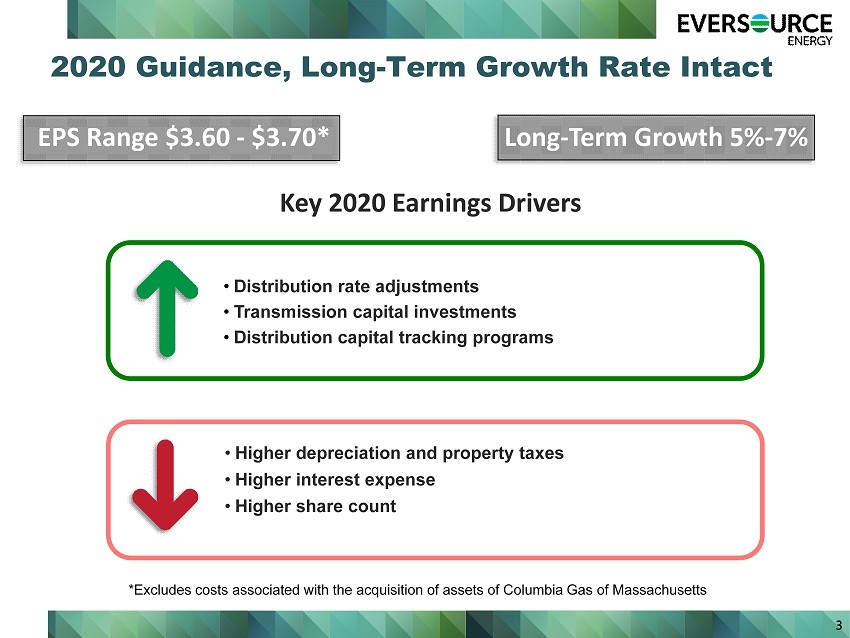
2020 Guidance, Long - Term Growth Rate Intact Key 2020 Earnings Drivers EPS Range $3.60 - $3.70* • Distribution rate adjustments • Transmission capital investments • Distribution capital tracking programs • Higher depreciation and property taxes • Higher interest expense • Higher share count 3 Long - Term Growth 5% - 7% *Excludes costs associated with the acquisition of assets of Columbia Gas of Massachusetts
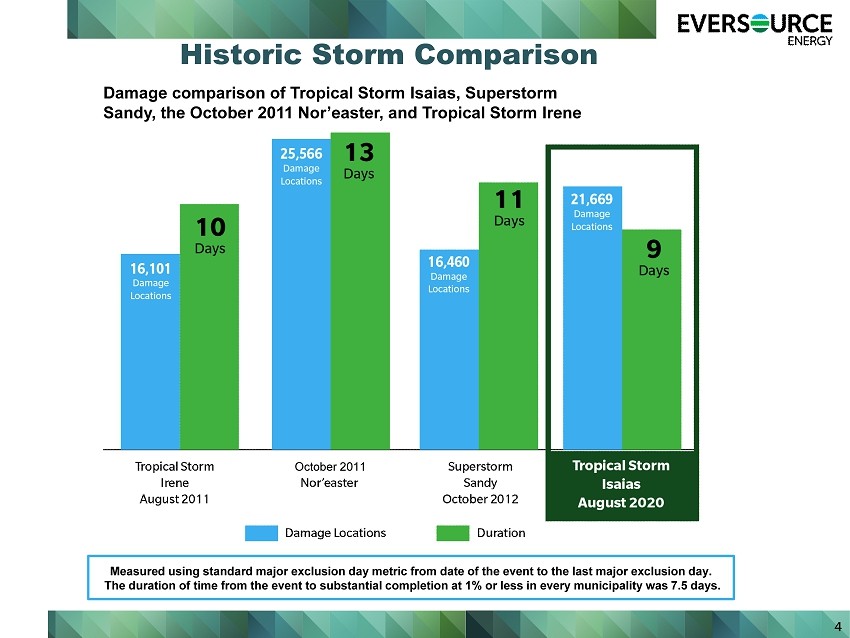
Historic Storm Comparison Damage comparison of Tropical Storm Isaias, Superstorm Sandy, the October ’11 Nor’easter, and Superstorm Sandy. Measured using standard major exclusion day metric from date of the event to the last major exclusion day. The duration of time from the event to substantial completion at 1% or less in every municipality was 7.5 days. 4 Tropical Storm Irene. Damage comparison of Tropical Storm Isaias, Superstorm Sandy, the October 2011 Nor’easter, and Tropical Storm Irene October 2011
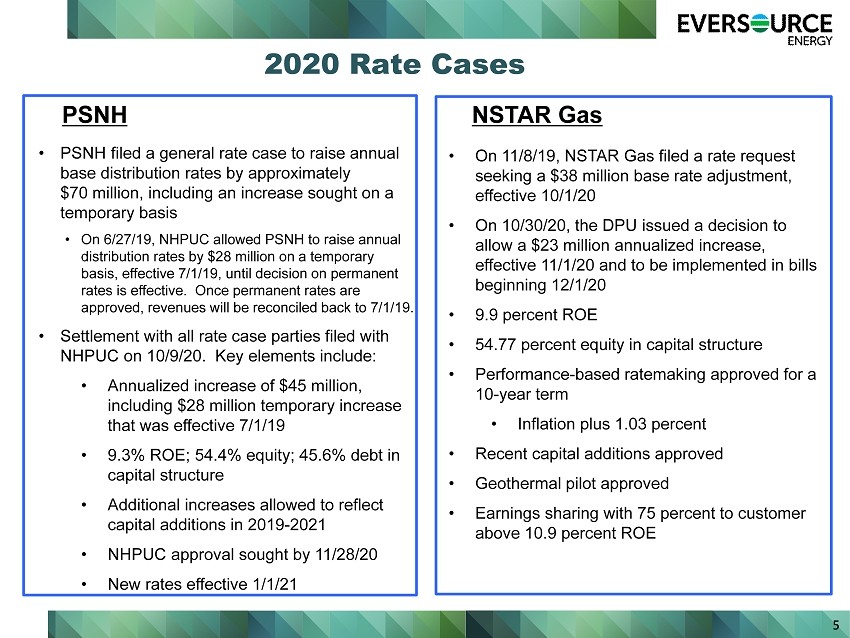
5 2020 Rate Cases • PSNH filed a general rate case to raise annual base distribution rates by approximately $70 million, including an increase sought on a temporary basis • On 6/27/19, NHPUC allowed PSNH to raise annual distribution rates by $28 million on a temporary basis, effective 7/1/19, until decision on permanent rates is effective. Once permanent rates are approved, revenues will be reconciled back to 7/1/19. • Settlement with all rate case parties filed with NHPUC on 10/9/20. Key elements include: • Annualized increase of $45 million, including $28 million temporary increase that was effective 7/1/19 • 9.3% ROE; 54.4% equity; 45.6% debt in capital structure • Additional increases allowed to reflect capital additions in 2019 - 2021 • NHPUC approval sought by 11/28/20 • New rates effective 1/1/21 PSNH • On 11/8/19, NSTAR Gas filed a rate request seeking a $38 million base rate adjustment, effective 10/1/20 • On 10/30/20, the DPU issued a decision to allow a $23 million annualized increase, effective 11/1/20 and to be implemented in bills beginning 12/1/20 • 9.9 percent ROE • 54.77 percent equity in capital structure • Performance - based ratemaking approved for a 10 - year term • Inflation plus 1.03 percent • Recent capital additions approved • Geothermal pilot approved • Earnings sharing with 75 percent to customer above 10.9 percent ROE NSTAR Gas

6 Eversource Has Acquired MA Natural Gas Assets of NiSource ▪ Transaction closed on October 9 ▪ All - cash $1.1 billion transaction excluding working capital adjustments (1.1x rate base) ▪ Financing consistent with existing ES capital structure ▪ Equity sold in June; debt in August ▪ No assumption of debt ▪ Expected to be accretive over first 12 months and incrementally accretive over following years Eversource Gas of Massachusetts NSTAR Gas and Yankee Gas

Key Elements of Settlement Approved by MA DPU on October 7 ▪ Joint settlement with MA AG, DOER, NiSource and low - income network ▪ Eight - year rate plan ▪ Day One rate base of approximately $1 billion ▪ Authorized ROE: 9.7% ▪ Authorized equity in capital structure of 53.25% ▪ General rate increases of $13 million on 11/1/21 and $10 million on 11/1/22 ▪ GSEP - related rate changes continue annually (pipe replacement rate under GSEP to continue at 45 miles/year) ▪ Report on status of former Columbia Gas system due to the DPU by 9/1/21 with proposed work plan ▪ Additional base rate adjustments tied to non - GSEP investments on 11/1/24 and 11/1/27 ▪ NiSource paid $56 million in lieu of penalties: – $41 million to establish a Merrimack Valley Renewal Fund – $15 million for Arrearage Forgiveness 7
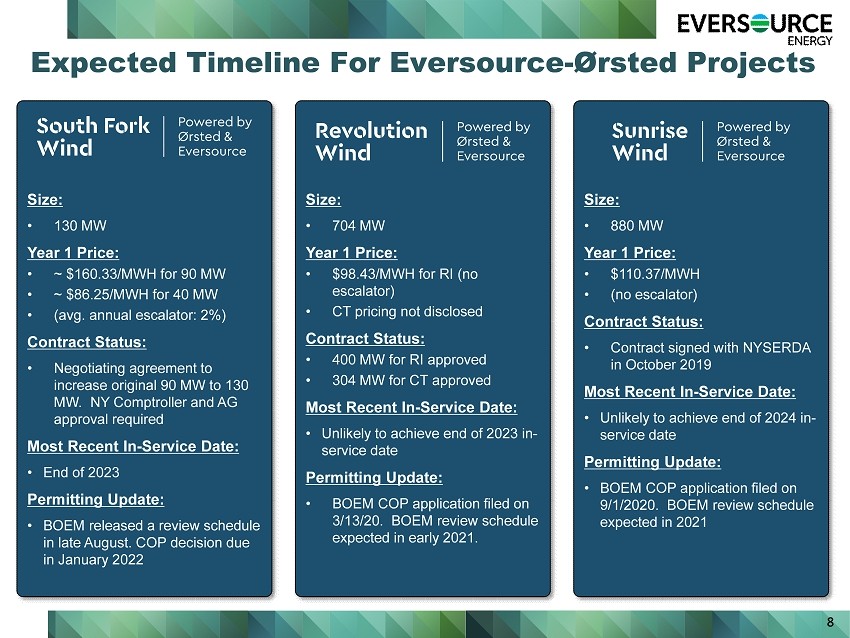
Expected Timeline For Eversource - Ørsted Projects 8 Size: • 130 MW Year 1 Price: • ~ $160.33/MWH for 90 MW • ~ $86.25/MWH for 40 MW • (avg. annual escalator: 2%) Contract Status: • Negotiating agreement to increase original 90 MW to 130 MW. NY Comptroller and AG approval required Most Recent In - Service Date: • End of 2023 Permitting Update: • BOEM released a review schedule in late August. COP decision due in January 2022 Size: • 704 MW Year 1 Price: • $98.43/MWH for RI (no escalator) • CT pricing not disclosed Contract Status: • 400 MW for RI approved • 304 MW for CT approved Most Recent In - Service Date: • Unlikely to achieve end of 2023 in - service date Permitting Update: • BOEM COP application filed on 3/13/20. BOEM review schedule expected in early 2021. Size: • 880 MW Year 1 Price: • $110.37/MWH • (no escalator) Contract Status: • Contract signed with NYSERDA in October 2019 Most Recent In - Service Date: • Unlikely to achieve end of 2024 in - service date Permitting Update: • BOEM COP application filed on 9/1/2020. BOEM review schedule expected in 2021

9 APPENDIX
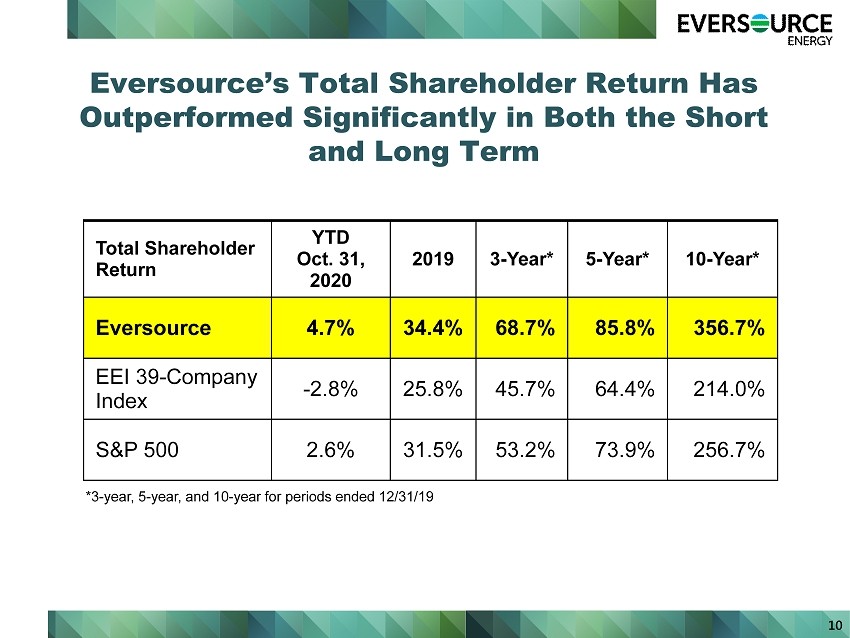
Eversource’s Total Shareholder Return Has Outperformed Significantly in Both the Short and Long Term 10 Total Shareholder Return YTD Oct. 31, 2020 2019 3 - Year* 5 - Year* 10 - Year* Eversource 4.7% 34.4% 68.7% 85.8% 356.7% EEI 39 - Company Index - 2.8% 25.8% 45.7% 64.4% 214.0% S&P 500 2.6% 31.5% 53.2% 73.9% 256.7% *3 - year, 5 - year, and 10 - year for periods ended 12/31/19
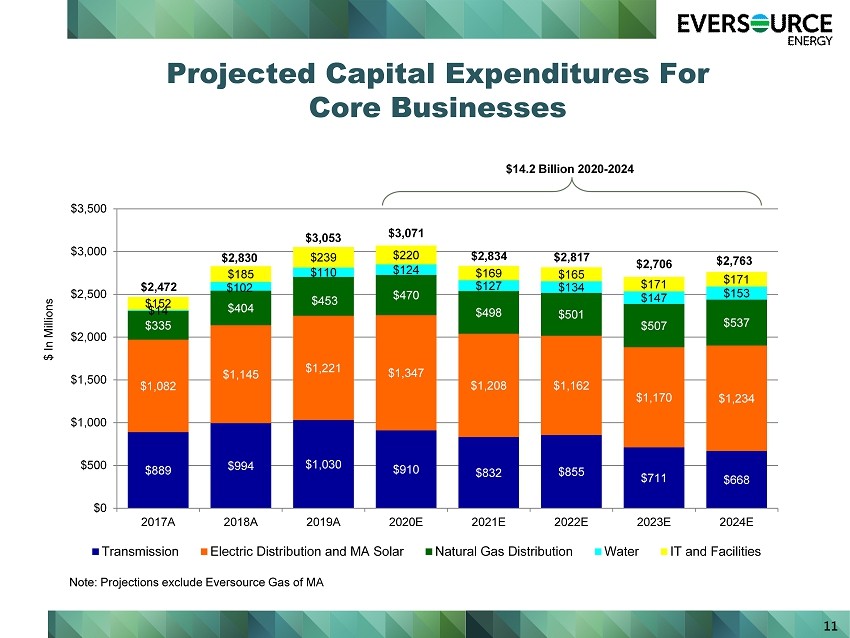
11 $889 $994 $1,030 $910 $832 $855 $711 $668 $1,082 $1,145 $1,221 $1,347 $1,208 $1,162 $1,170 $1,234 $335 $404 $453 $470 $498 $501 $507 $537 $14 $102 $110 $124 $127 $134 $147 $153 $152 $185 $239 $220 $169 $165 $171 $171 $0 $500 $1,000 $1,500 $2,000 $2,500 $3,000 $3,500 2017A 2018A 2019A 2020E 2021E 2022E 2023E 2024E Transmission Electric Distribution and MA Solar Natural Gas Distribution Water IT and Facilities $2,817 $2,834 $ In Millions Projected Capital Expenditures For Core Businesses $3,053 $2,830 $2,472 $14.2 Billion 2020 - 2024 $3,071 $2,706 $2,763 Note: Projections exclude Eversource Gas of MA