Attached files
| file | filename |
|---|---|
| EX-32.2 - EX-32.2 - DUCK CREEK TECHNOLOGIES, INC. | dct-ex322_520.htm |
| EX-32.1 - EX-32.1 - DUCK CREEK TECHNOLOGIES, INC. | dct-ex321_519.htm |
| EX-31.2 - EX-31.2 - DUCK CREEK TECHNOLOGIES, INC. | dct-ex312_521.htm |
| EX-31.1 - EX-31.1 - DUCK CREEK TECHNOLOGIES, INC. | dct-ex311_522.htm |
| EX-23.1 - EX-23.1 - DUCK CREEK TECHNOLOGIES, INC. | dct-ex231_443.htm |
UNITED STATES
SECURITIES AND EXCHANGE COMMISSION
Washington, D.C. 20549
FORM 10-K
(Mark One)
|
☒ |
|
ANNUAL REPORT PURSUANT TO SECTION 13 OR 15(d) OF THE SECURITIES EXCHANGE ACT OF 1934 |
For the fiscal year ended August 31, 2020
OR
|
☐ |
|
TRANSITION REPORT PURSUANT TO SECTION 13 OR 15(d) OF THE SECURITIES EXCHANGE ACT OF 1934 FOR THE TRANSITION PERIOD FROM TO |
Commission File Number 001-39449
Duck Creek Technologies, Inc.
(Exact name of Registrant as specified in its Charter)
|
Delaware |
|
84-3723837 |
|
(State or other jurisdiction of incorporation or organization) |
|
(I.R.S. Employer Identification No.) |
|
22 Boston Wharf Road, Floor 10 Boston, MA |
|
02210 |
|
(Address of principal executive offices) |
|
(Zip Code) |
Registrant’s telephone number, including area code: (888) 724-3509
Securities registered pursuant to Section 12(b) of the Act:
|
Title of each class |
|
Trading Symbol(s) |
|
Name of each exchange on which registered |
|
Common stock, $0.01 par value per share |
|
DCT |
|
Nasdaq Global Select Market |
Securities registered pursuant to Section 12(g) of the Act: None
Indicate by check mark if the Registrant is a well-known seasoned issuer, as defined in Rule 405 of the Securities Act. YES ☐ NO ☒
Indicate by check mark if the Registrant is not required to file reports pursuant to Section 13 or 15(d) of the Act. YES ☐ NO ☒
Indicate by check mark whether the Registrant: (1) has filed all reports required to be filed by Section 13 or 15(d) of the Securities Exchange Act of 1934 during the preceding 12 months (or for such shorter period that the Registrant was required to file such reports), and (2) has been subject to such filing requirements for the past 90 days. YES ☐ NO ☒
Indicate by check mark whether the Registrant has submitted electronically every Interactive Data File required to be submitted pursuant to Rule 405 of Regulation S-T (§232.405 of this chapter) during the preceding 12 months (or for such shorter period that the Registrant was required to submit such files). YES ☒ NO ☐
Indicate by check mark whether the registrant is a large accelerated filer, an accelerated filer, a non-accelerated filer, smaller reporting company, or an emerging growth company. See the definitions of “large accelerated filer,” “accelerated filer,” “smaller reporting company,” and “emerging growth company” in Rule 12b-2 of the Exchange Act.
|
Large accelerated filer |
|
☐ |
|
Accelerated filer |
|
☐ |
|
|
|
|
|
|
|
|
|
Non-accelerated filer |
|
☒ |
|
Smaller reporting company |
|
☐ |
|
|
|
|
|
|
|
|
|
|
|
|
|
Emerging growth company |
|
☒ |
If an emerging growth company, indicate by check mark if the registrant has elected not to use the extended transition period for complying with any new or revised financial accounting standards provided pursuant to Section 13(a) of the Exchange Act. ☒
Indicate by check mark whether the Registrant is a shell company (as defined in Rule 12b-2 of the Exchange Act). YES ☐ NO ☒
The registrant was not a public company as of the last business day of its most recently completed second fiscal quarter and, therefore, cannot calculate the aggregate market value of its voting and non-voting common equity held by non-affiliates as of such date.
The number of shares of Registrant’s Common Stock outstanding as of October 29, 2020 was 130,833,050.
|
|
|
Page |
|
1 |
||
|
2 |
||
|
|
|
|
|
|
|
|
|
Item 1. |
4 |
|
|
Item 1A. |
19 |
|
|
Item 1B. |
49 |
|
|
Item 2. |
49 |
|
|
Item 3. |
50 |
|
|
Item 4. |
50 |
|
|
|
|
|
|
|
|
|
|
Item 5. |
51 |
|
|
Item 6. |
53 |
|
|
Item 7. |
Management’s Discussion and Analysis of Financial Condition and Results of Operations |
55 |
|
Item 7A. |
75 |
|
|
Item 8. |
76 |
|
|
Item 9. |
Changes in and Disagreements with Accountants on Accounting and Financial Disclosure |
114 |
|
Item 9A. |
114 |
|
|
Item 9B. |
114 |
|
|
|
|
|
|
|
|
|
|
Item 10. |
115 |
|
|
Item 11. |
120 |
|
|
Item 12. |
Security Ownership of Certain Beneficial Owners and Management and Related Stockholder Matters |
128 |
|
Item 13. |
Certain Relationships and Related Transactions, and Director Independence |
131 |
|
Item 14. |
136 |
|
|
|
|
|
|
|
|
|
|
Item 15. |
137 |
|
|
Item 16 |
139 |
|
i
Special Note Regarding Forward-Looking Statements
Some of the information contained in the sections entitled “Item 1. Business” and “Item 7. Management’s Discussion and Analysis of Financial Condition and Results of Operations,” and elsewhere in this Annual Report on Form 10-K contain forward-looking statements that reflect our current views with respect to, among other things, future events and financial performance. You can identify these forward-looking statements by the use of forward-looking words such as “outlook,” “believes,” “expects,” “potential,” “continues,” “may,” “will,” “should,” “could,” “seeks,” “approximately,” “predicts,” “intends,” “plans,” “estimates,” “anticipates,” “target,” “projects,” “contemplates” or the negative version of those words or other comparable words. Any forward-looking statements contained in this report are based upon our historical performance and on our current plans, estimates and expectations in light of information currently available to us. The inclusion of this forward-looking information should not be regarded as a representation by us that the future plans, estimates or expectations contemplated by us will be achieved. Such forward-looking statements are subject to various risks and uncertainties and assumptions relating to our operations, financial results, financial condition, business, prospects, growth strategy and liquidity. For more information regarding these risks and uncertainties as well as certain additional risks that we face, refer to “Item 1A. Risk Factors” as well as the factors more fully described in “Item 7. Management’s Discussion and Analysis of Financial Conditions and Results of Operations.” Accordingly, there are, or will be, important factors that could cause our actual results to differ materially from those indicated in these statements. We believe that these factors include, but are not limited to:
|
|
• |
our history of losses; |
|
|
• |
changes in our product revenue mix as we continue to focus on sales of our SaaS solutions, which will cause fluctuations in our results of operations and cash flows between periods; |
|
|
• |
our reliance on orders and renewals from a relatively small number of customers for a substantial portion of our revenue, and the substantial negotiating leverage customers have in renewing and expanding their contracts for our solutions; |
|
|
• |
the success of our growth strategy focused on SaaS solutions and our ability to develop or sell our solutions into new markets or further penetrate existing markets; |
|
|
• |
our ability to manage our expanding operations; |
|
|
• |
intense competition in our market; |
|
|
• |
third parties may assert we are infringing or violating their intellectual property rights; |
|
|
• |
U.S. and global market and economic conditions, particularly adverse in the insurance industry; |
|
|
• |
additional complexity, burdens and volatility in connection with our international sales and operations; |
|
|
• |
the length and variability of our sales and implementation cycles; |
|
|
• |
data breaches, unauthorized access to customer data or other disruptions of our solutions; |
|
|
• |
control of our Company by the Apax VIII Fund, a global private equity fund (collectively, with its affiliates, “Apax”) and Accenture plc, a public limited company incorporated in Ireland (collectively, with its affiliates, “Accenture”), and perceived conflicts of interests; |
|
|
• |
our status as a “controlled company” within the meaning of the corporate governance standards of Nasdaq; |
1
|
|
• |
the other risks and uncertainties described under “Item 1A. Risk Factors.” |
These factors should not be construed as exhaustive and should be read in conjunction with the other cautionary statements that are included in this report. The forward-looking statements made in this report relate only to events as of the date on which the statements are made. We do not undertake any obligation to publicly update or review any forward-looking statement except as required by law, whether as a result of new information, future developments or otherwise.
If one or more of these or other risks or uncertainties materialize, or if our underlying assumptions prove to be incorrect, our actual results may vary materially from what we may have expressed or implied by these forward-looking statements. We caution that you should not place undue reliance on any of our forward-looking statements. You should specifically consider the factors identified in this report that could cause actual results to differ before making an investment decision to purchase our common stock. Furthermore, new risks and uncertainties arise from time to time, and it is impossible for us to predict those events or how they may affect us.
As used in this Annual Report on Form 10-K unless the context otherwise requires, references to “we,” “us,” “our,” the “Company,” “Duck Creek,” and similar references refer to Duck Creek Technologies, Inc. together with its subsidiaries, and the following terms have the meanings or are calculated as set forth below:
|
|
• |
We define “subscription revenue” as the revenue derived from the sale of our Software-as-a-service (“SaaS”) solutions through recurring fee arrangements for the period indicated. |
|
|
• |
We define “ACV” as the committed total contract value of new software sales in dollar terms divided by the corresponding minimum number of committed months, with the resultant minimum monthly commitment being multiplied by twelve. |
|
|
• |
We define “carriers” as property and casualty (“P&C”) insurance carriers. |
|
|
• |
We define “core systems” as the following key functions of carriers: policy administration, claims management and billing. |
|
|
• |
We define “customers” as buying entities that contract individually for our products and services. For example, multiple subsidiaries of a single carrier may each constitute a customer if each entity contracts with us separately. By contrast, a carrier that uses our products across multiple subsidiaries under a single enterprise license agreement would constitute a single customer. |
|
|
• |
We define “DWPs” as the gross dollar value of total premiums paid to carriers by policyholders. |
|
|
• |
Munich Re Specialty Insurance is a description for the insurance business operations of affiliated companies in the Munich Re Group that share a common directive to offer and deliver specialty property and casualty insurance products and services in North America. |
Certain monetary amounts, percentages, and other figures included in this Annual Report on Form 10-K have been subject to rounding adjustments. Percentage amounts included in this Annual Report on Form 10-K have not in all cases been calculated on the basis of such rounded figures, but on the basis of such amounts prior to rounding. For this reason, percentage amounts in this Annual Report on Form 10-K may vary from those obtained by performing the same calculations using the figures in our consolidated financial statements included elsewhere in this Annual Report on Form 10-K. Certain other amounts that appear in this Annual Report on Form 10-K may not
2
sum due to rounding. When we state that we are the leading SaaS provider of core systems for the P&C insurance industry, we are basing our leadership on our subscription revenue for fiscal 2020.
Our fiscal year ends on August 31. Unless otherwise noted, any reference to a year preceded by the word “fiscal” refers to the fiscal year ended August 31 of that year. For example, references to “fiscal 2019” refer to the fiscal year ended August 31, 2019. Any reference to a year not preceded by “fiscal” refers to a calendar year.
MARKET AND INDUSTRY DATA
Certain market and industry data included in this Annual Report on Form 10-K has been obtained from third party sources that we believe to be reliable. Market estimates are calculated by using independent industry publications, government publications, and third party forecasts in conjunction with our assumptions about our markets. We have not independently verified such third party information. While we are not aware of any misstatements regarding any market, industry or similar data presented herein, such data involves risks and uncertainties and is subject to change based on various factors, including those discussed under the headings “Forward-Looking Statements” and “Item1A. Risk Factors” in this Annual Report on Form 10-K.
3
Company Overview
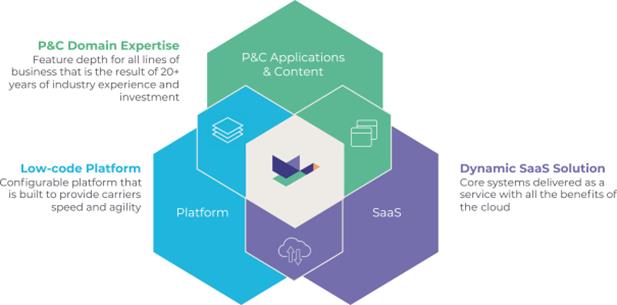
We are the leading SaaS provider of core systems for the P&C insurance industry. We have achieved our leadership position by combining over twenty years of deep domain expertise with the differentiated SaaS capabilities and low-code configurability of our technology platform. We believe we are the first company to provide carriers with an end-to-end suite of enterprise-scale core system software that is purpose-built as a SaaS solution. Our product portfolio is built on our modern technology foundation, the Duck Creek Platform, and works cohesively to improve the operational efficiency of carriers’ core processes (policy administration, claims management and billing) as well as other critical functions. The Duck Creek Platform enables our customers to be agile and rapidly capitalize on market opportunities, while reducing their total cost of technology ownership.
The core business functions of carriers are complex and data intensive, requiring large ongoing investments in domain specific technology. Heightened end-user expectations, increased competition, and new and evolving risks pose new challenges for carriers, creating the need for software that fosters agility, innovation and speed to market. However, a large portion of the P&C insurance market continues to rely on legacy technology systems that are costly and inefficient to maintain, difficult to upgrade, and lacking in functional flexibility. In recent years, some carriers have turned to newer alternatives to legacy systems. These systems have been designed for on-premise environments and lack the inherent benefits of purpose-built SaaS solutions, perpetuating the limitations, inflexibility and cost of legacy systems. By contrast, our SaaS solutions, offered through Duck Creek OnDemand, accelerate carriers’ agility and speed to market by enabling rapid, low-code product development, and protecting carriers’ unique content configurations and integrations while providing upgrades and updates via continuous delivery. We have developed a substantial SaaS customer base and believe that we have established a meaningful first-mover advantage by demonstrating the superiority of SaaS solutions for core systems in the P&C insurance industry. We began offering SaaS solutions for core systems in the P&C insurance industry in 2013 and signed our first customer in 2014. We believe competitors will have to make significant investments of time and resources in order to offer similar SaaS products.
Our deep understanding of the P&C insurance industry has enabled us to develop a single, unified suite of insurance software products that is tailored to address the key challenges faced by carriers. Our solutions promote carriers’ nimbleness by enabling rapid integration and streamlining the ability to capture, access and utilize data more effectively. The Duck Creek Suite includes several products that support the P&C insurance process lifecycle, such as:
|
|
• |
Duck Creek Policy: enables carriers to develop and launch new insurance products and manage all aspects of policy administration, from product definition to quoting, binding and servicing |
|
|
• |
Duck Creek Billing: supports fundamental payment and invoicing capabilities (such as billing and collections, commission processing, disbursement management and general ledger capabilities) for all insurance lines and bill types |
|
|
• |
Duck Creek Claims: supports the entire claims lifecycle from first notice of loss through investigation, payments, negotiations, reporting and closure |
4
In addition, we offer other innovative solutions, such as Duck Creek Rating, Duck Creek Insights, Duck Creek Digital Engagement, Duck Creek Distribution Management, Duck Creek Reinsurance Management, Duck Creek Anywhere Managed Integrations and Duck Creek Industry Content, which provide additional features and functionalities that further help our customers meet the increasing and evolving demands of the P&C industry. Our customers purchase and deploy Duck Creek OnDemand, our SaaS solution, either individually or as a suite. Historically, we have also sold our products through perpetual and term license arrangements, substantially all of which include maintenance and support arrangements. We offer professional services, primarily related to implementation of our products, in connection with both our SaaS solutions and perpetual and term license arrangements.
Substantially all of our new bookings come from the sale of SaaS subscriptions of Duck Creek OnDemand. For the fiscal years ended August 31, 2020, 2019 and 2018, SaaS ACV bookings represented 96%, 86%, and 71% of our total ACV bookings, respectively.
Our strong customer relationships are a key driver of our success. We believe these relationships are a result of our ability to develop innovative solutions that incorporate our deep domain expertise into products that serve mission critical functions in our customers’ day-to-day operations. Our customer base is comprised of a range of carriers, including some of the largest companies in the P&C insurance industry, such as Progressive, Liberty Mutual, AIG, The Hartford, Berkshire Hathaway Specialty Insurance, GEICO and Munich Re Specialty Insurance, as well as regional carriers, such as UPC, Coverys, Avant Mutual, IAT Insurance Group and Mutual Benefit Group. We have over 150 insurance customers worldwide, including the top five North American carriers. In addition, our customers have won numerous industry awards for innovative products that were developed with our solutions. For example, in 2018, AXIS and Northbridge won industry awards from Celent and Novarica for their products, which were built using Duck Creek solutions. In 2020, ProSight Insurance won an industry award from Novarica for core system transformation efforts using Duck Creek solutions.
We have a broad partner ecosystem that includes third-party solution partners who provide complementary capabilities as well as system integrators (“SIs”) who provide implementation and other related services to our customers. These partnerships help us grow our business more efficiently by enhancing our sales force through co-marketing efforts and giving us scale to service our growing customer base. We have relationships with over 50 companies across a diverse set of services and offerings, including fifteen SIs with over 4,000 Duck Creek implementation staff who help to implement our solutions. We maintain key partnerships with leading SIs, such as Accenture, Capgemini and Cognizant, as well as leading technology companies, such as Microsoft and Salesforce, and Insurtech start-ups, such as Arity, Friss, SPLICE Software, and Cape Analytics. These partnerships have allowed us to further build on our deep domain expertise in the P&C insurance industry, extend the value of our solutions and provide our customers with additional end-to-end functionality.
Our subscription revenues have grown significantly in recent years, both in absolute terms and as a percentage of our business. For the fiscal year ended August 31, 2020, we generated subscription revenues of $84.0 million, an increase of 50% compared to subscription revenues of $55.9 million for the fiscal year ended August 31, 2019. We generated total revenues of $211.7 million for the fiscal year ended August 31, 2020, an increase of 24% compared to total revenues of $171.3 million for the fiscal year ended August 31, 2019. We have made significant investments in our software platform and sales and marketing organization and incurred net losses of $29.9 million and $16.9 million for the fiscal years ended August 31, 2020 and 2019, respectively. See “Item 7, Management’s Discussion and Analysis of Financial Condition and Results of Operations” for more information.
5
P&C Insurance Industry Overview
The P&C insurance industry is large, complex and highly regulated. In 2019, the industry serviced approximately $2.4 trillion of DWP spanning thousands of carriers globally. In addition to being one of the largest global industries, we believe it is also one of the most resilient. For a majority of businesses and consumers, insurance is a necessity rather than an amenity. As a result, overall spend on insurance products has continued to grow steadily over the long-term, even across periods of economic volatility. The P&C insurance industry is fragmented by the geographies in which carriers operate, the lines of insurance they underwrite, the customers they target, their distribution strategy and the overall amount of DWP that they generate. DWP, which quantifies the gross dollar value of total premiums paid to carriers by policyholders, is a key measurement of scale for the P&C insurance industry.
Carriers sell products that protect policyholders from losses to property, bodily injury, litigation and other liabilities. Large carriers often have global operations and offer a wide range of insurance products. They are also required to organize and report financial information by country, and sometimes by state or province within a country. This creates a large portfolio of insurance products with different regulatory requirements. Smaller carriers generally have a narrower geographic focus and/or offer a more limited set of insurance products but often still require sophisticated capabilities to manage their businesses. The Duck Creek Suite meets the most complex and sophisticated technology needs of the largest carriers, and can also be scaled to cost-effectively serve the needs of smaller carriers.
Core systems, including policy, billing and claims, power carriers’ critical operations. Core systems house the insurance product structure, such as rates, rules and forms, and generate data that allows the actuarial and underwriting staff of carriers to continuously modify and improve product offerings and provide more personalized customer service. They also manage the claims lifecycle, from first notice of loss to settlement. In addition, core systems integrate with agent and broker portals, operational data stores and data warehouses as well as business intelligence and analytics systems.
It is not uncommon for a single carrier to use multiple vendors (or internally developed applications) to provide core systems for different insurance lines or geographies, or for discrete core system processes (e.g., policy, billing, claims) within a single insurance line and geography. A carrier may use our software for certain parts of its business, and deploy solutions from different vendors for other parts of its business. As a result, we have a market opportunity to both achieve greater penetration within our existing customer base as well as increase our customer base by servicing new customers who are not currently using our products. The following diagram provides a framework for understanding the multifaceted processes of carriers:
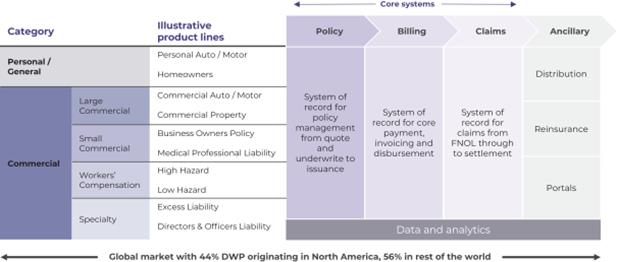
6
Carriers invest substantial time and resources to develop and maintain their information technology (“IT”) operations. We estimate that our total addressable market, representing the portion of this spending that is focused specifically on core system software, is approximately $5.5 billion in the United States and $15 billion globally. To estimate our total addressable market, we categorized the P&C insurance market into tiers based on DWP per carrier as reported by S&P Global, A.M. Best and Swiss Re, both within the United States and globally. We then estimated average price per DWP for our core systems solutions, accounting for tiered price discounts at different tiers, and multiplied the price per DWP by the total amount of DWP at each tier available both in the United States and globally.
Challenges Facing the P&C Insurance Industry and the Limitations of Legacy Systems
We believe reliance on legacy systems and other systems designed for on-premise environments limit carriers’ ability to respond to many of the significant challenges facing their industry, including:
|
|
• |
Heightened end-user expectations. Today’s end-users expect seamless and tailored experiences with every interaction, which has led to the increase in demand for digital distribution and servicing capabilities. For instance, personal and commercial insurance end-users expect improved digital experiences with real time multi-channel service. |
|
|
• |
Increased competition in the marketplace. Carriers are diversifying into new geographies and product lines to drive profitable DWP growth. In addition, new entrants, such as upstart ‘Insurtech’ companies, are seeking to disrupt the traditional insurance market with targeted technological innovations. In response to escalating competition, carriers are investing in new technology solutions to increase speed to market and reduce operating expenses. |
|
|
• |
New and evolving risks. Carriers are under pressure to offer new and more complex insurance products in order to address evolving use cases. Emerging risk categories, such as cybersecurity, terrorism and the sharing economy (e.g. use of automobiles for personal and commercial uses), are creating demand for new insurance products. These new and evolving risks require carriers to be increasingly agile in their product development. |
|
|
• |
Increased size of losses in assets and the number of catastrophic events. The increased intricacy of assets, such as automobiles that include full onboard computers, has increased the cost of repairs and claim sizes. Additionally, natural disasters with large scale catastrophic losses have become more frequent. More than ever, carriers need access to accurate and complete data about risk in order to minimize their loss. |
|
|
• |
The rise of the IoT. Carriers have predominately relied on traditional data sources for underwriting, pricing and claims handling. The rise of IoT devices, such as sensors, telematics devices and drones, is significantly increasing the amount of data available to carriers. This is enabling carriers to assess risk on a more granular level, identify losses faster, simplify claims processing and mitigate fraud. Taking advantage of the new volumes of data requires open and flexible core systems that allow carriers to move more quickly and make powerful data-driven decisions. |
|
|
• |
Emerging capabilities and advancing technologies. Carriers can better analyze risk through enhanced pricing models, artificial intelligence and machine learning technology. These emerging technologies offer carriers the opportunity to better understand and price risk in real time and a potential competitive advantage to realize the value from data science research. As a result, carriers are more aggressively investing in technology to keep up with innovations and integrations. |
These challenges are placing increased pressure on insurance carriers to improve consumer experience, business agility and speed to market. However, many carriers rely on legacy systems or alternatives designed for on-premise environments that are difficult to change, update or integrate without significant incremental custom-code development. Carriers relying upon these systems are generally unable to manage and analyze data at the pace required to effectively guide operational and risk decisions. These systems are difficult to update without significant IT spend and efforts, resulting in higher operating costs and slower speed to market for carriers.
7
We believe that carriers will increasingly look to adopt SaaS solutions, like Duck Creek OnDemand, that are designed to enhance their organizational agility, product innovation and consumer experience, allowing them to react quickly to evolving consumer preferences and efficiently capture market opportunity, while reducing their total cost of ownership. According to an October 2020 Novarica survey, more than 70% of insurance carriers plan to expand their migration of applications to the cloud in 2021.
The Duck Creek Approach
Our solutions provide us with a sustainable competitive advantage by helping our customers overcome the limitations of existing systems to meet the challenges of the current P&C insurance industry.
|
|
• |
Deep domain expertise. With more than twenty years of operating experience in the P&C insurance industry, we have developed deep industry-specific domain expertise. This enables us to offer a broad range of integrated solutions embedded with smart, intuitive pre-built functionality, designed to meet the precise use-case requirements of carriers. Our software incorporates and integrates product definition templates and other key industry content from relevant third-parties (such as Insurance Services Office, Inc. and National Council on Compensation Insurance) and regulatory bodies. Our in-depth understanding of the P&C insurance industry allows us to continue to address the various and evolving needs of carriers, thereby continuing to enhance the customer experience. |
|
|
• |
Comprehensive, future-ready offerings. Our comprehensive suite of enterprise-scale core system software is comprised of leading applications that are designed to meet the full range of our customers’ needs. We deliver upgrades that can be applied across our suite, improving common functionality across our customers’ systems. We continuously update industry content, allowing our customers to efficiently keep pace with market and regulatory changes. We also develop and maintain supplementary proprietary content that allows our customers to define, sell and service complex insurance product lines in a single integrated environment. |
|
|
• |
Scalability for all carriers. Our solutions are designed to meet the most complex and sophisticated technology needs of the largest carriers but can also be scaled to cost-effectively serve the needs of smaller carriers. |
|
|
• |
Low-code configurability. Using low-code tools designed for ease, speed and accuracy, both technical and non-technical users can tailor our solutions to meet their business needs. These intuitive tools allow our customers to create new products and make changes to existing products and related workflows without custom coding, accelerating their speed to market and improving productivity. We also offer application and configuration tools for technical users who design and manage business processes, user interfaces or web applications. |
8
|
|
• |
Open architecture. Our Duck Creek Anywhere integration strategy provides fast, easy access to the third-party data and services that customers need. This is executed through a pool of APIs, integration methodologies and partner connectors, all designed to enable our customers to efficiently leverage the services that best match their strategy. |
|
|
• |
Unique insights. We enable carriers to use data as a strategic asset. Using Duck Creek Insights, carriers are able to efficiently gather a consolidated picture of their business across internal and third-party data sources (including data lakes, legacy systems, IoT, policy, claims, etc.), deliver critical information to execute business decisions and employ new methods of automated decision making. |
|
|
• |
Mission-focused organization. We are driven by our mission to empower carriers to extend and improve the coverage they provide to their customers and to enhance the end-user experience. This allows carriers to reimagine their operations and shape the future of insurance to provide every person and enterprise protection from life’s uncertainties. Our strong culture and organizational ethos, coupled with a management team that has decades of leadership in the insurance software industry and is actively involved in the development of our products, drives our company to continue to innovate and deliver high-quality tools and services to our customers. |
Our Growth Strategy
We intend to extend our position as the leading provider of SaaS solutions for the core systems of the P&C insurance industry. The key components of our strategy are:
|
|
• |
Growing our customer base. We believe there is substantial opportunity to continue to grow our customer base across the P&C insurance industry. We have over 150 insurance customers, which represents a small portion of carriers both in North America and globally. We are investing in our sales and marketing force, specifically targeting key accounts and leveraging current customers as references. |
|
|
• |
Deepening relationships with our existing customers. We have deep engagement with our customers; on average, each of our customers uses 2.8 of our products, with each SaaS customer using 5.2 of our products. Since fiscal 2017, we have generated over 49% of our bookings from sales to existing customers. In addition to pursuing new customers, we intend to leverage our track record of success with our existing customers by selling additional products and targeting new opportunities within these carriers. Many customers purchase our solutions to address a specific portion of their core system needs. We believe we will have the opportunity to further transition the remaining components of their core systems to our SaaS solutions and sell the Duck Creek Suite to additional business units within our customer base. |
|
|
• |
Expanding our partner ecosystem. We have a large and expanding network of partnerships that is comprised of third-party solution partners who provide complementary capabilities as well as third-party SIs who provide implementation and other related services to our customers. These partners help us grow our business more efficiently by enhancing our sales force through co-marketing efforts and giving us scale to service our customer base. We intend to extend our network of partners who are able to drive meaningful interest in, and adoption of, our products. |
|
|
• |
Continuing to innovate and add new solutions. We have made significant investments in research and development and intend to continue to do so. We are focused on enhancing the functionality and breadth of our current solutions as well as developing and launching new products and tools to address the evolving needs of the P&C insurance industry. For example, we introduced Anywhere Managed Integrations, which allows our customers to seamlessly connect with numerous popular third-party providers’ data and service solutions, such as Lexis Nexis, Verisk and Hyland, without having to bear the technical burden and higher cost of individually integrating them. We currently offer our customers 35 unique Anywhere Managed Integrations. |
9
|
|
• |
Transitioning our term and perpetual license customers to SaaS. Some of our customers use versions of our solutions that were purchased via perpetual or term licenses and typically are installed on-premise. We will seek to transition these customers to our current SaaS solutions, which we believe will generate increased long-term economic value. |
|
|
• |
Pursuing acquisitions. We have acquired and successfully integrated several businesses complementary to our own to enhance our software and technology capabilities. We intend to continue to pursue targeted acquisitions that further complement our product portfolio or provide us access to new markets. We will carefully evaluate acquisition opportunities to assess whether they will be successful within our business model and whether they will meet our strategic objectives. We believe that through sustained execution of our disciplined and selective acquisition strategy, we will be able to effectively integrate targeted companies or assets into our model and grow our business. |
Our Products

10
Our customers purchase and deploy our solutions either individually for a specific P&C insurance process or as part of a combined suite to manage all aspects of the core P&C insurance lifecycle. Our portfolio includes the following core system products:
|
|
• |
Duck Creek Policy. Delivers a full lifecycle solution for the development of products and quoting, binding and servicing of policies across all channels, from agents and brokers to end-users. Duck Creek Policy maintains all of the coverages, limits and exclusions that are used to create specific products. It also serves as the system of record for any endorsements, additions or changes for policies in force. We also offer Underwriting Workbench, an add-on module that extends the underwriting functionality for Duck Creek Policy by providing the ability to group quotes and policies into accounts, giving a holistic view of information relevant to underwriting. |
|
|
• |
Duck Creek Billing. Provides core payment and invoicing capabilities (such as billing and collections, commission processing, disbursement management and general ledger capabilities) for all insurance lines and bill types. Our billing system allows carriers to implement unique business rules and handle flexible payment plans to meet customer expectations and address increasingly complex billing strategies and practices. Our technology and automation allows greater control over billing processes and better management of payment collections, which can improve our customers’ financial performance and customer service. |
|
|
• |
Duck Creek Claims. Supports the entire claims lifecycle from first notice of loss through investigation, payments, negotiations, reporting and closure. Effective claims management is integral to carriers’ profitability and has become increasingly complex, time-sensitive and data-dependent. Duck Creek Claims provides enhanced technology, enabling greater information sharing and collaboration and providing a configuration toolset that gives all users power over the application data, screens and processes. |
We also offer the following products to further enable our customers to meet the challenges and increasing demands of the P&C insurance industry:
|
|
• |
Duck Creek Rating. Duck Creek Rating can be implemented on a standalone basis or as a component of Duck Creek Policy. Duck Creek Rating gives carriers the ability to quickly develop new rates and models and delivers accurate quotes in real-time based on the complex rating algorithms that are unique to each carrier’s line of business. To remain competitive in today’s marketplace, insurers are re-evaluating the efficacy of their rating systems. Duck Creek Rating provides insurers with more granular risk segmentation and greater pricing precision. |
|
|
• |
Duck Creek Insights. Insurance analytics solution that allows carriers to gather and analyze data from internal and external sources and facilitates rapid analysis and reporting on a single system. Duck Creek Insights allows carriers to use data as a strategic asset in real time, empowering them to quickly capture and leverage data across and beyond their organizations, deliver leaders and business users crucial information needed to execute intelligent actions and employ new methods of automated decision-making. |
|
|
• |
Duck Creek Digital Engagement. Family of offerings designed to provide intuitive, multi-channel digital interactions between P&C insurers and their agents, brokers and policyholders. Duck Creek Digital Engagement offers online digital applications, including our Duck Creek Producer, AgencyPortal, Turnstile and AgencyConnect tools. |
|
|
• |
Duck Creek Distribution Management. Automates sales channel activities for agents and brokers, including producer onboarding, compliance and compensation management, thereby reducing time spent on manual processes. Duck Creek Distribution Management helps carriers stay compliant on distribution licensing and reporting while also providing insurers the ability to quickly and effectively change producer commission plans using simple configurations. |
|
|
• |
Duck Creek Reinsurance Management. Automates critical financial and administrative functions required by primary carriers, such as contracts, bills, recoveries and payables, to manage contractual relationships and provide settlement with reinsurance providers. Duck Creek Reinsurance Management supports all reinsurance structures, provides a full audit trail and analytics and produces statements, bordereaux, cover letters, footnotes and supporting details. |
|
|
• |
Duck Creek Industry Content. Provides pre-built content (including base business rules, product designs, rating algorithms, data capture screens and workflows) for specific insurance lines of business, such as commercial auto, inland marine and workers compensation. As part of Duck Creek Industry Content, we actively maintain and update approximately 700 web-based screens and 9,000 insurance forms across several industry standard bodies such as AAIS, ACORD, ISO and NCCI, which reduces the effort required by our customers to comply with these standards. |
11
Our Unique Architecture: the Duck Creek Platform
Every carrier takes a distinct approach to designing the policies that it offers and the core business processes that it employs to support them. How a carrier chooses to assemble and rate the underlying elements of an insurance policy (such as the weighting ascribed to roof age for pricing a homeowner’s policy) represents its unique content configurations. For many carriers, these configurations have been built up over years of investment and development and represent a key competitive differentiator. These nuanced distinctions around coverages, limitations, rating factors and the data used to determine risk appetite and pricing can be the difference between a successful carrier and one facing losses. Additionally, the distinctive routing and handling of service decisions or claims triage can impact the cost and profitability for a carrier.
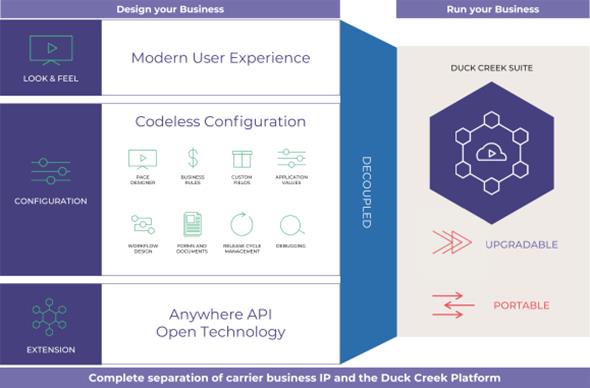
The Duck Creek Platform configuration layer serves as the development environment for carriers to create and modify insurance products (such as a commercial auto insurance policy), and the associated business rules and workflows that govern how insurance products are processed within a carrier:
|
|
• |
Product Design: the unique way in which carriers use individual data points (such as driving record and the make/model of a car) to design individual policies, including the coverages, limits, pricing and deductibles, such as vanishing deductibles or pay-per-mile auto policies. |
|
|
• |
Business Rules: carrier-specific criteria, including the types of policies it will write, channel and distribution rules (such as giving underwriting authority to distribution partners), and customer-specific claims handling. |
|
|
• |
Workflows: the ways in which an individual carrier manages its back office operations (such as the unique processes for handling different types of claims). |
12
The configuration layer is separated from our solutions and platform code, and this decoupling allows customers to maintain their unique configurations even as technology advances and we provide upgrades. This architecture provides our customers with several unique advantages:
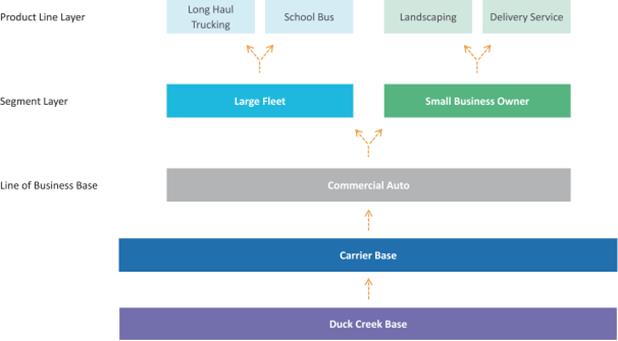
Faster innovation cycles enabled by the inheritance model. A defining characteristic of the Duck Creek Platform is our inheritance model that enables carriers to create and re-use insurance products and components of insurance products in layers which are linked together dynamically. This approach enables carriers to create new insurance products with speed and consistency.
Using the inheritance model, carriers can create a new insurance product simply by adding a new layer or tailoring a specific component in an existing layer using low-code configuration. This ensures consistency in operations across a carrier’s products using the same common base layer, while also allowing carriers to make changes efficiently across many insurance products by changing a single component within a common layer.
Importantly, our inheritance model enhances carriers’ agility and speed to market by accelerating new product development and allowing them to quickly capitalize on new and evolving opportunities while avoiding costly re-work required with legacy systems and alternative systems that were designed for on-premise environments. In addition to product designs, our inheritance model can also be applied to workflows and business rules.
Low-code configuration tools. Our low-code configuration tools allow technical and non-technical users to rapidly tailor our applications to meet their specific needs. These tools enable our customers to make meaningful changes to their products, processes or business rules with drag-and-drop authoring features and functionality without having to perform custom coding. This framework enables users to operate with speed while significantly reducing software development costs.
User Experience. Our platform enables carriers to build differentiated user experiences. Using the Duck Creek Design System along with low-code configuration tools, carriers can create experiences based on each user persona’s preferred engagement channel or deliver experiences designed using Duck Creek tools via third-party interfaces. The Duck Creek Design System encapsulates years of industry research into a best practice library that supports the needs of the various users of core systems – from agents to customer service professionals to policyholders and others.
13
Anywhere Integrations. In today’s insurance market, every transaction, workflow and decision must be informed by as much data and knowledge as possible and leverage services from internal and external sources to complete end-to-end processes. Openness to integration with third-party services, including the ability to work with the expanding world of Insurtech services and evolving artificial intelligence and machine learning technology, is critical to a carrier’s success. Through a robust set of REST APIs, integration accelerators and partner connectors, the open architecture of the Duck Creek Platform allows carriers to quickly and easily choose from the available services and provides them with the flexibility to leverage the tools and capabilities that best match their business strategy.
Our Customers
We have over 150 insurance customers, including the top five North American insurance carriers. Many of our customers serve multiple lines of insurance (including personal, commercial and specialty) and are leaders among each of these distinct categories. In addition, certain of our customers operate our solutions across multiple countries. Our customers, many of which we have had long-term relationships with, range from large national and multi-national carriers, such as Progressive, Liberty Mutual Insurance, AIG, The Hartford, Berkshire Hathaway Specialty Insurance, GEICO and Munich Re Specialty Insurance to regional carriers, such as UPC Insurance, Farm Bureau Financial, Avant Mutual, IAT Insurance Group and Mutual Benefit Group. Over 60 of our insurance customers use one or more of our SaaS products, including over 30 insurance customers that use our SaaS core system products.
When utilizing our solutions, products, and platform, many customers benefit from increased agility, greater flexibility, and overall lower total cost of ownership.
Sales and Marketing
We have made significant investments in our sales and marketing efforts. As of August 31, 2020, our sales and marketing organization included 160 employees. The majority of our sales and marketing strategies are focused on driving SaaS bookings growth. Our chief marketing officer and chief revenue officer, together with our sales, marketing and executive teams, promote our global brand by working to cultivate long-term relationships with current and prospective customers and other key industry influencers in each of the geographies in which we are active.
We sell our solutions and services through a direct sales team, comprised of our inside sales team, territory-based sales directors, and solutions consultants. Our inside sales team focuses on initiating contact with prospective customers and generating interest in cross-selling opportunities with existing customers. Our territory-based sales directors oversee sales to new or existing customers, and as part of the sales and marketing process, engage our solution consultants. Our solution consultants possess deep insurance domain expertise and are also experts in the technical aspects of our solutions and customer implementations. They engage with customers to understand their specific business needs and also present live demonstrations of our products that can be tailored to address those needs. Our solution consultants play a critical role in demonstrating the robust and complex features of our applications and helping carriers build an understanding of how to successfully integrate the Duck Creek Platform into their operations.
Our partnerships are also an important aspect of our sales and marketing strategy. We have a broad partner ecosystem that includes third-party solution partners who provide complementary capabilities as well as third-party SIs who provide implementation and other related services to our customers. These partnerships provide additional market validation to our offerings, enhance our sales force through co-marketing efforts and offer greater speed and efficiency of implementation capabilities and related services to our customers. We have relationships with over 50 different companies across a diverse set of services and offerings. These relationships include partnerships with leading SIs, such as Accenture, Capgemini, Cognizant and Mindtree. Over the past three fiscal years, we have grown the number of professionals in Duck Creek practices within these delivery partners from approximately 700 to over 3,000. We also maintain relationships with leading technology companies and solution providers, such as Microsoft, Salesforce, Hyland, Verisk and Lexis Nexis, and Insurtech start-ups, such as Arity, Friss, SPLICE Software, and Cape Analytics. These partnerships enhance the value of our solutions and provide our customers with additional end-to-end functionality.
14
We engage in a variety of traditional and online marketing activities designed to provide sales support, build brand recognition and enhance our reputation as an industry leader. Our marketing efforts help articulate our vision of how Duck Creek can shape the future of P&C insurance with affordable, flexible and open technology. Through our integrated marketing strategy we drive demand and brand recognition by leveraging digital advertising, search engine optimization, webinars, social media, thought leadership and various event-based marketing. We participate at industry conferences, are published frequently in the industry press and have active relationships with the major industry analysts. Additionally, we host an annual user conference, Formation, where our customers both participate in and deliver presentations on a wide range of Duck Creek and insurance technology topics. Formation facilitates discussions among industry participants and serves as a great resource for tips on using our platform and industry best practices. We also invite potential customers and partners to Formation as we believe customer references are a key component of driving new sales. We believe we are able to capitalize on the resulting network effect as we build goodwill through customer reviews and testimonials, word-of-mouth referrals and references from other industry participants.
Research and Development
Our research and development efforts focus on enhancing our offerings, in particular our SaaS solutions, to help our customers improve their operations, drive greater digital engagement with their customers, agents and brokers and gather, store and analyze data to improve business decisions. As of August 31, 2020, our research and development team was comprised of 416 employees, including product management and engineering personnel.
We make meaningful investments in developing the product definitions and integrations necessary for our solutions to meet the market requirements of each P&C insurance line-of-business and country or state in which we sell our solutions. This market-segment specific functionality must be updated regularly in order to stay current with regulatory changes in each market. We rely heavily on input from our customers in developing products that meet their needs. Our product management team leads our research and market validation efforts and provides guidance to management and our engineering team based on their collective domain expertise and in-depth knowledge and understanding of our customers, as well as their expertise in general technology advancements beyond the P&C insurance industry. As a result, our product management team engages regularly with customers, partners and other industry participants, as well as our customer service, sales and marketing and research and development organizations. Our product management team manages our development projects generally and serves to align separate functions within the company with a single strategic vision.
Our product and engineering teams are responsible for the design, development and testing of our products. They work together to launch new products and functionality as well as continuously enhance and support our existing products. These teams include both technology and insurance experts. We leverage a collaborative, team-based and test-driven approach to engineering so we can release new code frequently. We believe that the pace of change in the P&C insurance industry requires a steady stream of the continuous delivery of upgrades to our software solutions, which incrementally improve the user experience, core processes and insurance products.
SaaS Operations, Security and Compliance
We invest significantly in our Duck Creek OnDemand operations team, which is one of the fastest growing elements of our business and is responsible for all aspects of service delivery for Duck Creek OnDemand. This includes the full management of the network and cloud infrastructure that supports our applications as well as the day-to-day management to ensure the availability of applications, including through triage and ticket management to support our customers. In addition, our security team, led by the Chief Information Security Officer, manages both security operations as well as policies to ensure security is proactively built into our products and services. Our security and operations teams are based in our state-of-the-art SaaS Operations Center in Rosemont, Illinois, with additional team members located in geographies that enable around-the-clock coverage for critical customer operations. In addition to the investments we make in our security and operations teams, we continue to build on our technology tools and strong partner relationships, including our investments in best-in-class security and monitoring tools and our unique ongoing partnership with Microsoft’s Azure team, which helps us to provide for the smooth and efficient operation of Duck Creek OnDemand.
15
The market for core system software for the P&C insurance industry is highly competitive and fragmented. Increased spending by carriers on software applications and the emergence of new platforms that have expanded from the modernization of core systems to include new digital engagement and data and analytics solutions have generated significant interest among investors and entrepreneurs. Increased capital allows market participants to adopt more aggressive go-to-market strategies, improve existing products, introduce new ones and consolidate with other vendors. This market is also subject to changing technology preferences, shifting customer needs and the introduction of new models, products and services, which fosters a highly competitive market. Additionally, existing relationships between potential customers and our competitors may make selling our solutions to such customers challenging due to the high costs and risk of business interruption associated with switching providers. Our current and future competitors vary in size and in the breadth and scope of the products and services they offer, and may be larger, have longer operating histories or have greater available financial, technical, sales, marketing and other resources than we do, as well as larger installed customer bases. Our current principal competitors include, but are not limited to:
|
|
• |
Internally Developed Technology and Software: Many large insurance companies have sufficient IT resources to develop and maintain proprietary internal systems, or to consider developing new custom systems. Often these in-house technology programs will be supported by large scale consulting firms such as IBM, Wipro, Cognizant and others. |
|
|
• |
P&C Insurance Software Vendors: Vendors such as Guidewire, Insurity, Majesco, Sapiens and others provide software products that are specifically designed to meet the needs of carriers. |
|
|
• |
Horizontal Software Vendors: Vendors such as Oracle, SAP, Pegasystems and others provide software that can be customized to address the needs of carriers. |
|
|
• |
IT Services Firms: Firms such as DXC Technology, NTT Data and Tata Consultancy Services Limited offer software and systems that can be developed for the P&C insurance industry. |
We believe the principal competitive factors in our market include, but are not limited to:
|
|
• |
breadth and depth of product functionality; |
|
|
• |
line of business support that fits the needs of each element of a carrier’s business; |
|
|
• |
total cost of ownership; |
|
|
• |
domain expertise in the P&C insurance industry; |
|
|
• |
scalability, reliability and uptime of applications; |
|
|
• |
quality of implementation and collaborative customer service, including service and support staff for users; |
|
|
• |
modern and intuitive technology and user experience; |
|
|
• |
brand awareness, reputation and customer references; and |
|
|
• |
integration with a wide variety of third-party applications and systems. |
Our ability to remain competitive in the geographies in which we are active will depend to a great extent upon our ongoing performance in these areas.
Intellectual Property
The software industry is characterized by the existence of a large number of patents and frequent claims and related litigation regarding patent and other intellectual property rights. Our success and ability to compete depend in part upon our ability to protect our proprietary technology and to establish and adequately protect our intellectual property rights. To accomplish these objectives, we rely on a combination of patent, trademark, copyright and trade secret laws in the United States and other jurisdictions, as well as license agreements and other contractual protections.
16
As of August 31, 2020, we owned 12 issued U.S. patents, one of which expired in September 2020. Our remaining 11 issued U.S. patents are scheduled to expire between October 2021 and January 2032. The competitive advantages from the rights granted under our patents and the exact protection these patents provide cannot be predicted with certainty. Our existing patents, and any future patents, may be contested, circumvented or invalidated, and we may not be able to prevent third parties from infringing these patents. We anticipate filing additional patent applications to protect our rights in the future to the extent it would be beneficial and cost effective.
We also rely on certain registered and unregistered trademarks to protect our brand. We have registered the trademarks “Duck Creek” and related design marks in the United States and certain other jurisdictions. In addition, there could be potential trade name or trademark infringement claims brought by owners of other registered tradenames or trademarks that incorporate variations of our tradenames or trademarks. Any claims or customer confusion related to our tradenames or trademarks could damage our reputation and brand and substantially harm our business and results of operations.
In addition, we seek to protect our intellectual property rights by entering into confidentiality and invention assignment agreements with our employees and contractors, and confidentiality agreements with third parties. Despite these precautions, it may be possible for unauthorized parties to copy or use our proprietary information to create products or services that compete with ours. Policing unauthorized use of our technology and intellectual property rights can be difficult. The enforcement of our intellectual property rights depends on any legal actions, which can be costly and time consuming, against infringers being successful, which may not always be the case even when our rights have been infringed.
Employees
As of August 31, 2020, we had 1,405 employees and 58 contingent employees. None of our employees are represented by a labor union or covered by a collective bargaining agreement. We consider our relationship with our employees to be good and we focus heavily on employee engagement.
Regulations
The legal environment of cloud-based software businesses is evolving in the United States and other jurisdictions, and we are subject to a variety of laws and regulations in the United States and abroad that involve matters central to our business. Many of these laws and regulations are still evolving and being tested in courts, and could be interpreted in ways that could harm our business. These may involve privacy, data protection and personal information, content, intellectual property, data security and data retention and deletion. In particular, we are subject to federal, state and foreign laws regarding privacy and protection of people’s data. Foreign data protection, privacy, content and other laws and regulations can impose different obligations or be more restrictive than those in the United States. United States federal and state and foreign laws and regulations, which in some cases can be enforced by private parties in addition to government entities, are constantly evolving and can be subject to significant change. As a result, the application, interpretation, and enforcement of these laws and regulations are often uncertain, particularly in the new and evolving industry in which we operate, and may be interpreted and applied inconsistently from country to country and inconsistently with our current policies and practices.
Our customers upload to and store customer data in our cloud-based platform. This presents legal challenges to our business and operations, such as consumer privacy rights or intellectual property rights. Both in the United States and internationally, we must monitor and comply with a wide variety of laws and regulations regarding the data stored and processed on our cloud-based platform as well as in the operation of our business. For example, the European Union’s GDPR, which became effective on May 25, 2018, and has resulted and will continue to result in significantly greater compliance burdens and costs for companies with users and operations in the European Union. Under GDPR, fines of up to 20 million Euros or up to 4% of the annual global revenues of the infringer, whichever is greater, can be imposed for violations. The GDPR imposes several stringent requirements for controllers and processors of personal data and could make it more difficult and/or more costly for us to use and share personal data. Further, Brexit has created uncertainty with regard to the regulation of data protection in the United Kingdom. In particular, it is unclear whether the United Kingdom will enact data protection laws or regulations designed to be consistent with GDPR and how data transfers to and from the United Kingdom will be regulated. In addition, the California Consumer Privacy Act (“CCPA”), which went into effect on January 1, 2020, limits how we may collect
17
and use personal data. The impact of this law on us and others in our industry is and will remain unclear until additional regulations are issued. The effects of the CCPA are potentially far-reaching, however, and may require us to modify our data processing practices and policies and incur substantial compliance-related costs and expenses. Non-compliance with these laws could result in penalties or significant legal liability. We have invested, and continue to invest, human and technology resources into our GDPR compliance efforts and our data privacy compliance efforts generally.
COVID-19 Update
In December 2019, a novel strain of coronavirus (“COVID-19”) was reported to have surfaced in Wuhan, China. In January 2020, COVID-19 spread to other countries, including the United States and others in which we operate, and efforts to contain the spread of COVID-19 intensified. In March 2020, the World Health Organization declared COVID-19 a global pandemic. The outbreak and certain preventative or protective actions that governments, businesses and individuals have taken in respect of COVID-19 have resulted in extended global business disruptions. The severity and duration of these business disruptions remain largely fluid and ultimately will depend on many factors, including the speed and effectiveness of containment efforts throughout the world.
In March 2020, we implemented various measures to ensure the safety of our employees, customers and suppliers. Over a two-day period, we shifted 100% of our employee base to work from home, which continues to be in effect. Additionally, our operational model has enabled us to minimize the impact to sales productivity or delivery of our solutions to customers to date. Since shifting to working remotely, we have successfully completed several product live launches and initiated new projects applying a fully virtual model.
While the full impact of COVID-19 remains unknown and COVID-19 has impacted certain companies’ decisions regarding technology spending, we have not experienced a material disruption on our bookings or sales to date. For the fiscal year ended August 31, 2020, we generated growth of 24% in total revenue, 50% in subscription revenue and 85% in SaaS ARR (as defined below) as compared to the fiscal year ended August 31, 2019. Our ability to grow revenue within our existing customer accounts has remained strong, with a SaaS Net Dollar Retention Rate (as defined below) of 116.8% for the quarter ended August 31, 2020. Additionally, we generated net cash provided by operating activities of $25.7 million and Free Cash Flow (as defined below) of $18.9 million for the fiscal year ended August 31, 2020, compared to $14.8 million and $6.6 million, respectively, for the fiscal year ended August 31, 2019. However, due to COVID-19 we delayed certain of our planned investments, primarily related to our international expansion initiatives.
As of August 31, 2020, we had $418.9 million of liquidity, including $389.9 million in cash and cash equivalents and $29.0 million of availability under our revolving credit facility.
The magnitude of the effect of COVID-19 on our business will depend, in part, on the length and severity of the restrictions and other limitations on our ability to conduct our business in the ordinary course. The longer the pandemic continues or resurges, the more severe the impacts described above may be on our business. In addition, because COVID-19 did not begin to affect our financial results until after the beginning of the third quarter of fiscal 2020, its impact on our results for the six months ended August 31, 2020 may not be indicative of its impact on our results for future periods. The extent, length and consequences of the pandemic, including our customers’ purchasing decisions and other reactions, are uncertain and impossible to predict, but could be material. Any reopenings followed by subsequent restrictions or closings could also have a material impact on us. See “Risk Factors—Risks Related to Our Business and Industry—Public health outbreaks, epidemics or pandemics, including the global COVID-19 outbreak, could harm our business, results of operations, and financial condition.”
Corporate Information
Duck Creek Technologies, Inc. was incorporated in Delaware in November 2019. In August 2020, we completed the initial public offering of our common stock (the “IPO”) and our common stock trades on the Nasdaq Global Select
18
Market (“Nasdaq”) under the symbol “DCT.” Our principal executive offices are located at 22 Boston Wharf Road, Floor 10, Boston, MA 02210, and our telephone number is (888) 724-3509.
Our website address is www.DuckCreek.com. We make available on or through our website certain reports and amendments to those reports that we file with or furnish to the Securities and Exchange Commission (“SEC”) in accordance with the Securities Exchange Act of 1934, as amended (Exchange Act). These include our annual reports on Form 10-K, our quarterly reports on Form 10-Q, and our current reports on Form 8-K, and amendments to those reports filed or furnished pursuant to Section 13(a) or 15(d) of Securities Exchange Act of 1934, as amended (“the Exchange Act”)
Our business involves significant risks, some of which are set forth below. You should carefully consider the risks described below together with other information set forth in this Annual Report on Form 10-K and in our other public filings. If any of the following risks or uncertainties actually occur, our business, financial condition, prospects, results of operations and cash flow could be materially and adversely affected. In that case, the market price of our common stock could decline. The risks discussed below are not the only risks we face. Additional risks or uncertainties not currently known to us, or that we currently deem immaterial, may also have a material adverse effect on our business, financial condition, prospects, results of operations or cash flows, as well as the market price of our securities. We cannot assure you that any of the events discussed in the risk factors below will not occur.
Risks Related to Our Business and Industry
Public health outbreaks, epidemics or pandemics, including the global COVID-19 outbreak, could harm our business, results of operations, and financial condition.
Public health outbreaks, epidemics or pandemics, could materially and adversely impact our business. For example, in March 2020, the World Health Organization declared the COVID-19 virus outbreak a global pandemic, and numerous countries, including the United States, have declared national emergencies with respect to COVID-19. The outbreak and certain intensified preventative or protective public health measures undertaken by governments, businesses and individuals to contain the spread of COVID-19, including orders to shelter-in-place and restrictions on travel and permitted business operations, have, and continue to, result in global business disruptions that adversely affect workforces, organizations, economies, and financial markets globally, leading to an economic downturn and increased market volatility. The ongoing outbreak has disrupted, and will continue to disrupt, the normal operations of many businesses, including our customers, as well as the ability of our technical support teams and sales force to travel to existing customers and new business prospects, and the operations of our customers and SI partners. We have also limited our in-person marketing activities and expect this will continue for the foreseeable future. For example, we converted our 2020 user conference, Formation, into an online forum called vFormation. While our business has not, to date, experienced a material disruption in bookings or sales from the COVID-19 pandemic, a continued or intensifying outbreak over the short- or medium-term could result in delays in services delivery, delays in implementations, delays in critical development and commercialization activities, including delays in the introduction of new products and services and further international expansion, interruptions in sales and marketing activity, furloughs of employees and disruptions of supply chains. Additionally, we may incur increased costs in the future when employees return to work and we implement measures to ensure their safety.
The related impact on the global economy could also decrease technology spending by our existing and prospective customers and adversely affect their demand for our solutions. Further, our sales and implementation cycles could increase resulting in providing contract terms more favorable to customers and a potentially longer delay between incurring operating expenses and the generation of corresponding revenue or in difficulty in accurately predicting our financial forecasts. Additionally, the economic downturn and rising unemployment rates resulting from COVID-19 have the potential to significantly reduce individual and business disposable income and depress consumer confidence, which could limit the ability or willingness of some consumers to obtain and pay for insurance products in both the short- and medium-term, which may negatively impact the ability of our customers to pay for our services or require such customers to request amended payment terms for their outstanding invoices. Furthermore, we are unable to predict the impact that COVID-19 may have going forward on the business, results of operations or financial position of any of our major customers, which could impact each customer to varying
19
degrees and at different times and could ultimately impact our own financial performance. Certain of our competitors may also be better equipped to weather the impact of COVID-19 both domestically and abroad and better able to address changes in customer demand.
The outbreak also presents operational challenges as our workforce is currently working remotely and assisting customers who are also generally working remotely. We have also suspended international and domestic travel. We depend on key officers and employees; should any of them become ill and unable to work, it could impact our productivity and business continuity. Although we continue to monitor the situation and may adjust our current policies as more information and public health guidance become available, it is not possible for us to predict the duration or magnitude of these business disruptions and the adverse results of the outbreak, which ultimately will depend on many factors, including the speed and effectiveness of containment efforts throughout the world. These disruptions could negatively affect our operations or internal controls over financial reporting and may require us to implement new processes, procedures and controls to respond to further changes in our business environment.
Additionally, COVID-19 could increase the magnitude of many of the other risks described herein and have other adverse effects on our operations that we are not currently able to predict. For example, we have, and may continue to delay or limit our internal strategies in the short- and medium-term by, for example, redirecting significant resources and management attention away from implementing our strategic priorities or executing opportunistic corporate development transactions (including our international expansion).
The magnitude of the effect of COVID-19 on our business will depend, in part, on the length and severity of the restrictions and other limitations on our ability to conduct our business in the ordinary course. The longer the pandemic continues or resurges, the more severe the impacts described above will be on our business. The extent, length and consequences of the pandemic on our business, including our customers’ purchasing decisions and other reactions, are uncertain and impossible to predict but could be material. Any reopenings followed by subsequent restrictions or closing could have a material impact on us. COVID-19 and other similar outbreaks, epidemics or pandemics could have a material adverse effect on our business, financial condition, results of operations, cash flows and prospects and could cause significant volatility in the trading prices of our common stock as a result of any of the risks described above and other risks that we are not able to predict.
To the extent the COVID-19 pandemic adversely affects our business and financial results, it may also have the effect of heightening many of the other risks described in this “Risk Factors” section, such as those relating to our liquidity.
We have a history of losses and may not achieve or maintain profitability in the future.
We have incurred net losses of $29.9 million, $16.9 million, and $7.8 million in fiscal 2020, 2019 and 2018, respectively. We must generate and sustain higher revenue levels in future periods to become profitable, and, even if we do, we may not be able to maintain or increase our profitability. We expect to continue to incur losses for the foreseeable future as we expend substantial financial and other resources on, among other things:
|
|
• |
sales and marketing, including expanding our direct sales team and online marketing programs, particularly for larger customers; |
|
|
• |
investments in the development of new products and new features for, and enhancements of, our existing product portfolio; |
|
|
• |
expansion of our operations and infrastructure organically and through acquisitions and strategic partnerships, both domestically and internationally; and |
|
|
• |
general administration, including legal, risk management, accounting, and other expenses related to being a public company. |
These expenditures may not result in additional revenue or the growth of our business. Accordingly, we may not be able to generate sufficient revenue to offset our expected cost increases and achieve and sustain profitability. If we fail to achieve and sustain profitability, the market price of our common stock could decline.
20
Changes in our product revenue mix and gross margins as we continue to focus on sales of our SaaS solutions will cause fluctuations in our results of operations and cash flows between periods, which may cause our stock price to decline.
We have recently experienced strong growth in subscriptions to our SaaS solutions and, in particular, our subscription revenue has continued to increase in comparison with our license revenue for our term and perpetual licenses. Our subscription revenue grew 50% from $55.9 million to $84.0 million in fiscal 2020, 32% in 2019 from $42.5 million in fiscal 2018, and 27% from $33.5 million in fiscal 2017.
Our subscription revenue is recognized ratably over the term of the contract, unlike the license revenue from our term and perpetual licenses, which is typically recognized upfront. We expect the portion of our subscription revenue will grow as we continue to focus on driving sales of our SaaS solutions to new customers and existing term and perpetual license customers, as well as to our existing customers with SaaS arrangements who do not utilize the full Duck Creek Suite. As a result, our product revenue mix has changed, and will continue to change over time as the portion of upfront license revenue decreases and the portion of ratable subscription revenue increases, which may make our results in any one period difficult to compare to any other period. This change of revenue mix could adversely impact our gross and operating margins. For instance, as we continue to increase our focus on SaaS customers, we expect our overall gross margin percentage to decrease due to our subscription gross margin percentages being lower than our license gross margin percentages.
Additionally, the growth of our business is dependent on winning a relatively small number of higher value contracts, and our quarterly results of operations may be volatile because we cannot control in which quarter, if any, a new contract will be signed in a given year, particularly in the current economic climate. Our revenue may also fluctuate versus comparable prior periods or prior quarters within the same fiscal year based on the terms of the agreements and the timing of new orders executed in the quarter. In addition, as subscription revenue is recognized ratably over the term of the contract, most of the subscription revenue we report in each quarter is the result of SaaS arrangements entered into during previous quarters. Consequently, a decline in new or renewed subscriptions in any one quarter will not be fully reflected in our revenue results for that quarter. Any such decline, however, will negatively affect our revenue in future quarters.
These factors may cause significant fluctuations in our results of operations and cash flows, may make it challenging for an investor to predict our performance and may prevent us from meeting or exceeding the expectations of research analysts or investors, which in turn may cause our stock price to decline.
We have relied and expect to continue to rely on orders from a relatively small number of customers in the P&C insurance industry for a substantial portion of our revenue, and the loss of any of these customers or a reduction in revenue from any of these customers would significantly harm our business, results of operations and financial condition.
Our revenue is dependent on orders from customers in the P&C insurance industry and a relatively small number of customers have historically accounted for a significant portion of our revenue. We have over 150 insurance customers. We had one customer that accounted for approximately 10% of our total revenue in fiscal 2020. We also assess customer concentration by combining customers that are under common control and considering them as one entity. On this basis we had one consolidated entity that represented in excess of 11% of our total revenue in fiscal 2020, a large multinational corporation that does business with us through multiple subsidiaries at approximately 11%. While we expect this reliance to decrease over time, we expect that we will continue to depend upon a relatively small number of customers for a significant portion of our revenue for the foreseeable future. As a result, if we fail to successfully sell our solutions and professional services to one or more of these anticipated customers in any particular period or fail to identify additional potential customers or such customers purchase fewer of our solutions or professional services, defer or cancel orders, fail to renew their subscription arrangements or license agreements or otherwise terminate their relationship with us, our business, results of operations and financial condition would be harmed. Additionally, if our sales to one or more of these anticipated customers in any particular period is for SaaS arrangements or maintenance and support and are ratable in nature, or if we fail to achieve the required performance criteria or service levels for one or more of these relatively small number of customers, our quarterly and annual results of operations may fluctuate significantly. Some of our SaaS arrangements and license agreements with our customers can be canceled and not renewed by the
21
customer after the expiration of the SaaS or license term, as applicable, on relatively short notice. Moreover, one of our SaaS customers has a right to terminate its contract with us at its discretion by providing notice and paying a termination fee based on a proportion of the remaining SaaS fees otherwise payable by that customer for the balance of the committed term of its contract, while one of our other SaaS customers has a right to terminate its contract with us at its discretion only during the first year of the committed term of its contract by providing notice and paying a termination fee equal to the SaaS fees otherwise payable by that customer for the balance of the first year of the committed term of its contract. In addition, another SaaS customer has the ability to elect during the last year of the committed term of its contract to discontinue its access to certain SaaS capabilities made available to it under such contract by providing notice and receiving up to an approximately 7% reduction in annual SaaS fees that would have otherwise been payable by that customer during the last year of the committed term of its contract. The loss of business from any of our significant customers, including from cancellations, could seriously harm our business, results of operations and financial condition.
Our large customers have substantial negotiating leverage, which may require that we agree to terms and conditions that result in increased cost of sales, decreased revenue and lower average selling prices and gross margin percentages, all of which would harm our results of operations.
Some of our customers include the world’s largest carriers. These customers have significant bargaining power when negotiating new SaaS arrangements or term licenses, or renewals of existing agreements, and have the ability to buy similar solutions from other vendors or develop such systems internally. These customers have and may continue to seek advantageous pricing and other commercial terms and may require us to develop additional features in the solutions we sell to them. We have been required to, and may continue to be required to, reduce the average selling price of our solutions in response to these pressures. These customers may also require us to implement their purchased products on an expedited basis. If we are unable to implement our products to our customer’s satisfaction or avoid reducing our average selling prices and gross margin percentages, our results of operations would be harmed.
Our business depends on customers renewing and expanding their SaaS arrangements, term licenses or maintenance and support arrangements for our solutions. A decline in our customer renewals and expansions could harm our future results of operations.
Our customers have no obligation to renew their SaaS arrangements, term licenses or maintenance and support arrangements after they expire, and these arrangements or licenses may not be renewed on the same or more favorable terms. Moreover, one of our SaaS customers has a right to terminate its contract with us at its discretion by providing notice and paying a termination fee based on a proportion of the remaining SaaS fees otherwise payable by that customer for the balance of the committed term of its contract, while one of our other SaaS customers has a right to terminate its contract with us at its discretion only during the first year of the committed term of its contract by providing notice and paying a termination fee equal to the SaaS fees otherwise payable by that customer for the balance of the first year of the committed term of its contract. In addition, another SaaS customer has the ability to elect during the last year of the committed term of its contract to discontinue its access to certain SaaS capabilities made available to it under such contract by providing notice and receiving up to an approximately 7% reduction in annual SaaS service fees that would have otherwise been payable by that customer during the last year of the committed term of its contract. We have limited historical data with respect to rates of customer renewals, upgrades and expansions of our SaaS solutions, so we may not accurately predict future trends in customer renewals. In addition, our term and perpetual license customers have no obligation to renew their maintenance and support arrangements after the expiration of the initial contractual period, which has historically been for three to six years, and more recently has been reduced to two years. Our customers’ renewal rates may fluctuate or decline because of several factors, including their satisfaction or dissatisfaction with our solutions and professional services, the prices of our solutions and professional services, the prices of solutions and professional services offered by our competitors or reductions in our customers’ spending levels due to the macroeconomic environment or other factors. If our customers do not renew their SaaS arrangements or term licenses for our solutions or renew on less favorable terms, our revenue may decline or grow more slowly than expected and our profitability will be harmed.
22
Our growth strategy is focused on continuing to develop our SaaS solutions, which may increase our costs. In addition, if we are unable to successfully grow our SaaS business or navigate our growth strategy, our reputation and results of operations could be harmed.
To address demand trends in the P&C insurance industry, we have focused on and plan to continue focusing on the growth and expansion of our SaaS business. This growth strategy has required and will continue to require a considerable investment of technical, financial and sales resources. We have no assurance that such investments will result in an increase in subscription revenue or that we will be able to scale such investments efficiently, or at all, to meet customer demand and expectations. Our focus on our SaaS business may increase our costs, such as the cost of public infrastructure, in any given period and may be difficult to predict over time. Further, we have experienced and may continue to experience reduced term or perpetual license revenue as we increasingly focus on our SaaS business.
Our SaaS arrangements also contain service level agreement clauses, for matters such as failing to meet stipulated service levels, which represent new risks we are not accustomed to managing. Should these penalties be triggered, our results of operations may be adversely affected. Furthermore, we may assume greater responsibilities for implementation related services as we continue to focus on our SaaS business. As a result, we may face risks associated with new and complex implementations, the cost of which may differ from original estimates. The consequences in such circumstances could include: monetary credits for current or future service engagements, reduced fees for additional product sales, cancellations of planned purchases and a customer’s refusal to pay their contractually-obligated SaaS or professional service fees. Any factor adversely affecting sales of our SaaS solutions, including application release cycles, delays or failures in new product functionality, market acceptance, product competition, performance and reliability, reputation, price competition and economic and market conditions, would have a material adverse effect on our business, financial condition and results of operations. Additionally, the entry into new markets or the introduction of new features, functionality or applications beyond our current markets and functionality may not be successful. If we are unable to successfully grow our SaaS business and navigate our growth strategy in light of the foregoing uncertainties, our reputation could suffer and our results of operations would be harmed, which may cause our stock price to decline.
Failure to manage our expanding operations effectively could harm our business.
We have expanded our operations and expect to continue to do so, including the number of employees and the locations and scope of our operations. Additionally, the COVID-19 pandemic and related shelter in-place orders have resulted in our employees and contractors working from home, bringing new challenges to managing our business and work force, which we generally expect to continue for the foreseeable future. This expansion and changing work environment has placed, and will continue to place, a significant strain on our operational and financial resources and our personnel. We will also need to identify, add and retain additional qualified personnel across our operations. To manage our anticipated future operational expansion effectively, we must continue to maintain and expect to enhance our IT infrastructure, financial and accounting systems and controls and manage expanded operations and employees in geographically distributed locations. Our growth could require significant capital expenditures and may divert financial resources from other projects, such as the development of new solutions. If we increase the size of our organization without experiencing an increase in sales of our solutions, we will experience reductions in our gross and operating margins and net income. We may also deem it advisable in the near-term or later to downsize certain of our offices in order to reduce costs, which may cause us to incur related charges. If we are unable to effectively manage our expanding operations or manage the increase in remote employees, our expenses may increase more than expected, our revenue could decline or grow more slowly than expected and we may be unable to implement our business strategy.
If we are unable to develop or sell our solutions into new markets or to further penetrate existing markets, our revenue will not grow as expected.
Our ability to increase revenue will depend, in large part, on our ability to further penetrate our existing markets and to attract new customers, as well as our ability to transition our existing term and perpetual license customers to our SaaS solutions and to increase sales from existing customers who do not utilize the full Duck Creek Suite. The success of any enhancement or new solution or service depends on several factors, including the timely completion, introduction and market acceptance of enhanced or new solutions, adaptation to new industry standards
23
and technological changes, the ability to maintain and to develop relationships with third parties and the ability to attract, retain and effectively train sales and marketing personnel. Any new solutions we develop or acquire may not be introduced in a timely or cost-effective manner and may not achieve the market acceptance necessary to generate significant revenue. Any new industry standards or practices that emerge, or any introduction by competitors of new solutions embodying new services or technologies, may cause our solutions to become obsolete. Any new markets in which we attempt to sell our solutions, including new countries or regions, may not be receptive or implementation may be delayed due to COVID-19. Additionally, any expansion into new markets will require commensurate ongoing expansion of our monitoring of local laws and regulations, which increases our costs as well as the risk of the solution not incorporating in a timely fashion or at all due to a failure of the solution to comply with such local laws or regulations. Our ability to further penetrate our existing markets depends on the quality of our solutions and our ability to design our solutions to meet changing consumer demands and industry standards, as well as our ability to assure that our customers will be satisfied with our existing and new solutions. If we are unable to sell our solutions into new markets or to further penetrate existing markets, or to increase sales from existing customers by selling them additional software and services, our revenue will not grow as expected, which would have a material adverse effect on our business, financial condition and results of operations.
Failure of any of our established solutions to satisfy customer demands or to maintain market acceptance would harm our business, results of operations, financial condition and growth prospects.
We derive a significant majority of our revenue and cash flows from our established solutions, including Duck Creek Policy, Duck Creek Rating, Duck Creek Billing and Duck Creek Claims. We expect to continue to derive a substantial portion of our revenue from these sources. As such, continued market acceptance of these solutions is critical to our growth and success. Demand for our solutions is affected by a number of factors, some of which are beyond our control, including the successful implementation of our solutions, the timing of development and release of new solutions by us and our competitors, technological advances which reduce the appeal of our solutions, changes in regulations that our customers must comply with in the jurisdictions in which they operate and the growth or contraction in the worldwide market for technological solutions for the P&C insurance industry. If we are unable to continue to meet customer demands, to achieve and maintain a technological advantage over competitors, or to maintain market acceptance of our solutions, our business, results of operations, financial condition and growth prospects would be adversely affected.
If the market for enterprise cloud computing, including SaaS solutions, develops slower than we expect or declines, it could have a material adverse effect on our business, financial condition and results of operations.
While the market for cloud computing, including SaaS solutions, for the P&C insurance industry is growing, it is not as mature as the market for legacy on-premise applications. It is uncertain whether cloud computing, including SaaS solutions, will achieve and sustain high levels of customer demand and market acceptance, particularly in our industry. Our success substantially depends on the adoption of cloud computing and SaaS solutions in the P&C insurance industry, which may be affected by, among other things, the widespread acceptance of cloud computing and SaaS solutions in other industries and in general. Market acceptance of our SaaS solutions may be affected by a variety of factors, including but not limited to: price, security, reliability, performance, customer preference, public concerns regarding privacy and the enactment of restrictive laws or regulations. Many carriers have invested substantial personnel and financial resources to integrate traditional enterprise software into their businesses and therefore may be reluctant or unwilling to migrate to cloud computing. It is difficult to predict customer adoption rates and demand for our SaaS solutions, the future growth rate and size of the cloud computing market or the entry of other competitive applications. As our business practices in this area continue to develop and evolve over time, we may be required to revise the SaaS solutions we have developed, which may result in revised terms and conditions that impact how we recognize revenue and the costs and risks associated with these offerings. Whether our product development efforts or focus on SaaS solutions will prove successful and accomplish our business objectives is subject to numerous uncertainties and risks, including but not limited to, customer demand, our ability to further develop and scale infrastructure, our ability to include functionality and usability in such offerings that address customer requirements, tax and accounting implications and our costs. If we or other providers of cloud-based computing in general, and in the P&C insurance industry in particular, experience security incidents, loss of customer data, disruptions in delivery or other problems, the market for cloud computing applications as a whole, including our SaaS solutions, may be negatively affected. If cloud computing does not achieve widespread adoption or there is a reduction in demand for cloud computing caused by a lack of customer acceptance, technological challenges, weakening economic conditions, security or privacy concerns, competing technologies and solutions, reductions in corporate spending or otherwise, it could have a material adverse effect on our business, financial condition, and results of operations.
24
We may not be able to obtain capital when desired on favorable terms, if at all, and we may not be able to obtain capital or complete acquisitions through the use of equity without dilution to our stockholders.
We may need additional financing to execute on our current or future business strategies, including to develop new or enhance existing solutions, acquire businesses and technologies or otherwise respond to competitive pressures. Our ability to raise capital in the future may be limited, and if we fail to raise capital when needed, we could be prevented from growing and executing our business strategy.
If we raise additional funds through the issuance of equity or convertible debt securities, the percentage ownership of our stockholders could be significantly diluted, and newly-issued securities may have rights, preferences or privileges senior to those of existing stockholders. If we accumulate additional funds through debt financing, a substantial portion of our operating cash flow may be dedicated to the payment of principal and interest on such indebtedness, thus limiting funds available for our business activities. We cannot assure stockholders that additional financing will be available on terms favorable to us, or at all. If adequate funds are not available or are not available on acceptable terms, when we desire them, our ability to fund our operations, take advantage of unanticipated opportunities, develop or enhance our solutions, invest in future growth opportunities or otherwise respond to competitive pressures would be significantly limited. Any of these factors could harm our results of operations.
Increases in professional services revenue as a percentage of total revenue or lower professional services margin percentages could adversely affect our overall gross margins and profitability.
Our professional services revenue was 44%, 45%, and 44% of total revenue for fiscal 2020, 2019 and 2018, respectively. Our professional services revenue produces lower gross margin percentages than our subscription revenue and license revenue. The gross margin percentages of our professional services revenue were 39%, 44%, and 47% for fiscal 2020, 2019 and 2018, respectively. The gross margin percentages for license revenue were 81%, 86%, and 90% for fiscal 2018, 2019 and 2020, respectively. The gross margin percentages for subscription revenue was 58%, 57%, and 48% and for each of fiscal 2020, 2019 and 2018, respectively. We expect our professional services revenue to grow over time in absolute dollars due to customer growth and an increasing need for implementation services but decrease as a percentage of total revenue. Any increase in the percentage of total revenue represented by professional services revenue would reduce our overall gross margins and operating margins. Such a trend can be the result of several factors, some of which may be beyond our control, including increased customer demand for our professional service team’s involvement in new solutions, the rates we charge for our professional services, our ability to bill our customers for all time incurred to complete a project, and the extent to which SI partners are willing and able to provide services directly to customers. Erosion in our professional services margin percentages would also adversely affect our gross and operating margin percentages. Professional services margin percentages may erode for a period of time as we work to grow our business and overall revenue; for instance, professional services margin percentages may erode if we hire and train additional professional services personnel to support new solutions, if we require additional professional service personnel to support entry into new markets, or if we require additional personnel on unexpectedly difficult projects to ensure customer success, perhaps without commensurate compensation due to the terms of the arrangement.
Professional services margins may also decline if we are required to defer professional services revenue in connection with an engagement. This may happen for a number of reasons, including if there is a specific product deliverable associated with a broader professional services engagement. In these situations, we would defer only the direct costs associated with the engagement, although other indirect costs could be recognized. Deferring all revenue but only direct costs will reduce margins. Lower professional services margins could adversely affect our overall gross margins and profitability.
25
Real or perceived errors or failures in our solutions or implementation services may affect our reputation, cause us to lose customers and reduce sales which may harm our business and results of operations and subject us to liability for breach of warranty claims.
Because we offer solutions that operate in complex environments, undetected errors or failures may exist or occur, especially when solutions are first introduced or when new versions are released, implemented or integrated into other systems. Our solutions are often installed and used in large-scale computing environments with different operating systems, system management software and equipment and networking configurations, which may cause errors or failures in our solutions or may expose undetected errors, failures or bugs in our solutions. Despite testing by us, we may not identify all errors, failures or bugs in new solutions or releases until after commencement of commercial sales or installation. In the past, we have discovered errors, failures and bugs in some of our solutions after their introduction. We may not be able to fix errors, failures and bugs without incurring significant costs or an adverse impact to our business. We believe that our reputation and name recognition are critical factors in our ability to compete and generate additional sales. Promotion and enhancement of our name will depend largely on our success in continuing to provide effective solutions and services. The occurrence of errors in our solutions or the detection of bugs by our customers may damage our reputation in the market and our relationships with our existing customers, and as a result, we may be unable to attract or retain customers. Any of these events may result in the loss of, or delay in, market acceptance of our solutions and services, which could seriously harm our sales, results of operations and financial condition.
The license and support of our software creates the risk of significant liability claims against us. Our SaaS arrangements and term and perpetual licenses with our customers contain provisions designed to limit our exposure to potential liability claims. It is possible, however, that the limitation of liability provisions contained in such agreements may not be enforced as a result of international, federal, state and local laws or ordinances or unfavorable judicial decisions. Breach of warranty or damage liability, or injunctive relief resulting from such claims, could harm our results of operations and financial condition.
Our sales and implementation cycles are lengthy and variable, depend upon factors outside our control, and could cause us to expend significant time and resources prior to generating revenue.
The typical sales cycle for our solutions is lengthy and unpredictable, requires pre-purchase evaluation by a significant number of employees in our customers’ organizations, and often involves a significant operational decision by our customers. While sales cycles can vary and such differences can be material, the typical buying process for a customer purchasing core system software takes approximately twelve to fifteen months, and such cycles may be extended in the current economic climate. Our sales efforts involve educating our customers about the use and benefits of our solutions, including the technical capabilities of our solutions and the potential cost savings achievable by organizations using our solutions. Potential customers typically undertake a rigorous pre-purchase decision-making and evaluation process, and sales to new customers involve extensive customer due diligence and reference checks. We invest a substantial amount of time and resources on our sales efforts without any assurance that our efforts will produce sales. Even if we succeed at completing a sale, we may be unable to predict the size of an initial SaaS arrangement or term or perpetual license until very late in the sales cycle. In addition, we sometimes commit to include specific functions in our base product offering at the request of a customer or group of customers and are unable to recognize subscription or license revenue until the specific functions have been added to our solutions. Providing this additional functionality may be time consuming and may involve factors that are outside of our control. Customers may also insist that we commit to certain time frames in which systems built around our solutions will be operational, or that once implemented our solutions will be able to meet certain operational requirements. Our ability to meet such timeframes and requirements may involve factors that are outside of our control, and failure to meet such timeframes and requirements could result in us incurring penalties, costs and/or additional resource commitments, which would adversely affect our business and results of operations.
Unexpected delays and difficulties can occur as customers implement and test our solutions. Implementing our solutions typically involves integration with our customers’ and third-party’s systems, as well as adding customer and third-party data to our platform. This can be complex, time consuming and expensive for our customers and can result in delays in the implementation of our solutions. We also provide our customers with upfront estimates regarding the duration, resources and costs associated with the implementation of our solutions. Failure to meet these upfront estimates and the expectations of our customers for the implementation of our solutions could result in
26
a loss of customers and negative publicity about us and our solutions and professional services. Such failure could result from deficiencies in our solution capabilities or inadequate professional service engagements performed by us, our SI partners or our customers’ employees, the latter two of which are beyond our direct control. Time-consuming implementations may also increase the amount of services personnel we must allocate to each customer, thereby increasing our costs and consequently the cost to our customers and adversely affecting our business, results of operations and financial condition.
Assertions by third parties of infringement or other violation by us of their intellectual property rights could result in significant costs and substantially harm our business and results of operations.
The software industry is characterized by the existence of a large number of patents and frequent claims and related litigation regarding patents and other intellectual property rights. In particular, leading companies in the software industry own large numbers of patents, copyrights, trademarks and trade secrets, which they may use to assert claims against us. From time to time, third parties holding such intellectual property rights, including leading companies, competitors, patent holding companies and/or non-practicing entities, may assert patent, copyright, trademark or other intellectual property claims against us, our customers and partners, and those from whom we license technology and intellectual property.
Although we believe that our solutions do not infringe upon the intellectual property rights of third parties, we cannot assure that third parties will not assert infringement or misappropriation claims against us with respect to current or future solutions, or that any such assertions will not require us to enter into royalty arrangements or result in costly litigation, or result in us being unable to use certain intellectual property. Infringement assertions from third parties may involve patent holding companies or other patent owners who have no relevant product revenue, and therefore our own issued and pending patents may provide little or no deterrence to these patent owners in bringing intellectual property rights claims against us.
If we are forced to defend against any infringement or misappropriation claims, whether they are with or without merit, are settled out of court, or are determined in our favor, we may be required to expend significant time and financial resources on the defense of such claims. Regardless of the merits or eventual outcome, such a claim could harm our brand and business. Furthermore, an adverse outcome of a dispute may require us to pay damages, potentially including treble damages and attorneys’ fees, if we are found to have willfully infringed a party’s intellectual property; cease making, licensing or using our solutions that are alleged to infringe or misappropriate the intellectual property of others; expend additional development resources to redesign our solutions; enter into potentially unfavorable royalty or license agreements in order to obtain the right to use necessary technologies or works; and to indemnify our partners, customers and other third parties. Any of these events could seriously harm our business, results of operations and financial condition.
Failure to protect our intellectual property could substantially harm our business and results of operations.
Our success depends in part on our ability to enforce and defend our intellectual property rights. We rely upon a combination of trademark, trade secret, copyright, patent and unfair competition laws, as well as license agreements and other contractual provisions, to do so.
In the future we may file patent applications related to certain of our innovations. We do not know whether those patent applications will result in the issuance of a patent or whether the examination process will require us to narrow our claims. In addition, we may not receive competitive advantages from the rights granted under our patents and other intellectual property. Our existing patents and any patents granted to us or that we otherwise acquire in the future, may be contested, circumvented or invalidated, and we may not be able to prevent third parties from infringing these patents. Therefore, the extent of the protection afforded by these patents cannot be predicted with certainty. In addition, given the costs, effort, risks and downside of obtaining patent protection, including the requirement to ultimately disclose the invention to the public, we may choose not to seek patent protection for certain innovations; however, such patent protection could later prove to be important to our business.
We also rely on several registered and unregistered trademarks to protect our brand. Nevertheless, competitors may adopt service names similar to ours, or purchase our trademarks and confusingly similar terms as keywords in Internet search engine advertising programs, thereby impeding our ability to build brand identity and possibly
27
leading to confusion in the marketplace. In addition, there could be potential trade name or trademark infringement claims brought by owners of other registered trademarks or trademarks that incorporate variations of our trademarks. Any claims or customer confusion related to our trademarks could damage our reputation and brand and substantially harm our business and results of operations.
We attempt to protect our intellectual property, technology and confidential information by generally requiring our employees and consultants to enter into confidentiality and assignment of inventions agreements and third parties to enter into nondisclosure agreements, all of which offer only limited protection. These agreements may not effectively prevent unauthorized use or disclosure of our confidential information, intellectual property or technology and may not provide an adequate remedy in the event of unauthorized use or disclosure of our confidential information, intellectual property or technology. Despite our efforts to protect our confidential information, intellectual property, and technology, unauthorized third parties may gain access to our confidential proprietary information, develop and market solutions similar to ours, or use trademarks similar to ours, any of which could materially harm our business and results of operations. In addition, others may independently discover our trade secrets and confidential information, and in such cases, we could not assert any trade secret rights against such parties. Existing United States federal, state and international intellectual property laws offer only limited protection. The laws of some foreign countries do not protect our intellectual property rights to as great an extent as the laws of the United States, and many foreign countries do not enforce these laws as diligently as governmental agencies and private parties in the United States. Moreover, policing our intellectual property rights is difficult, costly and may not always be effective.
From time to time, legal action by us may be necessary to enforce our patents and other intellectual property rights, to protect our trade secrets, to determine the validity and scope of the intellectual property rights of others or to defend against claims of infringement or invalidity. Even if we are successful in defending our claims, litigation could result in substantial costs and diversion of resources and could negatively affect our business, reputation, results of operations and financial condition. To the extent that we seek to enforce our rights, we could be subject to claims that an intellectual property right is invalid, otherwise not enforceable, or is licensed to the party against whom we are pursuing a claim. In addition, our assertion of intellectual property rights may result in the other party seeking to assert alleged intellectual property rights or assert other claims against us, which could harm our business. If we are not successful in defending such claims in litigation, we may not be able to sell or license a particular solution due to an injunction, or we may have to pay damages that could, in turn, harm our results of operations. In addition, governments may adopt regulations, or courts may render decisions, requiring compulsory licensing of intellectual property to others, or governments may require that products meet specified standards that serve to favor local companies. Our inability to enforce our intellectual property rights under these circumstances may harm our competitive position and our business. If we are unable to protect our technology and to adequately maintain and protect our intellectual property rights, we may find ourselves at a competitive disadvantage to others who need not incur the additional expense, time and effort required to create the innovative solutions that have enabled us to be successful to date.
28
If our solutions or third-party cloud providers experience data security breaches, and there is unauthorized access to our customers’ data, we may lose current or future customers and our reputation and business may be harmed.
If our security measures are breached or unauthorized access to customer data is otherwise obtained, our solutions may be perceived as not being secure, customers may reduce the use of or stop using our solutions, and we may incur significant liabilities. Our solutions involve the storage and transmission of data, in some cases to third-party cloud providers, which may include personal data, and security breaches, including at third-party cloud providers, could result in the loss of this information, which in turn could result in litigation, breach of contract claims, indemnity obligations, reputational damage and other liability for our company. Despite the measures that we have or may take, our infrastructure will be potentially vulnerable to physical or electronic break-ins, computer viruses or similar problems, and in the case of third-party cloud providers, may be outside of our control. If a person circumvents our security measures, that person could misappropriate proprietary information or disrupt or damage our operations. Security breaches that result in access to confidential information could damage our reputation and subject us to a risk of loss or liability. We may be required to make significant expenditures to protect against or remediate security breaches. Additionally, if we are unable to adequately address our customers’ concerns about security, we will have difficulty selling our solutions and professional services.
We rely on third-party technology and systems for a variety of services, including, without limitation, third-party cloud providers to host our websites and web-based services, encryption and authentication technology, employee email, content delivery to customers, back-office support and other functions, and our ability to control or prevent breaches of any of these systems may be beyond our control. Because techniques used to obtain unauthorized access or sabotage systems change frequently and generally are not identified until they are launched against a target, we may be unable to anticipate these techniques or to implement adequate preventative measures. Although we have developed systems and processes that are designed to protect customer information and prevent data loss and other security breaches, including systems and processes designed to reduce the impact of a security breach at a third-party vendor, such measures cannot provide absolute security. In addition, we may have to introduce such protective systems and processes to acquired companies, who may not correctly implement them at first or at all. Any or all of these issues could negatively impact our ability to attract new customers or to increase engagement by existing customers, could cause existing customers to elect not to renew their SaaS arrangements or term licenses, or could subject us to third-party lawsuits, regulatory fines or other action or liability, thereby adversely affecting our results of operations.
We may be obligated to disclose our proprietary source code to our customers, which may limit our ability to protect our intellectual property and could reduce the renewals of our maintenance and support services.
Our SaaS arrangements and license agreements sometimes contain provisions permitting the customer to become a party to, or a beneficiary of, a source code escrow agreement under which we place the proprietary source code for our applicable solutions in escrow with a third-party. As of August 31, 2020, we have source code license agreements in place with 45% of our customers who have either SaaS or term and perpetual license arrangements with us. Under these escrow agreements, the source code to the applicable product may be released to the customer, typically for its use to maintain, modify and enhance the product, upon the occurrence of specified events, such as our filing for bankruptcy or the discontinuance of our ability to perform our obligations, or if we otherwise breach certain of our representations, warranties or covenants under our agreements with our customers.
Disclosing the content of our source code may limit the intellectual property protection we can obtain or maintain for that source code or the solutions containing that source code and may facilitate intellectual property infringement claims against us. It also could permit a customer to which a solution’s source code is disclosed to support and maintain that solution without being required to purchase our support or maintenance services. Each of these would harm our business, results of operations and financial condition.
29
We and our customers rely on technology and intellectual property of third parties, the loss of which could limit the functionality of our solutions and disrupt our business.
We use technology and intellectual property licensed from unaffiliated third parties in certain of our solutions, and we may license additional third-party technology and intellectual property in the future. Any errors or defects in this third-party technology and intellectual property could result in errors that could harm our brand and business. In addition, licensed technology and intellectual property may not continue to be available on commercially reasonable terms, or at all. The loss of the right to license and distribute this third-party technology could limit the functionality of our solutions and might require us to redesign our solutions.
We expect to continue to expand through acquisitions or partnerships with other companies, which may divert our management’s attention and result in unexpected operating and technology integration difficulties, increased costs and dilution to our stockholders.
We expect to continue to grow, in part, by making targeted acquisitions. Our business strategy includes the potential acquisition of shares or assets of companies with software, technologies or businesses complementary to ours, both domestically and globally. Our strategy also includes alliances with such companies. Since 2016, we have consummated several acquisitions that were initially dilutive to earnings. Acquisitions and alliances may result in unforeseen operating difficulties and expenditures and may not result in the benefits anticipated by such corporate activity.
In particular, we may fail to assimilate or integrate the businesses, technologies, services, products, personnel or operations of the acquired companies, retain key personnel necessary to favorably execute the combined companies’ business plan, or retain existing customers or sell acquired products to new customers. Additionally, the assumptions we use to evaluate acquisition opportunities may not prove to be accurate, and intended benefits may not be realized. Our due diligence investigations may fail to identify all of the problems, liabilities or other challenges associated with an acquired business which could result in increased risk of unanticipated or unknown issues or liabilities, including with respect to environmental, competition and other regulatory matters, and our mitigation strategies for such risks that are identified may not be effective. As a result, we may not achieve some or any of the benefits, including anticipated synergies or accretion to earnings, that we expect to achieve in connection with our acquisitions, or we may not accurately anticipate the fixed and other costs associated with such acquisitions, or the business may not achieve the performance we anticipated, which may materially adversely affect our business, prospects, financial condition, results of operations, cash flows, as well as our stock price. Further, if we fail to achieve the expected synergies from our acquisitions and alliances, we may experience impairment charges with respect to goodwill, intangible assets or other items, particularly if business performance declines or expected growth is not realized. Any future impairment of our goodwill or other intangible assets could have an adverse effect on our financial condition and results of operations.
Acquisitions and alliances may also disrupt our ongoing business, divert our resources and require significant management attention that would otherwise be available for ongoing development of our current business. In addition, we may be required to make additional capital investments or undertake remediation efforts to ensure the success of our acquisitions, which may reduce the benefits of such acquisitions. We also may be required to use a substantial amount of our cash or issue debt or equity securities to complete an acquisition or realize the potential of an alliance, which could deplete our cash reserves and/or dilute our existing stockholders. Following an acquisition or the establishment of an alliance offering new solutions, we may be required to defer the recognition of revenue that we receive from the sale of solutions that we acquired or that result from the alliance, or from the sale of a bundle of solutions that includes such new solutions. In addition, our ability to maintain favorable pricing of new solutions may be challenging if we bundle such solutions with sales of existing solutions. A delay in the recognition of revenue from sales of acquired or alliance solutions, or reduced pricing due to bundled sales, may cause fluctuations in our quarterly financial results, may adversely affect our operating margins and may reduce the benefits of such acquisitions or alliances.
30
Additionally, competition within the software industry for acquisitions of businesses, technologies and assets has been, and is expected to continue to be, intense. As such, even if we are able to identify an acquisition that we would like to pursue, the target may be acquired by another strategic buyer or financial buyer such as a private equity firm, or we may otherwise not be able to complete the acquisition on commercially reasonable terms, if at all. Moreover, in addition to our failure to realize the anticipated benefits of any acquisition, including our revenue or return on investment assumptions, we may be exposed to unknown liabilities or impairment charges as a result of acquisitions we do complete.
We face intense competition in our market, which could negatively impact our business, results of operations and financial condition and cause our market share to decline.
The market for our solutions and services is intensely competitive. The competitors we face in any sale may change depending on, among other things, the line of business purchasing the solution, the solution being sold, the geography in which we are operating and the size of the carrier to which we are selling. For example, we are more likely to face competition from small independent firms when addressing the needs of small insurers. These competitors may compete on the basis of price, the time and cost required for software implementation, custom development, or unique product features or functions. Outside of the United States, we are more likely to compete against vendors that may differentiate themselves based on local advantages in language, market knowledge and pre-built content applicable to that jurisdiction. We also compete with vendors of horizontal software products that may be customized to address needs of the P&C insurance industry.
Additionally, many of our prospective customers operate firmly entrenched legacy systems, some of which have been in operation for decades. Our implementation cycles are lengthy, variable and require the investment of significant time and expense by our customers. These expenses and associated operating risks attendant on any significant process of re-engineering and technology implementation exercise, may cause customers to prefer maintaining legacy systems. Also, maintaining legacy systems may be so time consuming and costly for our customers that they do not have adequate resources to devote to the purchase and implementation of our solutions. We also compete against technology consulting firms that either helped create such legacy systems or may own, in full or in part, subsidiaries that develop software and systems for the P&C insurance industry. As we expand our portfolio of solutions, we may begin to compete with software and service providers we have not competed against previously. Such potential competitors offer data and analytics tools that may, in time, become more competitive with our offerings. In addition, instead of purchasing P&C software products from a third party, including one of our direct competitors, our customers may decide to internally develop their own systems.
We expect the intensity of competition to remain high in the future. In addition to existing competitors, we believe investment in emerging Insurtech companies, which seek to innovate and disrupt the insurance industry, is growing rapidly and could produce new competitive threats. Continuing intense competition could result in increased pricing pressure, increased sales and marketing expenses, and greater investments in research and development, each of which could negatively impact our profitability. In addition, the failure to increase, or the loss of market share, would harm our business, results of operations, financial condition and/or future prospects. Some of our current and potential competitors may have longer operating histories and greater financial, technical, sales, marketing and other resources than we do, as well as larger installed customer bases. As a result, such competitors may be able to devote greater resources to the development, promotion and sale of their solutions than we can devote to ours, which could allow them to respond more quickly than we can to new or emerging technologies and changes in customer needs, thus leading to their wider market acceptance. To the extent any competitor has existing relationships with potential customers for other applications, those customers may be unwilling to purchase our solutions because such existing relationships create customer “stickiness.” For instance, if a potential customer uses one product from a competitor that powers a critical element of the customer’s day-to-day operations, they may be more likely to turn to such competitor in the future to the extent they require further product solutions, rather than purchasing one or more solutions from our suite. We may not be able to compete effectively and competitive pressures may prevent us from acquiring and maintaining the customer base necessary for us to increase our revenue and profitability.
31
In addition, our industry is evolving rapidly, and we anticipate the market for solutions will become increasingly competitive. If our current and potential customers move a greater proportion of their data and computational needs to the cloud, new competitors may emerge that offer services either comparable or better suited than ours to address the demand for such solutions, which could reduce demand for our offerings. To compete effectively we will likely be required to increase our investment in our product development and technology, as well as the personnel and third-party services required to improve reliability and lower the cost of delivery of our SaaS solutions. This may increase our costs more than we anticipate and may adversely impact our results of operations.
Our current and potential competitors may also establish cooperative relationships among themselves or with third parties to further enhance their resources and offerings. Current or potential competitors may be acquired by other vendors or third parties with greater available resources. As a result of such acquisitions, our current or potential competitors might be more able than we are to adapt quickly to new technologies and customer needs, to devote greater resources to the promotion or sale of their products and services, to initiate or withstand substantial price competition, or to take advantage of emerging opportunities by developing and expanding their product and service offerings more quickly than we can. Additionally, they may hold larger portfolios of patents and other intellectual property rights as a result of such relationships or acquisitions. If we are unable to compete effectively with these evolving competitors for market share, our business, results of operations and financial condition would be materially and adversely affected.
Our estimates of certain operational metrics, as well as of total addressable market and market growth, are subject to inherent challenges in measurement.
We make certain estimates with regard to certain operational metrics which we track using internal systems that are not independently verified by any third party. While the metrics presented in this Annual Report on Form 10-K are based on what we believe to be reasonable assumptions and estimates, our internal systems have a number of limitations, and our methodologies for tracking these metrics may change over time.
Additionally, total addressable market and growth estimates are subject to significant uncertainty and are based on assumptions and estimates that may not prove to be accurate. Our estimates relating to size and expected growth of our market may prove to be inaccurate. Even if the market in which we compete meets our size and growth estimates, our business could fail to grow at similar rates. If investors do not perceive our estimates of total addressable market and market growth or our operational metrics to be accurate, or if we discover material inaccuracies with respect to these figures, our reputation may be significantly harmed, and our results of operations and financial condition could be adversely affected.
We may not receive significant revenue from our current research and development efforts for several months or years, if at all.
Developing software is expensive, and the investment in product development may involve a long payback cycle. Our research and development expenses were $44.1 million, or 21% of our total revenue in fiscal 2020, $35.9 million, or 21% of our total revenue in fiscal 2019, and $36.1 million, or 23% of our total revenue in fiscal 2018. Costs incurred in the preliminary design and development stages of our projects are generally expensed as incurred. Once a project has reached the application development stage, certain internal, external, direct and indirect costs may be subject to capitalization. Generally, costs are capitalized until the technology is available for its intended use. Subsequent costs incurred for the development of future upgrades and enhancements, which are expected to result in additional functionality, follow the same protocol for capitalization. Our future plans include significant investments to develop, improve and expand the functionality of our solutions. We believe that we must continue to dedicate a significant amount of resources to our research and development efforts to maintain our competitive position. However, we may not recognize significant revenue from these investments for several months or years, if at all.
32
If we are unable to develop, introduce and market new and enhanced versions of our solutions, we may be put at a competitive disadvantage and our operating results could be adversely affected.
Our ability to attract new customers and increase revenue from our existing customers depends, in part, on our continued ability to enhance the functionality of our existing solutions by developing, introducing and marketing new and enhanced versions of our solutions that address the evolving needs of our customers and changing industry standards. Because some of our solutions are complex and require rigorous testing, development cycles can be lengthy and can require months or even years of development, depending upon the solution and other factors. As we expand internationally, our products and services must be modified and adapted to comply with regulations and other requirements of the countries in which our customers do business.
Additionally, market conditions, including heightened pressure on carriers from end-users relating to mobile computing devices and speed of delivery, may dictate that we change the technology platform underlying our existing solutions or that new solutions be developed on different technology platforms, potentially adding material time and expense to our development cycles. The nature of these development cycles may cause us to experience delays between the time we incur expenses associated with research and development and the time we generate revenue, if any, from such expenses.
If we fail to develop new solutions or enhancements to our existing solutions, our business could be adversely affected, especially if our competitors are able to introduce solutions with enhanced functionality. It is critical to our success for us to anticipate changes in technology, industry standards and customer requirements and to successfully introduce new, enhanced and competitive solutions to meet our customers’ and prospective customers’ needs on a timely basis. We have invested and intend to continue to make significant investments in research and development to meet these challenges. Our estimates of research and development expenses may be too low, revenue may not be sufficient to support the future product development that is required for us to remain competitive and development cycles may be longer than anticipated. Further, there is no assurance that research and development expenditures will lead to successful solutions or enhancements to our existing solutions. If we fail to develop solutions in a timely manner that are competitive in technology and price or develop solutions that fail to meet customer demands, our market share will decline and our business and results of operations would be harmed.
Our international sales and operations subject us to additional risks that can adversely affect our business, results of operations and financial condition.
We sell our solutions and professional services to customers located outside the United States, and we are continuing to expand our international operations as part of our growth strategy. In fiscal 2020, 2019 and 2018, 5%, 5%, and 8% of our revenue, respectively, was derived from outside of the United States. Revenue by geography is determined based on the country in which a customer contract is executed. Some of our contracts allow for usage of our solutions in multiple countries. Our current international operations and our plans to expand our international operations subject us to a variety of risks, including:
|
|
• |
increased management, travel, infrastructure and legal compliance costs associated with having multiple international operations; |
|
|
• |
unique terms and conditions in contract negotiations imposed by customers in foreign countries; |
|
|
• |
longer payment cycles and difficulties in enforcing contracts and collecting accounts receivable; |
|
|
• |
the need to localize our licensing and SaaS solutions for international customers; |
|
|
• |
lack of familiarity with and unexpected changes in foreign regulatory requirements; |
|
|
• |
increased exposure to fluctuations in currency exchange rates; |
|
|
• |
highly inflationary international economies; |
|
|
• |
the burdens and costs of complying with a wide variety of foreign laws and legal standards, including the General Data Protection Regulation (“GDPR”) in the European Union; |
33
|
|
• |
compliance with the U.S. Foreign Corrupt Practices Act of 1977, as amended, the U.K. Bribery Act and other anti-corruption regulations, particularly in emerging market countries; |
|
|
• |
compliance by international staff with accounting practices generally accepted in the United States, including adherence to our accounting policies and internal controls; |
|
|
• |
import and export license requirements, tariffs, trade agreements, taxes and other trade barriers; |
|
|
• |
increased financial accounting and reporting burdens and complexities; |
|
|
• |
weaker protection of intellectual property rights in some countries; |
|
|
• |
multiple and possibly overlapping tax regimes; |
|
|
• |
the application of the respective local laws and regulations to our business in each of the jurisdictions in which we operate; |
|
|
• |
government sanctions that may interfere with our ability to sell into particular countries; |
|
|
• |
disruption to our operations caused by epidemics or pandemics, such as COVID-19; and |
|
|
• |
political, social and economic instability abroad, terrorist attacks and security concerns in general. |
As we continue to expand our business globally, our success will depend, in large part, on our ability to anticipate and effectively manage these and other risks associated with our international operations. Any of these risks could harm our international operations and reduce our international sales, adversely affecting our business, results of operations, financial condition and growth prospects.
Our business may be materially adversely impacted by U.S. and global market and economic conditions adverse to the insurance industry.
We expect to continue to derive most of our revenue from solutions and additional services we provide to the P&C insurance industry. Given the concentration of our business activities in this industry, we will be particularly exposed to certain economic downturns affecting the insurance industry, in particular the P&C insurance industry. U.S. and global market and economic conditions have been, and continue to be, disrupted and volatile. General business and economic conditions that could affect us and our customers include fluctuations in economic growth, debt and equity capital markets, liquidity of the global financial markets, the availability and cost of credit, investor and consumer confidence, and the strength of the economies in which our customers operate. A poor economic environment could result in significant decreases in demand for our solutions and professional services, including the delay or cancellation of current or anticipated projects, or could present difficulties in collecting accounts receivables from our customers due to their deteriorating financial condition. Our existing customers may be acquired by or merged into other entities that use our competitors’ products, or they may decide to terminate their relationships with us for other reasons. As a result, our sales could decline if an existing customer is merged with or acquired by another company that has a poor economic outlook, or is closed.
Our customers may defer or forego purchases of our solutions or professional services in the event of weakened global economic conditions and political instability.
General worldwide economic conditions remain unstable, making it difficult for our customers and us to forecast and plan future business activities accurately. Prolonged economic uncertainties or downturns could harm our business operations or financial results. For example, the decision by referendum to withdraw the United Kingdom from the European Union (“Brexit”) in June 2016 caused significant volatility in global stock markets and fluctuations in currency exchange rates. The United Kingdom’s formal notification to the European Counsel required under Article 50 of the Treaty on European Union was made on March 29, 2017, triggering a two year negotiation period, subject to extension. The United Kingdom formally left the European Union on January 31, 2020, and is now in a transition period through December 31, 2020. Although the United Kingdom will remain in the European Union single market and customs union during the transition period, the long-term nature of the United Kingdom’s relationship with the European Union is unclear and there is considerable uncertainty as to when any agreement will be reached and implemented. The political and economic instability created by Brexit has caused and may continue to cause significant volatility in global financial markets and uncertainty regarding the regulation of data protection in the United Kingdom. In particular, although the United Kingdom enacted a Data Protection Act in May 2018 that is consistent with the GDPR, uncertainty remains regarding how data transfers to and from the United Kingdom will be regulated. The full effect of Brexit is uncertain and depends on any agreements the United Kingdom may make with the European Union and others.
34
Brexit or other global events, such as the imposition of various trade tariffs, the COVID-19 pandemic and elections in the United States and elsewhere, may continue to create global economic, political and regulatory uncertainty not only in the United Kingdom, but in other regions in which we have significant operations. These conditions could cause our customers to reevaluate their decision to purchase our solutions and professional services, which could delay and lengthen our sales cycles or result in cancellations of planned purchases. Furthermore, during challenging economic times our customers may face issues in gaining timely access to sufficient credit, which could result in an impairment of their ability to make timely payments to us. If that were to occur, we may not receive amounts owed to us and may be required to record an allowance for doubtful accounts, which would adversely affect our financial results. A substantial downturn in the P&C insurance industry may cause firms to react to worsening conditions by reducing their capital expenditures, reducing their spending on IT, delaying or canceling IT projects, or seek to lower their costs by renegotiating vendor contracts. Negative or worsening conditions in the general economy both in the United States and abroad, including conditions resulting from financial and credit market fluctuations, could cause a decrease in corporate spending on enterprise software in general, and in the insurance industry specifically, and negatively affect the rate of growth of our business.
In addition, the U.S. Congress could introduce legislation that would result in the increased regulation of the financial and insurance industries, which could reduce the need for our solutions and professional services. An expansion in government’s role in the U.S. P&C insurance industry may lower the future revenue for the solutions we are developing and adversely affect our future business, possibly materially. We cannot predict what insurance initiatives, if any, will be implemented at the federal or state level, or the effect any future legislation or regulation will have on us. Any of these events could seriously harm our business, results of operations and financial condition.
Factors outside of our control including but not limited to natural catastrophes and terrorism may adversely impact the P&C insurance industry, preventing us from expanding or maintaining our existing customer base and increasing our revenue.
Our customers are carriers who have experienced, and will likely experience in the future, losses from catastrophes or terrorism that may adversely impact their businesses. Catastrophes can be caused by various events, including, without limitation, hurricanes, tsunamis, floods, windstorms, earthquakes, hail, tornadoes, explosions, severe weather, epidemics, pandemics and fires. Global warming trends are contributing to an increase in erratic weather patterns globally and intensifying the impact of certain types of catastrophes. Moreover, acts of terrorism or war could cause disruptions to our business or our customers’ businesses or the economy as a whole.
The risks associated with natural catastrophes and terrorism are inherently unpredictable, and it is difficult to forecast the timing of such events or estimate the amount of losses they will generate. In recent years, for example, parts of the United States suffered extensive damage due to multiple hurricanes and fires. The combined effect of those losses on carriers was significant. Such losses and losses due to future events may adversely impact our current or potential customers, which may prevent us from maintaining or expanding our customer base and increasing our revenue as such events may cause customers to postpone purchases of new offerings and professional service engagements or to discontinue existing projects. Any of these events could materially harm our business, results of operation and financial condition.
If we are unable to continue the successful development of our direct sales team and the expansion of our relationships with our strategic partners, sales of our solutions, and consequently our professional services, will suffer and our growth would be slower than we project.
We believe that our future growth will depend on the continued recruiting, retention and training of our direct sales team and their ability to obtain new customers and to manage our existing customer base. Our ability to achieve significant growth in revenue in the future will depend, in part, on our success in recruiting, training and retaining a sufficient number of inside sales personnel and solution consultants. New hires require significant training and may, in some cases, take more than a year before becoming productive, if at all. Remote working due to COVID could further slow the onboarding of direct sales team members. If we are unable to hire and develop a sufficient number of productive members of our sales team, sales of our solutions will suffer. Additionally, a decline in sales of our solutions will directly impact our professional services revenue since a reduction in sales of our SaaS solutions and software license products will reduce the need for implementation services related to such products.
35
Any of these events could impede our growth and materially harm our business, results of operation and financial condition.
We believe our future growth also will depend on the retention and expansion of our partnerships with third-party partners, including leading SIs and best-in-class technology companies, which help to increase the visibility of our products and engage with us in co-marketing efforts. The goal of our partnerships with leading SIs and other third-party partners, including our sales, solution and consulting providers and third-party solution partners is to allow us to grow our business by giving us scale to service our growing customer base. Our growth in revenue, particularly in international markets, will be influenced by the development and maintenance of partnerships which, in some cases, may require the establishment of effective relationships with regional SIs. Although we have established relationships with some of leading SIs, our solutions and professional services may compete directly against solutions and professional services that such leading SIs support or market. Additionally, we are unable to control or predict the effects of the COVID-19 pandemic on our SI partners. If we are not able to retain and expand our relationships with SIs and our other third party-partners, it will have an adverse effect on our business and our results of operations could fail to grow in line with our projections.
Our ability to sell our solutions is dependent on the quality of our professional services and technical support services and the support of our SIs, and the failure of us or our SIs to offer high-quality professional services or technical support services could damage our reputation and adversely affect our ability to sell our solutions and professional services to new customers and renew agreements with our existing customers.
Our revenue and profitability depend on the reliability and performance of our professional services. If our professional services are unavailable, or customers are dissatisfied with our performance, we could lose customers, our revenue and profitability would decrease and our business operations or financial position could be harmed. In addition, the software and workflow processes that underlie our ability to deliver our professional services have been developed primarily by our own employees and consultants. Malfunctions in the software we use or human error could result in our inability to provide professional services or cause unforeseen technical problems. If we incur significant financial commitments to our customers in connection with our failure to meet professional service level commitment obligations, we may incur significant liability and our liability insurance and revenue reserves may not be adequate. In addition, any loss of services, equipment damage or inability to meet our professional service level commitment obligations could reduce the confidence of our customers and could consequently impair our ability to obtain and retain customers, which would adversely affect both our ability to generate revenue and our operating results.
If we or our SIs do not effectively assist our customers in implementing our solutions, succeed in helping our customers quickly resolve post-implementation issues, and provide effective ongoing support, our ability to sell additional solutions and professional services to existing customers would be adversely affected and our reputation with potential customers could be damaged. Since we believe that the implementation experience is vital to retaining customers, our SIs’ and our ability to provide predictable delivery results and product expertise is critical to our ability to renew agreements with our existing customers. We are unable to control the quantity or quality of resources that our SIs commit to implementing our solutions, or the quality or timeliness of such implementation. If our SIs do not commit sufficient or qualified resources to these activities, our customers will be less satisfied, be less supportive with references, or may require the investment of our resources at discounted rates.
Once our solutions are implemented and integrated with our customers’ existing IT investments and data, our customers may depend on our technical support services and/or the support of SIs to resolve any issues relating to our solutions. High-quality support is critical for the continued successful marketing and sale of our solutions and renewal of contracts. In addition, as we continue to expand our operations internationally, our support organization will face additional challenges, including those associated with delivering support, training and documentation in languages other than English. Many enterprise customers require higher levels of support than smaller customers. If we fail to meet the requirements of our larger customers, it may be more difficult to sell additional solutions and professional services to these customers, a key group for the growth of our revenue and profitability. In addition, as we further expand our SaaS solutions, our professional services and support organization will face new challenges, including hiring, training and integrating a large number of new professional services personnel with experience in delivering high-quality support for our SaaS solutions. Alleviating any of these problems could require significant expenditures which could adversely affect our results of operations and growth prospects. Further, as we continue to rely on our SIs to provide implementation and on-going services, our ability to ensure a high level of quality in addressing customer issues will be diminished. Our failure to maintain high-quality implementation and support
36
services, or to ensure that our SIs provide the same, could have a material adverse effect on our business, results of operations, financial condition and growth prospects.
If we fail to identify, attract and retain additional qualified personnel with experience in designing, developing and managing cloud-based software, as well as personnel who can successfully implement our solutions, we may be unable to grow our SaaS business as expected.
To execute our business strategy and continue to grow our SaaS business, we must identify, attract and retain highly qualified personnel. We compete with many other companies for a limited number of software developers with specialized experience in designing, developing and managing cloud-based software, as well as for skilled developers, engineers and information technology and operations professionals who can successfully implement and deliver our solutions. Many of the companies with which we compete for experienced personnel have greater resources than we have. As we continue to focus on growing our SaaS business, we may experience difficulty in finding, hiring and retaining highly skilled employees with appropriate qualifications which may, among other things, impede our ability to grow our SaaS business. If we are not successful in finding, attracting and retaining the professionals we need, we may be unable to execute our business strategy, including by managing employees and contractors remotely, which could have a material adverse effect on our results of operations, financial condition and growth prospects.
Any disruption of our Internet connections, including to any third-party cloud providers that host any of our websites or web-based services, could affect the success of our SaaS solutions.
Any system failure, including network, software or hardware failure, that causes an interruption in our network or a decrease in the responsiveness of our website and our SaaS solutions could result in reduced user traffic, reduced revenue and potential breaches of our SaaS arrangements. Continued growth in Internet usage could cause a decrease in the quality of Internet connection service. Websites have experienced service interruptions as a result of outages and other delays occurring throughout the worldwide Internet network infrastructure. In addition, there have been several incidents in which individuals have intentionally caused service disruptions of major e-commerce websites. If these outages, delays or service disruptions frequently occur in the future, usage of our web-based services could grow more slowly than anticipated or decline and we may lose revenue and customers.
If the third-party cloud providers that host any of our websites or web-based services were to experience a system failure, the performance of our websites and web-based services, including our SaaS solutions, would be harmed. Currently, we rely on one third-party cloud provider to host our websites and web-based services. As a result, it may take significant resources if we need to switch to another cloud provider for any reason. Any disruption of or interference with our use of this third-party cloud provider could impair our ability to deliver our solutions to our customers, resulting in customer dissatisfaction, damage to our reputation, loss of customers and harm to our operations and our business. In general, third-party cloud providers are vulnerable to damage from fire, floods, earthquakes, acts of terrorism, power loss, telecommunications failures, break-ins and similar events. The controls implemented by our current or future third-party cloud providers may not prevent or timely detect such system failures and we do not control the operation of third-party cloud providers that we use. Our current or future third-party cloud providers could decide to close their facilities without adequate notice. In addition, any financial difficulties, such as bankruptcy, faced by our current or future third-party cloud providers, or any of the service providers with whom we or they contract, may have negative effects on our business. If our current or future third-party cloud providers are unable to keep up with our growing needs for capacity or any spikes in customer demand, it could have an adverse effect on our business. Any changes in service levels by our current or future third-party cloud providers could result in loss or damage to our customers’-stored information and any service interruptions at these third-party cloud providers could hurt our reputation, cause us to lose customers, harm our ability to attract new customers or subject us to potential liability. Our property and business interruption insurance coverage may not be adequate to fully compensate us for losses that may occur. Additionally, our systems are not fully redundant, and we have not yet implemented a complete disaster recovery plan or business continuity plan. Although the redundancies we do have in place will permit us to respond, at least to some degree, to service outages, our current or future third-party cloud providers that host our SaaS solutions are vulnerable in the event of failure. We do not yet have adequate structure or systems in place to recover from a third-party cloud provider’s severe impairment or total destruction, and recovery from the total destruction or severe impairment of any of our third-party cloud providers could be difficult and may not be possible at all.
37
In addition, our users depend on Internet service providers, online service providers and other website operators for access to our website. These providers could experience outages, delays and other difficulties due to system failures unrelated to our systems. Any of these events could seriously harm our business, results of operations and financial condition.
Some of our services and technologies may use “open source” software, which may restrict how we use or distribute our services or require that we release the source code of certain solutions subject to those licenses.
Some of our services and technologies may incorporate software licensed under so-called “open source” licenses. In addition to risks related to license requirements, usage of open source software can lead to greater risks than use of third-party commercial software, as open source licensors generally do not provide warranties or controls on origin of the software. Additionally, some open source licenses require that source code subject to the license be made available to the public and that any modifications to or derivative works of open source software continue to be licensed under open source licenses. These open source licenses typically mandate that proprietary software, when combined in specific ways with open source software, become subject to the open source license. If we combine our proprietary solutions in such ways with certain open source software, we could be required to release the source code of our proprietary solutions.
We take steps to ensure that our proprietary solutions are not combined with, and do not incorporate, open source software in ways that would require our proprietary solutions to be subject to many of the restrictions in an open source license. However, few courts have interpreted open source licenses, and the manner in which these licenses may be interpreted and enforced is therefore subject to some uncertainty. Additionally, we rely on software programmers to design our proprietary technologies, and although we take steps to prevent our programmers from including objectionable open source software in the technologies and software code that they design, write and modify, we do not exercise complete control over the development efforts of our programmers and we cannot be certain that our programmers have not incorporated such open source software into our proprietary solutions and technologies or that they will not do so in the future. In the event that portions of our proprietary technology are determined to be subject to an open source license, we could be required to publicly release the affected portions of our source code, re-engineer all or a portion of our technologies, or otherwise be limited in the licensing of our technologies, each of which could reduce or eliminate the value of our services and technologies and materially and adversely affect our business, results of operations and prospects.
Incorrect or improper use of our solutions or our failure to properly train customers on how to utilize our solutions could result in customer dissatisfaction and negatively affect our business, results of operations, financial condition and growth prospects.
Our solutions are complex and are used in a wide variety of network environments. The proper use of our solutions requires training of the customer. If our solutions are not used correctly or as intended, inadequate performance may result. Our solutions may also be intentionally misused or abused by customers or their employees or third parties who are able to access or use our solutions. Because our customers rely on our solutions, services and maintenance support to manage a wide range of operations, the incorrect or improper use of our solutions, our failure to properly train customers on how to efficiently and effectively use our solutions, or our failure to properly provide maintenance services to our customers may result in negative publicity or legal claims against us. Also, as we continue to expand our customer base, any failure by us to properly provide these services will likely result in lost opportunities for follow-on sales of our solutions.
In addition, if there is substantial turnover of customer personnel responsible for use of our solutions, or if customer personnel are not well trained in the use of our solutions, customers may defer the implementation of our solutions, may use them in a more limited manner than originally anticipated or may not use them at all. Further, if there is substantial turnover of the customer personnel responsible for use of our solutions, our ability to make additional sales may be substantially limited.
If we are unable to retain our personnel and hire and integrate additional skilled personnel, we may be unable to achieve our goals and our business will suffer.
Our future success depends upon our ability to continue to attract, train, integrate and retain highly skilled employees, particularly those on our management team, including Michael Jackowski, our Chief Executive Officer, and our sales and marketing personnel, SaaS operations personnel, professional services personnel and software
38
engineers. Additionally, our stakeholders increasingly expect us to have a culture that embraces diversity and inclusion in the workplace. Our inability to attract and retain diverse and qualified personnel, or delays in hiring required personnel, including delays due to COVID-19, may seriously harm our business, results of operations and financial condition. If U.S. immigration policy related to skilled foreign workers were materially adjusted, such a change could hamper our efforts to hire highly skilled foreign employees, including highly specialized engineers, which would adversely impact our business.
Our executive officers and other key employees are generally employed on an at-will basis, which means that these personnel could terminate their relationship with us at any time. The loss of any member of our senior management team could significantly delay or prevent us from achieving our business and/or development objectives, and could materially harm our business.
We face competition for qualified individuals from numerous software and other technology companies. Further, significant amounts of time and resources are required to train technical, sales, services and other personnel. We may incur significant costs to attract, train and retain such personnel, and we may lose new employees to our competitors or other technology companies before we realize the benefit of our investment after recruiting and training them.
Also, to the extent that we hire personnel from competitors, we may be subject to allegations that such personnel have been improperly solicited or have divulged proprietary or other confidential information. In addition, we have a limited number of sales people and the loss of several sales people within a short period of time could have a negative impact on our sales efforts. We may be unable to attract and retain suitably qualified individuals who are capable of meeting our growing technical, operational and managerial requirements, or we may be required to pay increased compensation in order to do so.
Our ability to expand geographically depends, in large part, on our ability to attract, retain and integrate managers to lead the local business and employees with the appropriate skills. Similarly, our profitability depends on our ability to effectively utilize personnel with the right mix of skills and experience to perform services for our customers, including our ability to transition employees to new assignments on a timely basis. If we are unable to effectively deploy our employees globally on a timely basis to fulfill the needs of our customers, our reputation could suffer and our ability to attract new customers may be harmed.
Because of the technical nature of our solutions and the dynamic market in which we compete, any failure to attract, integrate and retain qualified sales, professional services and product development personnel, as well as our contract workers, could harm our ability to generate sales or successfully develop new solutions and professional services and enhancements of existing solutions.
We may experience fluctuations in foreign currency exchange rates that could adversely impact our results of operations.
Our international sales are generally denominated in foreign currencies, and this revenue could be materially affected by currency fluctuations. The volatility of exchange rates depends on many factors that we cannot forecast with reliable accuracy. Although we believe our operating activities act as a natural hedge for a substantial portion of our foreign currency exposure at the cash flow or operating income level because we typically collect revenue and incur costs in the currency of the location in which we provide our solutions and services, our contracts with our customers are long-term in nature so it is difficult to predict if our operating activities will provide a natural hedge in the future. In addition, as we enter into license agreements, which have historically been characterized by large annual payments, significant fluctuations in foreign currency exchange rates that coincide with annual payments may affect our revenue or financial results in such quarter. Our results of operations may also be impacted by transaction gains or losses related to revaluing certain current asset and liability balances that are denominated in currencies other than the functional currency of the entities in which they are recorded. Moreover, significant and unforeseen changes in foreign currency exchange rates may cause us to fail to achieve our stated projections for revenue and operating income, which could have an adverse effect on our stock price. We will continue to experience fluctuations in foreign currency exchange rates, which, if material, may harm our revenue or results of operations.
39
Privacy concerns could result in regulatory changes and impose additional costs and liabilities on us, limit our use of information and adversely affect our business.
As we increase our focus on our SaaS solutions, the amount of customer data we or our third-party cloud providers manage, hold and/or collect will increase significantly. In addition, a limited number of our solutions may collect, process, store, and use transaction-level data aggregated across insurers using our common data model. We anticipate that over time we will expand the use and collection of personal information as greater amounts of such personal information may be transferred from our customers to us and we recognize that personal privacy has become a significant issue in the United States, Europe, and many other jurisdictions where we operate. Many federal, state, and foreign legislatures and government agencies have imposed or are considering imposing restrictions and requirements about the collection, use and disclosure of personal information.
Changes to laws or regulations affecting privacy could impose additional costs and liabilities, including fines, on us and could limit our use of such information to add value for customers. If we were required to change our business activities or revise or eliminate services, or to implement burdensome compliance measures, our business and results of operations could be harmed. Additionally, in the case of data from our websites and web-based services that is stored with third-party cloud providers that we do not control, our third-party cloud providers may not adequately implement compliance measures concerning the privacy and/or security of any stored personal information. We may be subject to fines, penalties and potential litigation if we or our third-party cloud providers fail to comply with applicable privacy and/or data security laws, regulations, standards and other requirements. The costs of compliance with and other burdens imposed by privacy-related laws, regulations and standards may limit the use and adoption of our solutions and reduce overall demand.
Furthermore, concerns regarding data privacy and/or security may cause our end-users to resist providing the data and information necessary to allow our customers to use our solutions effectively. Even the perception that the privacy and/or security of personal information is not satisfactorily managed, or does not meet applicable legal, regulatory and other requirements, could inhibit sales of our solutions, and could limit adoption of our solutions, resulting in a negative impact on our sales and results from operations.
Failure to comply with the GDPR or other data privacy regimes could subject us to fines and reputational harm.
Global privacy legislation, enforcement and policy activity are rapidly expanding and creating a complex data privacy compliance environment and the potential for high profile negative publicity in the event of any data breach. We are subject to many privacy and data protection laws and regulations in the United States and around the world, some of which place restrictions on our ability to process personal data across our business. For example, the GDPR is a comprehensive update to the data protection regime in the European Economic Area that became effective on May 25, 2018. The GDPR imposes new requirements relating to, among other things, consent to process personal data of individuals, the information provided to individuals regarding the processing of their personal data, the security and confidentiality of personal data, and notifications in the event of data breaches and use of third-party processors. The GDPR imposes substantial fines for breaches of data protection requirements, which can be up to four percent of the worldwide revenue or 20 million Euros, whichever is greater. While we will continue to undertake efforts to conform to current regulatory obligations and evolving best practices, we may be unsuccessful in conforming to means of transferring personal data from the European Economic Area. We may also experience hesitancy, reluctance, or refusal by European or multi-national customers to continue to use some of our services due to the potential risk exposure of personal data transfers and the current data protection obligations imposed on them by certain data protection authorities. Such customers may also view any alternative approaches to the transfer of any personal data as being too costly, too burdensome, or otherwise objectionable, and therefore may decide not to do business with us if the transfer of personal data is a necessary requirement.
In addition, the CCPA, which went into effect on January 1, 2020, limits how we may collect, use and process personal data of California residents. The CCPA establishes a new privacy framework for covered businesses such as ours by, among other things, creating an expanded definition of personal information, establishing new data privacy rights for California residents and creating a new and potentially severe statutory damages framework and private rights of action for violations of the CCPA and for businesses that fail to implement reasonable security procedures and practices to prevent data breaches. The uncertainty and changes in the requirements of multiple jurisdictions may increase the cost of compliance, restrict our ability to offer services in certain locations or subject
40
us to sanctions by national, regional, state, local and international data protection regulators, all of which could harm our business, results of operations or financial condition.
Although we take reasonable efforts to comply with all applicable laws and regulations and have invested and continue to invest human and technology resources into data privacy compliance efforts, there can be no assurance that we will not be subject to regulatory action, including fines, in the event of an incident or other claim. We or our third-party service providers could be adversely affected if legislation or regulations are expanded to require changes in our or our third-party service providers’ business practices or if governing jurisdictions interpret or implement their legislation or regulations in ways that negatively affect our or our third-party service providers’ business, results of operations or financial condition.
Though our term and perpetual licensing model does not significantly collect and transfer personal information from our customers to us, our increased focus on SaaS solutions and the current data protection landscape may subject us to greater risk of potential inquiries and/or enforcement actions. For example, we may find it necessary to establish alternative systems to maintain personal data originating from the European Union in the European Economic Area, which may involve substantial expense and may cause us to divert resources from other aspects of our business, all of which may adversely affect our results from operations. Further, any inability to adequately address privacy concerns in connection with our SaaS solutions, or comply with applicable privacy or data protection laws, regulations and policies, could result in additional cost and liability to us, and adversely affect our ability to offer SaaS solutions.
Anticipated further evolution of regulations on this topic may substantially increase the penalties to which we could be subject in the event of any non-compliance. We may incur substantial expense in complying with the new obligations to be imposed by new regulations and we may be required to make significant changes to our solutions and expanding business operations, all of which may adversely affect our results of operations.
If tax laws change or we experience adverse outcomes resulting from examination of our income tax returns, it could adversely affect our results of operations.
We are subject to federal, state and local income taxes in the United States and in foreign jurisdictions. Our future effective tax rates and the value of our deferred tax assets could be adversely affected by changes in tax laws, including impacts of the Tax Cuts and Jobs Act of Public Law No. 115-97 and the Coronavirus Aid, Relief, and Economic Security Act (“CARES Act”), the consequences of which have not yet been fully determined. In addition, we are subject to the examination of our income tax returns by the Internal Revenue Service and other tax authorities. We regularly assess the likelihood of adverse outcomes resulting from such examinations to determine the adequacy of our provision for income taxes. Significant judgment is required in determining our worldwide provision for income taxes. Although we believe we have made appropriate provisions for taxes in the jurisdictions in which we operate, changes in the tax laws or challenges from tax authorities under existing tax laws could adversely affect our business, financial condition and results of operations.
Uncertainty in the marketplace regarding the use of Internet users’ personal information, or legislation limiting such use, could reduce demand for our services and result in increased expenses.
Concern among consumers and legislators regarding the use of personal information gathered from Internet users could create uncertainty in the marketplace. This could reduce demand for our services, increase the cost of doing business as a result of litigation costs or increased service delivery costs, or otherwise harm our business. Many state insurance codes limit the collection and use of personal information by insurance agencies, brokers and carriers or insurance service organizations.
Future government regulation of the Internet could place financial burdens on our businesses.
The future success of our business depends upon the continued use of the Internet as a primary medium for commerce, communication and business services. Because of the Internet’s popularity and increasing use, federal, state or foreign government bodies or agencies have adopted, and may in the future adopt, new laws or regulations affecting the use of the Internet as a commercial medium. These laws and regulations may cover issues such as the
41
collection and use of data from website visitors and related privacy issues; pricing; taxation; telecommunications over the Internet; content; copyrights; distribution; and domain name piracy. The enactment of any additional laws or regulations of the Internet, including international laws and regulations, could impede the growth of subscription revenue and place additional financial burdens on our business.
Risks Related to Our Organizational Structure
Pursuant to the Stockholders’ Agreement, Apax and Accenture control a majority of the voting power of the shares of our common stock eligible to vote in the election of our directors and on other matters submitted to a vote of our stockholders, and Apax’s and Accenture’s interests may conflict with minority stockholders’ in the future.
Pursuant to the Stockholders’ Agreement, dated as of August 14, 2020, among us, Apax and Accenture (the “Stockholders’ Agreement”) we are required to take all necessary action to cause our board of directors to include individuals designated by Apax and Accenture pursuant to certain ownership thresholds. Apax and Accenture, individually, are required to vote all of their shares, and take all other necessary actions, to cause our board of directors to include the individuals designated as directors by Apax and Accenture (as applicable). Accordingly, Apax and Accenture currently control a majority of the voting power of the shares of our common stock eligible to vote in the election of our directors and on other matters submitted to a vote of our stockholders, and Apax and Accenture are able to control the outcome of matters submitted to a stockholder vote. Even if Apax and Accenture collectively cease to own shares of our common stock representing a majority of the total voting power, for so long as Apax and Accenture continue to own a significant percentage of our common stock, Apax and Accenture, through their collective voting power and certain protective provisions, will still be able to significantly influence the composition of our board of directors and the approval of actions requiring stockholder approval. For example, each of Apax and Accenture will have certain consent rights so long as such stockholder owns at least 5% of the outstanding equity securities of the Company that are not shares of our common stock awarded under the 2020 Omnibus Incentive Plan or other incentive equity plan. Accordingly, for such period of time, Apax and Accenture will have significant influence with respect to our management, business plans, and policies, including the appointment and removal of our officers. In particular, Apax and Accenture are able to cause or prevent a change of control of us or a change in composition of our board of directors and could preclude any unsolicited acquisition of us. The concentration of voting power could deprive minority stockholders of an opportunity to receive a premium for their shares of common stock as part of the sale of us and ultimately might affect the market price of our common stock.
If the ownership of our common stock continues to be highly concentrated, it may prevent you and other minority stockholders from influencing significant corporate decisions and may result in conflicts of interest.
Apax owns approximately 33.1% of our common stock and Accenture owns approximately 22.1% of our common stock. This concentration of ownership may delay, deter or prevent acts that would be favored by our other stockholders. The interests of Apax may not always coincide with our interests or the interests of our other stockholders. For example, Apax exercises significant influence over all matters requiring a stockholder vote, including: the election of directors; mergers, consolidations and acquisitions; the sale of all or substantially all of our assets and other decisions affecting our capital structure; the amendment of our amended and restated certificate of incorporation and our amended and restated bylaws; and our winding up and dissolution. This concentration of ownership may also have the effect of delaying, preventing or deterring a change in control of us. Also, Apax may seek to cause us to take courses of action that, in its judgment, could enhance its investment in us, but which might involve risks to our other stockholders or adversely affect us or our other stockholders. As a result, the market price of our common stock could decline or stockholders might not receive a premium over the then-current market price of our common stock upon a change in control. In addition, this concentration of share ownership may adversely affect the trading price of our common stock because investors may perceive disadvantages in owning shares in a company with significant stockholders.
42
Certain provisions of Delaware Law, the Stockholders’ Agreement, our amended and restated certificate of incorporation and our amended and restated bylaws could hinder, delay or prevent a change in control of us, which could adversely affect the price of our common stock.
Certain provisions of Delaware Law, the Stockholders’ Agreement, our amended and restated certificate of incorporation and our amended and restated bylaws contain provisions that could make it more difficult for a third-party to acquire us without the consent of our board of directors, Apax or Accenture.
As a Delaware corporation, we are subject to provisions of Delaware law, including Section 203 of the Delaware General Corporation Law, as amended (the “DGCL”), which prevents some stockholders holding more than 15% of our outstanding common stock from engaging in certain business combinations without approval of the holders of substantially all of our outstanding common stock. Furthermore, pursuant to the Stockholders’ Agreement, Apax and Accenture currently control a majority of the voting power of the shares of our common stock eligible to vote in the election of our directors and on other matters submitted to a vote of our stockholders, and Apax and Accenture are able to control the outcome of matters submitted to a stockholder vote. Even if, following completion of this offering, Apax and Accenture collectively cease to own shares of our common stock representing a majority of the total voting power, for so long as Apax and Accenture continue to own a significant percentage of our common stock, Apax and Accenture, through their collective voting power and certain protective provisions, will still be able to significantly influence the composition of our board of directors and the approval of actions requiring stockholder approval.
In addition, under our amended and restated certificate of incorporation, our board of directors has the authority to cause the issuance of preferred stock from time to time in one or more series and to establish the terms, preferences and rights of any such series of preferred stock, all without approval of our stockholders. Nothing in our amended and restated certificate of incorporation precludes future issuances without stockholder approval of the authorized but unissued shares of our common stock. Further, our amended and restated certificate of incorporation provides for a staggered board of directors and does not provide for cumulative voting in the election of our directors and our amended and restated certificate of incorporation and our amended and restated bylaws do not permit our stockholders to call special meetings. These factors could have the effect of making the replacement of incumbent directors more time consuming and difficult.
These provisions may make it difficult and expensive for a third party to pursue a tender offer, change in control or takeover attempt that is opposed by Apax, Accenture, our management or our board of directors. Public stockholders who might desire to participate in these types of transactions may not have an opportunity to do so, even if the transaction is favorable to stockholders. These anti-takeover provisions could substantially impede the ability of public stockholders to benefit from a change in control or change our management and board of directors and, as a result, may adversely affect the market price of our common stock and stockholders’ ability to realize any potential change of control premium.
Certain of our stockholders have the right to engage or invest in the same or similar businesses as us.
Apax and Accenture each engage in other investments and business activities in addition to their ownership of us. Under our amended and restated certificate of incorporation, Apax and Accenture each have the right, and have no duty to abstain from exercising such right, to engage or invest in the same or similar businesses as us, do business with any of our customers or vendors, or employ or otherwise engage any of our officers, directors or employees. If Apax, Accenture or any of their respective officers, directors or employees acquire knowledge of a potential transaction that could be a corporate opportunity, they have no duty, to the fullest extent permitted by law, to offer such corporate opportunity to us, our stockholders or our affiliates.
In the event that any of our directors and officers who is also a director, officer or employee of Apax or Accenture acquires knowledge of a corporate opportunity or is offered a corporate opportunity, provided that this knowledge was not acquired solely in such person’s capacity as our director or officer and such person acts in good faith to the fullest extent permitted by law, then even if Apax or Accenture pursues or acquires the corporate opportunity or if Apax or Accenture does not present the corporate opportunity to us, such person is deemed to have fully satisfied such person’s fiduciary duties owed to us and is not liable to us.
43
Risks Related to Ownership of Our Common Stock
An active trading market for our common stock may not be sustained.
Prior to the IPO, there was no public market for our common stock. Although our stock is listed on Nasdaq, an active trading market for our common stock may not be sustained. Accordingly, if an active trading market for our common stock or is not maintained, the liquidity of our common stock, our stockholders ability to sell their shares of common stock when desired and the prices that our stockholders may obtain for their shares of common stock will be adversely affected. Additionally, certain of our pre-IPO investors may continue to hold a large portion of our publicly traded common stock, which may inhibit the maintenance of an active trading market. An inactive trading market may also impair our ability to raise capital to continue to fund operations by selling shares and may impair our ability to acquire other companies or technologies by using our shares as consideration.
The market price and trading volume of our common stock may be volatile, which could result in rapid and substantial losses for our stockholders.
The market price of our common stock may be highly volatile and could be subject to wide fluctuations. In addition, the trading volume in our common stock may fluctuate and cause significant price variations to occur. If the market price of our common stock declines significantly, stockholders’ may be unable to resell their shares at or above their purchase price, if at all. The market price of our common stock may fluctuate or decline significantly in the future. Some of the factors that could negatively affect our share price or result in fluctuations in the price or trading volume of our common stock include:
|
|
• |
variations in our quarterly or annual operating results; |
|
|
• |
our ability to attract new customers, particularly larger customers, in both domestic and international markets and our ability to increase sales to and renew agreements with our existing customers, particularly larger customers, at comparable prices; |
|
|
• |
the timing of our customers’ buying decisions and reductions in our customers’ budgets for IT purchases and delays in their purchasing cycles, particularly in light of recent adverse global economic conditions; |
|
|
• |
changes in our earnings estimates (if provided) or differences between our actual financial and operating results and those expected by investors and analysts; |
|
|
• |
the contents of published research reports about us or our industry or the failure of securities analysts to cover our common stock; |
|
|
• |
additions to, or departures of, key management personnel; |
|
|
• |
any increased indebtedness we may incur in the future; |
|
|
• |
announcements and public filings by us or others and developments affecting us; |
|
|
• |
actions by institutional stockholders; |
|
|
• |
litigation and governmental investigations; |
|
|
• |
operating and stock performance of other companies that investors deem comparable to us (and changes in their market valuations) and overall performance of the equity markets; |
|
|
• |
speculation or reports by the press or investment community with respect to us or our industry in general; |
|
|
• |
increases in market interest rates that may lead purchasers of our shares to demand a higher yield; |
|
|
• |
announcements by us or our competitors of significant contracts, acquisitions, dispositions, strategic relationships, joint ventures or capital commitments; |
44
|
|
• |
sales of substantial amounts of our common stock by Apax or other significant stockholders or our insiders, or the expectation that such sales might occur; |
|
|
• |
volatility or economic downturns in the markets in which we, our customers and our SI partners are located caused by pandemics, including the COVID-19 pandemic, and related policies and restrictions undertaken to contain the spread of such pandemics or potential pandemics; and |
|
|
• |
general market, political and economic conditions, in the insurance industry in particular, including any such conditions and local conditions in the markets in which any of our customers are located. |
These broad market and industry factors may decrease the market price of our common stock, regardless of our actual operating performance. The stock market in general has from time to time experienced extreme price and volume fluctuations, including in recent months. In addition, in the past, following periods of volatility in the overall market and the market price of a company’s securities, securities class action litigation has often been instituted against these companies. This litigation, if instituted against us, could result in substantial costs and a diversion of our management’s attention and resources.
Future offerings of debt or equity securities by us may materially adversely affect the market price of our common stock
In the future, we may attempt to obtain financing or to further increase our capital resources by issuing additional shares of our common stock or offering debt or other equity securities, including senior or subordinated notes, debt securities convertible into equity or shares of preferred stock. In addition, we may seek to expand operations in the future to other markets which we would expect to finance through a combination of additional issuances of equity, corporate indebtedness and/or cash from operations.
Issuing additional shares of our common stock or other equity securities or securities convertible into equity may dilute the economic and voting rights of our existing stockholders or reduce the market price of our common stock or both. Upon liquidation, holders of such debt securities and preferred shares, if issued, and lenders with respect to other borrowings would receive a distribution of our available assets prior to the holders of our common stock. Debt securities convertible into equity could be subject to adjustments in the conversion ratio pursuant to which certain events may increase the number of equity securities issuable upon conversion. Preferred shares, if issued, could have a preference with respect to liquidating distributions or a preference with respect to dividend payments that could limit our ability to pay dividends to the holders of our common stock. Our decision to issue securities in any future offering will depend on market conditions and other factors beyond our control, which may adversely affect the amount, timing or nature of our future offerings. Thus, holders of our common stock bear the risk that our future offerings may reduce the market price of our common stock and dilute their stockholdings in us.
We also have an aggregate of 169,286,255 shares of common stock authorized but unissued and not reserved for issuance under our incentive plans. We may issue all of the shares of common stock without any approval by our stockholders, subject to certain exceptions. Any common stock issued in connection with our incentive plans, the exercise of outstanding stock options or otherwise would dilute the percentage ownership held by stockholders.
We are a “controlled company” within the meaning of the corporate governance standards of Nasdaq. As a result, we qualify for, and rely on, exemptions from certain corporate governance standards. Investors do not have the same protections afforded to stockholders of companies that are subject to all corporate governance requirements of Nasdaq.
Pursuant to the Stockholders’ Agreement, Apax and Accenture control a majority of the voting power of shares of common stock eligible to vote in the election of our directors. As a result, we are a “controlled company” within the meaning of the corporate governance standards of Nasdaq. As a controlled company, we qualify for, and rely on, exemptions from certain corporate governance requirements, including the requirement that a majority of our board of directors consists of “independent directors,” as defined under the rules of Nasdaq.
These requirements do not apply to us as long as we remain a controlled company. We have also elected to not have our nominating and corporate governance and compensation committees consist entirely of independent directors and we are not required to have annual performance evaluations of these committees. Accordingly, because
45
we have elected not to comply with all of the corporate governance requirements, investors do not have the same protections afforded to stockholders of companies that are subject to all of the corporate governance requirements of Nasdaq.
The market price of our common stock could be negatively affected by sales of substantial amounts of our common stock in the public markets.
There are 130,713,745 shares of common stock outstanding. Of our issued and outstanding shares, only the 17,250,000 shares of common stock sold in the IPO are freely transferable, except for any shares held by our “affiliates,” as that term is defined in Rule 144 under the Securities Act (“Rule 144”). The sale by Apax or Accenture of a substantial number of shares, or a perception that such sales could occur, could significantly reduce the market price of our common stock.
In addition, the lockup agreements signed by our executive officers, directors, Apax, Accenture and substantially all of our pre-IPO investors in connection with the IPO expire on February 9, 2021, after which a substantial portion of outstanding common stock will be eligible for resale.
In addition, pursuant to the Registration Rights Agreement, Apax, Accenture and certain of our other pre-IPO investors and their respective affiliates and permitted third-party transferees have the right, in certain circumstances, to require us to register their approximately 105,576,605 shares of our common stock under the Securities Act for sale into the public markets. Upon the effectiveness of such a registration statement, all shares covered by the registration statement will be freely transferable. See “Item 13. Certain relationships and related party transactions - Registration Rights Agreement.”
The market price of our common stock may decline significantly when the restrictions on resale by our existing stockholders lapse. A decline in the price of our common stock might impede our ability to raise capital through the issuance of additional common stock or other equity securities.
If securities or industry analysts do not publish research or reports about our business or publish negative reports, our stock price could decline.
The trading market for our common stock is influenced by the research and reports that industry or securities analysts publish about us or our business. If one of more of these analysts ceases coverage of our company or fails to publish reports on us regularly, we could lose visibility in the financial markets, which in turn could cause our stock price or trading volume to decline. Moreover, if one or more of the analysts who cover our company downgrades our common stock or if our reporting results do not meet their expectations, our stock price could decline.
46
We are an “emerging growth company,” and the reduced disclosure requirements applicable to emerging growth companies may make our common stock less attractive to investors.
We are an “emerging growth company,” as defined in the JOBS Act and may remain an emerging growth company for up to four more years. For so long as we remain an emerging growth company, we are permitted and currently rely on exemptions from certain disclosure requirements that are applicable to other public companies that are not emerging growth companies. These exemptions include not being required to comply with the auditor attestation requirements of Section 404 of the Sarbanes-Oxley Act, not being required to comply with any requirement that may be adopted by the Public Company Accounting Oversight Board (“PCAOB”) regarding mandatory audit firm rotation or a supplement to the auditor’s report providing additional information about the audit and the financial statements, reduced disclosure obligations regarding executive compensation, and exemptions from the requirements of holding a nonbinding advisory vote on executive compensation and stockholder approval of any golden parachute payments not previously approved. As a result, the information we provide stockholders will be different than the information that is available with respect to other public companies. In this Annual Report on Form 10-K, we have not included all of the executive compensation related information that would be required if we were not an emerging growth company. As a result, the information we provide stockholders will be different than the information that is available with respect to other public companies. We cannot predict whether investors find our common stock less attractive because we rely on these exemptions. If some investors find our common stock less attractive as a result, there may be a less active trading market for our common stock, and our stock price may be more volatile.
We have not paid dividends in the past and do not anticipate paying any dividends on our common stock in the foreseeable future.
We have never paid cash dividends on our common stock and have no plans to pay regular dividends on our common stock in the foreseeable future. Any declaration and payment of future dividends to holders of our common stock will be at the sole discretion of our board of directors and will depend on many factors, including our financial condition, earnings, capital requirements, level of indebtedness, statutory and contractual restrictions applying to the payment of dividends and other considerations that our board of directors deems relevant. Because we are a holding company and have no direct operations, we will only be able to pay dividends from our available cash on hand and any funds we receive from our subsidiaries. Certain of our debt agreements limit the ability of certain of our subsidiaries to pay dividends. In addition, Delaware law may impose requirements that may restrict our ability to pay dividends. Until such time that we pay a dividend, our investors must rely on sales of their common stock after price appreciation, which may never occur, as the only way to realize any future gains on their investment.
Our amended and restated certificate of incorporation provides that, unless we consent in writing to the selection of an alternative forum, the Court of Chancery of the State of Delaware will be the sole and exclusive forum for certain stockholder litigation matters, which could discourage stockholder lawsuits or limit our stockholders’ ability to bring a claim in any judicial forum that they find favorable for disputes with us or our officers and directors.
Pursuant to our amended and restated certificate of incorporation, unless we consent in writing to the selection of an alternative forum, the Court of Chancery of the State of Delaware will be the sole and exclusive forum for (i) any derivative action or proceeding brought on our behalf, (ii) any action asserting a claim of breach of a duty (including any fiduciary duty) owed by any current or former director, officer, stockholder, employee or agent of the Company or our stockholders, (iii) any action asserting a claim arising pursuant to any provision of the DGCL, our amended and restated certificate of incorporation or our amended and restated bylaws or (iv) any action asserting a claim governed by the internal affairs doctrine, in each case, subject to the Court of Chancery having personal jurisdiction over the indispensable party named as a defendant therein. If the Court of Chancery of the State of Delaware does not have jurisdiction, the sole and exclusive forum for such action or proceeding shall be another state or federal court located in the State of Delaware.
47
Our amended and restated certificate of incorporation and bylaws further provide that any person or entity purchasing, otherwise acquiring or holding any interest in shares of our capital stock will be deemed to have notice of and consented to the forum selection clause. The forum selection clause in our amended and restated certificate of incorporation may have the effect of discouraging stockholder lawsuits or limiting our stockholders’ ability to bring a claim in any judicial forum that they find favorable for disputes with us or our officers and directors.
We are incurring increased costs as a result of operating as a public company, and our management is being required to devote substantial time to new compliance initiatives and corporate governance practices. We may fail to comply with the rules that apply to public companies, including Section 404 of the Sarbanes-Oxley Act, which could result in sanctions or other penalties that would harm our business.
As a public company, and particularly after we are no longer an “emerging growth company,” we have begun to incur significant legal, accounting, and other expenses that we did not incur as a private company, including costs resulting from public company reporting obligations under the Securities Act, or the Securities Exchange Act of 1934, as amended (the “Exchange Act”), and regulations regarding corporate governance practices. The Sarbanes-Oxley Act, the Dodd-Frank Wall Street Reform and Consumer Protection Act, the rules of the SEC, the listing requirements of Nasdaq, and other applicable securities rules and regulations impose various requirements on public companies, including establishment and maintenance of effective disclosure and financial controls and corporate governance practices. We have begun to hire additional accounting, finance, and other personnel in connection with our becoming, and our efforts to comply with the requirements of being, a public company, and our management and other personnel will need to devote a substantial amount of time towards maintaining compliance with these requirements. These requirements will increase our legal and financial compliance costs and will make some activities more time-consuming and costly. We are currently evaluating these rules and regulations and cannot predict or estimate the amount of additional costs we may incur or the timing of such costs. These rules and regulations are often subject to varying interpretations, in many cases due to their lack of specificity, and, as a result, their application in practice may evolve over time as new guidance is provided by regulatory and governing bodies. This could result in continuing uncertainty regarding compliance matters and higher costs necessitated by ongoing revisions to disclosure and governance practices. We cannot predict or estimate the amount of additional costs we will incur as a result of becoming a public company or the timing of such costs. Any changes we make to comply with these obligations may not be sufficient to allow us to satisfy our obligations as a public company on a timely basis, or at all. These reporting requirements, rules and regulations, coupled with the increase in potential litigation exposure associated with being a public company, could also make it more difficult for us to attract and retain qualified persons to serve on our board of directors or board committees or to serve as executive officers, or to obtain certain types of insurance, including directors’ and officers’ insurance, on acceptable terms.
Pursuant to Sarbanes-Oxley Act Section 404, we will be required to furnish a report by our management on our internal control over financial reporting beginning with our second filing of an Annual Report on Form 10-K with the SEC. In order to maintain effective internal controls, we will need additional financial personnel, systems and resources. However, while we remain an emerging growth company, we will not be required to include an attestation report on internal control over financial reporting issued by our independent registered public accounting firm. To achieve compliance with Sarbanes-Oxley Act Section 404 within the prescribed period, we will be engaged in a process to document and evaluate our internal control over financial reporting, which is both costly and challenging. In this regard, we will need to continue to dedicate internal resources, potentially engage outside consultants, adopt a detailed work plan to assess and document the adequacy of internal control over financial reporting, continue steps to improve control processes as appropriate, validate through testing that controls are functioning as documented, and implement a continuous reporting and improvement process for internal control over financial reporting. Despite our efforts, there is a risk that we will not be able to conclude, within the prescribed timeframe or at all, that our internal control over financial reporting is effective as required by Sarbanes-Oxley Act Section 404. If we identify one or more material weaknesses, it could result in an adverse reaction in the financial markets due to a loss of confidence in the reliability of our financial statements.
48
To date, we have not conducted a review of our internal controls for the purpose of providing the reports required by these rules. During the course of our review and testing, we have in the past and may in the future, identify deficiencies and be unable to remediate them before we must provide the required reports. Furthermore, if we have a material weakness in our internal control over financial reporting, we may not detect errors on a timely basis and our financial statements may be materially misstated. We or our independent registered public accounting firm may not be able to conclude on an ongoing basis that we have effective internal control over financial reporting, which could harm our operating results, cause investors to lose confidence in our reported financial information and cause the trading price of our stock to fall. In addition, as a public company we will be required to file accurate and timely quarterly and annual reports with the SEC under the Securities Act or the Exchange Act. Any failure to report our financial results on an accurate and timely basis could result in sanctions, lawsuits, delisting of our shares from Nasdaq or other adverse consequences that would materially harm our business and reputation.
Item 1B. Unresolved Staff Comments.
None.
Our principal executive offices are located in 30,000 square feet of leased office space at 22 Boston Wharf Road, Boston, MA, pursuant to a lease that expires in 2028. We lease an aggregate of 160,000 square feet for our offices in Barcelona, Spain; Basking Ridge, New Jersey; Bolivar, Missouri; Chandigarh, India; Chennai, India; Columbia, South Carolina; London, United Kingdom; Mumbai, India; Portsmouth, New Hampshire; Rosemont, Illinois; and Sydney, Australia, pursuant to leases that expire between 2021 and 2027. We do not own any real property. We believe that our current facilities are adequate for our present needs and suitable additional facilities will be available as needed on commercially reasonable terms.
49
In the ordinary course of conducting our business, we have in the past and may in the future become involved in various legal actions and other claims. We may also become involved in other judicial, regulatory and arbitration proceedings concerning matters arising in connection with the conduct of our businesses. Some of these matters may involve claims of substantial amounts. These legal proceedings may be subject to many uncertainties and there can be no assurance of the outcome of any individual proceedings. We do not presently anticipate any material legal proceedings that, if determined adversely to us, would have a material adverse effect on our financial position, results of operations or cash flows.
Item 4. Mine Safety Disclosures.
Not applicable.
50
Item 5. Market for Registrant’s Common Equity, Related Stockholder Matters and Issuer Purchases of Equity Securities.
Our common stock began trading on the Nasdaq Global Select Market under the symbol “DCT” on August 14, 2020. Prior to that date, there was no public trading market for our common stock.
On August 31, 2020, the last reported sale price of our common stock on the Nasdaq Global Select Market was $38.99 per share. As of August 31, 2020, we had 186 holders of record of our common stock. The actual number of stockholders is greater than this number of record holders, and includes stockholders who are beneficial owners, but whose shares are held in street name by brokers and other nominees. This number of holders of record also does not include stockholders whose shares may be held in trust by other entities.
Dividend Policy
We have never paid cash dividends on our common stock and have no plans to pay regular dividends on our common stock in the foreseeable future. Any declaration and payment of future dividends to holders of our common stock will be at the sole discretion of our board of directors and will depend on many factors, including our financial condition, earnings, capital requirements, level of indebtedness, statutory and contractual restrictions applying to the payment of dividends and other considerations that our board of directors deems relevant. Because we are a holding company and have no direct operations, we will only be able to pay dividends from our available cash on hand and any funds we receive from our subsidiaries. Certain of our debt agreements limit the ability of certain of our subsidiaries to pay dividends. In addition, Delaware law may impose requirements that may restrict our ability to pay dividends.
Performance Graph
This performance graph shall not be deemed “soliciting material” or to be “filed” with the SEC for purposes of Section 18 of the Exchange Act or otherwise subject to the liabilities under that Section, and shall not be deemed to be incorporated by reference into any of our filings under the Securities Act of 1933, as amended (the “Securities Act”) or the Exchange Act.
The following graph shows a comparison of the cumulative total return for our common stock, the Nasdaq Composite-Total Return Index and S&P Software & Services Select Industry Index for the period from August 14, 2020 through August 31, 2020. Such returns are based on historical results and are not intended to suggest future performance. Data for the Nasdaq Composite Total Return Index and S&P Software & Services Select Industry Index assume reinvestment of dividends.
51
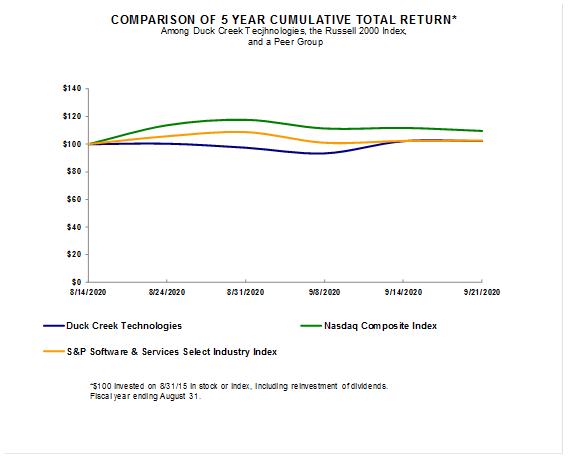
Unregistered Sales of Equity Securities
In November 2019, in connection with its formation, the Company sold 1 share of common stock to Disco (Cayman) Acquisition Co. for nominal consideration. The shares of common stock described above were issued in reliance on the exemption contained in Section 4(a)(2) of the Securities Act on the basis that the transactions did not involve a public offering. No underwriters were involved in the sale.
In connection with the Reorganization Transactions (as defined below), the Company issued 117,851,830 shares of common stock in consideration for equity interests of Disco Topco Holdings (Cayman), L.P . (“the Operating Partnership”), Such shares of common stock were issued in reliance on the exemption contained in Section 4(a)(2) of the Securities Act on the basis that the transactions did not involve a public offering. No underwriters were included in such issuances.
Use of Proceeds from Registered Securities
On August 13, 2020, our registration statement on Form S-1 (File No. 333-240050), relating to the IPO of common stock, became effective. The IPO closed on August 18, 2020 at which time we issued 17,250,000 shares of common stock at a public offering price of $27.00 per share. We received net proceeds from the IPO of approximately $429.2 million, after deducting the underwriting discounts and commissions of $29.1 million and estimated offering related expenses of $7.4 million.
To date we have used the net proceeds we received from the IPO as follows: (i) $43.1 million of the net proceeds that we received from the IPO to redeem all of the outstanding limited partnership units (the “LP Units”) of
52
the Operating Partnership retained by certain of the pre-IPO investors, after giving effect to the contributions that were part of the IPO Reorganization Transactions (as defined below), which included $43.1 million paid to Accenture at a redemption price per LP Unit equal to the IPO price of the IPO after deducting underwriting discounts and commissions paid by us; (ii) $64.7 million of the net proceeds that we received from the IPO to repurchase from Apax a portion of the shares of common stock received by Apax in the IPO at a repurchase price per share equal to the IPO price of the IPO after deducting underwriting discounts and commissions paid by us; and (iii) $6.5 million of net proceeds that we received from the IPO to cash settle outstanding equity awards of certain international employees.
Goldman Sachs & Co. LLC, J.P. Morgan Securities LLC and BofA Securities, Inc. acted as joint book-running managers for the offering.
There has been no material change in the planned use of proceeds from the IPO from that described in the prospectus filed with the SEC pursuant to Rule 424(b)(4) under the Securities Act on August 18, 2020.
Issuer Purchases of Equity Securities
The table below sets forth information regarding our purchases of our common stock made during the fourth fiscal quarter ended August 31, 2020.
|
|
|
Total Number of Shares Purchased |
|
|
Average Price Paid per Share |
|
Total Number of Shares Purchased as Part of Publicly Announced Plans or Programs |
|
Maximum Number (or Approximate Dollar Value) of Shares that May Yet Be Purchased Under the Plans or Programs |
|
|
June 1, 2020—August 31, 2020 |
|
|
2,555,556 |
|
|
25.31 |
|
— |
|
— |
|
Total |
|
|
2,555,556 |
|
|
25.31 |
|
— |
|
— |
Item 6. Selected Financial Data.
The following table presents our selected consolidated financial data for the periods and as of the dates indicated.
The selected consolidated statement of operations for the years ended August 31, 2020, 2019 and 2018 and the selected consolidated balance sheet data as of August 31, 2020 and 2019 have been derived from our audited financial statements included elsewhere in this Annual Report on Form 10-K. Our historical results for any prior period are not necessarily indicative of results to be expected in any future period. You should read the selected financial data presented below in conjunction with the information included under the heading “Item 7 - Management’s Discussion and Analysis of Financial Condition and Results of Operations” and the financial statements and the related notes included elsewhere in this Annual Report on Form 10-K.
53
|
|
|
Year Ended August 31, |
|
|||||||||
|
($ in thousands) |
|
2020 |
|
|
2019 |
|
|
2018 |
|
|||
|
Consolidated Statements of Operations Data |
|
|
|
|
|
|
|
|
|
|
|
|
|
Total revenue |
|
$ |
211,672 |
|
|
$ |
171,273 |
|
|
$ |
159,669 |
|
|
Total cost of revenue |
|
|
97,175 |
|
|
|
72,178 |
|
|
|
64,332 |
|
|
Total operating expenses |
|
|
143,152 |
|
|
|
113,246 |
|
|
|
101,685 |
|
|
Loss from operations |
|
|
(28,655 |
) |
|
|
(14,151 |
) |
|
|
(6,348 |
) |
|
Other expense, net |
|
|
641 |
|
|
|
(565 |
) |
|
|
(533 |
) |
|
Interest expense, net |
|
|
(356 |
) |
|
|
(1,030 |
) |
|
|
(567 |
) |
|
Loss before income taxes |
|
|
(28,370 |
) |
|
|
(15,746 |
) |
|
|
(7,448 |
) |
|
Provision for income taxes |
|
|
1,562 |
|
|
|
1,150 |
|
|
|
354 |
|
|
Net loss |
|
$ |
(29,932 |
) |
|
$ |
(16,896 |
) |
|
$ |
(7,802 |
) |
|
Consolidated Balance Sheets Data (at period end) |
|
|
|
|
|
|
|
|
|
|
|
|
|
Cash and cash equivalents |
|
|
389,878 |
|
|
$ |
11,999 |
|
|
$ |
13,879 |
|
|
Total current assets |
|
|
449,334 |
|
|
|
58,514 |
|
|
|
49,100 |
|
|
Total assets |
|
|
861,100 |
|
|
|
467,277 |
|
|
|
449,237 |
|
|
Total current liabilities |
|
|
97,713 |
|
|
|
59,890 |
|
|
|
41,382 |
|
|
Total liabilities |
|
|
127,343 |
|
|
|
78,211 |
|
|
|
47,370 |
|
|
Total stockholder's equity/redeemable partners’ interest |
|
|
733,757 |
|
|
|
389,066 |
|
|
|
401,867 |
|
54
Item 7. Management’s Discussion and Analysis of Financial Condition and Results of Operations.
The following discussion and analysis of our financial condition and results of operations should be read together with our consolidated financial statements and related notes included elsewhere in this Annual Report on Form 10-K. This discussion contains forward-looking statements that involve risks and uncertainties. Our actual results could differ materially from the forward-looking statements included herein. Factors that could cause or contribute to such differences include, but are not limited to, those identified below and those discussed in the section entitled “Risk Factors” and elsewhere in this Annual Report on Form 10-K.
Overview
We are the leading SaaS provider of core systems for the P&C insurance industry. We have achieved our leadership position by combining over twenty years of deep domain expertise with the differentiated SaaS capabilities and low-code configurability of our technology platform. We believe we are the first company to provide carriers with an end-to-end suite of enterprise-scale core system software that is purpose-built as a SaaS solution. Our product portfolio is built on our modern technology foundation, the Duck Creek Platform, and works cohesively to improve the operational efficiency of carriers’ core processes (policy administration, claims management and billing) as well as other critical functions. The Duck Creek Platform enables our customers to be agile and rapidly capitalize on market opportunities, while reducing their total cost of technology ownership.
Our deep understanding of the P&C insurance industry has enabled us to develop a single, unified suite of insurance software products that is tailored to address the key challenges faced by carriers. Our solutions promote carriers’ nimbleness by enabling rapid integration and streamlining the ability to capture, access and utilize data more effectively. The Duck Creek Suite includes several products that support the P&C insurance process lifecycle, such as:
|
|
• |
Duck Creek Policy: enables carriers to develop and launch new insurance products and manage all aspects of policy administration, from product definition to quoting, binding and servicing |
|
|
• |
Duck Creek Billing: supports fundamental payment and invoicing capabilities (such as billing and collections, commission processing, disbursement management and general ledger capabilities) for all insurance lines and bill types |
|
|
• |
Duck Creek Claims: supports the entire claims lifecycle from first notice of loss through investigation, payments, negotiations, reporting and closure |
In addition, we offer other innovative solutions, such as Duck Creek Rating, Duck Creek Insights, Duck Creek Digital Engagement, Duck Creek Distribution Management, Duck Creek Reinsurance Management, Duck Creek Anywhere Managed Integrations and Duck Creek Industry Content, which provide additional features and functionalities that further help our customers meet the increasing and evolving demands of the P&C industry. Our customers purchase and deploy Duck Creek OnDemand, our SaaS solution, either individually or as a suite.
We sell our SaaS solutions through recurring fee arrangements where revenue is recognized on a monthly basis following deployment to the customer, which we refer to as subscription revenue. Substantially all of our new bookings come from the sale of SaaS subscriptions of Duck Creek OnDemand. For the years ended August 31, 2020, 2019 and 2018, SaaS ACV bookings represented 96%, 86% and 71% of our total ACV bookings, respectively. Historically, we have also sold our products through perpetual and term license arrangements, most commonly installed on-premise, where license revenue is typically recognized in full upon delivery of the software to the customer. We generally price our SaaS and license arrangements at individually negotiated rates based on the amount of a customer’s DWP that will be managed by our solutions with pre-determined fee adjustments as the customer’s DWP increases over the term of the contract, which typically ranges from three to seven years for our SaaS arrangements. We typically invoice our customers monthly, in advance, for SaaS fees whereas our term licenses are typically invoiced annually, in advance. The total cost of a perpetual license is billed in full upon contract signing.
55
We also derive revenue from maintenance and support services on our perpetual and term license products (primarily software updates, rights to unspecified software upgrades on a when-and-if-available basis and remote support services). We recognize revenue on a monthly basis as maintenance and support services are provided to customers. We generate revenue by providing professional services for both our SaaS solutions and perpetual and term license products (primarily related to implementation services) to the extent requested by our customers. The vast majority of our professional services revenue is recognized on a time and materials basis as the work is delivered to our customers. Our customers may also choose to obtain implementation services through our network of third-party SI partners who provide implementation and other related services to our customers. Our partnerships with leading SIs allow us to grow our business more efficiently by giving us scale to service our growing customer base. We continue to grow our services organization, including increasing the number of qualified consultants we employ and investing time and resources to develop relationships with new SI partners in existing and new markets.
We sell our products and services to a wide variety of carriers, including many of the largest and most recognizable brands in the P&C insurance industry, as well as smaller national and regional carriers. Our direct sales team focuses on obtaining new customers, which includes carriers that currently operate internally developed or competing systems, as well as selling into our existing customer base, which includes marketing our SaaS solutions to our term and perpetual license customers to drive adoption of our SaaS solutions and cross-selling additional applications. We are committed to continued training and development in order to increase the productivity of our sales team, with regional sales centers in North America, Europe and Australia. Our sales team is complemented by our partnerships with third-party partners, including leading SIs and solution partners. These partners provide additional market validation to our offerings, enhance our sales force through co-marketing efforts and offer greater speed and efficiency of implementation capabilities and related services to our customers. We also engage in a variety of traditional and online marketing activities designed to provide sales support and build brand recognition and enhance our reputation as an industry leader.
We believe our strong customer relationships are a result of our ability to develop innovative technology and incorporate our deep domain expertise into products that serve mission critical functions in our customers’ day-to-day operations. We have over 150 insurance customers, of which over 60 have purchased one or more of our SaaS solutions. For customer concentration purposes, customers are assessed two ways: individual entities (customers) and combining customers that are under common control (consolidated entities). We had no single customer that accounted for over 10% of our total revenue in fiscal 2020 but one consolidated entity that represented approximately 11% of our total revenue for fiscal 2020. This consolidated entity is a large multinational corporation that does business with us through multiple subsidiaries. In fiscal 2019, a single customer, State Farm, accounted for 10% of our total revenue and the same multinational corporation was the one consolidated entity that represented approximately 13% of our total revenue in fiscal 2019.
Key Factors and Trends Affecting Our Results of Operations
Increased focus on the sale of our SaaS solutions and resulting changing revenue mix. A central part of our strategy is to continue to grow our subscription revenue by signing new SaaS customers and increasing sales to our existing SaaS customers. Additionally, over time we also expect to migrate existing term and perpetual license customers to our SaaS solutions. As a result, our software revenue mix will continue to change over time as the portion of license revenue (primarily recognized up-front) decreases and the portion of subscription revenue (recognized monthly) increases, which may make our results in any one period difficult to compare to any other period. For the fiscal years ended August 31, 2020, 2019 and 2018, subscription revenue was 71%, 60% and 47% of software revenue, respectively.
Continued and increased adoption of our solutions by customers. Strong customer relationships are a key driver of our success given the importance of customer references for new sales. Our long-term relationships with existing customers provide us with significant opportunities to reach customer decision-makers and sell our product offerings that address the specific customer’s needs, allowing us to recognize incremental sales with lower sales and marketing spend than for a new customer. With the continued launch of new functionality for the Duck Creek Suite, we have the opportunity to realize incremental value by selling additional functionality to customers that do not currently utilize our full product portfolio and by encouraging existing term and perpetual license customers to adopt our SaaS solutions. As we demonstrate our value to customers, we believe we will have the opportunity to sell them additional solutions. Moreover, because our products are priced on the basis of the amount of DWP generated by our customers, we expect our revenue will grow as our customers grow their businesses.
56
Timing of license revenue recognition and changing contract terms. Because our offerings are typically priced based on a customer’s DWP, and our business relies on a relatively small number of high-value contracts, the license revenues recognized in any fiscal period in which we sign a term license with a large global carrier may be disproportionally higher than revenues recognized in a period in which we only sign term licenses with smaller carriers. We generally experience lengthy sales cycles because potential customers typically undertake a rigorous pre-purchase decision-making and evaluation process. Additionally, our license revenue may significantly increase in any given period in which a new license contract is signed. In fiscal 2018, we revised our contracting practices and began to sell our term licenses with an initial two-year committed term and optional annual renewals instead of our historical three to six year committed terms. This contracting change has impacted historical period-over-period revenue comparisons. However, because of our revenue mix shift to subscription and since our contracts going forward are expected to have initial two-year committed terms, this change is not expected to have a material impact on the comparability of our results in future periods. Our term license revenue accounted for 8%, 13%, and 17% of software revenue during fiscal 2020, 2019 and 2018, respectively.
Investment in sales and marketing organization. We plan to continue to invest in our sales and marketing efforts to grow our customer base, increase sales of additional functionality to existing customers and encourage carriers who currently operate legacy systems or use one or more of our competitor’s applications to adopt our SaaS solutions. We expect to add sales personnel and expand our marketing activities. We also intend to continue to expand our international sales and marketing organization, which we believe will be an important factor in our continued growth. Our sales and marketing expenses totaled $50.3 million, $40.2 million, and $34.2 million in fiscal 2020, 2019 and 2018, respectively. We expect sales and marketing expenses to continue to increase in absolute dollars for the foreseeable future.
Investment in SaaS operations. We will continue to invest in Duck Creek OnDemand, including through our new SaaS operations center and continued growth in the number of our cloud and SaaS operations experts, to further our goal of delivering the best experience for our SaaS customers. Personnel related costs of our SaaS operations team is the fastest growing component of our cost of subscription revenue. Our cost of subscription revenue totaled $34.9 million, $24.2 million, and $22.3 million in fiscal 2020, 2019 and 2018.
Investment in technology and research and development efforts. We are committed to continuing to deliver market-leading software to carriers and believe that maintaining our product leadership is critical to driving further revenue growth. As a result, we intend to continue to make significant investments in our research and development efforts to extend the functionality and breadth of our current solutions as well as develop and launch new products and tools to address the evolving needs of the P&C insurance industry. Our research and development expenses totaled $44.1 million, $35.9 million, and $36.1 million in fiscal 2020, 2019 and 2018, respectively. We expect research and development expenses to increase in absolute dollars for the foreseeable future.
Pursuing acquisitions. We have acquired and successfully integrated several businesses complementary to our own to enhance our software and technology capabilities. We intend to continue to pursue targeted acquisitions that further complement our product portfolio or provide us access to new markets. For example, in August 2016, we acquired Agencyport Software, a provider of intuitive, digital experiences between carriers and their agents, brokers, consumers and policyholders; in January 2017, we acquired Yodil, LLC, a pioneer in insurance data management solutions; in October 2018, we acquired Outline Systems LLC, a provider of P&C distribution channel management software and longstanding member of our partner ecosystem; and in June 2019, we acquired the CedeRight Products business, a provider of reinsurance management software, from DataCede LLC. As a result of the contributions of these businesses and any future businesses we may acquire, our results of operations may not be comparable between periods. For fiscal 2020 and 2018, we did not engage in any acquisition activity. In fiscal 2019 cash consideration for acquisitions was $11.6 million.
57
Mix of Professional Services Revenue. Our professional services teams ensure the successful configuration and integration of our solutions, and provide continuous support to our customers. We recognize most of our professional services revenue during initial deployment, and recognize additional revenue for services provided over the lifetime of a customer’s use of our software. Over time, a customer’s spend on professional services decreases as a percentage of their overall spend with us. In addition, although we plan on increasing our professional services headcount in the long-term, we expect to shift an increasing percentage of implementation work to our network of third-party SIs to better enable us to meet growing market demand. As a result, we expect our overall professional services revenue to increase in absolute dollars due to the growth in the number of our SaaS customers, but to decrease as a percentage of total revenue. For the fiscal 2020, 2019 and 2018, our professional services revenue was $94.1 million, $77.7 million, and $70.2 million, respectively.
COVID-19 Expenses. In March 2020, we implemented various measures in response to the ongoing COVID-19 pandemic to ensure the safety of our employees. Over a two-day period, we shifted 100% of our employee base to work from home and suspended international and domestic travel. As a result, we experienced a decrease in our sales and marketing expenses for the year ended August 31, 2020 primarily related to a decrease in travel costs. We expect this trend to continue at least in the near term, however such savings may be offset by increased costs when employees return to work and we implement measures to ensure their safety.
Components of Results of Operations
Revenue
We generate our revenue from selling subscriptions to our SaaS solutions, licensing our term and perpetual software applications, providing maintenance and support services (primarily software updates, rights to unspecified software upgrades on a when-and-if-available basis and remote support services) to our term and perpetual license customers and providing professional services (primarily related to implementation services) to the extent requested by either our SaaS or term and perpetual license customers. We generally price our SaaS and licenses arrangements based on the amount of a customer’s DWP that will be managed by our software solutions and may include volume-based pricing for customers managing a higher amount of DWP with our solutions. Our SaaS and license contracts generally include provisions for additional fees when the amount of the customer’s DWP managed by our software solutions exceed agreed-upon caps within defined reporting periods, which are recognized on an as incurred basis. Software revenue is comprised of subscription revenue and revenue from licenses and maintenance and support services. Total revenue is comprised of software revenue plus revenue from our professional services.
Subscription
Our subscription revenue is comprised of fees from customers accessing our Duck Creek OnDemand platform and other SaaS solutions. Revenue for a reporting period is generally recognized ratably in proportion to the total contractual DWP, beginning when the service has been made available to the customer. Our subscription revenue accounted for 71%, 60% and 47% of software revenue during fiscal 2020, 2019 and 2018, respectively.
Licenses
On an increasingly limited basis, we sell licenses for our solutions on either a renewable term basis or a perpetual basis. The total contractual consideration allocated to the license is recognized as revenue upon delivery of the software to a customer, assuming all other revenue recognition criteria are satisfied. Historically, our term license contracts had terms of three to six years. We began revising our contracting practices in fiscal 2018 by selling our term licenses with an initial two-year committed term and optional annual renewals, with the revenue allocated to the initial two-year license period recognized in full upon delivery of the license. As a result of our revenue mix shift to subscription, this change is not expected to have a material impact on our results going forward. We expect volatility across quarters for our license revenue due to the timing of license sales and renewals. Our license revenue accounted for 8%, 15% and 23% of software revenue during fiscal 2020, 2019 and 2018.
Maintenance and Support
In connection with our term and perpetual license arrangements, we offer maintenance and support under renewable, fee-based contracts that include unspecified software updates and upgrades released when and if available, software patches and fixes and email and phone support. Our maintenance and support fees are typically
58
priced as a fixed percentage of the associated license fees. We recognize maintenance and support revenue from customers ratably over the committed term of the contract. Substantially all term and perpetual license customers purchase an agreement for maintenance and support. We expect to continue to generate a relatively consistent stream of revenue from the maintenance and support services we provide to our existing license customers. However, we expect revenue from maintenance and support services to decrease as a percentage of software revenue as we continue to deemphasize license sales in favor of our SaaS solutions. Our maintenance and support revenue accounted for 20%, 26% and 29% of software revenue during fiscal 2020, 2019 and 2018, respectively.
Professional Services
We offer professional services, primarily related to implementation of our products, in connection with both our SaaS solutions and software license products. The vast majority of professional services engagements are billed to customers on a time and materials basis and revenue is generally recognized upon delivery of our services. We expect our professional services revenue to grow over time in absolute dollars due to customer growth and an increasing need for implementation services, but decrease as a percentage of total revenue. We believe the rate at which we sell our software will drive a greater need for implementation services that will support both an increase in our professional services revenue and an increase in demand for the services provided by our third-party SIs. Our professional services revenue generates lower gross margins than our software revenue and accounted for 44%, 45% and 44% of our total revenue during fiscal 2020, 2019 and 2018, respectively.
Cost of Revenue
Our cost of revenue has fixed and variable components and depends on the type of revenue earned in each period. Cost of revenue includes amortization expense associated with acquired technology and other operating expenses directly related to the cost of products and services, including depreciation expense. We expect our cost of revenue to increase in absolute dollars as we continue to hire personnel, to provide hosting services, technical support and consulting services to our growing customer base.
Cost of Subscriptions
Our cost of subscription revenue is primarily comprised of cloud infrastructure costs, royalty fees paid to third parties, amortization of acquired technology intangible assets and personnel-related expenses for our SaaS operations teams, including salaries and other direct personnel-related costs.
Cost of Licenses
Our cost of license revenue is primarily comprised of royalty fees paid to third parties and amortization of acquired technology intangible assets.
Cost of Maintenance and Support
Our cost of maintenance and support revenue is comprised of personnel-related expenses for our technical support team, including salaries and other direct personnel-related costs. While we expect the cost of maintenance and support revenue will increase in the near term, it may decrease in the future if we successfully transition our term and perpetual license customers to our SaaS solutions.
Cost of Professional Services
Our cost of professional services revenue is primarily comprised of personnel-related expenses for our professional service employees and contractors, including salaries and other direct personnel-related costs.
Gross Margins
Gross margins have been and will continue to be affected by a variety of factors, including the average sales price of our products and services, DWP volume growth, the mix of revenue between SaaS solutions, software
59
licenses, maintenance and support and professional services and changes in cloud infrastructure and personnel costs. As we transition our product mix to include more SaaS customers, we expect our overall gross margin percentages to decrease in the near term due to our SaaS gross margin percentages being lower than our license gross margin percentages. Over time, we expect gross margins to increase as we onboard additional customers, achieve growth within existing customers and realize greater economies of scale.
Operating Expenses
Research and Development
Our research and development expenses consist primarily of costs incurred for personnel-related expenses for our technical staff, including salaries and other direct personnel-related costs. Additional expenses include consulting and professional fees for third-party development resources. We expect our research and development expenses to increase in absolute dollars for the foreseeable future as we continue to dedicate substantial resources to develop, improve and expand the functionality of our solutions. Costs incurred in the preliminary design and development stages of our SaaS projects are generally expensed as incurred in accordance with FASB ASC 350-40, Internal-Use Software. Once a SaaS project has reached the application development stage, certain internal, external, direct and indirect costs may be subject to capitalization. Generally, costs are capitalized until the technology is available for its intended use. Subsequent costs incurred for the development of future upgrades and enhancements, which are expected to result in additional functionality, follow the same protocol for capitalization.
Sales and Marketing Expenses
Our sales and marketing expenses consist primarily of personnel related costs for our sales and marketing functions, including salaries and other direct personnel-related costs. Additional expenses include marketing program costs, including costs related to our annual Formation conference and amortization of acquired customer relationships intangible assets. While we expect our sales and marketing expenses to increase on an absolute dollar basis in the near term as we continue to increase investments to support our growth, we also anticipate that sales and marketing expenses will remain relatively consistent as a percentage of total revenue.
General and Administrative Expenses
Our general and administrative expenses consist primarily of personnel-related costs for our executive, finance, human resources, information technology and legal functions, including salaries and other direct personnel-related costs. Additional expenses include professional fees, amortization of acquired trademarks, tradenames and domain name intangible assets, insurance and acquisition-related costs. While we expect other general and administrative expense to increase on an absolute dollar basis in the near term as we continue to increase investments to support our growth and as a result of our becoming a public company, we also anticipate that general and administrative expenses will decrease as a percentage of total revenue.
Change in Fair Value of Contingent Consideration
Certain of our acquisitions have included a component of contingent consideration to be paid to the sellers if certain performance levels are achieved by the acquired entity over a specific period of time. Contingent consideration is initially recorded at fair value on the acquisition date based, in part, on a range of estimated probabilities for achievement of these performance levels. The fair value is periodically adjusted as actual performance levels become known and updates are made to the estimated probabilities for future performance. A gain or loss is recognized in the income statement for fair value adjustments. As a result of additional acquisitions, it is possible that we will incur gains or losses in the future due to the change in the fair value of contingent consideration.
Other Income (Expense), Net
Other income (expense), net consists primarily of foreign exchange gains and losses resulting from fluctuations in foreign exchange rates on receivables and payables denominated in currencies other than the U.S. dollar.
60
Interest expense, net comprise interest expense accrued or paid on our indebtedness, net of interest income earned on our cash balances. We expect interest income (expense) to vary each reporting period depending on the amount of outstanding indebtedness, average cash balances, and prevailing interest rates.
Provision for Income Taxes
We are subject to taxes in the United States as well as other tax jurisdictions or countries in which we conduct business. Earnings from our non-U.S. activities are subject to local country income tax and may be subject to current U.S. income tax. Due to cumulative losses, we maintain a valuation allowance against our deferred tax assets, except in certain foreign subsidiaries that generate income. We consider all available evidence, both positive and negative, in assessing the extent to which a valuation allowance should be applied against our deferred tax assets. Realization of our U.S. deferred tax assets depends upon future earnings, the timing and amount of which are uncertain.
Results of Operations
Comparison of Fiscal Years Ended August 31, 2020, 2019 and 2018
The following table sets forth our consolidated results of operations for the periods indicated, expressed in total dollar terms and as a percentage of total revenue:
|
|
|
Year Ended August 31, |
|
|||||||||||||||||||||
|
(dollars in thousands) |
|
2020 |
|
|
2019 |
|
|
2018 |
|
|||||||||||||||
|
Revenue |
|
|
|
|
|
|
|
|
|
|
|
|
|
|
|
|
|
|
|
|
|
|
|
|
|
Subscription |
|
$ |
83,999 |
|
|
|
40 |
% |
|
$ |
55,909 |
|
|
|
33 |
% |
|
$ |
42,451 |
|
|
|
27 |
% |
|
License |
|
|
9,914 |
|
|
|
5 |
|
|
|
13,776 |
|
|
|
8 |
|
|
|
20,969 |
|
|
|
13 |
|
|
Maintenance and support |
|
|
23,680 |
|
|
|
11 |
|
|
|
23,896 |
|
|
|
14 |
|
|
|
26,034 |
|
|
|
16 |
|
|
Professional services |
|
|
94,079 |
|
|
|
44 |
|
|
|
77,692 |
|
|
|
45 |
|
|
|
70,215 |
|
|
|
44 |
|
|
Total revenue |
|
|
211,672 |
|
|
|
100 |
|
|
|
171,273 |
|
|
|
100 |
|
|
|
159,669 |
|
|
|
100 |
|
|
Cost of revenue |
|
|
|
|
|
|
|
|
|
|
|
|
|
|
|
|
|
|
|
|
|
|
|
|
|
Subscription |
|
|
34,902 |
|
|
|
16 |
|
|
|
24,199 |
|
|
|
14 |
|
|
|
22,272 |
|
|
|
14 |
|
|
License |
|
|
1,853 |
|
|
|
1 |
|
|
|
1,970 |
|
|
|
1 |
|
|
|
2,121 |
|
|
|
1 |
|
|
Maintenance and support |
|
|
3,338 |
|
|
|
2 |
|
|
|
2,781 |
|
|
|
2 |
|
|
|
2,456 |
|
|
|
2 |
|
|
Professional services |
|
|
57,082 |
|
|
|
27 |
|
|
|
43,228 |
|
|
|
25 |
|
|
|
37,483 |
|
|
|
23 |
|
|
Total cost of revenue |
|
|
97,175 |
|
|
|
46 |
|
|
|
72,178 |
|
|
|
42 |
|
|
|
64,332 |
|
|
|
40 |
|
|
Gross margins |
|
|
114,497 |
|
|
|
54 |
|
|
|
99,095 |
|
|
|
58 |
|
|
|
95,337 |
|
|
|
60 |
|
|
Operating expenses |
|
|
|
|
|
|
|
|
|
|
|
|
|
|
|
|
|
|
|
|
|
|
|
|
|
Research and development |
|
|
44,052 |
|
|
|
21 |
|
|
|
35,936 |
|
|
|
21 |
|
|
|
36,056 |
|
|
|
23 |
|
|
Sales and marketing |
|
|
50,305 |
|
|
|
24 |
|
|
|
40,189 |
|
|
|
23 |
|
|
|
34,158 |
|
|
|
21 |
|
|
General and administrative |
|
|
48,662 |
|
|
|
23 |
|
|
|
36,493 |
|
|
|
21 |
|
|
|
30,670 |
|
|
|
19 |
|
|
Change in fair value of contingent consideration |
|
|
133 |
|
|
|
— |
|
|
|
628 |
|
|
|
— |
|
|
|
801 |
|
|
|
1 |
|
|
Total operating expense |
|
|
143,152 |
|
|
|
68 |
|
|
|
113,246 |
|
|
|
66 |
|
|
|
101,685 |
|
|
|
64 |
|
|
Loss from operations |
|
|
(28,655 |
) |
|
|
(14 |
) |
|
|
(14,151 |
) |
|
|
(8 |
) |
|
|
(6,348 |
) |
|
|
(4 |
) |
|
Other income (expense), net |
|
|
641 |
|
|
|
— |
|
|
|
(565 |
) |
|
|
— |
|
|
|
(533 |
) |
|
|
— |
|
|
Interest expense, net |
|
|
(356 |
) |
|
|
— |
|
|
|
(1,030 |
) |
|
|
(1 |
) |
|
|
(567 |
) |
|
|
— |
|
|
Loss before income taxes |
|
|
(28,370 |
) |
|
|
(14 |
) |
|
|
(15,746 |
) |
|
|
(9 |
) |
|
|
(7,448 |
) |
|
|
(5 |
) |
|
Provision for income taxes |
|
|
1,562 |
|
|
|
— |
|
|
|
1,150 |
|
|
|
1 |
|
|
|
354 |
|
|
|
— |
|
|
Net loss |
|
$ |
(29,932 |
) |
|
|
(14 |
)% |
|
$ |
(16,896 |
) |
|
|
(9 |
)% |
|
$ |
(7,802 |
) |
|
|
(5 |
)% |
61
Revenue
Subscription
Fiscal 2020 Compared to Fiscal 2019. Subscription revenue increased $28.1 million, or 50%, in fiscal 2020 versus fiscal 2019 due to a combination of sales to new customers and increased revenue generated from existing customers, which includes full year impact of prior year sales, sales of new services to existing customers and contractual growth.
Fiscal 2019 Compared to Fiscal 2018. Subscription revenue increased $13.5 million, or 32%, in fiscal 2019 versus fiscal 2018 due to a combination of sales to new customers and increased revenue generated from existing customers, which includes full year impact of prior year sales, sales of new services to existing customers and contractual growth.
License
Fiscal 2020 Compared to Fiscal 2019. License revenue decreased $3.9 million, or (28%), in fiscal 2020 versus fiscal 2019 primarily due to a decrease in multi-year license deals and fees related to growth in DWP for license customers as a result of our shift to selling our SaaS solutions to new customers.
Fiscal 2019 Compared to Fiscal 2018. License revenue decreased $7.2 million, or (34%), in fiscal 2019 versus fiscal 2018 primarily due to our focus on selling our SaaS solutions to new customers and the revisions to contracting practices in fiscal 2018 to sell our term licenses with an initial two-year committed term and optional annual renewals instead of our historical three to six year committed terms. These decreases were partially offset by the conversion of a large perpetual license contract to an enterprise-wide term license contract, which shifted the revenue mix away from maintenance revenue and into license revenue.
Maintenance and Support
Fiscal 2020 Compared to Fiscal 2019. Maintenance and support revenue decreased $0.2 million, or (1%), in fiscal 2020 versus fiscal 2019 primarily due to the conversion of license contract customers to SaaS customers in the previous fiscal year.
Fiscal 2019 Compared to Fiscal 2018. Maintenance and support revenue decreased $2.1 million, or (8%), in fiscal 2019 versus fiscal 2018 primarily due to the conversion of a large perpetual license contract to an enterprise-wide term license contract, which shifted the revenue mix away from maintenance revenue and into license revenue, and the conversion of two license contract customers to SaaS customers.
Professional services
Fiscal 2020 Compared to Fiscal 2019. Professional services revenue increased $16.4 million, or 21% in fiscal 2020 versus fiscal 2019 primarily due to growth of our existing software customer base and new customer implementations.
Fiscal 2019 Compared to Fiscal 2018. Professional services revenue increased $7.5 million, or 11%, in fiscal 2019 versus fiscal 2018 primarily due to growth of our existing software customer base and new customer implementations.
Cost of Revenue
Fiscal 2020 Compared to Fiscal 2019. Cost of revenue increased $25.0 million, or 35%, in fiscal 2020 versus fiscal 2019.
Fiscal 2019 Compared to Fiscal 2018. Cost of revenue increased $7.8 million, or 12%, in fiscal 2019 versus fiscal 2018.
62
Fiscal 2020 Compared to Fiscal 2019. Cost of subscription revenue increased $10.7 million, or 44%, in fiscal 2020 versus fiscal 2019 primarily due to an increase in SaaS customers, and is primarily comprised of a $5.1 million increase in hosting costs, a $3.9 million increase in payroll and related costs as we added employees to build out the SaaS operations team, a $0.7 million increase in computer hardware and software costs and a $0.1 million increase in professional service fees. Share-based compensation increased $0.4 million in fiscal 2020 versus fiscal 2019 due to incremental charges related to employee stock options and Phantom Unit settlements as part of the Reorganization Transactions in conjunction with the IPO. Beginning in fiscal 2020, the Company recorded $0.7 million of amortization expense associated with capitalized internal-use software costs. These increases were offset by a $0.2 million decrease in travel and entertainment expenses.
Fiscal 2019 Compared to Fiscal 2018. Cost of subscription revenue increased $1.9 million, or 9%, in fiscal 2019 versus fiscal 2018 primarily due to an increase in SaaS customers, and is comprised of a $0.8 million increase in payroll and related costs as we added employees to build out the SaaS operations team, a $0.6 million increase in third-party software costs, a $0.5 million increase in consulting costs and a $0.1 million increase in royalties paid related to subscription arrangements. The increases were offset by a $0.4 million decrease due to eliminating redundancies in our external data hosting costs.
Cost of License
Fiscal 2020 Compared to Fiscal 2019. Cost of license revenue decreased $0.1 million, or (6%) in fiscal 2020 versus fiscal 2019 primarily due to a decrease in royalties paid to third parties resulting from the decrease in license revenue.
Fiscal 2019 Compared to Fiscal 2018. Cost of license revenue decreased $0.2 million, or (7%), in fiscal 2019 versus fiscal 2018 primarily due to a decrease in royalties paid to third-parties resulting from the decrease in license revenue.
Cost of Maintenance and Support
Fiscal 2020 Compared to Fiscal 2019. Cost of maintenance and support revenue increased $0.6 million, or 20%, in fiscal 2020 versus fiscal 2019 primarily due to a shift in the mix of personnel (onshore resources versus offshore resources) supporting our term and perpetual license customers.
Fiscal 2019 Compared to Fiscal 2018. Cost of maintenance and support revenue increased $0.3 million or 13% in fiscal 2019 versus fiscal 2018 primarily due to an increase in personnel-related costs required to support our term and perpetual license customers.
Cost of Professional Services
Fiscal 2020 Compared to Fiscal 2019. Cost of professional services revenue increased $13.9 million, or 32%, in fiscal 2020 versus fiscal 2019 primarily due to a $5.5 million increase in salaries and other payroll related costs resulting from increased professional services headcount, a $2.5 million increase in bonus expense and a $2.1 million increase in personnel-related costs due to the internal transfer of professional services headcount back to professional services from a research and development project completed in late 2019. In addition, share-based compensation increased $4.6 million in fiscal 2020 versus fiscal 2019 due to incremental charges related to employee stock options and Phantom Unit settlements as part of the Reorganization Transactions in conjunction with the IPO. These increases were partially offset by a $1.1 million decrease in travel and entertainment expenses.
Fiscal 2019 Compared to Fiscal 2018. Cost of professional services revenue increased $5.7 million, or 15%, in fiscal 2019 versus fiscal 2018 primarily due to an increase in salaries and other payroll related costs resulting from increased professional services headcount in fiscal 2019.
63
Fiscal 2020 Compared to Fiscal 2019. Gross margins increased $15.4 million, or 16%, in fiscal 2020 versus fiscal 2019, primarily due to a $17.4 million increase in subscription gross margin and a $2.5 million increase in professional services margin, partially offset by a $3.7 million decrease in license gross margin and a $0.8 million decrease in maintenance and support gross margin. Our gross margin percentage decreased from 58% in fiscal 2019 to 55% in fiscal 2020. This is primarily due to decreases in license gross margin percentage, professional services gross margin percentage, and maintenance and support gross margin percentage, partially offset by an increase in subscription gross margin percentage.
Fiscal 2019 Compared to Fiscal 2018. Gross margins increased $3.8 million, or 4%, in fiscal 2019 versus fiscal 2018, primarily due to the continued transition from on premise licensing to providing SaaS in fiscal 2018 and fiscal 2019, resulting in an increase in subscription gross margins offset by a decrease in license gross margins. Our gross margin percentage decreased from 60% in fiscal 2018 to 58% in fiscal 2019. This decrease is primarily due to a decrease in license gross margin percentage partially offset by an increase in subscription gross margin percentage.
Operating Expenses
Research and Development Expense
Fiscal 2020 Compared to Fiscal 2019. Research and development expense increased $8.1 million, or 23%, in fiscal 2020 versus fiscal 2019 primarily due to a 3.7 million increase in share-based compensation expense related to employee stock options and Phantom Unit settlements as part of the Company’s Reorganization Transactions in conjunction with the IPO, a $1.9 million increase in bonus expense and a $3.6 decrease in cost reimbursements received by a third party due to the completion of a research and development project in late 2019. These increases were partially offset by a $0.7 million reduction in consulting fees and a $0.3 million reduction in travel and entertainment expenses.
Fiscal 2019 Compared to Fiscal 2018. Research and development expense remained consistent in fiscal 2019 versus fiscal 2018 primarily due to a $0.5 million decrease in salary and salary-related costs due to lower headcount and a $1.5 million reduction in payroll-related expenses related to capitalized internal-use software costs. These decreases were offset by a $1.3 million increase in engineering software costs and a $0.6 million increase in consulting fees.
Sales and Marketing Expense
Fiscal 2020 Compared to Fiscal 2019. Sales and marketing expense increased $10.1 million, or 25%, in fiscal 2020 versus fiscal 2019 primarily due to a $5.2 million increase in share-based compensation expense related to employee stock options and Phantom Unit settlements as part of the Reorganization Transactions in conjunction with the IPO, a $4.6 million increase in salaries and payroll-related costs, including bonuses, from increased headcount, a $0.5 million increase in sales commissions and a $0.5 million increase in marketing programs, partially offset by a $0.7 million decrease in travel and entertainment expenses.
Fiscal 2019 Compared to Fiscal 2018. Sales and marketing expense increased $6.0 million, or 18%, in fiscal 2019 versus fiscal 2018 primarily due to a $5.7 million increase in salaries and payroll-related costs from increased headcount and a $0.2 million increase in costs related to marketing programs.
General and Administrative Expense
Fiscal 2020 Compared to Fiscal 2019. General and administrative expense increased $12.2 million, or 33%, in fiscal 2020 versus fiscal 2019 primarily due to a $5.2 million increase in share-based compensation expense related to employee stock options and Phantom Unit settlements as part of the Reorganization Transactions in conjunction with the IPO, a $3.6 million increase in salaries and payroll-related costs, a $2.8 million increase in facilities cost due to the impairment of right of use assets and leasehold improvements associated with the closure or downsizing of two of our offices in the U.S., a $0.6 million increase in insurance, and a $0.5 million increase in computer software costs. These increases were offset by a $0.6 million decrease in contingent labor.
64
Fiscal 2019 Compared to Fiscal 2018. General and administrative expense increased $5.8 million, or 19%, in fiscal 2019 versus fiscal 2018 primarily due to a $3.6 million increase in salaries and payroll-related costs from increased headcount, a $0.6 million increase in legal costs related to merger and acquisition activity, a $0.6 million increase in facilities cost due to opening additional offices in fiscal 2019, a $0.5 million increase in depreciation expense, a $0.5 million increase in third-party software costs and a $0.3 million increase in consulting costs.
Change in Fair Value of Contingent Consideration
Fiscal 2020 Compared to Fiscal 2019. In fiscal 2020, a $0.1 million gain was recognized primarily due to the change in fair value of contingent consideration related to the acquisition of Outline Systems (now Duck Creek Distribution Management).
Fiscal 2019 Compared to Fiscal 2018. In fiscal 2019, a $0.6 million loss was recognized primarily due to the change in fair value of contingent consideration related to the acquisition of Outline Systems (now Duck Creek Distribution Management).
Other Income (Expense), Net
Fiscal 2020 Compared to Fiscal 2019. Other income (expense) grew $1.2 million in fiscal 2020 versus fiscal 2019, primarily due to fluctuations in foreign exchange rates on receivables and payables denominated in currencies other than the U.S. dollar.
Fiscal 2019 Compared to Fiscal 2018. Other income (expense) was relatively consistent in fiscal 2019 versus fiscal 2018, as net losses incurred related to fluctuations in foreign exchange rates on receivables and payables denominated in currencies other than the U.S. dollar remained stable.
Interest Expense, Net
Fiscal 2020 Compared to Fiscal 2019. Interest expense, net decreased $0.7 million in fiscal 2020 versus fiscal 2019 primarily due to lower net revolver borrowing costs.
Fiscal 2019 Compared to Fiscal 2018. Interest expense, net increased $0.5 million in fiscal 2019 versus fiscal 2018 primarily due to higher net revolver borrowing costs.
Provision for Income Taxes
Fiscal 2020 Compared to Fiscal 2019. Provision for income taxes increased by $0.4 million in fiscal 2020 versus fiscal 2019 primarily due to an increase in the deferred tax expense in foreign entities.
Fiscal 2019 Compared to Fiscal 2018. Provision for income taxes increased by $0.8 million in fiscal 2019 versus fiscal 2018 primarily due to a decrease in the deferred tax benefit in foreign entities.
Liquidity and Capital Resources
To date, we have financed our operations primarily through cash provided by operating activities and our revolving credit facility. As of August 31, 2020, we had $389.9 million in cash (including net proceeds received from the IPO) no outstanding borrowings under our revolving credit facility and $1.0 million of outstanding letters of credit. We also had $29.0 million principal amount of additional availability under our revolving credit facility. While we believe our existing cash, together with cash provided by operating activities and amounts available under our revolving credit facility, will be sufficient to meet our operating working capital and capital expenditure requirements over at least the next twelve months, the extent to which COVID-19 could impact our business, financial condition, results of operations and cash flows in the short- and medium-term cannot be predicted with certainty, but such impact could be material. Although we did not experience significant disruptions to our business in 2020 from COVID-19, we and our industry as a whole may experience a greater impact going forward. To the extent COVID-19 has resulted in any increase to our cash and cash equivalents, including as a result of any
65
decreases in sales and market expenses described above, such increase could be temporary. Additionally, on a longer term basis, we may not be able to accurately predict the effect of COVID-19 on our future financing requirements, which will depend on our primary cash needs that could be affected by many factors, including the number of new customers that we obtain, the renewal activity of our existing customers and our ability to both cross-sell additional functionality to our existing customers and to encourage our existing customers to adopt our SaaS solutions, the timing and extent of our research and development spending and the expansion of our sales and marketing activities. We may also face unexpected costs in connection with our business operations, including in connection with the ongoing implementation of our COVID-19 related policies and procedures. Any of the above could have a material adverse effect on our business, financial condition, results of operations and cash flows and require us to seek additional sources of liquidity and capital resources. For additional information regarding the impact of COVID-19 on the Company, see “Item 1A. Risk Factors—Public health outbreaks, epidemics or pandemics, including the global COVID-19 outbreak, could harm our business, results of operations, and financial condition”. In addition, at any given time, we may be evaluating one or more potential investments in, or acquisitions of, businesses or technologies, which could also require us to seek additional equity or debt financing. Additional sources of liquidity and capital resources, including equity or debt financing, may not be available on terms favorable to us or at all.
As of August 31, 2020, $46.5 million of cash was held by our foreign subsidiaries. We currently do not anticipate a need to repatriate these funds to finance our U.S. operations and it is our intention to indefinitely reinvest these funds outside the United States.
Summary of Cash Flows for the Fiscal Years Ended August 31, 2020, 2019 and 2018
The following summarizes our cash flows from operating, investing and financing activities for the periods indicated:
|
|
|
Year Ended August 31, |
|
|||||||||
|
($ in thousands) |
|
2020 |
|
|
2019 |
|
|
2018 |
|
|||
|
Net cash provided by operating activities |
|
$ |
25,725 |
|
|
$ |
14,833 |
|
|
$ |
11,833 |
|
|
Net cash used in investing activities |
|
|
(6,747 |
) |
|
|
(19,911 |
) |
|
|
(8,594 |
) |
|
Net cash provided by (used in) financing activities |
|
|
358,901 |
|
|
|
3,198 |
|
|
|
(901 |
) |
|
Net increase (decrease) in cash, cash equivalents and restricted cash |
|
|
377,879 |
|
|
|
(1,880 |
) |
|
|
2,338 |
|
|
Cash, cash equivalents and restricted cash, beginning of period |
|
|
11,999 |
|
|
|
13,879 |
|
|
|
11,541 |
|
|
Cash, cash equivalents and restricted cash, end of period |
|
$ |
389,878 |
|
|
$ |
11,999 |
|
|
$ |
13,879 |
|
Operating Activities
We generated $25.7 million of cash from operating activities during fiscal 2020, primarily resulting from our net income, after excluding the impact of non-cash charges, of $14.6 million and $14.5 million of cash generated by working capital activities. Cash generated by working capital activities during fiscal 2020 was primarily due to an increase in accrued liabilities with third-party software vendors, accrued annual bonuses and accrued Phantom Unit settlements.
We generated $14.8 million of cash from operating activities during fiscal 2019, primarily resulting from our net income, after excluding the impact of non-cash charges, of $3.9 million, and $10.9 million of cash generated by working capital activities. Cash generated by working capital activities during fiscal 2019 was primarily due to an increase in accrued liabilities with third-party software vendors.
We generated $11.8 million of cash from operating activities during fiscal 2018, primarily resulting from our net income, after excluding the impact of non-cash charges, of $14.1 million, partially offset by $2.3 million of cash used in working capital activities. Cash used by working capital activities during fiscal 2018 was primarily due to a decrease in accounts payable due to the timing of invoice payments.
Non-cash charges in all periods include depreciation and amortization, share-based compensation expense, deferred taxes, and change in fair value of contingent earn-out liability.
66
Net cash used in investing activities consists of business acquisitions, purchases of property and equipment and capitalization of internal use software costs.
We used $6.7 million of cash in investing activities during fiscal 2020 primarily related to purchases of property and equipment of $3.9 million and capitalized internal use-software costs of $2.9 million.
We used $19.9 million of cash in investing activities during fiscal 2019 primarily related to our acquisition of Outline Systems LLC for cash consideration of $9.8 million, our acquisition of the CedeRight Products business for cash consideration of $1.8 million, purchases of property and equipment of $5.3 million and capitalized internal use-software costs of $3.0 million.
We used $8.6 million of cash in investing activities during fiscal 2018. Cash used in investing activities during this period primarily related to purchases of property and equipment of $7.1 million and capitalized internal-use software costs of $1.5 million.
Financing Activities
We generated $358.9 million in financing activities during fiscal 2020, primarily related to the net proceeds of $433.7 million from the IPO and $438.8 million from the issuance of Class E units prior to the IPO, partially offset by $505.8 million in redemption costs. Other financing activities consisted of borrowings under our revolving credit facility of $5.0 million offset by payments of principal on our revolving credit facility of $9.0 million.
We generated $3.2 million of cash in financing activities during fiscal 2019, primarily related to borrowings under our revolving credit facility of $12.0 million offset by payments of principal on our revolving credit facility of $8.0 million and costs of $0.8 million relating to proceeding with the IPO.
We used $0.9 million of cash in financing activities during fiscal 2018, primarily related to payments of principal on our revolving credit facility of $5.0 million, payments of contingent consideration of $0.9 million partially offset by borrowings under our revolving credit facility of $5.0 million.
Other Financial Data and Key Metrics
Non-GAAP Financial Measures
We report our financial results in accordance with accounting principles generally accepted in the United States (“GAAP”); however, management believes evaluating the Company’s ongoing operating results may be enhanced if investors have additional non-GAAP financial measures. Specifically, management reviews Adjusted EBITDA, Free Cash Flow, Non-GAAP Gross Margin, Non-GAAP Income from Operations and Non-GAAP Net Income (Loss), each of which is a non-GAAP financial measure, to manage our business, make planning decisions, evaluate our performance and allocate resources and, for the reasons described below, considers them to be effective indicators, for both management and investors, of our financial performance over time.
We believe that Adjusted EBITDA, Free Cash Flow, Non-GAAP Gross Margin, Non-GAAP Income from Operations and Non-GAAP Net Income (Loss) help investors and analysts in comparing our results across reporting periods on a consistent basis by excluding items that we do not believe are indicative of our core operating performance. These non-GAAP financial measures have limitations as analytical tools and should not be considered in isolation from, or as a substitute for, the analysis of other GAAP financial measures, including net income and
67
cash flows from operating activities. For example, with respect to Adjusted EBITDA, some of these limitations include:
• it does not reflect our cash expenditures, or future requirements, for capital expenditures or contractual commitments;
• it does not reflect changes in, or cash requirements for, our working capital needs;
• it does not reflect interest expense, or the cash requirements necessary to service interest or principal payments, on our indebtedness;
• it does not reflect our income tax expense or the cash requirements to pay our taxes; and
• although depreciation and amortization are non-cash charges, the assets being depreciated and amortized will often have to be replaced in the future, and Adjusted EBITDA does not reflect any cash requirements for such replacements.
These non-GAAP financial measures are not universally consistent calculations, limiting their usefulness as comparative measures. Other companies may calculate similarly titled financial measures differently than we do or may not calculate them at all. Additionally, these non-GAAP financial measures are not measurements of financial performance or liquidity under GAAP. In order to facilitate a clear understanding of our consolidated historical operating results, you should examine our non-GAAP financial measures in conjunction with our historical combined financial statements and notes thereto included elsewhere in this prospectus.
The non-GAAP financial measures and principal metrics we use in managing our business are set forth below:
Adjusted EBITDA. We define Adjusted EBITDA as net loss before interest expense, net; other income (expense), net; provision for income taxes; depreciation of property and equipment; amortization of intangible assets; share-based compensation expense; and the change in fair value of contingent consideration. We believe Adjusted EBITDA provides investors and other users of our financial information consistency and comparability with our past financial performance and facilitates period-to-period comparisons of operations. Adjusted EBITDA was $11.7 million, $6.8 million, and $13.7 million for fiscal 2020, 2019 and 2018, respectively. A reconciliation of Adjusted EBITDA to net loss, the most directly comparable GAAP financial measure, is presented below for the periods indicated.
|
|
|
Year Ended August 31, |
|
|||||||||
|
($ in thousands) |
|
2020 |
|
|
2019 |
|
|
2018 |
|
|||
|
GAAP Net Loss |
|
$ |
(29,932 |
) |
|
$ |
(16,896 |
) |
|
$ |
(7,802 |
) |
|
Provision for income taxes |
|
|
1,562 |
|
|
|
1,150 |
|
|
|
354 |
|
|
Other (income) expense |
|
|
(641 |
) |
|
|
565 |
|
|
|
533 |
|
|
Interest expense, net |
|
|
356 |
|
|
|
1,030 |
|
|
|
567 |
|
|
Depreciation of property and equipment |
|
|
3,143 |
|
|
|
2,398 |
|
|
|
1,915 |
|
|
Amortization of intangible assets |
|
|
15,975 |
|
|
|
15,884 |
|
|
|
15,552 |
|
|
Share-based compensation expense |
|
|
21,108 |
|
|
|
2,070 |
|
|
|
1,739 |
|
|
Change in fair value of contingent earnout liability |
|
|
133 |
|
|
|
628 |
|
|
|
801 |
|
|
Adjusted EBITDA |
|
$ |
11,704 |
|
|
$ |
6,829 |
|
|
$ |
13,659 |
|
Free Cash Flow. We define Free Cash Flow as net cash provided by operating activities, less purchases of property and equipment and capitalized internal use software. We consider Free Cash Flow to be an important measure in facilitating period-to-period comparisons of liquidity. We use Free Cash Flow in conjunction with traditional GAAP measures as part of our overall assessment of liquidity. Free Cash Flow was $19.0 million, $6.6 million, and $3.2 million for fiscal 2020, 2019 and 2018, respectively. A reconciliation of Free Cash Flow to net cash provided by operating activities, the most directly comparable GAAP financial measure, is presented below for the periods indicated.
68
|
|
|
Year Ended August 31, |
|
|||||||||
|
($ in thousands) |
|
2020 |
|
|
2019 |
|
|
2018 |
|
|||
|
Net cash provided by operating activities |
|
$ |
25,725 |
|
|
$ |
14,833 |
|
|
$ |
11,833 |
|
|
Purchases of property and equipment |
|
|
(3,854 |
) |
|
|
(5,314 |
) |
|
|
(7,138 |
) |
|
Capitalized internal-use software |
|
|
(2,893 |
) |
|
|
(2,956 |
) |
|
|
(1,456 |
) |
|
Free Cash Flow |
|
$ |
18,978 |
|
|
$ |
6,563 |
|
|
$ |
3,239 |
|
Non-GAAP Gross Margin. We define Non-GAAP Gross Margin as GAAP gross margin before the portion of share-based compensation expense; amortization of intangible assets; and amortization of capitalized internal-use software that is included in cost of revenue. We believe Non-GAAP Gross Margin provides investors and other users of our financial information consistency and comparability with our past financial performance and facilitates period-to-period comparisons of gross margin. Non-GAAP Gross Margin was $125.7 million, $103.9 million, and $101.1 million for fiscal 2020, 2019 and 2018, respectively. A reconciliation of Non-GAAP Gross Margin to gross margin, the most directly comparable GAAP financial measure, is presented below for the periods indicated.
|
|
|
Year Ended August 31, |
|
|||||||||
|
|
2020 |
|
|
2019 |
|
|
2018 |
|
||||
|
GAAP Gross Margin |
|
$ |
114,497 |
|
|
$ |
99,095 |
|
|
$ |
95,337 |
|
|
Share-based compensation expense |
|
|
5,125 |
|
|
|
152 |
|
|
|
233 |
|
|
Amortization of intangible assets |
|
|
4,746 |
|
|
|
4,680 |
|
|
|
4,522 |
|
|
Amortization of capitalized internal-use software |
|
|
703 |
|
|
|
— |
|
|
|
— |
|
|
Non-GAAP Gross Margin |
|
$ |
125,071 |
|
|
$ |
103,927 |
|
|
$ |
100,092 |
|
Non-GAAP Income from Operations. We define Non-GAAP Income from Operations as GAAP loss from operations before share-based compensation expense; amortization of intangible assets; and the change in fair value of contingent consideration. We believe Non-GAAP Income from Operations provides investors and other users of our financial information consistency and comparability with our past financial performance and facilitates period-to-period comparisons of operations. Non-GAAP Income from Operations was $8.6 million, $4.4 million, and $11.7 million for fiscal 2020, 2019 and 2018, respectively. A reconciliations of Non-GAAP Income from Operations to loss from operations, the most directly comparable GAAP financial measure, is presented below for the periods indicated.
|
|
|
Year Ended August 31, |
|
|||||||||
|
($ in thousands) |
|
2020 |
|
|
2019 |
|
|
2018 |
|
|||
|
GAAP Loss from Operations |
|
$ |
(28,655 |
) |
|
$ |
(14,151 |
) |
|
$ |
(6,348 |
) |
|
Share-based compensation expense |
|
|
21,108 |
|
|
|
2,070 |
|
|
|
1,739 |
|
|
Amortization of intangible assets |
|
|
15,975 |
|
|
|
15,884 |
|
|
|
15,552 |
|
|
Change in fair value of contingent earnout liability |
|
|
133 |
|
|
|
628 |
|
|
|
801 |
|
|
Non-GAAP Income from Operations |
|
$ |
8,561 |
|
|
$ |
4,431 |
|
|
$ |
11,744 |
|
Non-GAAP Net Income (Loss). We define Non-GAAP Net Income as GAAP net loss before amortization of share-based compensation expense; amortization of intangible assets; and change in fair value of contingent earnout liability. We believe Non-GAAP Net Income provides investors and other users of our financial information consistency and comparability with our past financial performance and facilitates period-to-period comparisons of operations. Non-GAAP Net Income was $7.3 million, $1.7 million, and $10.3 million for fiscal 2020, 2019 and 2018, respectively. A reconciliation of Non-GAAP Net Income to net loss, the most directly comparable GAAP financial measure, is presented below for the periods indicated.
69
|
|
Year Ended August 31, |
|
||||||||||
|
($ in thousands) |
|
2020 |
|
|
2019 |
|
|
2018 |
|
|||
|
GAAP Net Loss |
|
$ |
(29,932 |
) |
|
$ |
(16,896 |
) |
|
$ |
(7,802 |
) |
|
Share-based compensation expense |
|
|
21,108 |
|
|
|
2,070 |
|
|
|
1,739 |
|
|
Amortization of intangible assets |
|
|
15,975 |
|
|
|
15,884 |
|
|
|
15,552 |
|
|
Change in fair value of contingent earnout liability |
|
|
133 |
|
|
|
628 |
|
|
|
801 |
|
|
Tax effect of adjustments (1) |
|
|
— |
|
|
|
— |
|
|
|
— |
|
|
Non-GAAP Net Income |
|
$ |
7,284 |
|
|
$ |
1,686 |
|
|
$ |
10,290 |
|
|
|
|
|
|
|
|
|
|
|
|
|
|
|
|
Non-GAAP Net Income per Share (Basic) (2) |
|
$ |
0.06 |
|
|
|
|
|
|
|
|
|
|
|
|
|
|
|
|
|
|
|
|
|
|
|
|
Shares used in computing Non-GAAP Net Income per Share (Basic) (2) |
|
|
127,367,969 |
|
|
|
|
|
|
|
|
|
|
|
|
|
|
|
|
|
|
|
|
|
|
|
|
(1) Our tax provision is primarily related to state taxes and income taxes in profitable foreign jurisdictions. We maintain a full valuation allowance against our deferred tax assets in the U.S. Accordingly, there is no tax impact associated with the non-GAAP adjustments in the U.S. We have not included the insignificant tax benefit associated with the non-GAAP adjustments related to our foreign jurisdictions that are taxed on a cost-plus basis. The Company previously computed the tax effect of non-GAAP adjustments by multiplying the adjustments by an estimated effective tax rate of 27%. The Company has revised the August 31, 2019 and August 31, 2018 prior year presentation in the table above in order to conform to the current year method of computing the tax effect of non-GAAP adjustments. |
|
|||||||||||
|
|
|
|
|
|
|
|
|
|
|
|
|
|
|
(2) Prior to the IPO, there were no shares of common stock outstanding, and the membership structure of Duck Creek Technologies consisted of limited partnership units. The Company analyzed the calculation of earnings per unit for periods prior to the IPO and determined that it resulted in values that would not be meaningful to the users of the Company’s consolidated financial statements. In addition, GAAP earnings per share for the fiscal year ended August 31, 2020 has not been presented as it resulted in values that would not be meaningful to the users of this Annual Report on Form 10-K because it only reflects the operations of the Company for the 17 day period subsequent to the IPO. For purposes of this Annual Report on Form 10-K, the Company has performed a calculation of Non-GAAP earnings per share for the fiscal year ended August 31, 2020 by using a consistent exchange ratio for all pre-IPO limited partnership units and assuming that common stock sold in the IPO was outstanding for the entire fiscal year. |
|
|||||||||||
SaaS Net Dollar Retention Rate. We calculate SaaS Net Dollar Retention Rate by annualizing SaaS revenue recorded in the last month of the measurement period for those revenue-generating customers in place throughout the entire measurement period (the latest twelve-month period). We divide the result by annualized SaaS revenue from the month that is immediately prior to the beginning of the measurement period, for all revenue-generating customers in place at the beginning of the measurement period. Our SaaS Net Dollar Retention Rate was 117%, 114%, and 107% for fiscal 2020, 2019, and 2018, respectively. Our calculation excludes one existing contract for a service no longer offered on a standalone basis by the Company. We believe SaaS Net Dollar Retention Rate is an important metric for the Company because, in addition to providing a measure of retention, it indicates our ability to grow revenue within existing customer accounts. SaaS Net Dollar Retention Rate is included in a set of metrics that we calculate quarterly to review with management as well as periodically with members of our board of directors.
SaaS Annual Recurring Revenue (“SaaS ARR”). We calculate SaaS ARR by annualizing the recurring subscription revenue recognized in the last month of the measurement period (the latest twelve-month period). Our SaaS ARR was $95.6 million, $51.7 million, and $30.1 million, for fiscal 2020, 2019, and 2018, respectively. Our calculation excludes one existing contract for a service no longer offered on a standalone basis by the Company. We believe SaaS ARR provides important information about our ability to acquire new subscription SaaS customers and to maintain and expand our relationship with existing subscription SaaS customers. SaaS ARR is included in a set of metrics that we calculate quarterly to review with management as well as periodically with members of our board of directors.
70
Non-GAAP Subscription Gross Margin. We define Non-GAAP Subscription Gross Margin as GAAP subscription gross margin before the portion of amortization of intangible assets, amortization of capitalized internal-use software and share-based compensation expense that is included in subscription gross margin. We believe Non-GAAP Subscription Gross Margin provides investors and other users of our financial information consistency and comparability with our past financial performance and facilitates period-to-period comparisons of subscription gross margin. Non-GAAP Subscription Gross Margin was $53.8 million, $35.2 million, and $23.5 million for fiscal 2020, 2019 and 2018. A reconciliation of Non-GAAP Subscription Gross Margin to subscription gross margin, the most directly comparable GAAP financial measure, is presented below for the periods indicated.
|
|
|
Year Ended August 31, |
|
|||||||||
|
($ in thousands) |
|
2020 |
|
|
2019 |
|
|
2018 |
|
|||
|
Subscription gross margin |
|
$ |
49,097 |
|
|
$ |
31,710 |
|
|
$ |
20,180 |
|
|
Amortization of intangible assets |
|
|
3,539 |
|
|
|
3,433 |
|
|
|
3,275 |
|
|
Amortization of capitalized internal-use software |
|
|
703 |
|
|
|
— |
|
|
|
— |
|
|
Share-based compensation expense |
|
|
415 |
|
|
|
21 |
|
|
|
59 |
|
|
Non-GAAP Subscription Gross Margin |
|
$ |
53,754 |
|
|
$ |
35,164 |
|
|
$ |
23,514 |
|
Non-GAAP Professional Services Gross Margin. We define Non-GAAP Professional Services Gross Margin as GAAP professional services gross margin before the portion of share-based compensation expense that is included in professional services gross margin. We believe Non-GAAP Professional Services Gross Margin provides investors and other users of our financial information consistency and comparability with our past financial performance and facilitates period-to-period comparisons of professional services gross margin. Non-GAAP Professional Services Gross Margin was $41.7 million, $34.6 million, and $32.9 million and for fiscal 2020, 2019 and 2018, respectively. A reconciliation of Non-GAAP Professional Services Gross Margin to professional services gross margin, the most directly comparable GAAP financial measure, is presented below for the periods indicated.
|
|
|
Year Ended August 31, |
|
|||||||||
|
($ in thousands) |
|
2020 |
|
|
2019 |
|
|
2018 |
|
|||
|
Professional services gross margin |
|
$ |
36,997 |
|
|
$ |
34,464 |
|
|
$ |
32,732 |
|
|
Share-based compensation expense |
|
|
4,683 |
|
|
|
122 |
|
|
|
170 |
|
|
Non-GAAP Professional Services Gross Margin |
|
$ |
41,680 |
|
|
$ |
34,586 |
|
|
$ |
32,902 |
|
Non-GAAP Sales and Marketing Expense. We define Non-GAAP Sales and Marketing Expense as GAAP sales and marketing expense before the portion of amortization of intangible assets and share-based compensation expense that is included in sales and marketing expense. We believe Non-GAAP Sales and Marketing Expense provides investors and other users of our financial information consistency and comparability with our past financial performance and facilitates period-to-period comparisons of sales and marketing expense. Non-GAAP Sales and Marketing Expense was $34.4 million, $29.5 million and $23.7 million for fiscal 2020, 2019 and 2018, respectively. A reconciliation of Non-GAAP Sales and Marketing Expense to sales and marketing expense, the most directly comparable GAAP financial measure, is presented below for the periods indicated.
|
|
|
Year Ended August 31, |
|
|||||||||
|
($ in thousands) |
|
2020 |
|
|
2019 |
|
|
2018 |
|
|||
|
Sales and marketing expense |
|
$ |
50,305 |
|
|
$ |
40,189 |
|
|
$ |
34,158 |
|
|
Amortization of intangible assets |
|
|
(10,280 |
) |
|
|
(10,254 |
) |
|
|
(10,080 |
) |
|
Share-based compensation expense |
|
|
(5,581 |
) |
|
|
(417 |
) |
|
|
(338 |
) |
|
Non-GAAP Sales and Marketing Expense |
|
$ |
34,444 |
|
|
$ |
29,518 |
|
|
$ |
23,740 |
|
71
Non-GAAP Research and Development Expense. We define Non-GAAP Research and Development Expense as GAAP research and development expense before the portion of share-based compensation expense that is included in research and development expense. We believe Non-GAAP Research and Development Expense provides investors and other users of our financial information consistency and comparability with our past financial performance and facilitates period-to-period comparisons of research and development expense. Non-GAAP Research and Development Expense was $39.9 million, $35.5 million and $35.7 million for fiscal 2020, 2019 and 2018, respectively. A reconciliation of Non-GAAP Research and Development Expense to research and development expense, the most directly comparable GAAP financial measure, is presented below for the periods indicated.
|
|
|
Year Ended August 31, |
|
|||||||||
|
($ in thousands) |
|
2020 |
|
|
2019 |
|
|
2018 |
|
|||
|
Research and development expense |
|
$ |
44,052 |
|
|
$ |
35,936 |
|
|
$ |
36,056 |
|
|
Share-based compensation expense |
|
|
(4,129 |
) |
|
|
(398 |
) |
|
|
(395 |
) |
|
Non-GAAP Research and Development Expense |
|
$ |
39,923 |
|
|
$ |
35,538 |
|
|
$ |
35,661 |
|
Non-GAAP General and Administrative Expense. We define Non-GAAP General and Administrative Expense as GAAP general and administrative expense before the portion of amortization of intangible assets and share-based compensation expense that is included in general and administrative expense. We believe Non-GAAP General and Administrative Expense provides investors and other users of our financial information consistency and comparability with our past financial performance and facilitates period-to-period comparisons of general and administrative expense. Non-GAAP General and Administrative Expense was $41.4 million, $34.4 million and $28.9 million for fiscal 2020, 2019 and 2018, respectively. A reconciliation of Non-GAAP General and Administrative Expense to general and administrative expense, the most directly comparable GAAP financial measure, is presented below for the periods indicated.
|
|
|
Year Ended August 31, |
|
|||||||||
|
($ in thousands) |
|
2020 |
|
|
2019 |
|
|
2018 |
|
|||
|
General and administrative expense |
|
$ |
48,662 |
|
|
$ |
36,493 |
|
|
$ |
30,670 |
|
|
Amortization of intangible assets |
|
|
(950 |
) |
|
|
(950 |
) |
|
|
(950 |
) |
|
Share-based compensation expense |
|
|
(6,273 |
) |
|
|
(1,103 |
) |
|
|
(773 |
) |
|
Non-GAAP General and Administrative Expense |
|
$ |
41,439 |
|
|
$ |
34,440 |
|
|
$ |
28,947 |
|
Contractual Obligations
The following summarizes our contractual obligations as of August 31, 2020:
|
|
|
|
|
|
|
Fiscal Year Ended August 31, |
|
|
|
|
|
|||||||||||||
|
|
Total |
|
|
2021 |
|
|
2022 |
|
|
2023 |
|
|
2024 |
|
|
Thereafter |
|
|||||||
|
Operating lease obligations(1) |
|
$ |
29,571 |
|
|
$ |
4,798 |
|
|
$ |
4,166 |
|
|
$ |
4,226 |
|
|
$ |
4,239 |
|
|
$ |
12,142 |
|
|
Debt obligations(2) |
|
|
— |
|
|
|
— |
|
|
|
— |
|
|
|
— |
|
|
|
— |
|
|
|
— |
|
|
Contingent earn-out(3) |
|
|
7,092 |
|
|
|
3,701 |
|
|
|
3,391 |
|
|
|
— |
|
|
|
— |
|
|
|
— |
|
|
Purchase obligations(4) |
|
|
12,742 |
|
|
|
10,037 |
|
|
|
2,666 |
|
|
|
39 |
|
|
|
— |
|
|
|
— |
|
|
Total |
|
$ |
49,405 |
|
|
$ |
18,536 |
|
|
$ |
10,223 |
|
|
$ |
4,265 |
|
|
$ |
4,239 |
|
|
$ |
12,142 |
|
|
(1) |
We lease our facilities under operating lease agreements that expire at various dates through 2028. Rent expenses for leased facilities of $4.9 million, $4.4 million, and $4.0 million were recognized for fiscal 2020, 2019 and 2018, respectively. |
|
(2) |
Our debt consists of borrowings under our revolving credit facility, and two irrevocable standby letters of credit against our revolving credit facility. As of August 31, 2020, we had no outstanding borrowing under our revolving credit facility and had $29.0 million principal amount of availability under our revolving credit facility. |
72
|
(4) |
Our purchase obligations comprise non-cancelable agreements for cloud infrastructure services with Microsoft and software subscriptions with third-party vendors. |
During the fiscal year ended August 31, 2020, we signed additional leases in London, Madrid, and Sydney. These leases represent our commitment to growth in our international operations. Combined, they added approximately $2.2 million in total future minimum rent payments. Since August 31, 2020, there have been no other material changes in our contractual obligations from those disclosed in the table above.
Indebtedness
On October 4, 2016, we entered into a credit agreement with a group of lenders for a revolving credit facility with a maximum borrowing capacity of $30.0 million that was originally scheduled to mature on October 4, 2019. On October 2, 2019, we amended certain of the financial covenants and extended our credit agreement for two years to a maturity date of October 2, 2021. Our revolving credit facility is guaranteed by the Operating Partnership and certain of its domestic subsidiaries and secured by substantially all of our tangible and intangible assets. Interest accrues on our revolving credit facility at a variable rate based upon the type of borrowing made by us. Loans under our revolving credit facility bear interest at a rate of LIBOR plus an applicable margin, or incur interest at the higher of: (i) the Prime Rate, (2) the Fed Funds Rate plus 0.5%, or (3) LIBOR plus 1.0%, plus an applicable margin. The applicable margin ranges from 2.0% to 3.0% depending on the interest rate basis and type of borrowing elected (eurocurrency rate loan, base rate loan, swing rate loan or letter of credit). For the fiscal year ended August 31, 2020, the effective interest rate under our revolving credit agreement was 6.9%. In addition to interest on our revolving credit facility, we pay a commitment fee of 0.5% per annum on the unused portion of our revolving credit facility, as well as customary letter of credit fees. Repayment of any amounts borrowed are not required until maturity of our revolving credit facility, however we may repay any amounts borrowed at any time, without premium or penalty.
The credit agreement contains a number of customary restrictive covenants, including limits on additional indebtedness, the creation of liens and limits on making certain investments. Limits on our revolving credit facility also require compliance with the following ratios: maintaining a minimum level of consolidated EBITDA (ranging from $5.0 million to $12.0 million depending on the applicable four quarter period), and maintaining a leverage ratio that does not exceed 3.25:1.00. We were in compliance with these financial and nonfinancial covenants as of August 31, 2020.
We incurred $0.3 million of costs directly related to obtaining our revolving credit facility which have been recorded as deferred financing fees and are amortized to interest expense on a straight-line basis over the term of our revolving credit facility. During fiscal 2017, we executed an irrevocable standby letter of credit totaling $0.8 million against our revolving credit facility in lieu of a cash security deposit for one of our office leases. Two additional irrevocable standby letters of credit were executed during fiscal 2019 for $0.2 million and $0.1 million, respectively, against our revolving credit facility in lieu of cash deposits for two of our office leases. In fiscal 2020, the $0.2 million letter of credit was reduced by $0.1 million. Apart from the letters of credit, we did not have any borrowings outstanding on our revolving credit facility as of August 31, 2020, had $4.0 million outstanding as of August 31, 2019, and no borrowings outstanding as of August 31, 2018.
Off-Balance Sheet Arrangements
We did not have any off-balance sheet arrangements, as defined in Regulation S-K, Item 303(a)(4)(ii) promulgated by the SEC under the Securities Act, in fiscal 2020, 2019 or 2018.
73
Critical Accounting Policies and Estimates
The process of preparing our financial statements in conformity with U.S. GAAP requires the use of estimates and judgments that affect the reported amounts of assets, liabilities, revenue and expenses. These estimates and judgments are based on historical experience, future expectations and other factors and assumptions we believe to be reasonable under the circumstances. The most significant estimates and judgments are reviewed on an ongoing basis and are revised when necessary. Actual amounts may differ from these estimates and judgments. A summary of our significant accounting policies is contained in Note 2 of our audited consolidated financial statements included elsewhere in this Annual Report on Form 10-K.
Revenue Recognition
Revenue recognition requires judgment and the use of estimates, especially in evaluating the various non-standard terms and conditions in our contracts with customers and their effect on recorded revenue.
We derive revenues primarily from four sources:
|
|
• |
selling subscriptions to our SaaS solutions; |
|
|
• |
licensing our on-premise software applications; |
|
|
• |
providing maintenance and support services; and |
|
|
• |
providing professional services. |
The estimates and assumptions requiring significant judgment under our revenue recognition policy in accordance with FASB ASC 606 are as follows:
Determine the transaction price
The transaction price is determined based on the consideration to which we expect to be entitled in exchange for transferring products or services to the customer. Variable consideration is included in the transaction price if, in our judgment, it is probable that no significant future reversal of cumulative revenue under the contract will occur. The sale of our software and SaaS solutions may include variable consideration relating to changes in a customer’s DWP managed by these solutions. We estimate variable consideration based on historical DWP usage to the extent that a significant revenue reversal is not probable to occur.
In instances where the timing of revenue recognition differs from the timing of invoicing, we have determined that our contracts generally do not include a significant financing component. The primary purpose of our invoicing terms is to provide customers with simplified and predictable ways of purchasing our products and services, not to receive financing from customers or to provide customers with financing.
Allocate the transaction price to the performance obligations in the contract
If the contract contains a single performance obligation, the entire transaction price is allocated to the single performance obligation. Contracts that contain multiple performance obligations require an allocation of the transaction price to each performance obligation based on a relative standalone selling price (“SSP”).
The determination of SSP involves judgment. It is typically based on the observable prices of the promised goods or services charged when sold separately to customers, which are determined using contractually stated prices. In instances where SSP is not directly observable, we determine SSP based on our overall pricing objectives, taking into consideration market conditions and other factors, including customer size and geography. The various products and services comprising contracts with multiple performance obligations are typically capable of being distinct and accounted for as separate performance obligations. We allocate revenue to each of the performance obligations included in a contract with multiple performance obligations at the inception of the contract.
74
The SSP for perpetual or term-based software licenses sold in contracts with multiple performance obligations is determined using the residual approach. We utilize the residual approach because the selling prices for software licenses is highly variable and a SSP is generally not discernible from past transactions or other observable evidence. Periodically, we evaluate whether the use of the residual approach remains appropriate for performance obligations associated with software licenses when sold as part of contracts with multiple performance obligations. As a result, if the SSP analysis illustrates that the selling prices for software licenses are no longer highly variable, we utilize the relative allocation method for such arrangements.
Recent Accounting Pronouncements
A summary of recent accounting pronouncements and our assessment of any expected impact of these pronouncements if known is included in Note 2 of our audited consolidated financial statements included elsewhere in this Annual Report on Form 10-K.
JOBS Act
In April 2012, the JOBS Act was enacted. Section 107 of the JOBS Act provides that an “emerging growth company” can take advantage of the extended transition period provided in Section 7(a)(2)(B) of the Securities Act for complying with new or revised accounting standards. Thus, an emerging growth company can delay the adoption of certain accounting standards until those standards would otherwise apply to private companies. We have irrevocably elected not to avail ourselves of this extended transition period.
We are in the process of evaluating the benefits of relying on other exemptions and reduced reporting requirements under the JOBS Act. Subject to certain conditions, as an emerging growth company, we intend to rely on certain of these exemptions, including without limitation, not having to (1) provide an auditor’s attestation report on our system of internal controls over financial reporting pursuant to Section 404(b) of the Sarbanes-Oxley Act or (2) comply with any requirement that may be adopted by PCAOB regarding mandatory audit firm rotation or a supplement to the auditor’s report providing additional information about the audit and the financial statements, known as the auditor discussion and analysis. We will remain an emerging growth company until the earlier of (1) the last day of the fiscal year in which we have more than $1.07 billion in annual revenue; (2) the date we qualify as a “large accelerated filer,” which would occur if the market value of our common stock that is held by non-affiliates exceeds $700 million as of the last business day of the most recently completed second fiscal quarter; (3) the date on which we have, during the previous three-year period, issued more than $1.0 billion in non-convertible debt securities; and (4) the last day of the fiscal year ending after the fifth anniversary of the IPO.
Item 7A. Quantitative and Qualitative Disclosures About Market Risk.
We are exposed to market risks in the ordinary course of our business, including interest rate and foreign currency exchange risks.
Interest Rate Risk
As of August 31, 2020, our cash balance did not include any cash equivalents or restricted cash, and we had no outstanding indebtedness under our revolving credit facility.
To date, we have not been exposed, nor do we anticipate being exposed, to material risks due to changes in interest rates. A hypothetical 10% change in interest rates during any of the periods presented would not have had a material impact on our consolidated financial statements.
Foreign Currency Exchange Risk
Our reporting currency is the U.S. dollar, and the functional currency of each of our subsidiaries is the U.S. dollar. Gains or losses due to transactions in foreign currencies are included in “Other Income (Expense)” in our consolidated statements of operations. We have not engaged in the hedging of foreign currency transactions to date, although we may choose to do so in the future. We do not believe that a 10% increase or decrease in the relative value of the U.S. dollar to other currencies would have a material effect on operating results. Historically, we have not hedged any foreign currency exposures.
75
Item 8. Financial Statements and Supplementary Data.
|
|
|
Page |
|
Duck Creek Technologies, Inc. Index to Consolidated Financial Statements |
|
|
|
|
|
|
|
|
77 |
|
|
|
|
|
|
|
78 |
|
|
|
|
|
|
Consolidated Statements of Operations for the years ended August 31, 2020, 2019 and 2018 |
|
79 |
|
|
|
|
|
|
80 |
|
|
|
|
|
|
Consolidated Statements of Cash Flows for the years ended August 31, 2020, 2019 and 2018 |
|
81 |
|
|
|
|
|
|
82 |
76
Report of Independent Registered Public Accounting Firm
To the Stockholders and Board of Directors
Duck Creek Technologies, Inc.:
Opinion on the Consolidated Financial Statements
We have audited the accompanying consolidated balance sheets of Duck Creek Technologies, Inc. and subsidiaries (the Company) as of August 31, 2020 and 2019, the related consolidated statements of operations, stockholders’ equity/redeemable partners’ interest and partners’ capital, and cash flows for each of the years in the three‑year period ended August 31, 2020, and the related notes (collectively, the consolidated financial statements). In our opinion, the consolidated financial statements present fairly, in all material respects, the financial position of the Company as of August 31, 2020 and 2019, and the results of its operations and its cash flows for each of the years in the three‑year period ended August 31, 2020, in conformity with U.S. generally accepted accounting principles.
Change in Accounting Principle
As discussed in Note 2 to the consolidated financial statements, the Company has changed its method of accounting for leases as of September 1, 2019 due to the adoption of Accounting Standards Update (ASU) No. 2016-02, Leases (Topic 842).
Basis for Opinion
These consolidated financial statements are the responsibility of the Company’s management. Our responsibility is to express an opinion on these consolidated financial statements based on our audits. We are a public accounting firm registered with the Public Company Accounting Oversight Board (United States) (PCAOB) and are required to be independent with respect to the Company in accordance with the U.S. federal securities laws and the applicable rules and regulations of the Securities and Exchange Commission and the PCAOB.
We conducted our audits in accordance with the standards of the PCAOB. Those standards require that we plan and perform the audit to obtain reasonable assurance about whether the consolidated financial statements are free of material misstatement, whether due to error or fraud. Our audits included performing procedures to assess the risks of material misstatement of the consolidated financial statements, whether due to error or fraud, and performing procedures that respond to those risks. Such procedures included examining, on a test basis, evidence regarding the amounts and disclosures in the consolidated financial statements. Our audits also included evaluating the accounting principles used and significant estimates made by management, as well as evaluating the overall presentation of the consolidated financial statements. We believe that our audits provide a reasonable basis for our opinion.
/s/ KPMG LLP
We have served as the Company’s auditor since 2017.
Boston, Massachusetts
November 3, 2020
77
DUCK CREEK TECHNOLOGIES, INC. AND SUBSIDIARIES
(In thousands)
|
|
|
As of August 31, |
|
|||||
|
|
|
2020 |
|
|
2019 |
|
||
|
Assets |
|
|
|
|
|
|
|
|
|
Current assets: |
|
|
|
|
|
|
|
|
|
Cash and cash equivalents |
|
$ |
389,878 |
|
|
$ |
11,999 |
|
|
Accounts receivable, net |
|
|
29,149 |
|
|
|
25,450 |
|
|
Unbilled revenue |
|
|
18,121 |
|
|
|
15,293 |
|
|
Prepaid expenses and other current assets |
|
|
12,186 |
|
|
|
5,772 |
|
|
Total current assets |
|
|
449,334 |
|
|
|
58,514 |
|
|
Property and equipment, net |
|
|
18,113 |
|
|
|
17,058 |
|
|
Operating lease assets |
|
|
18,171 |
|
|
|
— |
|
|
Goodwill |
|
|
272,455 |
|
|
|
272,455 |
|
|
Intangible assets, net |
|
|
81,687 |
|
|
|
98,756 |
|
|
Deferred tax assets |
|
|
1,550 |
|
|
|
860 |
|
|
Unbilled revenue, net of current portion |
|
|
3,487 |
|
|
|
8,045 |
|
|
Other assets |
|
|
16,303 |
|
|
|
11,589 |
|
|
Total assets |
|
$ |
861,100 |
|
|
$ |
467,277 |
|
|
Liabilities and Stockholders' Equity/Redeemable Partners’ Interest and Partner’s Capital |
|
|
|
|
|
|
|
|
|
Current liabilities: |
|
|
|
|
|
|
|
|
|
Accounts payable |
|
|
1,802 |
|
|
|
1,362 |
|
|
Accrued liabilities |
|
|
58,202 |
|
|
|
31,003 |
|
|
Contingent earnout liability |
|
|
3,701 |
|
|
|
4,055 |
|
|
Lease liability |
|
|
3,611 |
|
|
|
— |
|
|
Deferred revenue |
|
|
30,397 |
|
|
|
23,470 |
|
|
Total current liabilities |
|
|
97,713 |
|
|
|
59,890 |
|
|
Contingent earnout liability, net of current portion |
|
|
3,391 |
|
|
|
6,460 |
|
|
Borrowings under credit facility |
|
|
— |
|
|
|
4,000 |
|
|
Lease liability, net of current portion |
|
|
21,739 |
|
|
|
— |
|
|
Deferred rent, net of current portion |
|
|
— |
|
|
|
5,388 |
|
|
Deferred revenue, net of current portion |
|
|
379 |
|
|
|
692 |
|
|
Other long-term liabilities |
|
|
4,121 |
|
|
|
1,781 |
|
|
Total liabilities |
|
|
127,343 |
|
|
|
78,211 |
|
|
Commitments and contingencies (Note 13) |
|
|
|
|
|
|
|
|
|
Total redeemable partners' interest and partners' capital |
|
|
— |
|
|
|
389,066 |
|
|
Stockholders' Equity |
|
|
|
|
|
|
|
|
|
Common stock, 133,269,301 shares issued and 130,713,745 shares outstanding, 300,000,000 shares authorized, par value $0.01 per share |
|
|
1,333 |
|
|
|
— |
|
|
Preferred stock, 0 shares outstanding, 50,000,000 shares authorized, par value $0.01 per share |
|
|
— |
|
|
|
— |
|
|
Treasury stock, common shares at cost; 2,555,556 shares at August 31, 2020 |
|
|
(64,688 |
) |
|
|
— |
|
|
Accumulated deficit |
|
|
(24,334 |
) |
|
|
— |
|
|
Additional paid in capital |
|
|
821,446 |
|
|
|
— |
|
|
Total stockholders' equity/redeemable partners’ interest and partners' capital |
|
|
733,757 |
|
|
|
389,066 |
|
|
Total liabilities, stockholders' equity/redeemable partners’ interest and partners’ capital |
|
$ |
861,100 |
|
|
$ |
467,277 |
|
See accompanying notes to consolidated financial statements.
78
DUCK CREEK TECHNOLOGIES, INC. AND SUBSIDIARIES
Consolidated Statements of Operations
(In thousands, except per share information)
|
|
|
Year Ended August 31, |
|
|||||||||
|
|
|
2020 |
|
|
2019 |
|
|
2018 |
|
|||
|
Revenue: |
|
|
|
|
|
|
|
|
|
|
|
|
|
Subscription |
|
|
83,999 |
|
|
|
55,909 |
|
|
|
42,451 |
|
|
License |
|
|
9,914 |
|
|
|
13,776 |
|
|
|
20,969 |
|
|
Maintenance and support |
|
|
23,680 |
|
|
|
23,896 |
|
|
|
26,034 |
|
|
Professional services |
|
|
94,079 |
|
|
|
77,692 |
|
|
|
70,215 |
|
|
Total revenue |
|
|
211,672 |
|
|
|
171,273 |
|
|
|
159,669 |
|
|
Cost of revenue: |
|
|
|
|
|
|
|
|
|
|
|
|
|
Subscription |
|
|
34,902 |
|
|
|
24,199 |
|
|
|
22,272 |
|
|
License |
|
|
1,853 |
|
|
|
1,970 |
|
|
|
2,121 |
|
|
Maintenance and support |
|
|
3,338 |
|
|
|
2,781 |
|
|
|
2,456 |
|
|
Professional services |
|
|
57,082 |
|
|
|
43,228 |
|
|
|
37,483 |
|
|
Total cost of revenue |
|
|
97,175 |
|
|
|
72,178 |
|
|
|
64,332 |
|
|
Gross margin |
|
|
114,497 |
|
|
|
99,095 |
|
|
|
95,337 |
|
|
Operating expenses: |
|
|
|
|
|
|
|
|
|
|
|
|
|
Research and development |
|
|
44,052 |
|
|
|
35,936 |
|
|
|
36,056 |
|
|
Sales and marketing |
|
|
50,305 |
|
|
|
40,189 |
|
|
|
34,158 |
|
|
General and administrative |
|
|
48,662 |
|
|
|
36,493 |
|
|
|
30,670 |
|
|
Change in fair value of contingent consideration |
|
|
133 |
|
|
|
628 |
|
|
|
801 |
|
|
Total operating expenses |
|
|
143,152 |
|
|
|
113,246 |
|
|
|
101,685 |
|
|
Loss from operations |
|
|
(28,655 |
) |
|
|
(14,151 |
) |
|
|
(6,348 |
) |
|
Other income (expense), net |
|
|
641 |
|
|
|
(565 |
) |
|
|
(533 |
) |
|
Interest expense, net |
|
|
(356 |
) |
|
|
(1,030 |
) |
|
|
(567 |
) |
|
Loss before income taxes |
|
|
(28,370 |
) |
|
|
(15,746 |
) |
|
|
(7,448 |
) |
|
Provision for income taxes |
|
|
1,562 |
|
|
|
1,150 |
|
|
|
354 |
|
|
Net loss |
|
|
(29,932 |
) |
|
|
(16,896 |
) |
|
|
(7,802 |
) |
|
Net loss per share information1 |
|
|
|
|
|
|
|
|
|
|
|
|
|
Net loss per share of common stock, basic and diluted |
|
$ |
(0.19 |
) |
|
|
|
|
|
|
|
|
|
|
|
|
|
|
|
|
|
|
|
|
|
|
|
1. Represents net loss per share of common stock outstanding for the period from August 14, 2020 through August 31, 2020, the period following the Reorganization Transactions and Duck Creek Technologies, Inc.'s initial public offering described in Note 1—Nature of Business. See Note 9—Net Loss Per Share for additional details. |
|
|||||||||||
|
|
|
|
|
|
|
|
|
|
|
|
|
|
See accompanying notes to consolidated financial statements.
79
DUCK CREEK TECHNOLOGIES, INC. AND SUBSIDIARIES
Consolidated Statements of Stockholders’ Equity/Redeemable Partners’ Interest and Partners’ Capital
(In thousands, except share information)
|
|
|
|
|
|
|
Common stock |
|
|
Treasury Stock |
|
|
|
|
|
|
|
|
|
|
|
|
|
|
|
|
|
||||||||||
|
|
|
Total redeemable partners’ interest and partners' capital |
|
|
Shares |
|
|
Amount |
|
|
Shares |
|
|
Amount |
|
|
Additional paid-in capital |
|
|
Accumulated deficit |
|
|
Non-controlling interests |
|
|
Total stockholders' equity/redeemable partners' interest and partners' capital |
|
|||||||||
|
Balance at August 31, 2017 |
|
$ |
407,930 |
|
|
|
— |
|
|
$ |
— |
|
|
|
— |
|
|
$ |
— |
|
|
$ |
— |
|
|
$ |
— |
|
|
$ |
— |
|
|
$ |
407,930 |
|
|
Equity-based compensation |
|
|
1,739 |
|
|
|
— |
|
|
|
— |
|
|
|
— |
|
|
|
— |
|
|
|
— |
|
|
|
— |
|
|
|
— |
|
|
|
1,739 |
|
|
Net loss |
|
|
(7,802 |
) |
|
|
— |
|
|
|
— |
|
|
|
— |
|
|
|
— |
|
|
|
— |
|
|
|
— |
|
|
|
— |
|
|
|
(7,802 |
) |
|
Balance at August 31, 2018 |
|
$ |
401,867 |
|
|
|
— |
|
|
$ |
— |
|
|
|
— |
|
|
$ |
— |
|
|
$ |
— |
|
|
$ |
— |
|
|
$ |
— |
|
|
$ |
401,867 |
|
|
Class C Units issued in connection with business combination |
|
|
2,025 |
|
|
|
— |
|
|
|
— |
|
|
|
— |
|
|
|
— |
|
|
|
— |
|
|
|
— |
|
|
|
— |
|
|
|
2,025 |
|
|
Equity-based compensation |
|
|
2,070 |
|
|
|
— |
|
|
|
— |
|
|
|
— |
|
|
|
— |
|
|
|
— |
|
|
|
— |
|
|
|
— |
|
|
|
2,070 |
|
|
Net loss |
|
|
(16,896 |
) |
|
|
— |
|
|
|
— |
|
|
|
— |
|
|
|
— |
|
|
|
— |
|
|
|
— |
|
|
|
— |
|
|
|
(16,896 |
) |
|
Balance at August 31, 2019 |
|
$ |
389,066 |
|
|
|
— |
|
|
$ |
— |
|
|
|
— |
|
|
$ |
— |
|
|
$ |
— |
|
|
$ |
— |
|
|
$ |
— |
|
|
$ |
389,066 |
|
|
Class D Units and Phantom Units granted |
|
|
— |
|
|
|
— |
|
|
|
— |
|
|
|
— |
|
|
|
— |
|
|
|
— |
|
|
|
— |
|
|
|
— |
|
|
|
— |
|
|
Class E Units issued, net of issuance costs |
|
|
438,648 |
|
|
|
— |
|
|
|
— |
|
|
|
— |
|
|
|
— |
|
|
|
— |
|
|
|
— |
|
|
|
— |
|
|
|
438,648 |
|
|
Class A Units redeemed prior to the Reorganization Transactions |
|
|
(238,800 |
) |
|
|
— |
|
|
|
— |
|
|
|
— |
|
|
|
— |
|
|
|
— |
|
|
|
— |
|
|
|
— |
|
|
|
(238,800 |
) |
|
Class B Units redeemed prior to the Reorganization Transactions |
|
|
(159,200 |
) |
|
|
— |
|
|
|
— |
|
|
|
— |
|
|
|
— |
|
|
|
— |
|
|
|
— |
|
|
|
— |
|
|
|
(159,200 |
) |
|
Share-based compensation expense prior to Reorganization Transactions |
|
|
1,766 |
|
|
|
— |
|
|
|
— |
|
|
|
— |
|
|
|
— |
|
|
|
— |
|
|
|
— |
|
|
|
— |
|
|
|
1,766 |
|
|
Net loss prior to Reorganization Transactions |
|
|
(5,598 |
) |
|
|
— |
|
|
|
— |
|
|
|
— |
|
|
|
— |
|
|
|
— |
|
|
|
— |
|
|
|
— |
|
|
|
(5,598 |
) |
|
Reorganization Transactions: |
|
|
|
|
|
|
|
|
|
|
|
|
|
|
|
|
|
|
|
|
|
|
|
|
|
|
|
|
|
|
|
|
|
|
|
|
|
Exchange of LP interests for common stock and initial effect of Reorganization Transactions on non-controlling interest |
|
|
(425,882 |
) |
|
|
115,996,833 |
|
|
|
1,160 |
|
|
|
— |
|
|
|
— |
|
|
|
425,556 |
|
|
|
— |
|
|
|
(834 |
) |
|
|
(0 |
) |
|
Initial Public Offering Transactions: |
|
|
|
|
|
|
|
|
|
|
|
|
|
|
|
|
|
|
|
|
|
|
|
|
|
|
|
|
|
|
|
|
|
|
|
|
|
Issuance of common stock for IPO net of underwriting discounts and offering costs |
|
|
— |
|
|
|
17,250,000 |
|
|
|
173 |
|
|
|
— |
|
|
|
— |
|
|
|
429,067 |
|
|
|
— |
|
|
|
— |
|
|
|
429,240 |
|
|
Purchase of common stock from Apax |
|
|
— |
|
|
|
— |
|
|
|
— |
|
|
|
2,555,556 |
|
|
|
(64,688 |
) |
|
|
— |
|
|
|
— |
|
|
|
— |
|
|
|
(64,688 |
) |
|
Purchase of non-controlling interests in Operating Partnership from Accenture and RBW |
|
|
— |
|
|
|
— |
|
|
|
— |
|
|
|
— |
|
|
|
— |
|
|
|
(43,959 |
) |
|
|
— |
|
|
|
834 |
|
|
|
(43,125 |
) |
|
Issuance of common stock upon RSA's vesting |
|
|
— |
|
|
|
22,468 |
|
|
|
— |
|
|
|
|
|
|
|
|
|
|
|
— |
|
|
|
— |
|
|
|
— |
|
|
|
— |
|
|
Share-based compensation expense subsequent to Reorganization Transactions |
|
|
— |
|
|
|
— |
|
|
|
— |
|
|
|
— |
|
|
|
— |
|
|
|
10,782 |
|
|
|
— |
|
|
|
— |
|
|
|
10,782 |
|
|
Net loss subsequent to Reorganization Transactions |
|
|
— |
|
|
|
— |
|
|
|
— |
|
|
|
— |
|
|
|
— |
|
|
|
— |
|
|
|
(24,334 |
) |
|
|
— |
|
|
|
(24,334 |
) |
|
Balance at August 31, 2020 |
|
$ |
— |
|
|
|
133,269,301 |
|
|
$ |
1,333 |
|
|
|
2,555,556 |
|
|
$ |
(64,688 |
) |
|
$ |
821,446 |
|
|
$ |
(24,334 |
) |
|
$ |
— |
|
|
$ |
733,757 |
|
See accompanying notes to consolidated financial statements.
80
DUCK CREEK TECHNOLOGIES, INC. AND SUBSIDIARIES
Consolidated Statements of Cash Flows
(In thousands)
|
|
|
Year Ended August 31, |
|
|||||||||
|
|
|
2020 |
|
|
2019 |
|
|
2018 |
|
|||
|
Operating activities: |
|
|
|
|
|
|
|
|
|
|
|
|
|
Net loss |
|
|
(29,932 |
) |
|
$ |
(16,896 |
) |
|
$ |
(7,802 |
) |
|
Adjustments to reconcile net loss to cash provided by operating activities: |
|
|
|
|
|
|
|
|
|
|
|
|
|
Depreciation of property and equipment |
|
|
3,143 |
|
|
|
2,398 |
|
|
|
1,915 |
|
|
Amortization of intangible assets |
|
|
17,773 |
|
|
|
17,594 |
|
|
|
17,677 |
|
|
Impairment of right of use asset |
|
|
2,792 |
|
|
|
— |
|
|
|
— |
|
|
Amortization of deferred financing fees |
|
|
134 |
|
|
|
136 |
|
|
|
136 |
|
|
Share-based compensation expense |
|
|
21,108 |
|
|
|
2,070 |
|
|
|
1,739 |
|
|
Loss on change in fair value of contingent earnout liability |
|
|
133 |
|
|
|
628 |
|
|
|
801 |
|
|
Payment on contingent earnout liability in excess of acquisition date fair value |
|
|
— |
|
|
|
(2,350 |
) |
|
|
— |
|
|
Bad debt expense |
|
|
97 |
|
|
|
182 |
|
|
|
165 |
|
|
Deferred taxes |
|
|
(690 |
) |
|
|
188 |
|
|
|
(533 |
) |
|
Changes in operating assets and liabilities |
|
|
|
|
|
|
|
|
|
|
|
|
|
Accounts receivable |
|
|
(3,796 |
) |
|
|
(6,285 |
) |
|
|
3,310 |
|
|
Unbilled revenue |
|
|
1,730 |
|
|
|
4,481 |
|
|
|
(330 |
) |
|
Prepaid expenses and other current assets |
|
|
(6,300 |
) |
|
|
198 |
|
|
|
660 |
|
|
Other assets |
|
|
(5,764 |
) |
|
|
(3,788 |
) |
|
|
(2,794 |
) |
|
Accounts payable |
|
|
(181 |
) |
|
|
(783 |
) |
|
|
(4,016 |
) |
|
Accrued liabilities |
|
|
16,393 |
|
|
|
9,150 |
|
|
|
(2,566 |
) |
|
Contingent earnout liability |
|
|
— |
|
|
|
— |
|
|
|
(2,067 |
) |
|
Deferred revenue |
|
|
6,614 |
|
|
|
5,972 |
|
|
|
1,728 |
|
|
Deferred rent |
|
|
— |
|
|
|
1,661 |
|
|
|
3,646 |
|
|
Operating leases |
|
|
132 |
|
|
|
— |
|
|
|
— |
|
|
Other long-term liabilities |
|
|
2,339 |
|
|
|
277 |
|
|
|
164 |
|
|
Net cash provided by operating activities |
|
|
25,725 |
|
|
|
14,833 |
|
|
|
11,833 |
|
|
Investing activities: |
|
|
|
|
|
|
|
|
|
|
|
|
|
Acquisition of Outline Systems LLC |
|
|
— |
|
|
|
(9,814 |
) |
|
|
— |
|
|
Acquisition of CedeRight Products |
|
|
— |
|
|
|
(1,827 |
) |
|
|
— |
|
|
Capitalized internal-use software |
|
|
(2,893 |
) |
|
|
(2,956 |
) |
|
|
(1,456 |
) |
|
Purchase of property and equipment |
|
|
(3,854 |
) |
|
|
(5,314 |
) |
|
|
(7,138 |
) |
|
Net cash used in investing activities |
|
|
(6,747 |
) |
|
|
(19,911 |
) |
|
|
(8,594 |
) |
|
Financing activities: |
|
|
|
|
|
|
|
|
|
|
|
|
|
Proceeds from IPO |
|
|
433,657 |
|
|
|
— |
|
|
|
— |
|
|
Proceeds from issuance of Class E Units, net of issuance costs |
|
|
438,840 |
|
|
|
— |
|
|
|
— |
|
|
Payment on redemption of Class A and Class B Units |
|
|
(398,000 |
) |
|
|
— |
|
|
|
— |
|
|
Purchase of non-controlling interest |
|
|
(43,125 |
) |
|
|
|
|
|
|
|
|
|
Purchase of treasury stock |
|
|
(64,688 |
) |
|
|
— |
|
|
|
— |
|
|
Payments of contingent consideration |
|
|
(3,555 |
) |
|
|
— |
|
|
|
(871 |
) |
|
Proceeds from revolving credit facility |
|
|
5,000 |
|
|
|
12,000 |
|
|
|
5,000 |
|
|
Payments on revolving credit facility |
|
|
(9,000 |
) |
|
|
(8,000 |
) |
|
|
(5,000 |
) |
|
Payment of deferred offering costs |
|
|
— |
|
|
|
(772 |
) |
|
|
— |
|
|
Payment of deferred financing costs |
|
|
(228 |
) |
|
|
(30 |
) |
|
|
(30 |
) |
|
Net cash provided by (used in) financing activities |
|
|
358,901 |
|
|
|
3,198 |
|
|
|
(901 |
) |
|
Net increase (decrease) in cash and cash equivalents |
|
|
377,879 |
|
|
|
(1,880 |
) |
|
|
2,338 |
|
|
Cash, cash equivalents and restricted cash – beginning of period |
|
|
11,999 |
|
|
|
13,879 |
|
|
|
11,541 |
|
|
Cash, cash equivalents and restricted cash – end of period |
|
|
389,878 |
|
|
$ |
11,999 |
|
|
$ |
13,879 |
|
|
Supplemental disclosure of other cash flow information: |
|
|
|
|
|
|
|
|
|
|
|
|
|
Cash paid for income taxes |
|
|
2,006 |
|
|
|
976 |
|
|
|
1,189 |
|
|
Cash paid for interest |
|
|
269 |
|
|
|
527 |
|
|
|
198 |
|
|
Purchases of property and equipment recorded in accounts payable and accrued liabilities |
|
|
227 |
|
|
|
936 |
|
|
|
499 |
|
|
Fair value of contingent consideration |
|
|
7,452 |
|
|
|
11,325 |
|
|
|
2,562 |
|
|
Deferred IPO costs in accounts payable and accrued liabilities |
|
|
3,650 |
|
|
|
263 |
|
|
|
— |
|
|
Deferred Class E offering costs in accrued expenses |
|
|
192 |
|
|
|
— |
|
|
|
— |
|
See accompanying notes to consolidated financial statements.
81
DUCK CREEK TECHNOLOGIES, INC. AND SUBSIDIARIES
Notes to Consolidated Financial Statements
(amounts in thousands except unit and per unit and share and per share amounts)
|
(1) |
Nature of Business |
Duck Creek Technologies, Inc (the Company) is a provider of Software-as-a-Service (SaaS) core systems to the property and casualty (P&C) insurance industry, through Duck Creek OnDemand. Products offered include Duck Creek Policy, Duck Creek Billing, Duck Creek Claims, Duck Creek Rating, Duck Creek Insights, Duck Creek Distribution Management, Duck Creek Reinsurance Management, Duck Creek Anywhere Managed Integrations, and Duck Creek Industry Content. The Company also provides its products via perpetual and term license arrangements to customers with legacy systems that have yet to upgrade to SaaS.
The Company was formed as a Delaware corporation on November 15, 2019, with no operating assets or operations for the purpose of facilitating an initial public offering (the IPO) and related Reorganization Transactions (as described below) in order to carry on the business of Disco Topco Holdings (Cayman), L.P. and its subsidiaries (the Operating Partnership). Unless otherwise indicated or the context otherwise requires, references to “Duck Creek Technologies” and the “Company” refer to (a) prior to the consummation of the Reorganization Transactions and the IPO, to Disco Topco Holdings (Cayman), L.P., and its subsidiaries, and (b) after the consummation of the Reorganization Transactions and IPO to Duck Creek Technologies, Inc, and its subsidiaries.
The Company’s headquarters are located in Boston, Massachusetts. The Company also has sales offices in the United Kingdom, Spain and Australia, as well as a service center located in India.
Initial Public Offering
On August 14, 2020, the Company completed its IPO. It sold 17,250,000 shares of common stock (including shares issued pursuant to the exercise in full of the underwriters’ option to purchase additional shares) at a public offering price of $27.00 per share for net proceeds of $429.2 million, after deducting underwriting discounts, commissions, and estimated offering expenses.
The Company used (i) $43.1 million of the net proceeds received from the IPO to redeem all of the outstanding LP Units of the Operating Partnership retained by Accenture plc (Accenture) and RBW Investment GmbH & Co. (RBW), after giving effect to the contributions that were part of the Reorganization Transactions, at a redemption price per LP Unit equal to the IPO price less underwriting discounts and commissions, (ii) $64.7 million of the net proceeds received from the IPO to repurchase from Apax Partners L.P. (Apax) a portion of the shares in the Company received by Apax in the Reorg Merger (as described below) at a repurchase price per share equal to the IPO price less underwriting discounts and commissions, and (iii) $6.7 million of net proceeds received from the IPO to cash settle outstanding equity awards of certain international employees.
Reorganization Transactions
The Company and the Operating Partnership completed a series of transactions concurrently with or immediately following the completion of the IPO (Reorganization Transactions) which are described below:
|
|
• |
The Company adopted an amended and restated certification of incorporation that authorized, immediately prior to the IPO, one class of common stock and one class of preferred stock. |
|
|
• |
Apax contributed the entity that held all of Apax’s equity interests in the Operating Partnership and all of Apax’s interest in the general partner of the Operating Partnership (General Partner) to a newly-formed Cayman company (the Reorg Subsidiary) in exchange for shares in the Reorg Subsidiary. |
82
DUCK CREEK TECHNOLOGIES, INC. AND SUBSIDIARIES
Notes to Consolidated Financial Statements
(amounts in thousands except unit and per unit and share and per share amounts)
|
|
• |
Certain members of management contributed to the Company, directly or indirectly, all of their respective equity interests in the Operating Partnership in exchange for (i) newly-issued common stock in the Company or (ii) restricted common stock in the Company and options to acquire common stock in the Company with an exercise price equal to the fair market value on the date of grant. |
|
|
• |
All other investors in the Operating Partnership (excluding Apax, Accenture, and RBW) contributed to the Company, directly or indirectly, all of their equity interests in the Operating Partnership in exchange for newly-issued common stock in the Company. |
|
|
• |
The Company contributed a portion of the net proceeds received from the IPO to the Operating Partnership and the Operating Partnership redeemed the outstanding LP Units of the Operating Partnership owned by Accenture and RBW that were not contributed to the Company. |
|
|
• |
Immediately following the completion of the IPO, (i) Apax exchanged all of its shares in the Reorg Subsidiary for newly-issued common stock in the Company and (ii) the Reorg Subsidiary merged with and into the Company (and subsequently ceased existence) (collectively, the Reorg Merger). |
|
|
• |
Following these transactions and the subsequent redemption of the outstanding LP Units owned by Accenture and RBW that were not contributed to the Company, the Company indirectly owns all of the LP Units of the Operating Partnership and all interest in the General Partner. |
The Reorganization Transactions are considered transactions between entities under common control. As a result, Disco Topco Holdings (Cayman), L.P., is considered the predecessor of Duck Creek Technologies, Inc. for accounting purposes. This has resulted in the presentation of Disco Topco Holdings (Cayman), L.P.’s historical consolidated financial statements as the historical consolidated financial statements of Duck Creek Technologies, Inc. Duck Creek Technologies, Inc., has accounted for Disco Topco Holdings (Cayman), L.P.’s assets and liabilities at their historical carrying amounts.
|
(2) |
Summary of Significant Accounting Policies |
The accompanying consolidated financial statements reflect the application of significant accounting policies as described below.
|
|
(a) |
Basis of Presentation |
The consolidated financial statements have been prepared in accordance with generally accepted accounting principles in the United States of America (GAAP) set by the Financial Accounting Standards Board (FASB). References to GAAP issued by the FASB in these notes are to the FASB Accounting Standards Codification (FASB ASC). The Company has no items of other comprehensive income or loss; therefore, the Company’s net loss is identical to its comprehensive loss.
83
DUCK CREEK TECHNOLOGIES, INC. AND SUBSIDIARIES
Notes to Consolidated Financial Statements
(amounts in thousands except unit and per unit and share and per share amounts)
Revenue Accounting
In May 2014, the FASB issued Accounting Standards Update (ASU) No. 2014-09, Revenue from Contracts with Customers (Topic 606), now commonly referred to as Accounting Standards Codification Topic 606 (ASC 606). ASC 606 supersedes the revenue recognition requirements in Accounting Standards Codification Topic 605, Revenue Recognition (ASC 605) as well as other industry-specific guidance. The core principle of ASC 606 is that an entity should recognize revenue when control of the promised goods or services is transferred to customers at an amount that reflects the consideration to which the Company expects to be entitled to in exchange for those goods or services. In addition, under ASC 606, the direct and incremental costs to obtain contracts with customers, including sales commissions, are deferred and recognized over a period of time that is consistent with the transfer to the customer of the products and services to which the asset relates. The Company early-adopted ASC 606, effective September 1, 2017, using the full retrospective transition method. Accordingly, the consolidated financial statements present revenue and contract costs in accordance with ASC 606 for all periods presented.
Lease Accounting
In February 2016, FASB issued ASU 2016-02, Leases, which requires companies to recognize on the balance sheet the assets and liabilities for the rights and obligations created by the leased asset. The standard is effective for fiscal years, and interim periods within those fiscal years, beginning after December 15, 2018. The Company adopted this standard effective September 1, 2019 using the modified retrospective approach for all leases entered into before the effective date. The Company also elected to implement the new standard at the adoption date with a cumulative-effect adjustment, if any, recognized to the opening balance of accumulative deficit in the period of adoption.
For comparability purposes, the Company will continue to comply with the previous disclosure requirements in accordance with the existing lease guidance for all periods presented in the year of adoption. The Company elected the package of practical expedients as permitted under the transition guidance, which allowed us: (1) to carry forward the historical lease classification; (2) not to reassess whether expired or existing contracts are or contain leases; and (3) not to reassess the treatment of initial direct costs for existing leases. In addition, the Company elected an accounting policy to not recognize leases with an initial term of one year or less on the balance sheet.
Upon the adoption of this standard on September 1, 2019, the Company recognized a total lease liability of $26.7 million, representing the present value of the minimum rental payments remaining as of the adoption date, a reduction of the deferred rent liability of $5.7 million and operating lease assets in the amount of $21.0 million. The Company did not have any finance leases (formerly referred to as capital leases prior to the adoption of ASC 842), therefore there was no change in accounting treatment required).
Other Accounting Pronouncements Recently Adopted
In November 2015, FASB issued Accounting Standards Update (ASU) No. 2015-17 (Topic 740), Balance Sheet Classification of Deferred Taxes (ASU 2015-17). ASU 2015-17 requires deferred tax liabilities and assets to be classified as noncurrent in the consolidated balance sheet. ASU 2015-17 may be applied either prospectively or retrospectively to all periods presented. The Company adopted ASU 2015-17 on a prospective basis effective September 1, 2018.
|
|
(c) |
Principles of Consolidation |
The accompanying consolidated financial statements include the accounts of the Company and its wholly owned subsidiaries. All intercompany balances and transactions have been eliminated in consolidation.
84
DUCK CREEK TECHNOLOGIES, INC. AND SUBSIDIARIES
Notes to Consolidated Financial Statements
(amounts in thousands except unit and per unit and share and per share amounts)
The Company’s fiscal year ends on August 31 of each calendar year.
|
|
(e) |
Use of Estimates |
The preparation of the consolidated financial statements in conformity with GAAP requires management to make estimates and assumptions that affect the reported amounts of assets and liabilities and disclosure of contingent assets and liabilities at the date of the consolidated financial statements and the reported amounts of revenue and expenses during the reporting period. Estimates are used when accounting for certain items such as valuation of goodwill and intangible assets, the useful lives of intangible assets, share-based compensation, standalone selling prices in transactions with customers that include multiple performance obligations, assets acquired and liabilities assumed in business combinations, contingent earnout liabilities, and capitalized software development costs.
Although the Company regularly assesses these estimates, actual results could differ materially from these estimates. Changes in estimates are recorded in the period in which they become known. The Company bases its estimates on historical experience and various other assumptions that it believes to be reasonable under the circumstances. Actual results could differ from management’s estimates if past experience or other assumptions are not substantially accurate.
|
|
(f) |
Foreign Currency |
The functional currency of the Company’s foreign subsidiaries is the U.S. dollar. Transactions in local currencies are translated to the U.S. dollar and recorded as gains and losses in other income (expense) in the accompanying consolidated statements of operations. Transaction gains and losses for all periods presented were not material.
|
|
(g) |
Revenue Recognition |
The Company derives its revenues primarily from the following four sources, which represent performance obligations of the Company:
|
|
• |
Sales of hosted software services (SaaS) under subscription arrangements. |
|
|
• |
Sales of software licenses. Software license revenue is derived from the sale of perpetual and term license arrangements to customers. |
|
|
• |
Sales of maintenance and support services. Maintenance and support services include telephone and web-based support, software updates, and rights to unspecified software upgrades on a when-and-if-available basis during the maintenance term. |
|
|
• |
Sales of professional services. Professional services primarily relate to the implementation of the Company’s SaaS offerings and software licenses. |
In accordance with ASC 606, the Company recognizes revenue from the identified performance obligations, as determined in its contracts with customers, as control is transferred to the customer in an amount that reflects the consideration the Company expects to receive. The Company applies the following five steps to achieve the core principle of ASC 606:
|
|
(1) |
Identify the contract with the customer |
The Company considers the terms and conditions of the contracts and its customary business practices in identifying contracts under ASC 606. The Company has determined that a contract with a customer exists when the contract is approved, each party’s rights regarding the services to be transferred can be identified, payment terms for the services can be identified, the customer has the ability and intent to pay, and the contract has commercial substance. The Company applies judgment in determining the customer’s ability and intent to pay, which is based on a variety of factors, including the customer’s historical payment experience or, in the case of a new customer, credit and financial information pertaining to the customer.
85
DUCK CREEK TECHNOLOGIES, INC. AND SUBSIDIARIES
Notes to Consolidated Financial Statements
(amounts in thousands except unit and per unit and share and per share amounts)
|
|
parties or from the Company, and are distinct in the context of the contract, whereby the transfer of the products or services is separately identifiable from other promises in the contract. |
|
|
(3) |
Determine the transaction price |
The transaction price is determined based on the consideration to which the Company expects to be entitled in exchange for transferring products or services to the customer. Variable consideration is included in the transaction price if, in the Company’s judgment, it is probable that no significant future reversal of cumulative revenue under the contract will occur. The sale of the Company’s software and SaaS products may include variable consideration relating to changes in a customer’s direct written premium (DWP) managed by these solutions. The Company estimates variable consideration based on historical DWP usage to the extent that a significant revenue reversal is not probable to occur.
In instances where the timing of revenue recognition differs from the timing of invoicing, the Company has determined that contracts generally do not include a significant financing component. The primary purpose of the Company’s invoicing terms is to provide customers with simplified and predictable ways of purchasing our products and services, not to receive financing from customers or to provide customers with financing.
|
|
(4) |
Allocate the transaction price to the performance obligations in the contract |
If the contract contains a single performance obligation, the entire transaction price is allocated to the single performance obligation. Contracts that contain multiple performance obligations require an allocation of the transaction price to each performance obligation based on a relative standalone selling price (SSP).
|
|
(5) |
Recognize revenue when (or as) the Company satisfies a performance obligation |
Revenue is recognized at the time the related performance obligation is satisfied by transferring the promised product or service to a customer. Revenue is recognized when control of the products or services are transferred to the Company’s customers, in an amount that reflects the consideration that it expects to receive in exchange for those products or services.
The Company records revenue net of applicable sales taxes collected. Sales taxes collected from customers are recorded as part of accounts payable in the accompanying consolidated balance sheets and are remitted to state and local taxing jurisdictions based on the filing requirements of each jurisdiction.
Disaggregation of Revenue
The Company provides disaggregation of revenue based on product and service type on the consolidated statements of operations as it believes these categories best depict how the nature, amount, timing and uncertainty of revenue and cash flows are affected by economic factors.
The following table summarizes revenue by geographic area based on the location of the contracting entity, regardless of where the products or services are used, for the years ended August 31, 2020, 2019 and 2018:
|
|
|
Years ended August 31 |
|
|||||||||
|
|
|
2020 |
|
|
2019 |
|
|
2018 |
|
|||
|
United States |
|
$ |
200,373 |
|
|
$ |
162,585 |
|
|
$ |
147,099 |
|
|
All other |
|
|
11,299 |
|
|
|
8,688 |
|
|
|
12,570 |
|
|
Total revenue |
|
$ |
211,672 |
|
|
$ |
171,273 |
|
|
$ |
159,669 |
|
Subscription Arrangements
The transaction price allocated to subscription arrangements is recognized as revenue over time throughout the term of the contract as the services are provided on a continuous basis, beginning after the SaaS environment is provisioned and made available to customers. The Company’s subscription arrangements generally have terms of three to seven years and are generally payable on a monthly basis over the term of the subscription arrangement, which is typically noncancelable. Revenue is recognized ratably using contractual DWP as the measure of progress.
86
DUCK CREEK TECHNOLOGIES, INC. AND SUBSIDIARIES
Notes to Consolidated Financial Statements
(amounts in thousands except unit and per unit and share and per share amounts)
The Company has concluded that its software licenses provide the customer with the right to functional intellectual property (IP), and are distinct performance obligations as the customer can benefit from the software licenses on their own. The transaction price allocated to perpetual and term license arrangements is recognized as revenue at a point in time when control is transferred to the customer, which generally occurs at the time of delivery. Perpetual software license fees are generally payable when the contract is executed. Term license fees are generally payable in advance on an annual basis over the term of the license arrangement, which is typically noncancelable. Perpetual and term license arrangements are delivered before related services are provided, including maintenance and support services, and are functional without such services.
Maintenance and Support Services
Maintenance and support contracts associated with the Company’s software licenses entitle customers to receive technical support and software updates, on a when and if available basis, during the term of the maintenance and support contract. Technical support and software updates are considered distinct from the related software licenses but accounted for as a single performance obligation as they each constitute a series of distinct services that are substantially the same and have the same pattern of transfer to the customer. The transaction price allocated to software maintenance and support is recognized as revenue over time on a straight-line basis over the term of the maintenance and support contract. Maintenance and support fees are generally payable in advance on a monthly, quarterly, or annual basis over the term of the maintenance and support contract. Maintenance and support contracts are priced as a percentage of the associated software license.
Professional Services
The Company’s professional services revenue is primarily comprised of implementation services provided to customers. The majority of professional services engagements are billed to customers on a time and materials basis. The Company has determined that professional services provided to customers represent distinct performance obligations. These services may be provided on a stand-alone basis or bundled with other performance obligations, including subscription arrangements, software licenses, and maintenance and support services. The transaction price allocated to these performance obligations is recognized as revenue over time as the services are performed. In those limited instances where professional services arrangements are sold on a fixed price basis, revenue is recognized over time using an input measure of time incurred to date relative to total estimated time to be incurred at project completion. Invoices for all professional services arrangements are generally invoiced monthly in arrears.
The Company records reimbursable out-of-pocket expenses associated with professional services contracts in both revenue and cost of revenue.
Contracts with Multiple Performance Obligations
The Company’s contracts with customers can include multiple performance obligations, where the transaction price is allocated to each identified performance obligation based on their relative SSP. The Company’s contracts may also grant the customer an option to acquire additional products or services, which the Company assesses to determine whether or not any discount on the products or services is in excess of levels normally available to similar customers and, if so, accounts for the optional product or service as an additional performance obligation.
The Company typically determines SSP based on the observable prices of the promised goods or services charged when sold separately to customers, which are determined using contractually stated prices. In instances where SSP is not directly observable, the Company determines SSP based on its overall pricing objectives, taking into consideration market conditions and other factors, including customer size and geography. The various products and services comprising contracts with multiple performance obligations are typically capable of being distinct and accounted for as separate performance obligations. The Company allocates revenue to each of the performance obligations included in a contract with multiple performance obligations at the inception of the contract.
87
DUCK CREEK TECHNOLOGIES, INC. AND SUBSIDIARIES
Notes to Consolidated Financial Statements
(amounts in thousands except unit and per unit and share and per share amounts)
The SSP for perpetual or term license arrangements sold in contracts with multiple performance obligations is determined using the residual approach. The Company utilizes the residual approach because the selling prices for software licenses is highly variable and a SSP is not discernible from past transactions or other observable evidence. Periodically, the Company evaluates whether the use of the residual approach remains appropriate for performance obligations associated with software licenses when sold as part of contracts with multiple performance obligations. As a result, if the SSP analysis illustrates that the selling prices for software licenses are no longer highly variable, the Company will utilize the relative allocation method for such arrangements.
Contract Modifications
The Company may enter into amendments to previously executed contracts which constitute a contract modification. The effect of a contract modification on the transaction price when the remaining products or services are not distinct is recognized to revenue on a cumulative catch-up basis. Contract modifications are accounted for prospectively when it results in the promise to deliver additional products and services that are distinct and the increase in the price of the contract corresponds to the SSP of the additional products or services.
Contract Balances
Contract assets and liabilities are presented net at the contract level for each reporting period. Contract assets consist of unbilled revenue and represent amounts under contracts with customers where revenue recognized exceeds the amount billed to the customer. Contract liabilities consist of deferred revenue and include billings and payments received in advance of revenue recognized. Deferred revenue that will be realized during the succeeding 12-month period is recorded as current, and the remaining balance is recorded as noncurrent.
For the fiscal year ended August 31, 2020, 2019 and 2018, $15.2 million, $11.0 million and $12.7 million, respectively, of the Company’s unbilled revenue balance that was included in the corresponding unbilled revenue balance at the beginning of the period presented became an unconditional right to payment and was billed to its customers.
For the fiscal year ended August 31, 2020, 2019 and 2018, the Company recognized revenue of $22.8 million, $16.2 million and $14.1 million, respectively, that was included in the corresponding deferred revenue balance at the beginning of the period presented.
Transaction Price Allocated to the Remaining Performance Obligations
Remaining performance obligations represent contracted revenue that has not yet been recognized, which includes deferred revenue and amounts that will be invoiced and recognized as revenue in future periods. As of August 31, 2020, approximately $436.8 million of revenue is expected to be recognized from remaining performance obligations in the amount of approximately $123.1 million in fiscal 2021 and approximately $313.8 million thereafter. The estimated revenues do not include unexercised contract renewals. The Company applied the practical expedient in accordance with ASC 606 to exclude amounts related to professional services contracts that are on a time and materials basis.
|
|
(h) |
Cost of Revenue |
Cost of revenue is primarily composed of personnel costs and costs of external resources used in the delivery of professional services to customers, including software configuration, integration services, and training; customer support activities; third-party costs incurred related to hosting the Company’s software for its customers; amortization of acquired technology intangible assets; depreciation expense; and cost of software production and license fees paid to third parties.
88
DUCK CREEK TECHNOLOGIES, INC. AND SUBSIDIARIES
Notes to Consolidated Financial Statements
(amounts in thousands except unit and per unit and share and per share amounts)
The Company allocates the incremental costs to obtain a contract among the identified performance obligations that are included in the contract, on a relative basis to the allocated transaction price.
Incremental costs primarily comprise of commissions paid to the Company’s sales representatives. Any such costs that are allocated to performance obligations that are recognized at a point in time are expensed at that time. Any such costs that are allocated to performance obligations that are recognized over time are capitalized in the period in which they are incurred and amortized on a straight-line basis over the expected period of benefit of the associated contract. The Company determined to use the straight-line basis as the expected benefit will be realized uniformly over the amortization period. Commissions paid relating to contract renewals are deferred and amortized on a straight-line basis over the related renewal period. As a practical expedient, the Company recognizes the incremental costs of obtaining a contract as an expense when incurred if the amortization period of the asset that it otherwise would have recognized is one year or less.
The Company has estimated that the typical period of benefit for its contracts is 8 years, based on both qualitative and quantitative factors, including product lifecycle attributes and historical customer retention data. The Company assesses deferred contract costs for impairment on an annual basis. Amortization expense associated with deferred contract costs are recorded within selling, general, and administrative expenses on the accompanying consolidated statements of operations. Deferred contract costs are included within other assets on the Company’s consolidated balance sheets.
The Company does not incur up-front, direct fulfillment-related costs of a nature required to be capitalized and amortized.
|
|
(j) |
Cash, Cash Equivalents and Restricted Cash |
The Company considers all highly liquid investments with original maturities of 90 days or less at the time of purchase to be cash equivalents. At August 31, 2019 and 2020, the Company did not have any cash equivalents or restricted cash.
|
|
(k) |
Accounts Receivable and Payment Terms |
Accounts receivable are stated at the amount management expects to collect from outstanding balances and are recorded when the right to consideration becomes unconditional. Payment terms and conditions vary by contract and the product and service being provided. Invoices are typically due within 30 days of receipt by a customer.
|
|
(l) |
Allowance for Doubtful Accounts |
The Company maintains an allowance for doubtful accounts receivable. The allowance reflects the Company’s best estimate of probable losses inherent in the accounts receivable balance. It is based upon historical experience and management’s evaluation of outstanding accounts receivable at the end of the fiscal year. When new information becomes available that allows the Company to more accurately estimate the allowance, an adjustment is made, which is considered a change in accounting estimate. The carrying value of accounts receivable approximates their fair value. The allowance for doubtful accounts was $0.4 million and $0.3 million as of August 31, 2020 and 2019, respectively.
|
|
(m) |
Unbilled Revenue |
Revenues recognized in excess of the amounts invoiced to customers are classified as unbilled revenues in the accompanying consolidated balance sheets. The Company expects to invoice all of the unbilled revenue recorded at each reporting period over the term of the contract which ranges from two to six years.
|
|
(n) |
Concentration of Credit Risk |
The Company maintains its cash in bank deposit accounts, which at times, may exceed federally insured limits. The Company has not experienced any losses in such accounts. The Company believes it is not exposed to any significant credit risk on cash and cash equivalents. Concentration of credit risk, with respect to cash and cash equivalents, is limited because the Company places its investments in highly rated institutions.
89
DUCK CREEK TECHNOLOGIES, INC. AND SUBSIDIARIES
Notes to Consolidated Financial Statements
(amounts in thousands except unit and per unit and share and per share amounts)
The Company is potentially subject to concentration of credit risk primarily through its accounts receivable. The Company performs ongoing credit evaluations of its customers and maintains allowances for potential credit losses which, when realized, have been within the range of management’s expectations. The Company generally does not require collateral. Credit risk on accounts receivables is minimized as a result of the large and diverse nature of the Company’s customer base.
The Company generates revenues in the capacity of a subcontractor to Accenture, a related party (as described in Note 19). Services provided to Accenture accounted for 1%, 2%, and 8% of the Company’s revenue for the years ended August 31, 2020, 2019 and 2018, respectively.
For customer concentration purposes, customers are assessed two ways: individual entities (customers) and combining customers that are under common control (consolidated entities). The Company had no single customer that accounted for over 10% of total revenue in fiscal 2020 but one consolidated entity that represented approximately 11% of total revenue. In fiscal 2019, a single customer accounted for 10% of total revenue and one consolidated entity represented approximately 13% of total revenue. In fiscal 2018, two single customers accounted for over 10% of total revenue at approximately 11% and 10%, respectively, and one consolidated entity represented approximately 15% of total revenue.
As of August 31, 2020, two customers individually accounted for approximately 13% and 12% of accounts receivable, respectively. As of August 31, 2019, two customers individually accounted for approximately 13% and 10% of accounts receivable, respectively. No other customer individually accounted for more than 10% of the Company’s accounts receivable for these reporting periods.
|
|
(o) |
Fair Value of Financial Instruments |
Financial instruments consist mainly of cash, restricted cash, accounts receivable and borrowings under the Company’s credit facility. The carrying amount of accounts receivable is net of an allowance for doubtful accounts, which is based on historical collections and known credit risks, and approximates the fair value of accounts receivable.
|
|
(p) |
Property and Equipment |
Property and equipment are recorded at cost and depreciated using the straight-line method over their estimated useful lives as follows:
|
Computer equipment and purchased software |
3 years |
|
Furniture and fixtures |
5 years |
|
Office equipment |
3 years |
|
Leasehold improvements |
Lesser of estimated useful life or life of lease |
Expenditures for maintenance and repairs are expensed as incurred. Expenditures for renewals or betterments are capitalized.
|
|
(q) |
Software Development Costs |
The Company has evaluated the establishment of technological feasibility of its perpetual and term license arrangements in accordance with FASB ASC 985-20, Accounting for the Costs of Computer Software to Be Sold, Leased, or Otherwise Marketed. The Company sells software products in a market
that is subject to rapid technological change, new product development, and changing customer needs. Accordingly, the Company has concluded that technological feasibility for most software products is not established until the development stage of the software product is nearly complete. The Company defines technological feasibility as the completion of a working model. The period of time during which costs could be capitalized, from the point of reaching technological feasibility until the time of general software product release, is very short; consequently, the amounts that are capitalized are not material to the Company’s financial position or results of operations.
90
DUCK CREEK TECHNOLOGIES, INC. AND SUBSIDIARIES
Notes to Consolidated Financial Statements
(amounts in thousands except unit and per unit and share and per share amounts)
With respect to the Company’s SaaS products sold to its customers, costs incurred in the preliminary design and development stages of a project are expensed as incurred in accordance with FASB ASC 350-40, Internal-Use Software. Once a project has reached the application development stage, certain internal, external, direct and indirect costs may be subject to capitalization. Generally, costs are capitalized until the technology is available for its intended use. Subsequent costs incurred for the development of future upgrades and enhancements, which are expected to result in additional functionality, follow the same protocol for capitalization. Capitalized software development costs are recorded in property and equipment on the Company’s consolidated balance sheets.
|
|
(r) |
Business Combinations |
The Company uses its best estimates and assumptions to determine the fair value of tangible and intangible assets acquired and liabilities assumed in a business combination. Goodwill is calculated as the difference between the acquisition-date fair value of the consideration transferred and the fair values assigned to the assets acquired and liabilities assumed. During the measurement period, which may be up to one year from the acquisition date, if new information is obtained about facts and circumstances that existed as of the acquisition date, the Company may record adjustments to the fair value of these assets acquired and liabilities assumed, with a corresponding offset to goodwill. Upon the conclusion of the measurement period or final determination of the fair value of assets acquired and liabilities assumed, whichever comes first, subsequent adjustments, if any, are recorded to the Company’s consolidated statements of operations.
|
|
(s) |
Goodwill |
The carrying amount of goodwill is not amortized, but rather tested for impairment annually in June of each fiscal year, or more frequently if events or changes in circumstances indicate that the carrying value of goodwill may not be recoverable. The Company has determined that it is comprised of one reporting unit for purposes of its annual impairment evaluation. The Company has the option to first assess qualitative factors to determine whether it is more likely than not that the fair value of its reporting unit is less than its carrying amount as a basis for determining whether it is necessary to perform the two-step goodwill impairment test. If the Company determines that it is more likely than not that the fair value of its reporting unit is less than the carrying amount, or opts not to perform a qualitative assessment, then the two-step goodwill impairment test will be performed. The first step, identifying a potential impairment, compares the fair value of the reporting unit with its carrying amount. If the carrying amount exceeds its fair value, the second step will be performed; otherwise, no the second step is not required. The second step, measuring the impairment loss, compares the implied fair value of the reporting unit’s goodwill with its carrying amount. Any excess of the goodwill carrying amount over the implied fair value is recognized as an impairment loss, and the carrying value of goodwill is written down to fair value. No impairment losses associated with goodwill impairment have been recorded by the Company to date.
|
|
(t) |
Impairment of Long-Lived Assets |
Long-lived assets, such as property and equipment, and acquired intangible assets subject to amortization, are reviewed for impairment whenever events or changes in circumstances indicate that the carrying amount of an asset may not be recoverable. If circumstances require a long-lived asset or asset group be tested for possible impairment, the Company first compares undiscounted cash flows expected to be generated by that asset or asset group to its carrying amount. If the carrying amount of the long-lived asset or asset group is not recoverable on an undiscounted cash flow basis, an impairment is recognized to the extent that the carrying amount exceeds its fair value. Fair value is determined through various valuation techniques including discounted cash flow models, quoted market values and third-party independent appraisals, as considered necessary. As discussed in Note 7, the Company recorded an impairment of right of use assets and leasehold improvements during the year ended August 31, 2020. There were no impairments of long-lived assets, including acquired intangible assets, during the years ended August 31, 2019 and 2018.
|
|
(u) |
Deferred Financing Fees |
Deferred financing fees include costs incurred primarily in connection with entering into the Company’s revolving credit facility (see Note 12). These costs are capitalized on the accompanying consolidated balance sheets in other assets and are amortized on a straight-line basis over the term of the revolving
91
DUCK CREEK TECHNOLOGIES, INC. AND SUBSIDIARIES
Notes to Consolidated Financial Statements
(amounts in thousands except unit and per unit and share and per share amounts)
credit facility. Amortization expense is included as a component of interest expense on the accompanying consolidated statements of operations.
|
|
(v) |
Share-Based Compensation |
The Company accounts for share-based compensation awards in accordance with FASB ASC 718, Compensation: Stock Compensation. FASB ASC 718 requires all share-based awards to employees to be recognized in the statements of operations based on their fair values.
The determination of the fair value of the Class D incentive units and Phantom Unit awards granted prior to the IPO was estimated by management using an income approach and through the use of an option pricing model, to allocate the estimated value of the Company to each of the classes of partnership units. The fair value of the Company’s restricted common stock awards and phantom stock awards is equal to the market value of the Company’s common stock on the date of grant. The fair value of the Company’s stock options and stock appreciation rights are estimated at the grant date using the Black-Scholes model. The inputs utilized in this model require judgments and estimates. Changes in these inputs could affect the measurement of the estimated fair value of the related compensation expense of these stock options and stock appreciation rights. The Company recognizes the compensation cost of share-based awards on a straight-line basis over the requisite service period (typically the vesting period) of the award. The Company recognize forfeitures as they occur.
|
|
(w) |
Income Taxes |
Income taxes are accounted for using the asset and liability method. Under this method, deferred tax asset and liabilities are recognized for differences between the financial statement carrying amounts of existing assets and liabilities and their respective income tax bases, and operating loss and tax credit carryforwards, by using enacted tax rates in effect in the year in which the differences are expected to reverse. All deferred tax assets and liabilities are classified as non-current on the Company’s consolidated balance sheets. Valuation allowances are provided if based upon the weight of available evidence, it is more likely than not that some or all of the deferred tax assets will not be realized.
Tax benefits from uncertain tax positions are recognized if it is more likely than not that the tax position will be sustained on examination by the taxing authorities based on the technical merits of the position.
The Company recognizes interest and penalties related to unrecognized tax benefits in income tax expense in its consolidated statements of operations.
Prior to the IPO, the Company was a limited partnership for income tax purposes. While the Company was a limited partnership, the subsidiaries were the primary entities from an income tax perspective. The Company based its income tax rate reconciliation and other tax disclosures on the fact that the U.S. is the predominant tax jurisdiction where the Company operates.
|
|
(x) |
Advertising Expenses |
Advertising costs are expensed in the period in which the cost was incurred. Total advertising expenses incurred were immaterial for the years ended August 31, 2020, 2019 and 2018.
|
|
(y) |
Leases |
Effective September 1, 2019, the Company adopted Financial Accounting Standards Board (FASB) Accounting Standards Update (ASU) 2016-02, Leases (Topic 842), as amended (ASC 842). In accordance with ASC 842, at the inception of an arrangement, the Company determines whether the arrangement is or contains a lease based on the unique facts and circumstances present and the classification of the lease. Most leases with a term greater than one year are recognized on the consolidated balance sheet as operating lease assets, lease liabilities and, if applicable, long-term lease liabilities. The Company elected not to recognize on the balance sheet leases with terms of one year or less. For contracts with lease and non-lease components, the Company has elected not to allocate the contract consideration and to account for the lease and non-lease components as a single lease component.
Lease liabilities are recorded based on the present value of lease payments over the expected lease term. The implicit rate within our operating leases are generally not determinable and therefore the Company uses the incremental borrowing rate at the lease commencement date to determine the present value of
92
DUCK CREEK TECHNOLOGIES, INC. AND SUBSIDIARIES
Notes to Consolidated Financial Statements
(amounts in thousands except unit and per unit and share and per share amounts)
lease payments. The determination of our incremental borrowing rate requires judgment. The Company determines the incremental borrowing rate for each lease using its estimated borrowing rate, adjusted for various factors including level of collateralization, term and currency to align with the terms of the lease. The operating lease asset also includes any lease prepayments, offset by lease incentives. Certain of the Company’s leases include options to extend or terminate the lease. An option to extend the lease is considered in connection with determining the operating lease asset and lease liability when it is reasonably certain that the option will be exercised. An option to terminate is considered unless it is reasonably certain that the option will not be exercised.
For periods prior to the adoption of ASC 842, the Company recorded rent expense on a straight-line basis over the term of the related lease. The difference between the straight-line rent expense and the payments made in accordance with the operating lease agreements were recognized as a deferred rent liability on the accompanying consolidated balance sheets.
|
|
(z) |
Recent Accounting Pronouncements Not Yet Effective |
In June 2016, the FASB issued ASU 2016-13, Financial Instruments Credit Losses (Topic 326): Measurement of Credit Losses on Financial Instruments (ASU 2016-13). The new standard requires companies to measure credit losses utilizing a methodology that reflects expected credit losses and requires a consideration of a broader range of reasonable and supportable information to inform credit loss estimates. ASU 2016-13 is effective for fiscal years beginning after December 15, 2019, including interim periods within those fiscal years. The Company does not expect the new standard to have a material impact on its consolidated financial statements.
In January 2017, the FASB issued ASU No. 2017-04, Intangibles – Goodwill and Other (Topic 350): Simplifying the Test for Goodwill Impairment (ASU 2017-04). This new guidance simplifies the subsequent measurement of goodwill by eliminating Step 2 from the goodwill impairment test. Under the new standard, entities will perform goodwill impairment tests by comparing the fair value of a reporting unit with its carrying amount and recognize an impairment charge for the amount by which the carrying amount exceeds the reporting unit’s fair value. The standard will be effective for the first interim period within annual reporting periods beginning after December 15, 2019 and early adoption is permitted. The Company does not expect the adoption of ASU 2017-04 to have a material impact on its consolidated financial statements.
In August 2018, the FASB issued ASU No. 2018-15, Customer’s Accounting for Implementation Costs Incurred in a Cloud Computing Arrangement That is a Service Contract (ASU 2018-15). This new guidance requires a customer in a cloud computing arrangement that is a service contract to follow the internal-use software guidance in Accounting Standards Codification 350-40 to determine which implementation costs to defer and recognize as an asset. ASU 2018-15 generally aligns the guidance on recognizing implementation costs incurred in a cloud computing arrangement that is a service contract with that for implementation costs incurred to develop or obtain internal-use software, including hosting arrangements that include an internal-use software license. ASU 2018-15 is effective for the first interim period within annual reporting periods beginning after December 15, 2019 and early adoption is permitted. The Company is currently evaluating the impact of ASU 2018-15 on its consolidated financial statements.
Other recent accounting pronouncements that are or will be applicable to the Company did not, or are not expected to, have a material impact on the Company’s present or future financial statements.
|
(3) |
Business Combinations |
Acquisition of Outline Systems LLC
On October 17, 2018, the Company acquired all of the outstanding equity interests of Outline Systems LLC (Outline) for total consideration of $20.4 million. The consideration consisted of cash totaling $9.8 million, Class C Units valued at $2.0 million and the fair value of contingent consideration of $8.6 million (Outline Earnout). The acquisition presented the Company with an opportunity to add distribution management software to its current product offerings as well as distribution management experts to its current team.
The transaction was accounted for as a business combination as Outline contained inputs and processes that were capable of being operated as a business. In accordance with the acquisition method of accounting, the purchase price paid has been allocated to the assets acquired and liabilities assumed based on their estimated
93
DUCK CREEK TECHNOLOGIES, INC. AND SUBSIDIARIES
Notes to Consolidated Financial Statements
(amounts in thousands except unit and per unit and share and per share amounts)
fair values on the date of the acquisition. The following tables present the consideration paid and the allocation of the consideration paid for the assets acquired and liabilities assumed at the acquisition date:
Consideration at fair value:
|
Cash paid at closing |
|
$ |
9,814 |
|
|
Fair value of Class C Units |
|
|
2,025 |
|
|
Estimated fair value of contingent consideration |
|
|
8,600 |
|
|
|
|
$ |
20,439 |
|
Fair value of identifiable assets acquired and liabilities assumed:
|
Accounts receivable |
|
$ |
824 |
|
|
Unbilled receivables |
|
|
69 |
|
|
Intangible assets |
|
|
3,800 |
|
|
Goodwill |
|
|
16,823 |
|
|
Other assets |
|
|
299 |
|
|
Total assets acquired |
|
|
21,815 |
|
|
Accrued liabilities and accounts payable |
|
|
(641 |
) |
|
Deferred revenue |
|
|
(695 |
) |
|
Other liabilities |
|
|
(40 |
) |
|
Total liabilities assumed |
|
|
(1,376 |
) |
|
Acquisition consideration paid |
|
$ |
20,439 |
|
Acquired intangible assets include completed technology of $1.0 million with a useful life of six years and customer relationships of $2.8 million with a useful life of 14 years. The intangible assets are being amortized on a straight-line basis, which reflects the pattern in which the economic benefits of the intangible assets are being utilized. The goodwill of $16.8 million arising from the acquisition is the result of having a workforce in place, expected synergies, access to working capital and improved vendor and customer relations.
As part of the Outline Earnout, the sellers can receive up to $10.3 million in additional payments related to the achievement of a target level of sales value over the three year period subsequent to the acquisition. The sales value will be measured each year, and payments will be made to the sellers to the extent earned.
The fair value of the Outline Earnout was estimated using an income-based approach to determine the risk-neutral expected earnout payment for each year. The expected payments were then discounted to determine the fair value as of the acquisition date. The Company re-values the Outline Earnout at each subsequent reporting period and recognizes the change in fair value in the accompanying statements of operations.
The Company has not furnished pro forma financial information relating to Outline because such information is not material to the Company’s financial results.
94
DUCK CREEK TECHNOLOGIES, INC. AND SUBSIDIARIES
Notes to Consolidated Financial Statements
(amounts in thousands except unit and per unit and share and per share amounts)
The following table summarizes the changes in fair value of the Company’s contingent earnout liability during the years ended August 31, 2018 and 2019:
|
|
|
Yodil, LLC |
|
|
Outline Systems, LLC |
|
|
CedeRight Products |
|
|
Total |
|
||||
|
Balance at August 31, 2017 |
|
$ |
4,699 |
|
|
|
— |
|
|
|
— |
|
|
$ |
4,699 |
|
|
Change in fair value, including accretion |
|
|
801 |
|
|
|
— |
|
|
|
— |
|
|
|
801 |
|
|
Payments to sellers |
|
|
(2,938 |
) |
|
|
— |
|
|
|
— |
|
|
|
(2,938 |
) |
|
Balance at August 31, 2018 |
|
|
2,562 |
|
|
|
— |
|
|
|
— |
|
|
|
2,562 |
|
|
Acquisition date fair value |
|
|
— |
|
|
|
8,600 |
|
|
|
1,075 |
|
|
|
9,675 |
|
|
Change in fair value, including accretion |
|
|
(212 |
) |
|
|
840 |
|
|
|
— |
|
|
|
628 |
|
|
Payments to sellers |
|
|
(2,350 |
) |
|
|
— |
|
|
|
— |
|
|
|
(2,350 |
) |
|
Balance at August 31, 2019 |
|
|
— |
|
|
|
9,440 |
|
|
|
1,075 |
|
|
|
10,515 |
|
|
Change in fair value, including accretion |
|
|
— |
|
|
|
450 |
|
|
|
(317 |
) |
|
|
133 |
|
|
Payments to sellers |
|
|
|
|
|
|
(2,798 |
) |
|
|
(758 |
) |
|
|
(3,556 |
) |
|
Balance at August 31, 2020 |
|
$ |
— |
|
|
|
7,092 |
|
|
|
— |
|
|
$ |
7,092 |
|
The final earnout payment relating to the Yodil acquisition was made in January 2019. The total cumulative earnout paid to the Yodil sellers was $5.3 million. The final earnout payment relating to the CedeRight acquisition was made in May 2020. The total cumulative earnout paid to the CedeRight sellers was $0.8 million.
|
(4) |
Fair Value Measurements |
The Company measures certain financial assets and liabilities at fair value. Fair value is determined based upon the exit price that would be received to sell an asset or paid to transfer a liability in an orderly transaction between market participants, as determined by either the principal market or the most advantageous market.
Inputs used in the valuation techniques to derive fair values are classified based on a three-level hierarchy, as follows:
|
|
• |
Level 1 Inputs: Unadjusted quoted prices in active markets for identical assets or liabilities accessible to the reporting entity at the measurement date. |
|
|
• |
Level 2 Inputs: Other than quoted prices included in Level 1 inputs that are observable for the asset or liability, either directly or indirectly, for substantially the full term of the asset or liability. |
|
|
• |
Level 3 Inputs: Unobservable inputs for the asset or liability used to measure fair value to the extent that observable inputs are not available, thereby allowing for situations in which there is little, if any, market activity for the asset or liability at measurement date. |
The following tables present the Company’s financial assets and liabilities measured and recorded at fair value on a recurring basis using the above input categories as of August 31, 2020 and 2019:
|
|
|
August 31, 2020 |
|
|||||||||||||
|
|
|
Level 1 |
|
|
Level 2 |
|
|
Level 3 |
|
|
Total |
|
||||
|
Liabilities: |
|
|
|
|
|
|
|
|
|
|
|
|
|
|
|
|
|
Liability classified awards |
|
$ |
7,821 |
|
|
|
— |
|
|
|
879 |
|
|
$ |
8,700 |
|
|
Contingent earnout liability |
|
|
— |
|
|
|
— |
|
|
|
7,092 |
|
|
$ |
7,092 |
|
|
Total liabilities |
|
$ |
7,821 |
|
|
|
— |
|
|
|
7,971 |
|
|
|
15,792 |
|
95
DUCK CREEK TECHNOLOGIES, INC. AND SUBSIDIARIES
Notes to Consolidated Financial Statements
(amounts in thousands except unit and per unit and share and per share amounts)
|
|
|
August 31, 2019 |
|
|||||||||||||
|
|
|
Level 1 |
|
|
Level 2 |
|
|
Level 3 |
|
|
Total |
|
||||
|
Liabilities: |
|
|
|
|
|
|
|
|
|
|
|
|
|
|
|
|
|
Contingent earnout liability |
|
$ |
— |
|
|
|
— |
|
|
|
10,515 |
|
|
$ |
10,515 |
|
|
Total liabilities |
|
$ |
— |
|
|
|
— |
|
|
|
10,515 |
|
|
$ |
10,515 |
|
The contingent earnout liability related to business combinations is recorded at fair value on the acquisition date and is adjusted each reporting period for changes in fair value, which can result from changes in anticipated payments and changes in assumed discount periods and rates. These inputs are unobservable in the market and therefore categorized as level 3 inputs as defined above. Quoted prices for liability classified stock appreciation rights are not readily available. Accordingly, the Company uses a Black-Scholes model to estimate the fair value of these awards, which utilizes level three inputs as described above. The Company had no assets measured and recorded at fair value on a recurring basis as of August 31, 2020 and 2019.
|
(5) |
Prepaid Expenses and Other Current Assets |
Prepaid expenses and other current assets as of August 31, 2020 and 2019 consisted of the following:
|
|
|
August 31, |
|
|||||
|
|
|
2020 |
|
|
2019 |
|
||
|
Prepaid software licenses |
|
$ |
115 |
|
|
$ |
2,234 |
|
|
Tenant improvement allowance receivable |
|
|
1 |
|
|
|
1,719 |
|
|
Director's and officer's insurance |
|
|
5,355 |
|
|
|
— |
|
|
Other |
|
|
6,715 |
|
|
|
1,819 |
|
|
Total prepaid expenses and other current assets |
|
$ |
12,186 |
|
|
$ |
5,772 |
|
|
(6) |
Property and Equipment, Net |
Property and equipment, net as of August 31, 2020 and 2019 consisted of the following:
|
|
|
August 31 |
|
|||||
|
|
|
2020 |
|
|
2019 |
|
||
|
Leasehold improvements |
|
$ |
11,216 |
|
|
$ |
11,464 |
|
|
Internal-use software |
|
|
7,304 |
|
|
|
4,412 |
|
|
Computer equipment |
|
|
4,310 |
|
|
|
3,685 |
|
|
Furniture and fixtures |
|
|
2,181 |
|
|
|
2,031 |
|
|
Office equipment |
|
|
478 |
|
|
|
873 |
|
|
Purchased software |
|
|
— |
|
|
|
93 |
|
|
Total property and equipment |
|
$ |
25,489 |
|
|
$ |
22,558 |
|
|
Less accumulated depreciation and amortization |
|
|
(7,376 |
) |
|
|
(5,500 |
) |
|
Property and equipment, net |
|
$ |
18,113 |
|
|
$ |
17,058 |
|
Depreciation expense related to property and equipment was $3.1 million, $2.4 million and $1.9 million for the years ended August 31, 2020, 2019 and 2018, respectively.
As of August 31, 2020, $6.0 million of capitalized internal-use software projects relating to the Company’s SaaS products have been completed and are available for their intended use. The Company has determined the useful life of this software to be three years. Amortization expense related to internal-use software was $0.7 million for the fiscal year ended August 31, 2020, and none for the fiscal year ended August 31, 2019.
96
DUCK CREEK TECHNOLOGIES, INC. AND SUBSIDIARIES
Notes to Consolidated Financial Statements
(amounts in thousands except unit and per unit and share and per share amounts)
The Company’s lease obligations consist of operating leases for domestic and international office facilities with lease periods expiring between fiscal years 2020 and 2028. Some leases include one or more options to renew. Lease renewals are not assumed in the determination of the lease term until the exercise of the renewals are deemed to be reasonably certain. For the fiscal year ended August 31, 2020, the Company incurred $4.6 million of operating lease expense and $0.3 million of short term lease expense resulting in total lease expense of $4.9 million.
Rent expense, which was recognized on a straight-line basis over the terms of the various leases, was $4.4 million for the fiscal year ended August 31, 2019 based on the previous lease accounting standard.
During the fourth quarter of fiscal 2020, the Company closed its New Jersey office. Going forward, the Company intends to sublease the space. The Company closed one floor of its South Carolina office. As a result of these decisions, the Company has recorded an impairment in the amount of $2.8 million, consisting of $1.7 million of right of use assets and $1.1 million of leasehold improvements, which is included in the general and administrative line item on the consolidated statement of operations.
Future operating lease payments as of August 31, 2020 were as follows:
|
Fiscal Year Ending August 31, |
|
|
|
|
|
2021 |
|
$ |
4,952 |
|
|
2022 |
|
|
3,899 |
|
|
2023 |
|
|
3,898 |
|
|
2024 |
|
|
3,898 |
|
|
Thereafter |
|
|
11,998 |
|
|
Total future lease payments |
|
|
28,645 |
|
|
Less imputed interest |
|
|
(3,295 |
) |
|
Total lease liability balance |
|
$ |
25,350 |
|
Supplemental information related to leases was as follows:
|
|
|
August 31, 2020 |
|
|
|
Operating lease assets |
|
$ |
18,171 |
|
|
Current portion of lease liabilities |
|
$ |
3,611 |
|
|
Non-current portion of lease liabilities |
|
|
21,739 |
|
|
Total lease liabilities |
|
$ |
25,350 |
|
|
Weighted average remaining lease term (years) |
|
|
7.1 |
|
|
Weighted average discount rate |
|
|
4.4 |
% |
Supplemental cash and non-cash information related to operating leases was as follows:
|
|
|
Year Ended August 31, 2020 |
|
|
|
Cash payments for operating leases |
|
$ |
4,604 |
|
|
Operating lease assets obtained in exchange for lease liabilities |
|
$ |
1,271 |
|
97
DUCK CREEK TECHNOLOGIES, INC. AND SUBSIDIARIES
Notes to Consolidated Financial Statements
(amounts in thousands except unit and per unit and share and per share amounts)
Under the prior lease accounting standard, as of August 31, 2019, the future minimum payments under non-cancellable leases were as follows:
|
Fiscal year ended August 31: |
|
|
|
|
|
2021 |
|
$ |
4,821 |
|
|
2022 |
|
|
4,549 |
|
|
2023 |
|
|
3,645 |
|
|
2024 |
|
|
3,619 |
|
|
Thereafter |
|
|
15,575 |
|
|
Total future minimum payments |
|
$ |
32,209 |
|
|
(8) |
Goodwill and Intangible Assets |
The Company’s goodwill is the result of its acquisitions of other businesses and represents the excess of purchase consideration over the fair value of assets acquired and liabilities assumed. The following table displays the changes in the gross carrying amount of goodwill:
|
Balance at August 31, 2018 |
|
$ |
252,898 |
|
|
Acquisition of Outline Systems LLC |
|
|
16,823 |
|
|
Acquisition of CedeRight Products |
|
|
2,734 |
|
|
Balance at August 31, 2019 |
|
|
272,455 |
|
|
Reporting period activity |
|
|
— |
|
|
Balance at August 31, 2020 |
|
$ |
272,455 |
|
Intangible assets as of August 31, 2020, and 2019 consisted of the following:
|
|
|
August 31, 2020 |
|
|
|
|||||||||
|
|
|
Gross carrying amount |
|
|
Accumulated amortization |
|
|
Net carrying amount |
|
|
Weighted average remaining life |
|||
|
Customer relationships |
|
$ |
103,600 |
|
|
|
41,535 |
|
|
$ |
62,065 |
|
|
6.5 years |
|
Acquired technology |
|
|
32,235 |
|
|
|
18,785 |
|
|
|
13,450 |
|
|
3.0 years |
|
Trademarks and tradenames |
|
|
9,400 |
|
|
|
3,838 |
|
|
|
5,562 |
|
|
6.0 years |
|
Domain name |
|
|
100 |
|
|
|
40 |
|
|
|
60 |
|
|
6.0 years |
|
Backlog |
|
|
6,700 |
|
|
|
6,150 |
|
|
|
550 |
|
|
2.0 years |
|
|
|
$ |
152,035 |
|
|
$ |
70,348 |
|
|
$ |
81,687 |
|
|
|
|
|
|
August 31, 2019 |
|
|
|
|||||||||
|
|
|
Gross carrying amount |
|
|
Accumulated amortization |
|
|
Net carrying amount |
|
|
Weighted average remaining life |
|||
|
Customer relationships |
|
$ |
103,600 |
|
|
|
31,255 |
|
|
$ |
72,345 |
|
|
7.5 years |
|
Acquired technology |
|
|
32,235 |
|
|
|
14,040 |
|
|
|
18,195 |
|
|
4.0 years |
|
Trademarks and tradenames |
|
|
9,400 |
|
|
|
2,898 |
|
|
|
6,502 |
|
|
7.0 years |
|
Domain name |
|
|
100 |
|
|
|
30 |
|
|
|
70 |
|
|
7.0 years |
|
Backlog |
|
|
6,700 |
|
|
|
5,056 |
|
|
|
1,644 |
|
|
3.0 years |
|
|
|
$ |
152,035 |
|
|
$ |
53,279 |
|
|
$ |
98,756 |
|
|
|
Amortization expense was $17.1 million, $17.6 million and $17.7 million for the years ended August 31, 2020, 2019 and 2018, respectively. Amortization expense is recorded on a straight line basis over the
98
DUCK CREEK TECHNOLOGIES, INC. AND SUBSIDIARIES
Notes to Consolidated Financial Statements
(amounts in thousands except unit and per unit and share and per share amounts)
estimated useful lives of the assets. Amortization expense associated with the backlog intangible asset is classified as a reduction of revenue in the accompanying consolidated statements of operations.
As of August 31, 2020, the estimated future amortization of purchased intangible assets is as follows:
|
Fiscal year: |
|
|
|
|
|
2021 |
|
$ |
16,328 |
|
|
2022 |
|
|
15,793 |
|
|
2023 |
|
|
15,225 |
|
|
2024 |
|
|
11,453 |
|
|
2025 and thereafter |
|
|
22,888 |
|
|
Total |
|
$ |
81,687 |
|
|
(9) |
Net Loss Per Share |
The Company calculates basic earnings per share by dividing the net income (loss) by the weighted average number of shares of common stock outstanding for the period. The diluted earnings per share is computed by assuming the exercise, settlement, and vesting of all potential dilutive common stock equivalents outstanding for the period using the treasury stock method.
The following table sets forth a reconciliation of the numerator and denominator used to compute basic earnings per share of common stock. Basic earnings per share is applicable only for the period from August 14, 2020 through August 31, 2020, which is the period following the IPO and related Reorganization Transactions (as described in Note 1) and presents the period that the Company had outstanding common stock.
|
|
|
August 31, 2020 |
|
|
|
Numerator |
|
|
|
|
|
Net loss |
|
$ |
(29,932 |
) |
|
Less: Net loss attributable to the Operating Partnership before Reorganization Transactions |
|
|
(5,598 |
) |
|
Net loss attributable to Duck Creek Technologies, Inc. |
|
$ |
(24,334 |
) |
|
Denominator |
|
|
|
|
|
Weighted average shares of common stock - basic and diluted |
|
|
130,702,511 |
|
|
Net loss per share - basic and diluted |
|
$ |
(0.19 |
) |
|
|
|
|
|
|
Prior to the IPO, there were no shares of common stock outstanding, and the membership structure of Duck Creek Technologies consisted of limited partnership units. The Company analyzed the calculation of earnings per unit for periods prior to the IPO and determined that it resulted in values that would not be meaningful to the users of these consolidated financial statements. Therefore, earnings per share information has not been presented for any period prior to August 31, 2020.
As of August 31, 2020, 4,594,242 shares outstanding of potential common stock, prior to the use of the treasury stock method, were excluded from the computation of diluted weighted-average shares of common stock outstanding because their effect would have been antidilutive.
99
DUCK CREEK TECHNOLOGIES, INC. AND SUBSIDIARIES
Notes to Consolidated Financial Statements
(amounts in thousands except unit and per unit and share and per share amounts)
|
(10) |
Other Assets |
Other assets as of August 31, 2020 and 2019 consisted of the following:
|
|
|
August 31 |
|
|||||
|
|
|
2020 |
|
|
2019 |
|
||
|
Deferred contract costs |
|
$ |
12,440 |
|
|
$ |
8,375 |
|
|
Deferred offering costs |
|
|
— |
|
|
|
1,034 |
|
|
Other noncurrent assets |
|
|
3,863 |
|
|
|
2,180 |
|
|
Total other assets |
|
$ |
16,303 |
|
|
$ |
11,589 |
|
The amortization related to deferred contracts costs were $1.5 million, $0.7 million and $0.5 million for the fiscal year ended August 31, 2020, 2019 and 2018, respectively, and there was no impairment loss in relation to the costs capitalized. Deferred offering costs consist of direct, incremental legal, accounting and other professional fees related to the Company’s initial public offering. These costs were offset against the proceeds received from the initial public offering.
|
(11) |
Accrued Liabilities |
Accrued liabilities as of August 31, 2020 and 2019 consisted of the following:
|
|
|
August 31 |
|
|||||
|
|
|
2020 |
|
|
2019 |
|
||
|
Accrued bonuses |
|
$ |
18,175 |
|
|
$ |
10,526 |
|
|
Accrued hosting fees |
|
|
11,890 |
|
|
|
6,119 |
|
|
Accrued vacation |
|
|
7,560 |
|
|
|
4,678 |
|
|
Accrued commissions |
|
|
2,269 |
|
|
|
2,792 |
|
|
Accrued professional service fees |
|
|
1,910 |
|
|
|
1,530 |
|
|
Liability-classified phantom units and SARs expense |
|
|
8,700 |
|
|
|
— |
|
|
Accrued withholding taxes |
|
|
731 |
|
|
|
509 |
|
|
Other |
|
|
6,967 |
|
|
|
4,849 |
|
|
Total accrued liabilities |
|
$ |
58,202 |
|
|
$ |
31,003 |
|
|
(12) |
Credit Facility |
On October 2, 2019, the Company extended the maturity date of its credit agreement for a revolving credit facility from October 4, 2019 to October 2, 2021. The $30.0 million maximum borrowing capacity under the revolving credit facility was unchanged.
The revolving credit facility is secured by substantially all of the Company’s tangible assets. Interest accrues on the revolving credit facility at a variable rate based upon the type of borrowing made by the Company. Borrowings can either incur interest at a rate of LIBOR plus an applicable margin, or incur interest at the higher of: (i) the Prime Rate, (2) the Fed Funds Rate plus 0.5%, or (3) LIBOR plus 1.0%, plus an applicable margin. The applicable margin ranges from 2.0% to 3.0% depending on the interest rate basis and type of borrowing elected. In addition to interest on the revolving credit facility, the Company pays a commitment fee of 0.5% per annum on the unused portion of the revolving credit facility. Repayment of any amounts borrowed are not required until maturity of the revolving credit facility, however the Company may repay any amounts borrowed at any time, without premium or penalty.
The Company is required to meet certain financial and nonfinancial covenants under the terms of the revolving credit facility. These covenants include limits on the creation of liens, limits on making certain investments, limits on incurring additional indebtedness, maintaining a minimum level of consolidated
100
DUCK CREEK TECHNOLOGIES, INC. AND SUBSIDIARIES
Notes to Consolidated Financial Statements
(amounts in thousands except unit and per unit and share and per share amounts)
EBITDA, and maintaining a leverage ratio at or below a maximum level. The Company was in compliance with these financial and nonfinancial covenants as of August 31, 2020.
There was no outstanding balance under the revolving credit facility at August 31, 2020. At August 31, 2019 the outstanding balance was $4.0 million. Letters of credit of $1.0 million and $0.9 million under the revolving credit facility were outstanding as of August 31, 2020 and 2019, respectively.
The Company incurred $0.2 million of costs directly related to the maturity extension, which were deferred and will be amortized over the term of the extension.
|
(13) |
Commitments and Contingencies |
|
|
(a) |
Litigation |
From time to time, the Company is a party to or can be threatened with litigation in the ordinary course of business. The Company regularly analyzes current information, including, as applicable, the Company’s defenses and insurance coverage and, as necessary, provides accruals for probable and estimable liabilities for the eventual disposition of any matters. The Company was not a party to any material legal proceedings as of August 31, 2020 or 2019.
|
|
(b) |
Guarantees |
The Company’s products are typically warranted to perform in a manner consistent with general industry standards that are reasonably applicable and substantially in accordance with the Company’s product documentation under normal use and circumstances. The Company’s services are generally warranted to be performed in a professional manner and to materially conform to the specifications set forth in the related customer contract. The Company’s arrangements also include certain provisions for indemnifying customers against liabilities if its products or services infringe a third party’s intellectual property rights.
To date, the Company has not incurred any material costs as a result of such indemnifications or commitments and has not accrued any liabilities related to such obligations in the accompanying consolidated financial statements.
|
(14) |
Income Taxes |
On December 22, 2017, the Tax Cuts and Jobs Act tax reform legislation (the 2017 Tax Act) was enacted into law. This legislation made significant changes in U.S. tax law including, but not limited to, a reduction in the corporate tax rate from 35% to 21%, one time taxation of offshore earnings at reduced rates regardless of whether they are repatriated (Transition Tax), and a repeal of the corporate alternative minimum tax. The 2017 Tax Act also establishes new tax laws that will affect later years including, but not limited to, a general limitation of U.S. federal income taxes on dividends from foreign subsidiaries, net operating loss deduction limitations, a base erosion, anti-tax abuse tax (BEAT) and a new provision designed to tax global intangible low-taxed income (GILTI).
As a result of the enactment of the 2017 Tax Act, the blended U.S. statutory federal income tax rate for the Company for the fiscal year ended August 31, 2018 was 25.7%. The Company remeasured its deferred tax assets and liabilities as a result of the decrease as of August 31, 2018. However, the impact was offset by a corresponding decrease in the valuation allowance. The Company has also concluded that it will not be subject to the Transition Tax, and it does not provide deferred taxes on unremitted earnings of its foreign subsidiaries as it intends to indefinitely reinvest those earnings. Further, the Company has made a policy decision to record GILTI tax as a current period expense when, and if, incurred.
101
DUCK CREEK TECHNOLOGIES, INC. AND SUBSIDIARIES
Notes to Consolidated Financial Statements
(amounts in thousands except unit and per unit and share and per share amounts)
The Company’s loss before income taxes for the years ended August 31, 2020, 2019 and 2018 is as follows:
|
|
|
August 31 |
|
|||||||||
|
|
|
2020 |
|
|
2019 |
|
|
2018 |
|
|||
|
United States |
|
$ |
(32,593 |
) |
|
$ |
(18,196 |
) |
|
$ |
(16,149 |
) |
|
Foreign |
|
|
4,223 |
|
|
|
2,450 |
|
|
|
8,701 |
|
|
Loss before income taxes |
|
$ |
(28,370 |
) |
|
$ |
(15,746 |
) |
|
$ |
(7,448 |
) |
The provision for income taxes consisted of the following:
|
|
|
August 31 |
|
|||||||||
|
|
|
2020 |
|
|
2019 |
|
|
2018 |
|
|||
|
Current: |
|
|
|
|
|
|
|
|
|
|
|
|
|
Federal |
|
$ |
— |
|
|
$ |
— |
|
|
$ |
— |
|
|
State |
|
|
97 |
|
|
|
54 |
|
|
|
(39 |
) |
|
Foreign |
|
|
896 |
|
|
|
908 |
|
|
|
926 |
|
|
Total current tax expense |
|
|
993 |
|
|
|
962 |
|
|
|
887 |
|
|
Deferred: |
|
|
|
|
|
|
|
|
|
|
|
|
|
Federal |
|
|
— |
|
|
|
(8 |
) |
|
|
(16 |
) |
|
State |
|
|
— |
|
|
|
(18 |
) |
|
|
13 |
|
|
Foreign |
|
|
569 |
|
|
|
214 |
|
|
|
(530 |
) |
|
Total deferred tax (benefit) expense |
|
|
569 |
|
|
|
188 |
|
|
|
(533 |
) |
|
Total provision for income taxes |
|
$ |
1,562 |
|
|
$ |
1,150 |
|
|
$ |
354 |
|
The table below reconciles the differences between income taxes computed at the U.S. federal statutory rate and the provision for income taxes:
|
|
|
August 31 |
|
|||||||||
|
|
|
2020 |
|
|
2019 |
|
|
2018 |
|
|||
|
Expected income tax% |
|
|
21.0 |
% |
|
|
21.0 |
% |
|
|
25.7 |
% |
|
State taxes, net of federal benefit |
|
|
(0.5 |
)% |
|
|
1.2 |
|
|
|
1.9 |
|
|
Permanent differences |
|
|
(1.3 |
)% |
|
|
(1.2 |
) |
|
|
(1.0 |
) |
|
Share-based compensation |
|
|
(2.0 |
)% |
|
|
(2.8 |
) |
|
|
(6.0 |
) |
|
Federal research and development credits |
|
|
2.1 |
% |
|
|
0.6 |
|
|
|
15.4 |
|
|
Foreign rate differential |
|
|
(2.1 |
)% |
|
|
(3.9 |
) |
|
|
2.8 |
|
|
Change in valuation allowance |
|
|
(22.7 |
)% |
|
|
(22.1 |
) |
|
|
(43.9 |
) |
|
Other |
|
|
— |
|
|
|
(0.1 |
) |
|
|
0.4 |
|
|
Total income tax expense% |
|
|
(5.5 |
)% |
|
|
(7.3 |
)% |
|
|
(4.7 |
)% |
102
DUCK CREEK TECHNOLOGIES, INC. AND SUBSIDIARIES
Notes to Consolidated Financial Statements
(amounts in thousands except unit and per unit and share and per share amounts)
Net deferred tax assets (liabilities) consist of the following:
|
|
|
August 31 |
|
|||||
|
|
|
2020 |
|
|
2019 |
|
||
|
Assets: |
|
|
|
|
|
|
|
|
|
Net operating loss carryforward |
|
$ |
18,640 |
|
|
$ |
17,928 |
|
|
Intangible assets |
|
|
25,868 |
|
|
|
27,911 |
|
|
Tax credits |
|
|
2,885 |
|
|
|
2,230 |
|
|
Other nondeductible expenses |
|
|
9,106 |
|
|
|
6,612 |
|
|
Share-based compensation |
|
|
4,731 |
|
|
|
— |
|
|
Interest expense carryforward |
|
132 |
|
|
|
1,675 |
|
|
|
Lease liabilities |
|
|
5,701 |
|
|
|
— |
|
|
Other |
|
|
— |
|
|
|
35 |
|
|
Gross deferred tax assets |
|
$ |
67,063 |
|
|
|
56,391 |
|
|
Less valuation allowance |
|
|
(52,956 |
) |
|
|
(47,065 |
) |
|
Total deferred tax assets |
|
$ |
14,107 |
|
|
|
9,326 |
|
|
Liabilities: |
|
|
|
|
|
|
|
|
|
Deferred revenue |
|
|
(1,564 |
) |
|
|
(5,009 |
) |
|
Intangible assets |
|
|
(1,809 |
) |
|
|
(395 |
) |
|
Operating lease assets |
|
|
(3,916 |
) |
|
|
— |
|
|
Capitalized items |
|
|
(4,887 |
) |
|
|
(3,457 |
) |
|
Depreciation |
|
|
(897 |
) |
|
|
— |
|
|
Total deferred tax liabilities |
|
|
(13,073 |
) |
|
|
(8,861 |
) |
|
Total net deferred tax assets |
|
$ |
1,034 |
|
|
$ |
465 |
|
The Company recognizes a net deferred tax asset for the future benefit of tax losses, tax credit carryforwards, and other deductible temporary differences to the extent that it is more likely than not that these assets will be realized. In evaluating the Company’s ability to recover these deferred tax assets, the Company considers all available positive and negative evidence, including its past operating results, the existence of cumulative income in the most recent years, changes in the business, the projected reversal of existing deferred tax liabilities, its forecast of future taxable income, and the availability of tax planning strategies. A valuation allowance is provided when it is more likely than not that some portion or all of a deferred tax asset will not be realized.
As of the years ended August 31, 2020, 2019, and 2018, the Company evaluated the likelihood that it would realize its deferred tax assets and concluded that a valuation allowance is necessary, except in certain foreign subsidiaries which generate income. The valuation allowance increased by $5.9 million for the fiscal year ended August 31, 2020 primarily due to operating losses generated during the year, share-based compensation, tax credits, and other non-deductible expenses. The valuation allowance increased by $7.0 million for the fiscal year ended August 31, 2019 primarily due to additional operating losses generated during the year. The valuation allowance decreased by $7.5 million for the fiscal year ended August 31, 2018 primarily due to decreases in deferred tax assets associated with intangible assets and other nondeductible expenses partially offset by additional operating losses generated during the year.
As of August 31, 2020, the Company had U.S. federal and U.S. state net operating loss carryforwards of $67.9 million and $42.9 million, respectively. U.S. federal net operating loss carryforwards of $32.1 million have no expiration date and will be carried forward indefinitely until used. The remaining U.S. federal and U.S. state net operating loss carryforwards expire at various dates beginning in 2034. As of August 31, 2020, the Company had foreign net operating loss carryforwards of $11.1 million that can be carried forward indefinitely. The Company also had U.S. federal research and development credit carryforwards of $2.4 million, U.S. state research and development credit carryforwards of $0.5 million and a state investment tax credit carryforward of $0.1 million as of August 31, 2020. These credit carryforwards expire at various dates beginning in 2031.
Utilization of the net operating loss and research and development credit carryforwards may be subject to a substantial annual limitation under Section 382 of the Internal Revenue Code due to ownership change
103
DUCK CREEK TECHNOLOGIES, INC. AND SUBSIDIARIES
Notes to Consolidated Financial Statements
(amounts in thousands except unit and per unit and share and per share amounts)
limitations that have occurred previously or that could occur in the future. These ownership changes may limit the amount of net operating loss and research and development credit carryforwards that can be utilized annually to offset future taxable income and tax, respectively. The Company has not yet completed a Section 382 calculation.
A reconciliation of unrecognized income tax benefits is as follows:
|
|
|
Amount |
|
|
|
Balance at August 31, 2017 |
|
$ |
507 |
|
|
Gross increases, prior period tax positions |
|
|
312 |
|
|
Balance at August 31, 2018 |
|
|
819 |
|
|
Gross decreases, prior period tax positions |
|
|
(424 |
) |
|
Balance at August 31, 2019 |
|
$ |
395 |
|
|
No change - current year tax positions |
|
|
— |
|
|
Balance at August 31, 2020 |
|
$ |
395 |
|
The Company accounts for uncertain tax positions using a more-likely than-not threshold for recognizing and resolving uncertain tax positions. The evaluation of uncertain tax positions is based on factors that include, but are not limited to, changes in tax law, the measurement of tax positions taken or expected to be taken in tax returns, the effective settlement of matters subject to audit, new audit activity, and changes in facts or circumstances related to a tax position. The Company evaluates uncertain tax positions on an annual basis and adjusts the level of the liability to reflect any subsequent changes in the relevant facts surrounding the uncertain positions. The Company elected an accounting policy to record interest and penalties related to income taxes as a component of income tax expense. Due to its loss position, the Company reduced its gross deferred tax assets by $0.8 million for uncertain tax positions as of August 31, 2019. There was no such reduction in fiscal year 2020. During the next 12 months, the Company does not expect any material changes to its uncertain tax positions other than the accrual of interest in the normal course of business.
In the normal course of business, the Company is subject to examination by U.S. federal and certain state and foreign taxing authorities. All tax periods remain subject to income tax examinations as of August 31, 2020 in these jurisdictions.
|
(15) |
Redeemable Partners’ Interest and Partners’ Capital and Stockholders’ Equity |
Redeemable Partners’ Interest and Partners’ Capital
As of August 13, 2020, prior to the closing of the Reorganization Transactions and IPO (see Note 1 – Nature of Business), the following units of the partnership were authorized, issued and outstanding in accordance with the Company’s amended and restated Agreement of Exempted Limited Partnership Agreement (Partnership Agreement):
|
Description |
|
Authorized |
|
|
Issued and outstanding |
|
||
|
Unit classes: |
|
|
|
|
|
|
|
|
|
Class A |
|
|
5,000,000,000 |
|
|
|
183,354,104 |
|
|
Class B |
|
|
5,000,000,000 |
|
|
|
122,236,021 |
|
|
Class C |
|
|
5,000,000,000 |
|
|
|
3,660,106 |
|
|
Class D |
|
|
59,247,586 |
|
|
|
47,170,961 |
|
|
Class E |
|
|
129,828,398 |
|
|
|
129,828,398 |
|
104
DUCK CREEK TECHNOLOGIES, INC. AND SUBSIDIARIES
Notes to Consolidated Financial Statements
(amounts in thousands except unit and per unit and share and per share amounts)
Of the 47,170,961 Class D Units outstanding noted in the table above, 27,356,428 were unvested as of August 13, 2020.
In October 2018, the Company issued 1,500,000 Class C Units, with an aggregate fair value of $2.0 million, as part of the purchase price of the Outline acquisition as further described in Note 3 – Business Combinations.
In November 2019, the Company issued 41,412,296 Class E Units in exchange for cash consideration of $120.0 million to certain accredited investors. Also in November 2019, the Company redeemed 20,292,029 Class A Units and 13,528,013 Class B Units in exchange for $98.0 million.
In February 2020, the Company issued 30,222,126 Class E Preferred Units in exchange for cash consideration of $0.1 million to certain accredited investors. Also in February 2020, the Company redeemed 18,133,278 Class A Units and 12,088,848 Class B Units in exchange for $0.1 million.
In June 2020, the Company issued 58,193,976 Class E Preferred Units in exchange for cash consideration of $230.0 million to certain accredited investors. Also in June 2020, the Company redeemed 30,362,073 Class A Units and 20,241,374 Class B Units in exchange for $199.9 million. The Company incurred $11.4 million in aggregate issuance costs associated with the Class E Units.
Additionally, the Company issued Class D incentive units and Phantom Unit incentive awards to certain employees and directors of the Company (see Note 16 – Share-Based Compensation).
The Class A, Class B, Class C, and Class E Units were held by the Company’s limited partners, with the exception of 100 Class A Units which were held by the Company’s general partner.
Prior to the Reorganization Transactions and IPO, profits and losses were allocated to each class in such a manner, as close as possible, to equal the amount that would be distributable to each partner upon dissolution of the Company. The rights and preferences of the Class A, Class B, Class C, Class D, and Class E Units were as follows:
Voting rights: All units of the limited partners were deemed to be nonvoting units and did not entitle any holder thereof to any right to vote upon or approve any action to be taken by the Company. The Company’s general partner, Disco (Cayman) GP Co., had broad authority to act on behalf of the partnership.
Distribution preferences: The partners of the Company were entitled to receive distributions in the following order priority: (1) first, 100% to the holders of Class A Units, Class B Units, Class C Units, and Class E Units in proportion to their unreturned capital amounts, (2) second, to all holders, on a ratable basis, of Class A Units, Class B Units, Class C Units, Class D, and Class E Units held at the time of distribution.
Liquidation preferences: Upon any liquidation or dissolution of the Company, the partners were entitled to a distribution of the remaining assets of the Company after payment or provision for the Company’s liabilities has been made, in accordance with the distribution preferences described above.
Redemption rights: The holders of the Class A Units, Class B Units, Class C Units, and Class D Units did not have the right to redeem the units, outside of the distribution and liquidation terms described above. The holders of the Class E Units had the right to redeem the units upon (i) the occurrence of the Company not achieving certain liquidity events by the fourth anniversary of the original issuance of the Class E Units, and (ii) notice to the Company’s general partner. Although units of the Company were not mandatorily redeemable, they were classified outside of partner’s capital because they were potentially redeemable upon certain events outside of the Company’s control, including a change in control, sale, dissolution, or winding up.
Repurchase rights: In the event that an employee holding Class C Units was terminated for cause or upon breach of the agreement between the Company and the employee, the Company had the right to repurchase the Class C Units for the lower of the cost basis (to the holder) of the Class C Units, the fair value of the Class C Units at the date of termination or the fair value of the Class C Units at the date of repurchase. The Company also had the right to repurchase vested Class D Units upon termination as further described in Note 16 – Share-Based Compensation.
105
DUCK CREEK TECHNOLOGIES, INC. AND SUBSIDIARIES
Notes to Consolidated Financial Statements
(amounts in thousands except unit and per unit and share and per share amounts)
Reorganization Transactions and Initial Public Offering
Following the Reorganization Transactions and IPO as further described in Note 1 – Nature of Business, the holders of Class A, Class B, Class C, Class D and Class E Units retained all or a portion of their equity ownership in the Company through their ownership of common stock of the Company. The units of the partnership were converted into the following shares of common stock:
|
|
|
Units Held Pre-IPO |
|
|
Converted Shares Post-IPO |
|
||
|
Class A |
|
|
183,354,104 |
|
|
|
45,838,526 |
|
|
Class B |
|
|
122,236,021 |
|
|
|
28,855,284 |
|
|
Class C |
|
|
3,660,106 |
|
|
|
915,027 |
|
|
Class D |
|
|
19,814,533 |
|
|
|
7,930,897 |
|
|
Class E |
|
|
129,828,398 |
|
|
|
32,457,100 |
|
|
|
|
|
458,893,162 |
|
|
|
115,996,833 |
|
Non-controlling Interests
Following the Reorganization Transactions, the outstanding LP Units of the Operating Partnership owned by Accenture and RBW that were not contributed to the Company were treated as non-controlling interests. However, these outstanding LP Units of the Operating Partnership were subsequently redeemed using proceeds obtained from the IPO. Accordingly, the balance of non-controlling interests as of August 31, 2020 is $0.
Common Stock Reserved for Issuance
As of August 31, 2020, the Company was authorized to issue 300,000,000 shares of common stock with a par value of $0.01 per share and 130,713,745 shares of common stock were outstanding. As of August 31, 2020, the Company had 166,730,699 shares of common stock reserved for future issuance.
|
(16) |
Share-Based Compensation |
2020 Omnibus Incentive Plan
As part of the Reorganizations Transactions, the Company adopted the Duck Creek Technologies, Inc. 2020 Omnibus Incentive Plan (the “Plan”). The purpose of the Plan is to provide additional incentives to selected officers, employees, non-employee directors, independent contractors and consultants, to strengthen their commitment to the Company and to attract and retain competent and dedicated persons who are essential to the success of the Company’s business. The maximum number of shares of the Company’s common stock reserved for issuance under the Plan is 18,000,000 shares. This reserve will automatically increase on January 1st of each calendar year, prior to the tenth anniversary of the effective date of the Plan, by an amount equal or lesser of (i) 4% of the number of shares of common stock issued and outstanding on December 31st of the preceding year and (ii) an amount determined by the Plan administrator. The shares available for issuance are subject to adjustment in the event of a stock split, stock dividend or other defined changes in the Company’s capitalization.
Class D Units and Phantom Units
Prior to the IPO, the Company granted Class D incentive units (Class D Units) to certain employees and directors under the terms of Incentive Unit Award Agreements. The Company also granted Phantom Unit incentive awards (Phantom Units) to certain employees of its international subsidiaries. The Class D Units and Phantom Units were granted in three tranches, as follows:
|
Class D-1 Units |
80% of the units granted |
|
Class D-2 Units |
10% of the units granted |
106
DUCK CREEK TECHNOLOGIES, INC. AND SUBSIDIARIES
Notes to Consolidated Financial Statements
(amounts in thousands except unit and per unit and share and per share amounts)
107
DUCK CREEK TECHNOLOGIES, INC. AND SUBSIDIARIES
Notes to Consolidated Financial Statements
(amounts in thousands except unit and per unit and share and per share amounts)
Vesting of the Class D Units was 50% time‑based, quarterly, over a four year period from the vesting start date, and 50% based on the date in which the Class D Units become participating units. These vesting terms applied to each of the Class D‑1, Class D‑2 and Class D‑3 tranches described above. Class D‑1 Units would become participating units upon the later of: (i) the date which aggregate distributions by the Company exceeded the minimum threshold equity value (as defined in each Incentive Unit Award Agreement), or (ii) when the total cumulative distributions made to the Class A Unit holders exceeded the aggregate investment made by the Class A Unit holders. Class D‑2 and D‑3 Units would become participating units upon the later of: (i) the date which aggregate distributions by the Company exceeded the minimum threshold equity value (as defined in each Incentive Unit Award Agreement), or (ii) when the total cumulative distributions made to the Class A Unit holders exceeded either three times (Class D‑2 Units) or four times (Class D‑3 Units) the aggregate investment made by the Class A Unit holders. The terms of the Phantom Unit awards were similar to the Class D Unit awards; however, they did not represent ownership of any class unit of the Company. The Phantom Units vested and became participating units in similar fashion to the Class D Units as described above. The holder of a vested and participating Phantom Unit was eligible to receive a distribution in the same form and consideration as a Class D Unit holder, however, only upon a change in control event. Upon receiving the distribution, the Phantom Units would cease to be outstanding.
Share-based compensation expense related to the issuance of Class D Units was calculated based upon the fair value of the Class D Units at the time of grant and recognized ratably over the requisite service period of the award. With respect to the Phantom Units, as a change in control event represents a contingent future event outside the control of the Company, the Company did not record any share-based compensation expense related to the Phantom Units until the contingency was resolved.
The following is a summary of the Company’s Class D Unit awards as of the date of the IPO:
|
|
|
Number of Class D Units |
|
|
|
|
Nonvested, August 31, 2019 |
|
|
30,391,861 |
|
|
|
Granted |
|
|
3,420,000 |
|
|
|
Vested |
|
|
(5,579,183 |
) |
|
|
Forfeited |
|
|
(876,250 |
) |
|
|
Impact of conversion |
|
|
(27,356,428 |
) |
|
|
Nonvested, August 31, 2020 |
|
|
— |
|
|
Outstanding Class D Units of 47,170,961 converted to 9,785,895 shares of restricted common stock on the IPO date.
The following is a summary of the Company’s Phantom Unit awards as of the date of the IPO:
|
|
|
Number of Phantom Units |
|
|
|
|
Nonvested, August 31, 2019 |
|
|
1,228,125 |
|
|
|
Granted |
|
|
350,000 |
|
|
|
Vested |
|
|
(197,969 |
) |
|
|
Forfeited |
|
|
(143,750 |
) |
|
|
Impact of conversion |
|
|
(1,236,406 |
) |
|
|
Nonvested, August 31, 2020 |
|
|
— |
|
|
Outstanding Phantom Units of 1,894,063 converted to 373,581 Phantom stock awards on the IPO date.
Conversion of Class D Units and Phantom Units
On the date of the IPO, the Class D-1 Units became participating units when the total cumulative distributions made to the Class A Unit holders exceeded the aggregate investment made by the Class A Unit holders. In addition, participating D-1 Phantom Units became eligible for cash settlement. As part of the Reorganization Transactions; (i) Class D Units were converted to restricted common stock and (ii) non-participating Phantom Units were cancelled and replaced with new phantom stock awards. All converted and replaced awards retained the same vesting attributes as the original Class D Units and Phantom Units.
Vested and unvested Class D Units converted to an aggregate 9,785,895 shares of restricted common stock (“Class D Restricted Common Stock”). Of this amount, 7,930,897 were vested and 1,854,998 were unvested. The conversion was treated as a grant of a new award in exchange for cancellation of an old award, and therefore was accounted for as a modification. Accordingly, the Company compared the fair value of the Class D Units immediately prior to the conversion to the fair value of the Class D Restricted Common Stock granted. However, based on the conversion ratio in effect, no additional share-based compensation expense was recorded as the fair values were identical upon conversion.
As a result of the Participating D-1 Phantom Units becoming eligible for cash settlement, the Company recorded share-based compensation expense and an accrued liability of $6.6 million during the fiscal year ended August 31, 2020 based on the fair value of the awards on the date of IPO. Non-participating D-2 and D-3 Phantom Units were converted to 126,289 phantom stock awards (“Class D Phantom Stock Awards”). The grant date fair value of Class D Phantom Stock Awards is being recorded as share-based compensation expense over the requisite service period of the awards. The Company has concluded that Class D Phantom Stock Awards should be treated as liability classified share-based compensation awards because they will be settled in cash. Accordingly, the accrued liability balance associated with Class D Phantom Stock Awards is adjusted to fair value at each reporting period through earnings. During the fiscal year ended August 31, 2020, the Company recorded share-based compensation expense and an accrued liability of $1.2 million for Class D Phantom Stock Awards.
Leverage Restoration Options and SARs
In substitution for part of the economic benefit of the Class D Units that was not reflected in the conversion to Class D Restricted Common Stock, 1,802,216 stock options (“Leverage Restoration Options”) were granted to holders of Class D Units. The fair value of the Leverage Restoration Options is being recorded as share-based compensation expense over the requisite service period of the awards. During the fiscal year ended August 31, 2020, the Company recorded share-based compensation expense of $10.5 million for the Leverage Restoration Options.
Additionally, in substitution for part of the economic benefit of the Phantom Units that was not reflected in the conversion to Class D Phantom Stock Awards, 91,762 stock appreciation rights (“Leverage Restoration SARs”) were granted to holders of Phantom Units. The fair value of the Leverage Restoration SARs is being recorded as share-based compensation expense over the requisite period of the awards. The Company has concluded that the Leverage Restoration SARs should be treated as liability classified share-based compensation awards because they will be settled in cash. Accordingly, the accrued liability balance associated with Leverage Restoration SARs is adjusted to fair value at each reporting period through earnings. During the quarter ended August 31, 2020, the Company recorded share-based compensation expense and an accrued liability of $0.9 million for Leverage Restoration SARs.
Class D Restricted Common Stock
The Class D Restricted Common Stock awards retain the vesting attributes (including original service period vesting start date) of the Class D Units. Unless the applicable award agreement provides otherwise, participants with restricted stock will generally have all the rights of a stockholder during the restricted period.
108
DUCK CREEK TECHNOLOGIES, INC. AND SUBSIDIARIES
Notes to Consolidated Financial Statements
(amounts in thousands except unit and per unit and share and per share amounts)
The following is a summary of the Company’s Class D Restricted Common Stock at the date of IPO through the fiscal year ended August 31, 2020:
|
|
|
Number of Class D Restricted Stock |
|
|
|
Nonvested, August 31, 2019 |
|
|
— |
|
|
Conversion of Class D Units |
|
|
1,854,998 |
|
|
Granted |
|
|
— |
|
|
Vested |
|
|
(22,125 |
) |
|
Forfeited |
|
|
— |
|
|
Nonvested, August 31, 2020 |
|
|
1,832,873 |
|
Unrecognized share-based compensation expense of $1.4 million related to Class D Restricted Common Stock as of August 31, 2020 is expected to be recognized over a period of 2.8 years. Since the fair value of the Class D Units and the fair value of the Class D Restricted Common Stock were identical upon conversion, the $1.4 million of future share-based compensation relates to the aggregate grant date fair value of the Class D Units determined in prior periods. As such, the disclosure of the weighted average fair value of the Class D Restricted Common Stock is not meaningful.
Leverage Restoration Options
Leverage Restoration Options were granted on the IPO date, with an exercise price of $27.00, a ten-year contractual term and retained the vesting attributes (including original service period vesting start dates) of the Class D Units. The per share fair value of each option award was estimated on the grant date under the Black-Scholes valuation model that used the following assumptions:
|
Expected life |
|
4 years |
|
|
Risk-free rate |
|
0.24% |
|
|
Volatility |
|
35% |
|
|
Dividend yield |
|
0.00% |
|
The following is a summary of the Company’s Leverage Restoration Options:
|
|
|
Number of Stock Options Outstanding |
|
|
Weighted Average Exercise Price |
|
|
Weighted Average Remaining Contractual Life (in years) |
|
|
Aggregate Intrinsic Value |
|
||||
|
Balance as of August 31, 2019 |
|
|
— |
|
|
|
— |
|
|
|
— |
|
|
|
— |
|
|
Granted |
|
|
1,802,216 |
|
|
$ |
27.00 |
|
|
|
10 |
|
|
|
|
|
|
Exercised |
|
|
— |
|
|
|
— |
|
|
|
|
|
|
|
— |
|
|
Forfeited |
|
|
— |
|
|
|
— |
|
|
|
|
|
|
|
|
|
|
Balance as of August 31, 2020 |
|
|
1,802,216 |
|
|
$ |
27.00 |
|
|
|
10 |
|
|
|
21,609 |
|
|
|
|
|
|
|
|
|
|
|
|
|
|
|
|
|
|
|
|
Vested and expected to vest as of August 31, 2020 |
|
|
1,802,216 |
|
|
$ |
27.00 |
|
|
|
10 |
|
|
|
21,609 |
|
|
Exercisable as of August 31, 2020 |
|
|
1,192,691 |
|
|
$ |
27.00 |
|
|
|
10 |
|
|
|
14,300 |
|
As of August 31, 2020, unrecognized share-based compensation expense of $3.5 million related to these stock options is expected to be recognized over a weighted average period of 2.7 years.
Class D Phantom Stock Awards
109
DUCK CREEK TECHNOLOGIES, INC. AND SUBSIDIARIES
Notes to Consolidated Financial Statements
(amounts in thousands except unit and per unit and share and per share amounts)
The Class D Phantom Stock Awards retain the vesting attributes (including original service period vesting start date) of the Phantom Units. These awards will be settled in cash equal to the fair market value of a share of the Company’s common stock, determined on the day that such award becomes fully vested.
The following is a summary of the Company’s Class D Phantom Stock Awards:
|
|
|
Number of Class D Phantom Stock Awards |
|
|
|
Nonvested, August 31, 2019 |
|
|
— |
|
|
Conversion of Phantom Units |
|
|
126,289 |
|
|
Granted |
|
|
— |
|
|
Vested |
|
|
(187 |
) |
|
Forfeited |
|
|
— |
|
|
Nonvested, August 31, 2020 |
|
|
126,102 |
|
During the fiscal year ended August 31, 2020, the Company recorded share-based compensation expense and an accrued liability of $1.2 million for Class D Phantom Stock Awards. As of August 31, 2020, unrecognized share-based compensation expense of $3.8 million related to Class D Phantom Stock Awards is expected to be recognized over a weighted average period of 3.1 years.
Leverage Restoration Stock Appreciation Rights
Leverage Restoration Stock Appreciation Rights (“SARs”) were granted on August 14, 2020 with an exercise price of $27.00, a ten-year contractual term and retained vesting attributes (including original service period vesting start dates) of the Phantom Units. SARs will be settled in cash equal to the excess of the fair market value of a share of the Company’s common stock, determined on the date of exercise, over the exercise price share of common stock underlying such SAR.
The per share fair value of each SAR was estimated on the grant date under the Black-Scholes option valuation model and re-valued as of August 31, 2020 using the following assumptions:
|
Expected life |
|
4 years |
|
|
Risk-free rate |
|
0.24% |
|
|
Volatility |
|
35% |
|
|
Dividend yield |
|
0.00% |
|
The following is a summary of the Company’s outstanding balance of SAR’s as of the date of the IPO and through the fiscal year ended August 31, 2020:
|
|
|
Number of Stock Appreciation Rights Outstanding |
|
|
Weighted Average Exercise Price |
|
|
Weighted Average Remaining Contractual Life (in years) |
|
|
Aggregate Intrinsic Value |
|
||||
|
Balance as of August 31, 2019 |
|
|
— |
|
|
|
— |
|
|
|
— |
|
|
|
— |
|
|
Granted |
|
|
91,762 |
|
|
$ |
27.00 |
|
|
10 |
|
|
|
|
|
|
|
Exercised |
|
|
— |
|
|
|
— |
|
|
|
|
|
|
|
— |
|
|
Forfeited |
|
|
— |
|
|
|
— |
|
|
|
|
|
|
|
|
|
|
Balance as of August 31, 2020 |
|
|
91,762 |
|
|
$ |
27.00 |
|
|
10 |
|
|
|
1,100 |
|
|
|
|
|
|
|
|
|
|
|
|
|
|
|
|
|
|
|
|
|
Vested and expected to vest as of August 31, 2020 |
|
|
91,762 |
|
|
$ |
27.00 |
|
|
10 |
|
|
|
1,100 |
|
|
|
Exercisable as of August 31, 2020 |
|
|
47,592 |
|
|
$ |
27.00 |
|
|
10 |
|
|
571 |
|
||
110
DUCK CREEK TECHNOLOGIES, INC. AND SUBSIDIARIES
Notes to Consolidated Financial Statements
(amounts in thousands except unit and per unit and share and per share amounts)
Aggregate intrinsic value represents the total market value of Leverage Restoration SARs at the Company’s closing stock price of $40.00 and $38.99 on August 14, 2020 and August 31, 2020, respectively.
During the fiscal year ended August 31, 2020, the Company recorded share-based compensation expense and an accrued liability of $0.9 million for Leverage Restoration SARs. As of August 31, 2020, unrecognized share-based compensation expense of $0.6 million related to Leverage Restoration SARs is expected to be recognized over a weighted average period of 3.1 years.
New Restricted Stock Awards and Restricted Stock Units
On the date of the IPO, the Company granted Restricted Stock Awards (“RSAs”) to select US employees and outside directors and Restricted Stock Units (“RSUs”) to select international employees. While substantively the same from an economic standpoint, the RSUs represent the right to receive shares of the Company’s common stock as they vest; however, the holder of an RSU has no rights as a stockholder.
The following is a summary of the Company’s RSAs and RSUs:
|
|
|
Restricted Stock Awards |
|
|
Restricted Stock Units |
|
|
Weighted Average Grant Date Fair Value |
|
|
Aggregate Intrinsic Value |
|
||||
|
Nonvested, August 31, 2019 |
|
|
— |
|
|
|
— |
|
|
|
— |
|
|
|
— |
|
|
Granted |
|
|
904,747 |
|
|
|
55,766 |
|
|
$ |
27.00 |
|
|
|
|
|
|
Vested |
|
|
(343 |
) |
|
|
— |
|
|
$ |
27.00 |
|
|
|
14 |
|
|
Forfeited |
|
|
(1,027 |
) |
|
|
— |
|
|
$ |
27.00 |
|
|
|
|
|
|
Nonvested, August 31, 2020 |
|
|
903,377 |
|
|
|
55,766 |
|
|
$ |
27.00 |
|
|
|
37,397 |
|
These awards vest annually over a 4-year requisite service period and are settled in shares of the Company’s common stock. The Company has concluded that the RSAs and RSUs should be treated as equity classified share-based compensation awards. During the year ended August 31, 2020, the Company recorded aggregate share-based compensation expense of $0.3 million related to these RSAs and RSUs.
Share-based compensation expense has been recorded in the accompanying consolidated statements of operations as follows for the years ended August 31, 2020, 2019 and 2018:
|
|
|
August 31 |
|
|||||||||
|
|
|
2020 |
|
|
2019 |
|
|
2018 |
|
|||
|
Cost of subscription revenue |
|
$ |
415 |
|
|
$ |
21 |
|
|
$ |
233 |
|
|
Cost of license revenue |
|
|
— |
|
|
|
— |
|
|
|
— |
|
|
Cost of maintenance and support revenue |
|
|
28 |
|
|
|
9 |
|
|
|
— |
|
|
Cost of services revenue |
|
|
4,683 |
|
|
|
122 |
|
|
|
— |
|
|
Research and development |
|
|
4,128 |
|
|
|
398 |
|
|
|
395 |
|
|
Sales and marketing |
|
|
5,581 |
|
|
|
417 |
|
|
|
338 |
|
|
General and administrative |
|
|
6,273 |
|
|
|
1,103 |
|
|
|
773 |
|
|
Total share-based compensation expense |
|
$ |
21,108 |
|
|
|
2,070 |
|
|
|
1,739 |
|
111
DUCK CREEK TECHNOLOGIES, INC. AND SUBSIDIARIES
Notes to Consolidated Financial Statements
(amounts in thousands except unit and per unit and share and per share amounts)
|
(17) |
Segment Information and Information about Geographic Areas |
The Company considers operating segments to be components of the Company for which separate financial information is available and evaluated regularly by the Company’s chief operating decision maker in deciding how to allocate resources and in assessing performance. The chief operating decision maker for the Company is the chief executive officer. The chief executive officer reviews financial information presented on a consolidated basis, accompanied by information about revenue by product and geographic region, for purposes of allocating resources and evaluating financial performance. Accordingly, the Company has determined that it has a single operating segment.
Revenues by geographic area presented based upon the location of the customer are included in Note 2(g).
Property and equipment, net by geographic area are as follows:
|
|
|
August 31 |
|
|||||
|
|
|
2020 |
|
|
2019 |
|
||
|
United States |
|
$ |
15,715 |
|
|
|
15,832 |
|
|
All other |
|
2398 |
|
|
|
1,226 |
|
|
|
Total property and equipment, net |
|
$ |
18,113 |
|
|
|
17,058 |
|
|
(18) |
Employee Benefit Plans |
Defined Contribution Plan
The Company has a 401(k) plan covering all U.S.-based employees who meet certain eligibility requirements. Under the terms of the 401(k) plan, the employees can elect to make tax-deferred contributions to the 401(k) plan and the Company can make discretionary contributions. Under this plan, discretionary contributions of $5.3 million, $5.0 million, and $4.5 million were made by the Company for the years ended August 31, 2020, 2019 and 2018, respectively.
Other Long-Term Obligations
The Company accrues for long-term termination obligations earned by employees of its subsidiary in India. The termination obligation would be payable to the employee in the event of termination without cause and is based upon the employee’s wage and years of service, and the applicable payment formula as dictated by statute. The liability is based on an actuarial estimate. The accrued obligation was $1.5 million, $1.4 million, and $1.0 million as of August 31, 2020, 2019, and 2018, respectively, and is included in other long-term liabilities in the accompanying consolidated balance sheets.
|
(19) |
Related-Party Transactions |
Services Provided on Behalf of and by Accenture
Subsequent to the acquisition of Duck Creek, the Company entered into a transition services agreement with Accenture, the sellers of Duck Creek, who held 100% of the outstanding Class B Units of the Company at such time and as of August 31, 2020 held 22.1% of the outstanding shares of common stock of the Company. Accenture provided certain operational services under this agreement to the Company. The original transition services agreement expired on August 1, 2017. An extension of the agreement providing for certain software hosting services expired on July 31, 2018. The Company recorded expenses of $4.8 million for these Accenture services under the terms of this agreement during the fiscal year ended August 31, 2018. These expenditures are classified within cost of revenue, research and development, and selling, general and administrative expenses in the accompanying consolidated statements of operations. No expenses relating to the transition services agreement were incurred by the Company during the years ended August 31, 2020 and 2019.
112
DUCK CREEK TECHNOLOGIES, INC. AND SUBSIDIARIES
Notes to Consolidated Financial Statements
(amounts in thousands except unit and per unit and share and per share amounts)
The Company also provides certain professional services, software maintenance services and SaaS products to end customers as a subcontractor to Accenture as part of its typical revenue generating arrangements. During the year ended August 31, 2020, 2019 and 2018, the Company recognized revenue of $2.2 million, $2.6 million, and $12.3 million, respectively, relating to services performed in this subcontractor capacity. As of August 31, 2020 and 2019, the Company had outstanding accounts receivables due from Accenture of $0.1 million and $0.1 million, respectively, relating to these services. As of August 31, 2020 and 2019, the Company had deferred revenue of $0.4 million and $0.3 million, respectively, relating to these services.
In addition, the Company also engages Accenture to provide certain professional services on behalf of the Company as part of its typical revenue generating arrangements. During the years ending August 31, 2020, 2019 and 2018, the Company incurred expenditures of $0.2 million, $0.8 million and $1.6 million, respectively, relating to services performed by Accenture.
Revenue Contracts with Investors
The Company recognizes revenues from customers that invested in the Company’s Class E Preferred Units during the year ended 2020 whose shares converted to common stock in our IPO. During the year ended August 31, 2020, the Company recognized aggregate revenues of $18.7 million from these customers and deferred revenue of $6.4 million.
As of August 31, 2020, the Company had outstanding accounts receivables due from these customers of $7.9 million.
113
Item 9. Changes in and Disagreements with Accountants on Accounting and Financial Disclosure.
None.
Item 9A. Controls and Procedures.
Evaluation of Disclosure Controls and Procedures
Our management, with the participation of our CEO and CFO, has evaluated the effectiveness of our disclosure controls and procedures (as defined in Rules 13a-15(e) and 15d-15(e) under the Exchange Act, as of the end of the period covered by this Annual Report on Form 10-K. Based on such evaluation, our CEO and CFO have concluded that as of August 31, 2020, our disclosure controls and procedures are designed at a reasonable assurance level and are effective to provide reasonable assurance that information we are required to disclose in reports that we file or submit under the Exchange Act is recorded, processed, summarized, and reported within the time periods specified in the rules and forms of the SEC, and that such information is accumulated and communicated to our management, including our CEO and CFO, as appropriate, to allow timely decisions regarding required disclosure.
Management's Report on Internal Control Over Financial Reporting
This annual report does not include a report of management's assessment regarding internal control over financial reporting or an attestation report of the company's registered public accounting firm due to a transition period established by rules of the SEC for newly public companies.
Changes in Internal Control over Financial Reporting
There was no change in our internal control over financial reporting (as defined in Rules 13a-15(d) and 15d-15(d) under the Exchange Act) during the period covered by this report that has materially affected, or is reasonably likely to materially affect, our internal control over financial reporting.
Limitations on the Effectiveness of Controls
Our management, including our Chief Executive Officer and Chief Financial Officer, does not expect that the Company’s disclosure controls and procedures or the Company’s internal controls over financial reporting will prevent all errors and all fraud. A control system, no matter how well conceived and operated, can provide only reasonable, not absolute, assurance that the objectives of the control system are met. Further, the design of a control system must reflect the fact that there are resource constraints, and the benefits of controls must be considered relative to their costs. Because of the inherent limitations in all control systems, no evaluation of controls can provide absolute assurance that all control issues and instances of fraud, if any, within the Company have been detected.
None.
114
Item 10. Directors, Executive Officers and Corporate Governance.
Set forth below are the names, ages and positions of our current executive officers and directors as of August 31, 2020:
|
Name |
|
Age |
|
Position |
|
Michael Jackowski |
|
51 |
|
Director and Chief Executive Officer |
|
Vincent Chippari |
|
60 |
|
Chief Financial Officer |
|
Matthew Foster |
|
48 |
|
Chief Operating Officer |
|
Eugene Van Biert Jr. |
|
42 |
|
Chief Revenue Officer |
|
Anirban Dey |
|
48 |
|
Chief Product and Technology Officer |
|
Scott Fitzgerald |
|
46 |
|
Chief Marketing Officer |
|
Eva Huston |
|
50 |
|
Chief Strategy Officer |
|
Kathy Crusco |
|
55 |
|
Director |
|
Roy Mackenzie |
|
49 |
|
Director |
|
Domingo Miron |
|
55 |
|
Director |
|
Charles Moran |
|
65 |
|
Director |
|
Stuart Nicoll |
|
53 |
|
Director |
|
Francis Pelzer |
|
50 |
|
Director |
|
Larry Wilson |
|
74 |
|
Director |
|
Jason Wright |
|
48 |
|
Director |
Michael Jackowski has served as a director and Chief Executive Officer of the Company since August 2016, and was a managing partner at Accenture from September 2011 to August 2016. Prior to joining Accenture, Mr. Jackowski held several leadership roles at The Allstate Corporation from 2004 until 2011, including the role of senior vice president of technology and operations. Prior to joining Allstate, Mr. Jackowski was a managing partner for Accenture’s global claims and underwriting practice in the financial services group from 1992 until 2004. Mr. Jackowski received a B.A. from Iowa State University in Electrical Engineering.
Vincent Chippari has served as Chief Financial Officer of the Company since September 2016. Prior to joining the Company, Mr. Chippari was managing director and chief financial officer of Interactive Data Corp. from October 2010 until June 2016. Mr. Chippari has also previously served as chief financial officer of FleetMatics Group, from January 2009 until October 2010, and NameMedia, Inc., from August 2006 until January 2009, chief strategy officer of Thomson Healthcare, from May 2005 until August 2006, and executive vice president and chief financial officer of Information Holdings Inc., from 1998 until 2004. Mr. Chippari received a B.S.B.A. from Bryant University and an M.B.A. from the University of Connecticut.
Matthew Foster has served as Chief Operating Officer of the Company since August 2016. Prior to joining the Company, Mr. Foster was an Executive Partner at Accenture and held several leadership roles from August 1994 through August 2016, including the roles of Chief Technology Officer and Chief Operating Officer of the P&C software group. Mr. Foster received a B.S. in Industrial Engineering from Purdue University.
Eugene Van Biert Jr. has served as Chief Revenue Officer of the Company since November 2016. Prior to joining the Company, Mr. Van Biert held several leadership roles at Skillsoft Corporation from 2001 until February 2016, including the role of vice president and general manager of global compliance solutions. Mr. Van Biert has a B.A. from Lafayette College, and M.B.A. from Carroll School of Management, Boston College and completed the General Management Program at Harvard Business School.
115
Anirban Dey has served as Chief Product and Technology Officer of the Company since September 2018. Prior to joining the Company, Mr. Dey served as chief technology officer at Vertafore, Inc. from August 2017 until June 2018. Prior to joining Vertafore, Mr. Dey was the global head and chief business officer of EdgeVerve from March 2015 until July 2017. Prior to joining EdgeVerve, Mr. Dey held leadership roles at SAP Concur and SAP Labs, from September 2014 until March 2015 and January 2008 until June 2014, respectively. Prior to joining SAP, Mr. Dey was with Oracle from January 1998 until December 2007. Mr. Dey holds a B. Tech from the Indian Institute of Technology Kharagpur, an M.S. in Engineering from the University of Nebraska, Lincoln and an M.B.A. from the University of California, Berkley.
Scott Fitzgerald has served as Chief Marketing Officer of the Company since March 2017. Prior to joining the Company, Mr. Fitzgerald was SVP of Marketing for BlueSnap, Inc. from July 2015 until March 2017. Mr. Fitzgerald has also previously served as VP, Marketing and VP, Product Line Manager of ACI Worldwide, Inc. from September 2010 to July 2015. Mr. Fitzgerald held various leadership positions at CA Technologies from December 2003 to September 2010. Prior to joining CA, Mr. Fitzgerald was with Cisco Systems, Inc. and American Power Conversion, Inc. from 2000-2002 and 1996-2000 respectively. Mr. Fitzgerald received a B.A. from Union College and an M.B.A. from the Babson F.W. Olin Graduate School of Business.
Eva Huston has served as Chief Strategy Officer of the Company since August 2020. Ms. Huston also currently serves as an independent director and member of the audit committee for CC Neuberger Principal Holdings I (NYSE: PCPL). Prior to joining the Company, Ms. Huston was the Chief Financial Officer at Verisk Analytics from June 2016 to November 2017, and a consultant November 2017 to March 2018. She also served in various other roles at Verisk Analytics, including Treasurer and Chief Knowledge Officer and Head of Investor Relations from September 2009 to June 2016. Previously, Ms. Huston was a Managing Director in telecom, media and technology investment banking at JP Morgan Chase & Co. Ms. Huston received a B.S. in Foreign Service from Georgetown University.
Kathy Crusco has served as a member of the Company’s board of directors since February 2020. Ms. Crusco served as the Executive Vice President and Chief Financial Officer at Kony, Inc., a privately-held provider of digital experience applications for banking and low-code application development platform solutions, from December 2017 to January 2020. Prior to Kony, Inc., Ms. Crusco served as Executive Vice President, Chief Operating Officer and Chief Financial Officer at Epicor Software Corporation, a privately-held software company. Ms. Crusco joined Epicor in May 2011 when the company merged with Activant Solutions, Inc., a business management software company where she served as Senior Vice President and Chief Financial Officer from May 2007 to November 2010, then as Executive Vice President and Chief Financial Officer. Ms. Crusco also spent five years at Polycom, including serving as Vice President of Worldwide Finance. Ms. Crusco has been a member of the board of directors of (i) Calix since September 2017, (ii) Poly (formerly Plantronics, Inc.) since August 2018 and (iii) QAD since December 2019. Ms. Crusco was previously a member of the board of directors of Mitchell International from December 2013 to May 2018. Ms. Crusco holds a Bachelor of Science in Business Administration with an emphasis in accounting from California State University, Chico. We believe that Ms. Crusco is qualified to serve on our board of directors due to her extensive financial leadership and strategy management experience.
Roy Mackenzie has served as a member of the Company’s board of directors since April 2016. Since January 2003, Mr. Mackenzie has held roles at Apax, most recently serving on the Investment Committee and as a member of the Tech & Telco investment team. Prior to joining Apax, Mr. Mackenzie held roles at McKinsey & Company from 1993 to 1995 and then again from 1999 to 2000, where he specialized in the technology sector. Mr. Mackenzie holds an M.B.A. from Stanford Graduate School of Business and a Master of Engineering from Imperial College, London. We believe that Mr. Mackenzie is qualified to serve on our board of directors due to his extensive technology and finance industry experience.
Domingo Miron has served as a member of the Company’s board of directors since September 2019. Since January 1989, Mr. Miron has held roles at Accenture, most recently as the group chief executive of Accenture Financial Services. Mr. Miron holds a degree in mathematics from Complutense University of Madrid and is a graduate of the Management Development Program at IESE Business School, University of Navarra. We believe that Mr. Miron is qualified to serve on our board of directors due to his extensive accounting experience.Charles Moran has served as a member of the Company’s board of directors since November 2016. Mr. Moran was the founder and served as the chief executive officer and president and Chairman of Skillsoft Plc from 1998 until
116
December 2015. Prior to Skillsoft, Mr. Moran was the president and chief executive officer of National Education Training Group, Inc. from 1995 until 1997. Mr. Moran served as the chief financial officer and chief operations officer of Softdesk, Inc. from 1993 until 1994. Mr. Moran currently serves on the board of directors of Manhattan Associates, Inc. and Commvault Systems, Inc., and currently serves as an advisor to multiple private equity firms. Mr. Moran has previously served as a director of Clarivate PLC, Skillsoft Plc, Higher One Holdings, Inc. and Workgroup Technology Corporation. Mr. Moran holds a B.S. from Boston College and an M.B.A. from Suffolk University. We believe that Mr. Moran is qualified to serve on our board of directors due to his extensive technology industry experience.
Stuart Nicoll has served as a member of the Company’s board of directors since August 2016. Mr. Nicoll has served as the senior managing director of Corporate Development for Accenture since 2009 and has worked for Accenture since 1997. Prior to Accenture, Mr. Nicoll started his career at KPMG in audit and transaction services roles before serving in a commercial director role at Electronic Data Systems. Mr. Nicoll received a B.A. in business administration from Manchester Metropolitan University and is a member of the Institute of Chartered Accountants in England and Wales. We believe that Mr. Nicoll is qualified to serve on our board of directors due to his extensive accounting experience.
Francis Pelzer has served as a member of the Company’s board of directors since March 2019. Mr. Pelzer has served as the executive vice president and chief financial officer of F5 Networks since 2018. Prior to F5 Networks, Mr. Pelzer served as the president and chief operating officer of the cloud business group at SAP Software Solutions from December 2014 until May 2018. Prior to SAP, Mr. Pelzer served as chief financial officer of Concur Technologies from May 2010 until it was acquired by SAP in 2014. Mr. Pelzer serves on the board of directors of Benefitfocus, Inc. and Modumetal, Inc. Mr. Pelzer received a B.A. from Dartmouth College and an M.B.A. from the Tuck School of Business at Dartmouth College. We believe that Mr. Pelzer is qualified to serve on our board of directors due to his extensive technology and finance industry experience.
Larry Wilson has served as a member of the Company’s board of directors since November 2016. Mr. Wilson served as the chief executive officer of Policy Management Systems Corporation from 1981 until the company merged with Computer Sciences Corporation in 2000. Mr. Wilson previously serviced on the board of directors of Assured Partners from 2005 until 2020, Worley Companies, Inc. from 2014 until 2018, Ventus Risk Management, Chairman from 2016 until 2019 and FINEOS, Dublin, Ireland 2012 to 2017. Mr. Wilson received a B.S. in marketing and an M.B.A. from the University of South Carolina and is a Chartered Property and Casualty Underwriter. We believe that Mr. Wilson is qualified to serve on our board of directors due to his extensive technology industry experience.
Jason Wright has served as a member of the Company’s board of directors since April 2016 and currently serves as the Chairman. He joined Apax in 2000 and is a Partner in the Tech & Telco team. He currently serves on the board of directors of Paycor, Inc., ECi Software Solutions, Inc., Verint Systems Inc. (Nasdaq: VRNT), Tivit Terceirização De Processos, Serviços e Tecnologia S.A. and RealPage, Inc. (Nasdaq: RP). He has previously served on the board of directors of Aptos Technology Inc., Exact Holding B.V., TriZetto Corporation, Epicor Software Corporation, Paradigm Holdings Inc., Plex Systems, Inc., Planview, Inc. and Spectrum Labs, Inc. Prior to joining Apax, Mr. Wright served in a variety of roles at GE Capital from 1995 to 1998, including principal investing on behalf of GE Ventures. Previously, he worked at Accenture designing and implementing systems for the financial services and pharmaceutical industries. Mr. Wright serves on the Graduate Executive Board of the Wharton School of the University of Pennsylvania and is a Trustee of the Apax Foundation. He is Chairman Emeritus and a current board member of the Opportunity Network, an education-focused charity in New York City. Mr. Wright received a B.A. in Economics from Tufts University and an MBA in Finance from the Wharton School of the University of Pennsylvania. We believe that Mr. Wright is qualified to serve on our board of directors due to his extensive technology and finance industry experience.
117
In accordance with our amended and restated certificate of incorporation our board of directors is divided into three classes with staggered three-year terms. Only one class of directors is elected at each annual meeting of stockholders, with the other classes continuing for the remainder of their respective three-year terms. Our board of directors is designated as follows:
|
|
• |
The Class I directors are Charles Moran, Stuart Nicoll and Jason Wright, and their terms will expire at the annual meeting of stockholders to be held in 2021; |
|
|
• |
The Class II directors are Roy Mackenzie, Domingo Miron and Francis Pelzer, and their terms will expire at the annual meeting of stockholders to be held in 2022; and |
|
|
• |
The Class III directors are Mike Jackowski, Kathy Crusco and Larry Wilson, and their terms will expire at the annual meeting of stockholders to be held in 2023. |
At each annual meeting of stockholders, upon the expiration of the term of a class of directors, each director in the class, or the successor to each such director in the class, is elected to serve from the time of election and qualification until the third annual meeting following his or her election and until his or her successor is duly elected and qualified, in accordance with our amended and restated certificate of incorporation. Any increase or decrease in the number of directors are distributed among the three classes so that, as nearly as possible, each class will consist of one-third of the directors. This classification of our board of directors may have the effect of delaying or preventing changes in control of our company.
Controlled Company Exemption
Pursuant to the Stockholders’ Agreement, we are required to take all necessary action to cause our board of directors to include individuals designated by Apax and Accenture pursuant to certain ownership thresholds. Apax and Accenture, individually, are required to vote all of their shares, and take all other necessary actions, to cause our board of directors to include the individuals designated as directors by Apax and Accenture (as applicable). See “Item 13. Certain relationships and related party transactions—Stockholders’ Agreement.” Pursuant to the Stockholders’ Agreement, Apax and Accenture control a majority of the voting power of shares of common stock eligible to vote in the election of our directors. As a result, we are a “controlled company” within the meaning of the corporate governance standards of Nasdaq. As a controlled company, we qualify for, and rely on, exemptions from certain corporate governance requirements, including the requirement that, within one year of the date of the listing of our common stock a majority of our board of directors consists of “independent directors,” as defined under the rules of Nasdaq.
As long as Apax and Accenture control a majority of the voting power of our outstanding shares of common stock, we may utilize these exemptions. As a result, currently we do not have a majority of our directors classified as independent. Accordingly, you do not have the same protections afforded to stockholders of companies that are subject to all of the corporate governance requirements of Nasdaq. In the event that we cease to be a “controlled company” and our common stock continues to be listed on Nasdaq, we will be required to comply with these provisions within the applicable transition periods.
In any case, these exemptions do not modify the independence requirements for our audit committee, and we will comply with the requirements of Rule 10A-3 of the Exchange Act and the rules of Nasdaq within the applicable time frame.
Committees of the Board of Directors
Audit Committee
The audit committee, among other things:
|
|
• |
reviews the audit plans and findings of our independent registered public accounting firm and our internal audit and risk review staff, as well as the results of regulatory examinations, and tracks management’s corrective action plans where necessary; |
118
|
|
• |
reviews our financial statements, including any significant financial items and/or changes in accounting policies, with our senior management and independent registered public accounting firm; |
|
|
• |
reviews our financial risk and control procedures, compliance programs and significant tax, legal and regulatory matters; |
|
|
• |
has the sole discretion to appoint annually our independent registered public accounting firm, evaluate its independence and performance and set clear hiring policies for employees or former employees of the independent registered public accounting firm; and |
|
|
• |
reviews and approves in advance any proposed related person transactions. |
The members of the audit committee are Francis Pelzer (Chair), Kathy Crusco and Roy Mackenzie. Rule 10A-3 of the Exchange Act and the corporate governance standards of Nasdaq require that our audit committee have at least one independent member, have a majority of independent members within 90 days of the date of the IPO and be composed entirely of independent members within one year of the date of the IPO. Our board of directors has affirmatively determined that Francis Pelzer and Kathy Crusco meet the definition of “independent director” for purposes of serving on the audit committee under Rule 10A-3 of the Exchange Act and the corporate governance standards of Nasdaq. Our board of directors has determined that each director appointed to the audit committee is financially literate, and our board of directors has determined that Francis Pelzer is our audit committee financial expert.
Nominating and Corporate Governance Committee
The nominating and corporate governance committee, among other things:
|
|
• |
reviews the performance of our board of directors and makes recommendations to our board of directors regarding the selection of candidates, qualification and competency requirements for service on our board of directors and the suitability of proposed nominees as directors; |
|
|
• |
advises our board of directors with respect to the corporate governance principles applicable to us; |
|
|
• |
oversees the evaluation of our board of directors and management; |
|
|
• |
reviews and approves in advance any related party transaction, other than those that are pre-approved pursuant to pre-approval guidelines or rules established by the committee; and |
|
|
• |
recommends guidelines or rules to cover specific categories of transactions. |
The members of the nominating and corporate governance committee are Jason Wright (Chair), Stuart Nicoll and Larry Wilson.
Compensation Committee
The compensation committee, among other things:
|
|
• |
reviews, modifies and approves (or if it deems appropriate, makes recommendations to the full board of directors regarding) our overall compensation strategy and policies; |
|
|
• |
reviews and recommends to our board of directors the salaries, benefits and equity incentive grants, consultants, officers, directors and other individuals we compensate; |
|
|
• |
reviews and approves corporate goals and objectives relevant to executive officer compensation, evaluates executive officer performance in light of those goals and objectives, and determines executive officer compensation based on that evaluation; |
|
|
• |
reviews and approves the terms of any employment agreements, severance arrangements, change in control protections and any other compensatory arrangements for our executive officers; and |
|
|
• |
oversees our compensation and employee benefit plans. |
119
The members of the compensation committee are Charles Moran (Chair), Kathy Crusco and Jason Wright.
All members of our compensation committee are “non-employee” directors as defined in Rule 16b-3(b)(3) under the Exchange Act.
Compensation Committee Interlocks and Insider Participation
No member of our Compensation Committee is or has been one of our officers or employees, and none has any relationships with us of the type that is required to be disclosed under Item 404 of Regulation S-K. None of our executive officers serves or has served as a member of the board of directors, compensation committee or other board committee performing equivalent functions of any entity that has one or more executive officers serving as one of our directors or on our Compensation Committee.
Code of Business Conduct and Ethics
We have adopted a code of business conduct and ethics that applies to all of our directors, officers and employees, including our principal executive officer, principal financial officer and principal accounting officer. The code of business conduct and ethics is posted on www.DuckCreek.com. If we make any substantive amendments to, or grant any waivers from, the code of business conduct and ethics for our principal executive officer, principal financial officer, principal accounting officer or persons performing similar functions, or any officer or director, we will disclose the nature of such amendment or waiver on our website or in a current report on Form 8-K.
Family Relationships
Other than Charles Moran and his son-in-law, Eugene Van Biert Jr., there are no family relationships among any of our directors or executive officers.
Item 11. Executive Compensation.
This section sets forth the compensation of our named executive officers (“NEOs”) for the fiscal year ended August 31, 2020. Our NEOs for the fiscal year ended August 31, 2020, which consist of our Chief Executive Officer and our two other most highly compensated executive officers who were serving as executive officers as of August 31, 2020, are as follows:
|
|
o |
Michael A. Jackowski, Chief Executive Officer |
|
|
o |
Vincent Chippari, Chief Financial Officer |
|
|
o |
Matthew R. Foster, Chief Operating Officer |
|
|
o |
Summary compensation table |
120
The following table summarizes the total compensation paid to or earned by each of our NEOs in fiscal year 2020.
|
Name and Principal Position |
Year |
Salary ($) |
Bonus ($) |
Stock Awards ($)(1) |
Option Awards ($)(1) |
Non-Equity Incentive Plan Compensation ($)(2) |
All other Compensation ($)(3) |
Total ($) |
|
Michael A. Jackowski, Chief Executive Officer |
2020 |
668,211 |
— |
2,683,989 |
1,365,998 |
436,150 |
17,946 |
5,172,294 |
|
2019 |
655,416 |
— |
— |
— |
290,880 |
17,646 |
963,996 |
|
|
Vincent Chippari, Chief Financial Officer |
2020 |
401, 232 |
200,000(4) |
1,050,651 |
764,957 |
262,665 |
17,946 |
2,697,451 |
|
2019 |
387,783 |
— |
— |
— |
194,737 |
17,646 |
600,166 |
|
|
Matthew Foster Chief Operating Officer |
2020 |
445,977 |
— |
1,030,860 |
764,957 |
256,376 |
17,946 |
2,516,116 |
|
2019 |
435,663 |
— |
— |
— |
166,813 |
17,646 |
620,122 |
|
|
(1) |
The amounts reported in these columns constitute the aggregate grant date fair value of each stock award or option award, as applicable, calculated in accordance with FASB ASC Topic 718. For a summary of the assumptions made in the valuation of these awards, please see Note 16 to our Consolidated Financial Statements included in this Annual Report on Form 10-K. |
|
|
(2) |
The 2020 amounts reported in this column represent the annual performance-based cash bonus earned by the NEO with respect to fiscal year 2020 performance. For more information relating to these bonuses, see the section entitled “Overview of Our 2020 Executive Compensation Program—Elements of Compensation—Annual Cash Incentive Plan,” below. |
|
|
(3) |
The 2020 amounts reported in this column represent a 401(k) matching contribution of $17,100 and $846 in life insurance premiums paid by the Company for each of our NEOs. |
|
|
(4) |
Represents a discretionary bonus paid to Mr. Chippari, as described in greater detail in the section entitled “Overview of Our 2020 Executive Compensation Program—Elements of Compensation—Annual Cash Incentive Plan,” below. |
Overview of Our 2020 Executive Compensation Program
Elements of Compensation
Base Salary
Each of our NEOs received a fixed base salary in an amount determined in accordance with the executive’s employment agreement. The base salary payable to each NEO is intended to provide a fixed component of compensation reflecting the executive’s skill set, experience, role and responsibilities. Each NEO’s base salary for fiscal year 2020 is listed in the “Summary Compensation Table,” above.
Annual Cash Incentive Plan
121
Each of our NEOs is entitled to receive an annual cash incentive bonus based on achievement of performance goals established by our board of directors. For each fiscal year, our board of directors determines the annual amount of an annual bonus pool, which is used to determine the annual cash incentive bonus that each of our NEOs receives. Annual cash incentive bonuses are designed to motivate our executive officers to meet our strategic business and financial objectives generally and our annual financial performance targets in particular. We anticipate continuing to provide our NEOs with an opportunity to earn an annual cash incentive bonus, based on individual and company goals, upon completion of this offering. For information regarding the bonus target amounts applicable to our NEOs, see the section entitled “Employment Agreements with our NEOs” below.
In addition to an annual cash incentive bonus, Mr. Chippari also received a discretionary bonus of $200,000 upon the completion of a sale of Class E Preferred Units in a private placement prior to the time of the IPO.
Equity Incentive Plan
As part of the Reorganizations Transactions, the Company adopted the Duck Creek Technologies, Inc. 2020 Omnibus Incentive Plan (the “Plan”) to provide additional incentives to selected officers, employees, non-employee directors, independent contractors and consultants, to strengthen their commitment to the Company and to attract and retain competent and dedicated persons wo are essential to the success of the Company’s business. The maximum number of shares of the Company’s common stock reserved for issuance under the Plan is 18,000,000 shares. This reserve will automatically increase on January 1st of each calendar year, prior to the tenth anniversary of the effective date of the Plan, by an amount equal to the lesser of (i) 4% of the number of shares of common stock issued and outstanding on December 31st of the preceding year and (ii) an amount determined by the Plan administrator. The shares available for issuance are subject to adjustment in the event of a stock split, stock dividend or other defined changes in the Company’s capitalization.
Class D Unit Conversion and Stock Option Grant
Prior to the IPO, our NEOs held Class D Units of Duck Creek Technologies LLC, the predecessor of the Company, which were “profits interests” for U.S. federal income tax purposes and entitled the holder to participate in the future appreciation of Duck Creek Technologies, LLC from and after the date of grant of the applicable Class D Unit. The Class D Units were subject to certain performance-based vesting requirements based on a return received by Apax equal to one to four times their investment in Duck Creek Technologies LLC. Fifty percent of the Class D Units also vested based on each NEO’s continued employment with the Company in equal quarterly installments over a four-year period beginning on August 1, 2016 for Michael Jackowski and Matthew Foster and September 19, 2016 for Vincent Chippari. The remaining fifty percent vested based on each NEO’s continued employment with the Company through the date on which the performance-based vesting requirements were met.
At the time of the IPO, all Class D Units, including those held by our NEOs, were converted into restricted stock awards of the Company based on the implied fair market value of the Class D Units at the IPO price. The restricted stock awards were granted pursuant to the terms of the Plan and remained subject to the same service-based and performance-based vesting requirements that applied to the Class D Units. As a result of the IPO and the Reorganization Transactions, the performance-based vesting requirements relating to certain restricted stock awards were met and such awards vested and became unrestricted common stock of the Company. The remaining unvested awards held by our NEOs as of the end of the 2020 fiscal year are set forth in the “Outstanding Equity Awards at Fiscal Year End for 2020” table below.
At the time of the IPO, holders of Class D Units, including our NEOs, also received a number of stock options to acquire common stock of the Company under the Plan. The number of stock options received by each holder of Class D Units was the amount necessary to preserve such holder’s share of appreciation in the Company. The stock options are subject to the same service-based and performance-based vesting requirements that applied to the Class D Units. The number of stock options held by our NEOs as of the end of the 2020 fiscal year is set forth in the “Outstanding Equity Awards at Fiscal Year End for 2020” table below.
Grant of New Restricted Stock Awards
122
At the time of the IPO, certain of our employees, including our NEOs, received an additional grant of restricted stock awards under the Plan. The new restricted stock awards vest in equal annual installments over four years following the grant date. The number of new restricted stock awards held by our NEOs as of the end of the 2020 fiscal year is set forth in the “Outstanding Equity Awards at Fiscal Year End for 2020” table below.
Employment Agreements with our Named Executive Officers
Each of our NEOs is a party to a written employment arrangement. The material terms of each of those arrangements is described below. For a description of the compensation actually paid to the NEOs for fiscal year 2020, please refer to the “Summary Compensation Table,” above.
Each of our NEOs has also entered into a restrictive covenants agreement with Duck Creek Technologies LLC, which provides that, during the course of each NEO’s employment and for the one-year period following termination of his employment for any reason, each NEO will not compete with, or solicit any vendors, customers, suppliers, employees, consultants or agents of, Duck Creek Technologies LLC or its affiliates. The restrictive covenants agreement further provides that each NEO may not disclose any proprietary, trade secret or confidential information involving Duck Creek Technologies LLC or its affiliates and will assign all applicable intellectual property rights to them.
Employment Agreement with Michael Jackowski
Mr. Jackowski and Duck Creek Technologies LLC, the predecessor of the Company, entered into an employment agreement on August 1, 2016. Mr. Jackowski’s agreement provides that he will serve as Chief Executive Officer and President of Duck Creek Technologies LLC. Pursuant to the agreement, Mr. Jackowski is entitled to receive an initial annual base salary of $648,145, subject to increase, and is eligible to receive an annual cash bonus with a target amount of 50% of his then-current base salary (up to a maximum of 100%), based on the achievement of predetermined and reasonably attainable performance goals. The agreement provides Mr. Jackowski with a group life insurance policy in the amount of $1.5 million. Mr. Jackowski is also eligible to receive employee health and welfare benefits that are no less favorable than those provided to senior executive officers generally.
The agreement provides that if Mr. Jackowski’s employment is terminated by the employer without “cause” (as defined in the agreement) or by Mr. Jackowski for “good reason” (as described below), and Mr. Jackowski executes a general release of claims, then he will receive (i) an amount equal to the sum of his then-current annual base salary and target annual bonus, payable in 12 equal monthly installments following the date of termination (or in a lump sum if such termination takes place within one year following a “change of control,” as defined in the agreement), (ii) a pro-rated annual incentive bonus for the year of termination, payable based on actual performance at the same time that such bonuses are paid to other senior executives with respect to the year of termination (the “Pro-Rated Bonus”), (iii) reimbursement of the employer contributions for 12 months of continued health coverage costs payable in four quarterly installments following the termination date (“Continued Medical Coverage”) and (iv) 12 months of outplacement services not to exceed $20,000. If Mr. Jackowski’s employment is terminated due to his death or disability he will receive the Pro-Rated Bonus and Continued Medical Coverage. For purposes of the agreement, “good reason” means, in summary, (a) a material reduction in Mr. Jackowski’s title, duties, authorities and responsibilities measured in the aggregate, (b) a material reduction of his annual base salary or target bonus opportunity as a percentage of base salary, (c) relocation of his primary work location from the Chicago, Illinois metropolitan area or (d) a failure by a successor of Duck Creek Technologies LLC to assume the employment agreement, in each case subject to written notice and an opportunity by Duck Creek Technologies LLC to cure any event which constitutes good reason.
Employment Agreement with Vincent Chippari
Mr. Chippari and Duck Creek Technologies LLC, the predecessor of the Company, entered into an employment agreement on September 19, 2016. Mr. Chippari’s agreement provides that he will serve as Chief Financial Officer of Duck Creek Technologies LLC. Pursuant to the agreement, Mr. Chippari is entitled to receive an initial annual base salary of $370,000, subject to increase, and is eligible to receive an annual cash bonus with a target amount of 50% of his then-current base salary (up to a maximum of 100%), based on the achievement of
123
predetermined and reasonably attainable performance goals. Mr. Chippari is also eligible to receive employee health and welfare benefits that are no less favorable than those provided to senior executive officers generally.
The agreement provides that if Mr. Chippari’s employment is terminated by the employer without “cause” (as defined in the agreement) or by Mr. Chippari for “good reason” (as described below), and Mr. Chippari executes a general release of claims, then he will receive (i) continued payments of his then-current annual base salary for 12 months following the date of termination (or in a lump sum if such termination takes place within one year following a “change of control,” as defined in the agreement), (ii) a pro-rated annual incentive bonus for the year of termination, payable based on actual performance at the same time that such bonuses are paid to other senior executives with respect to the year of termination and (iii) a payment of $12,000 in lieu of continued contributions towards health coverage costs (“Health Coverage Payment”). If Mr. Chippari’s employment is terminated due to his death or disability he will receive the Health Coverage Payment. For purposes of the agreement, “good reason” means, in summary, (a) a reduction of his annual base salary or target bonus opportunity as a percentage of base salary, other than a reduction not greater than 10% that applies to all senior executives, (b) a material diminution in his duties or responsibilities as Chief Financial Officer, (c) a change in the his reporting structure that results in him no longer directly reporting to the Chief Executive Officer, (d) a relocation of his primary place of business to a location that is more than 50 miles outside of Boston, Massachusetts or (e) a failure by a successor of Duck Creek Technologies LLC to assume the employment agreement, in each case subject to written notice and an opportunity by Duck Creek Technologies LLC to cure any event which constitutes good reason.
Employment Agreement with Matthew Foster
Mr. Foster and Duck Creek Technologies LLC, the predecessor of the Company, entered into an employment agreement on August 1, 2016. Mr. Foster’s agreement provides that he will serve as Chief Operating Officer of Duck Creek Technologies LLC. Pursuant to the agreement, Mr. Foster is entitled to receive an initial annual base salary of $430,817, subject to increase, and is eligible to receive an annual cash bonus with a target amount of 40% of his then-current base salary (up to a maximum of 80%), based on the achievement of predetermined and reasonably attainable performance goals. The agreement provides Mr. Foster with a group life insurance policy in the amount of $1.5 million. Mr. Foster is also eligible to receive employee health and welfare benefits that are no less favorable than those provided to senior executive officers generally.
The agreement provides that if Mr. Foster’s employment is terminated by the employer without “cause” (as defined in the agreement) or by Mr. Foster for “good reason” (as described below), and Mr. Foster executes a general release of claims, then he will receive (i) continued payments of his then-current annual base salary for 6 months following the date of termination (or in a lump sum if such termination takes place within one year following a “change of control,” as defined in the agreement), (ii) a pro-rated annual incentive bonus for the year of termination, payable based on actual performance at the same time that such bonuses are paid to other senior executives with respect to the year of termination and (iii) the Health Coverage Payment. If Mr. Foster’s employment is terminated due to his death or disability he will receive the Health Coverage Payment. For purposes of the agreement, “good reason” means, in summary, a material reduction of Mr. Foster’s annual base salary or target bonus opportunity as a percentage of base salary, subject to written notice and an opportunity by Duck Creek Technologies LLC to cure such reduction.
Retirement and Employee Benefits
All employees are eligible to participate in broad-based and comprehensive employee benefit programs, including medical, dental, vision, life and disability insurance and a 401(k) plan with matching contributions. Our NEOs are eligible to participate in these plans on the same basis as our other employees. We do not sponsor or maintain any deferred compensation or supplemental retirement plans in addition to our 401(k) plan. The 401(k) matching contributions earned by each NEO in fiscal year 2020 are shown in the “Summary Compensation Table” under “All other Compensation”.
124
The following table summarizes the number of outstanding equity awards held by each of our NEOs as of August 31, 2020.
|
|
Option Awards |
Stock Awards |
|||||||
|
Name |
Number of Securities Underlying Unexercised Options Exercisable (#) |
Number of Securities Underlying Unexercised Options Unexercisable (#) |
Equity Incentive Plan Awards: Number of Securities Underlying Unexercised Unearned Options (#)(1) |
Option Exercise Price ($) |
Option Expiration Date |
Number of Shares or Units of Stock That Have Not Vested (#)(2) |
Market Value of Shares or Units of Stock That Have Not Vested ($)(3) |
Equity Incentive Plan Awards: Number of Unearned Shares, Units or Other Rights That Have Not Vested (#)(4) |
Equity Incentive Plan Awards: Market or Payout Value of Unearned Shares, Units or Other Rights That Have Not Vested ($)(3) |
|
|
|
|
|
|
|
|
|
|
|
|
Michael A. Jackowski
|
146,096 |
— |
36,524 |
27.00 |
08/14/2030 |
— |
— |
— |
— |
|
— |
— |
— |
— |
— |
— |
— |
251,742 |
9,815,432 |
|
|
— |
— |
— |
— |
— |
99,407 |
3,875,879 |
— |
— |
|
|
Vincent Chippari |
79,257 |
2,557(5) |
20,453 |
27.00 |
08/14/2030 |
— |
— |
— |
— |
|
— |
— |
— |
— |
— |
— |
— |
140,976 |
5,496,653 |
|
|
— |
— |
— |
— |
— |
17,622(5) |
687,081 |
— |
— |
|
|
— |
— |
— |
— |
— |
38,913 |
1,517,218 |
— |
— |
|
|
Matthew Foster |
81.814 |
— |
20,453 |
27.00 |
08/14/2030 |
— |
— |
— |
— |
|
— |
— |
— |
— |
— |
— |
— |
140,976 |
5,496,653 |
|
|
— |
— |
— |
— |
— |
38,180 |
1,488,638 |
— |
— |
|
125
|
|
(2) |
Other than with respect to 17,622 stock awards held by Mr. Chippari, the stock awards listed in this column consist of restricted stock awards that will vest in equal annual installments on each of the first four anniversaries of August 14, 2020. |
|
|
(3) |
The amounts reflected in these columns reflect the market value of unvested stock awards, determined by multiplying the number of such awards by the market price of our common stock at the close of the last trading day of fiscal year 2020, which was $38.99 per share. |
|
|
(4) |
The stock awards listed in this column are subject to certain performance-based vesting requirements based on a cumulative cash return received by Apax in respect of its investment in the Company and its subsidiaries. Fifty percent of the options will vest when Apax achieves a return of three times its investment and the remaining fifty percent of the options will vest when Apax achieves a return of four times its investment, in each case subject to each NEO’s continued employment with the Company through the date on which the performance-based vesting requirements are met. |
|
|
(5) |
Represents options or stock awards, as applicable, held by Mr. Chippari that fully vested on September 19, 2020. |
|
|
• |
Potential Payments and Benefits on Termination |
Please refer to the section entitled “Employment Agreements with NEOs,” above, for a description of the severance payments and benefits to be provided to our NEOs in connection with certain qualifying terminations of their employment.
|
|
• |
Director Compensation |
|
|
• |
Director Compensation Table for 2020 |
The following table summarizes the total compensation paid to or earned by each of our non-affiliated and non-employee directors in fiscal year 2020. Our affiliated and management directors are not separately compensated by the Company for their Board service. The compensation received by our non-affiliated and non-employee directors consists of quarterly cash fees for their service on our Board and annual equity awards, as further described below.
|
Name |
|
Fees Earned or Paid in Cash ($)(1) |
|
Stock Awards ($)(2) |
|
Option Awards ($)(3) |
|
Total ($) |
|
Jason Wright |
|
— |
|
— |
|
— |
|
— |
|
Roy Mackenzie |
|
— |
|
— |
|
— |
|
— |
|
Domingo Miron |
|
— |
|
— |
|
— |
|
— |
|
Stuart David Nicoll |
|
— |
|
— |
|
— |
|
— |
|
Kathy Crusco(4) |
|
34,000 |
|
310,001 |
|
291,780 |
|
635,781 |
|
Francis Pelzer |
|
60,000 |
|
149,985 |
|
226,240 |
|
436,225 |
|
Charles Moran |
|
58,000 |
|
149,985 |
|
157,170 |
|
365,155 |
|
Larry Wilson(5) |
|
56,000 |
|
149,985 |
|
157,170 |
|
363,155 |
126
|
|
(1) |
Amounts in this column reflect the cash compensation earned by our non-affiliated and non-employee directors in fiscal year 2020. |
|
|
(2) |
The amounts reported in this column constitute the aggregate grant date fair value of each stock award calculated in accordance with FASB ASC Topic 718. For a summary of the assumptions made in the valuation of these awards, please see Note 16 to our Consolidated Financial Statements included in this Annual Report on Form 10-K. The amounts in this column represent (i) the grant date fair value of $149,985 with respect to 5,555 restricted stock awards granted to each non-affiliated and non-employee director on August 14, 2020, which vest in full on the first anniversary of the grant date and (ii) for Ms. Crusco, the grant date fair value of $160,016 with respect to 300,000 Class D Units in connection with her appointment as a director prior to the IPO. At the time of the IPO, all Class D Units, including those held by our non-affiliated and non-employee directors, were converted into restricted stock awards of the Company based on the implied fair market value of the Class D Units at the IPO price, as described in more detail in the section entitled “Overview of Our 2020 Executive Compensation Program—Elements of Compensation—Class D Unit Conversion and Stock Option Grant,” above. As of August 31, 2020, our directors held the following number of outstanding stock awards: Kathy Crusco: 35,915; Francis Pelzer: 98,774; Charles Moran: 34,520; and Larry Wilson: 34,520. |
|
|
(3) |
The amounts reported in this column constitute the aggregate grant date fair value of each option award calculated in accordance with FASB ASC Topic 718. For a summary of the assumptions made in the valuation of these awards, please see Note 16 to our Consolidated Financial Statements included in this Annual Report on Form 10-K. The amounts in this column represent stock option grants that holders of Class D Units, including our non-affiliated and non-employee directors, received at the time of the IPO, as described in more detail in the section entitled “Overview of Our 2020 Executive Compensation Program—Elements of Compensation—Class D Unit Conversion and Stock Option Grant,” above. As of August 31, 2020, our directors held the following number of outstanding option awards, each with an exercise price per share of $27.00: Kathy Crusco: 39,008; Francis Pelzer: 30,246; Charles Moran: 21,012; and Larry Wilson: 21,012. |
|
|
(4) |
Ms. Crusco was appointed as a director on February 11, 2020. |
Pursuant to the director compensation policy that we adopted at the time of the IPO, each of our non-affiliated and non-employee directors is eligible to receive the following compensation for service on our board of directors:
|
|
• |
|
an annual cash retainer in the amount of $40,000, paid quarterly in arrears; |
|
|
• |
|
for the chairman of the audit committee, an additional annual cash retainer in the amount of $20,000; |
|
|
• |
|
for the chairman of the compensation committee, an additional annual cash retainer in the amount of $12,000; |
|
|
• |
|
for the chairman of the nominating and corporate governance committee, an additional annual cash retainer in the amount of $8,000; |
|
|
• |
|
for any member of a committee of our board of directors (not including the chairman), an additional cash retainer in the amount of $10,000, $6,000 and $4,000 for each of the audit committee, compensation committee and nominating and corporate governance committee, respectively; |
127
|
• |
|
an annual equity award in the form of service-based restricted stock, with a grant date fair market value of $150,000, vesting in full on the first anniversary of the date of grant; and |
|
|
• |
|
reimbursement for all reasonable out-of-pocket expenses incurred in connection with service on our board of directors (including affiliated and employee directors). |
Item 12. Security Ownership of Certain Beneficial Owners and Management and Related Stockholder Matters.
The following table sets forth information with respect to the beneficial ownership of our common stock:
|
|
• |
each person known by us to beneficially own more than 5% of our common stock; |
|
|
• |
each of our directors; |
|
|
• |
each of our NEOs; and |
|
|
• |
all of our executive officers and directors as a group. |
The number of shares of common stock outstanding and the corresponding percentage of beneficial ownership are based on the number of shares of common stock outstanding as of October 31, 2020, which for purposes of the table below includes any shares of unvested restricted stock that are held by such individual or entity over which such individual or entity has voting rights.
128
The number of shares beneficially owned by each stockholder is determined under rules issued by the SEC and includes voting or investment power with respect to securities. Under these rules, beneficial ownership includes any shares as to which the individual or entity has sole or shared voting power or investment power. In computing the number of shares beneficially owned by an individual or entity and the percentage ownership of that person, shares of common stock subject to equity awards or other rights held by such person that are currently exercisable or will become exercisable within 60 days after October 31, 2020, are considered outstanding, although these shares are not considered outstanding for purposes of computing the percentage ownership of any other person. Each of the stockholders listed has sole voting and investment power with respect to the shares beneficially owned by the stockholder unless noted otherwise, subject to community property laws where applicable.
|
Name of beneficial owner3 |
|
Number of outstanding shares beneficially owned |
|
|
Percentage of beneficial ownership |
|
||
|
5% Stockholders |
|
|
|
|
|
|
|
|
|
Apax (1) |
|
|
43,282,952 |
|
|
|
33.1 |
% |
|
Accenture (2) |
|
|
28,855,302 |
|
|
|
22.1 |
% |
|
Kayne Anderson Rudnick Investment Management, LLC (3) |
|
|
9,488,147 |
|
|
|
7.4 |
% |
|
NEOs and Directors |
|
|
|
|
|
|
|
|
|
Michael Jackowski (4) |
|
|
1,800,504 |
|
|
|
1.3 |
% |
|
Vincent Chippari (5) |
|
|
837,832 |
|
|
* |
|
|
|
Matthew Foster (6) |
|
|
974,849 |
|
|
* |
|
|
|
Kathy Crusco (7) |
|
|
56,816 |
|
|
* |
|
|
|
Roy Mackenzie |
|
|
— |
|
|
|
— |
|
|
Domingo Miron |
|
|
— |
|
|
|
— |
|
|
Charles Moran (8) |
|
|
182,491 |
|
|
* |
|
|
|
Stuart Nicoll (9) |
|
|
12,000 |
|
|
* |
|
|
|
Francis Pelzer (10) |
|
|
164,378 |
|
|
* |
|
|
|
Larry Wilson (11) |
|
|
169,291 |
|
|
* |
|
|
|
Jason Wright |
|
|
— |
|
|
|
— |
|
|
All executive officers and directors as a group (15 persons) |
|
|
5,771,676 |
|
|
|
4.3 |
% |
|
* |
Represents beneficial ownership of less than 1%. |
|
(1) |
Represents shares of common stock held by Disco (Guernsey) Holdings L.P. Inc., Disco (Guernsey) GP Co. Limited is the general partner of Disco (Guernsey) Holdings L.P. Inc., and Apax VIII GP Co. Limited holds all the ordinary shares of Disco (Guernsey) GP Co. Limited. The registered address for Apax VIII GP Co. Limited is Third Floor Royal Bank Place, 1 Glategny Esplanade, St Peter Port, Guernsey GY1 2HJ. The registered address for each of Disco (Guernsey) Holdings L.P., Inc. and Disco (Guernsey) GP Co. Limited is PO Box 656, East Wing, Trafalgar Court, Les Banques, St Peter Port, Guernsey GY1 3PP.Does not include shares of common stock held by other stockholders that are subject to the Stockholders’ Agreement. |
|
(2) |
Consists of 10,716,262 shares of common stock held by Accenture LLP (the “Accenture LLP Shares”) and 18,139,040 shares of common stock held by Accenture Holdings BV (the “Accenture Holdings BV Shares”), each of which is an indirect wholly-owned subsidiary of Accenture plc. As a result of such ownership, Accenture plc may be deemed to beneficially own and have shared voting power and shared dispositive power with respect to all such shares. Accenture LLP expressly disclaims ownership of the Accenture Holdings BV Shares and Accenture Holdings BV expressly disclaims ownership of the Accenture LLP Shares. The address for Accenture LLP is c/o Accenture LLP, 161 North Clark Street, Chicago, Illinois, 60601. The address for Accenture Holdings BV is c/o Accenture Holdings BV, Gustav Mahlerplein 90, 1082MA, Amsterdam, Netherlands. The address for Accenture plc is 1 Grand Canal Square, Grand Canal Harbour, Dublin 2, Ireland. Does not include shares of common stock held by other stockholders that are subject to the Stockholders’ Agreement. |
129
|
(4) |
Consists of (i) 1,636,146 shares of common stock, including restricted stock, held by Mr. Jackowski and (ii) 164,358 shares of common stock subject to options held by Mr. Jackowski that are exercisable within 60 days of October 31, 2020. |
|
(5) |
Consists of (i) 745,792 shares of common stock, including restricted stock, held by Mr. Chippari and (ii) 92,040 shares of common stock subject to options held by Mr. Chippari that are exercisable within 60 days of October 31, 2020. |
|
(6) |
Consists of (i) 882,809 shares of common stock, including restricted stock, held by Mr. Foster and (ii) 92,040 shares of common stock subject to options held by Mr. Foster that are exercisable within 60 days of October 31, 2020. |
|
(7) |
Consists of (i) 49,502 shares of common stock, including restricted stock, held by Ms. Crusco and (ii) 7,314 shares of common stock subject to options held by Ms. Crusco that are exercisable within 60 days of October 31, 2020. |
|
(8) |
Consists of (i) 163,580 shares of common stock, including restricted stock, held by Mr. Moran and (ii) 18,911 shares of common stock subject to options held by Mr. Moran that are exercisable within 60 days of October 31, 2020. |
|
(9) |
Consists of 12,000 shares of common stock, including restricted stock, held by Mr. Nicoll. |
|
(10) |
Consists of (i) 151,146 shares of common stock, including restricted stock, held by Mr. Pelzer and (ii) 13,232 shares of common stock subject to options held by Mr. Pelzer that are exercisable within 60 days of October 31, 2020. |
|
(11) |
Consists of (i) 150,380 shares of common stock, including restricted stock, held by Mr. Wilson and (ii) 18,911 shares of common stock subject to options held by Mr. Wilson that are exercisable within 60 days of October 31, 2020. |
Equity Compensation Plan Information
The following table provides information about our common stock that may be issued upon the exercise of options, warrants and rights under the Duck Creek Technologies, Inc. 2020 Omnibus Incentive Plan, which is our only equity compensation plan as of August 31, 2020. A description of the material terms of such plan are set forth
130
in Note 16 of “Item 8. Financial Statements and Supplementary Data” of this Annual Report on Form 10-K which is incorporated into this item by reference.
|
Plan Category |
|
Number of Securities to be Issued upon Exercise of Outstanding Options, Warrants and Rights |
|
|
Weighted-Average Exercise Price of Outstanding Options, Warrants and Rights |
|
|
Number of Securities Remaining Available for Future Issuance under Equity Compensation Plans 1 |
|
|||
|
|
|
(in thousands, except per share amount) |
|
|||||||||
|
Equity Compensation Plans Not Approved by Security Holders: |
|
|
|
|
|
|
|
|
|
|
|
|
|
2020 Omnibus Incentive Plan |
|
|
1,802,216 |
|
|
$ |
27.00 |
|
|
|
5,453,069 |
|
|
|
(1) |
The amount set forth in this column reflects the number of securities remaining available for issuance under the Duck Creek Technologies, Inc. 2020 Omnibus Incentive Plan. This reserve will automatically increase on January 1st of each calendar year, prior to the tenth anniversary of the effective date of the 2020 Omnibus Incentive Plan, by an amount equal to the lesser of (i) 4% of the number of shares of common stock issued and outstanding on December 31st of the preceding year and (ii) an amount determined by the plan administrator. |
Item 13. Certain Relationships and Related Transactions, and Director Independence.
In addition to the director and executive officer compensation arrangements discussed above in the section entitled “Executive Compensation,” this section describes transactions, or series of related transactions, since August 31, 2019 to which we were a party or will be a party, in which:
|
|
• |
the amount involved exceeded or will exceed $120,000; and |
|
|
• |
any of our directors, executive officers or beneficial owners of more than 5% of any class of our capital stock (each, a “5% Holder”), or any members of the immediate family of and any entity affiliated with any such person, had or will have a direct or indirect material interest. |
Stockholders’ Agreement
We are party to the Stockholders’ Agreement, dated as of August 14, 2020, among us, Apax and Accenture (the “Stockholders’ Agreement”). The Stockholders’ Agreement governs the relationship between us and Apax and Accenture, including matters related to our corporate governance, rights to designate directors and additional matters.
The Stockholders’ Agreement provides that for so long as Apax owns at least 40% of the outstanding equity securities of the Company that are not shares of our common stock awarded under the 2020 Omnibus Incentive Plan or other incentive equity plan, Apax is entitled to designate three directors for election to our board of directors; for so long as Apax owns at least 20% but less than 40% of the outstanding equity securities of the Company that are not shares of our common stock awarded under the 2020 Omnibus Incentive Plan or other incentive equity plan, Apax is entitled to designate two directors for election to our board of directors; and for so long as Apax owns at least 10% but less 20% of the outstanding equity securities of the Company that are not shares of our common stock awarded under the 2020 Omnibus Incentive Plan or other incentive equity plan, Apax is entitled to designate one director for election to our board of directors. The Stockholders’ Agreement also provides that for so long as Accenture owns at least 20% of the outstanding equity securities of the Company that are not shares of our common stock awarded under the 2020 Omnibus Incentive Plan or other incentive equity plan, Accenture is entitled to designate two directors for election to our board of directors; and for so long as Accenture owns at least 10% but less than 20% of the outstanding securities of the Company that are not shares of our common stock awarded under
131
the 2020 Omnibus Incentive Plan or other incentive equity plan, Accenture is entitled to designate one director for election to our board of directors.
Pursuant to the Stockholders’ Agreement, the Company will use its best efforts to cause the election of the slate of nominees recommended by our board of directors which, subject to the fiduciary duties of the directors, will include the persons designated by Accenture and Apax in accordance with the Stockholders’ Agreement.
At the current ownership levels, Apax is entitled to designate two directors and Accenture is entitled to designate two directors for election to our board of directors. Jason Wright and Roy Mackenzie currently serve on our board of directors as the designees of Apax; and Stuart Nicoll and Domingo Miron currently serves on our board of directors as the designee of Accenture. The size of our board of directors is currently nine directors. In the event that an Apax designee or Accenture designee ceases to serve as a director, Apax or Accenture, as applicable, will be entitled to designate another nominee to fill the resulting vacancy.
Additionally, the Stockholders’ Agreement provides for certain consent rights for each of Apax and Accenture so long as such stockholder owns at least 5% of the outstanding equity securities of the Company that are not shares of our common stock awarded under the 2020 Omnibus Incentive Plan or other incentive equity plan, including for any increase to the size of our board of directors.
The Stockholders’ Agreement terminates as it relates to each stockholder at such time as such stockholder ceases to own any equity securities of the Company, except for the rights that will survive cessation of ownership of equity securities, including the rights of Apax and Accenture under the Registration Rights Agreement. For a description of the Registration Rights Agreement, see the section entitled “Registration Rights Agreement” below.
On August 18, 2020, we entered into an amended and restated Restrictive Covenants Side Letter with Apax and Accenture which includes certain non-compete provisions, and restrictions on the solicitation and hiring of another party’s employees binding on each of the Company, Apax and Accenture through the earlier of August 1, 2021 and such time that Accenture owns less than 10% of the outstanding equity securities of the Company that are not shares of our common stock awarded under the 2020 Omnibus Incentive Plan or other incentive equity plan.
Registration Rights Agreement
We are party to that certain registration rights agreement, dated as of August 18, 2020 (the “Registration Rights Agreement”), with Apax, Accenture and certain of our other pre-IPO Investors in respect of the shares of common stock held by such holders following the IPO. The registration rights agreement provides these holders (and their permitted transferees) with the right to require us, at our expense, to register shares of our common stock that they hold (which may be fulfilled through a repurchase of such holder’s requested shares with the proceeds of a new issuance of shares). The agreement also provides that we will pay certain expenses of these electing holders relating to such registrations and indemnify them against certain liabilities that may arise under the Securities Act. The following description summarizes such rights and circumstances.
Demand Rights / Shelf Registration Rights
Subject to certain limitations, each of Apax and Accenture (each a “demand holder”) has the right, by delivering written notice to us, to require us to register the number of our shares of common stock requested to be so registered in accordance with the registration rights agreement. We will notify the other demand holder within ten business days following receipt of notice of a demand registration from either Apax or Accenture. We will include in the registration all securities with respect to which we receive a written request for inclusion in the registration within ten business days after we give our notice. Following the demand request, we are required to use our reasonable best efforts to have the applicable registration statement filed with the SEC within a specified period following the demand and are required to use our best efforts to cause the registration statement to be declared effective.
Each demand holder has unlimited demand rights until such time as that demand holder owns less than 40% of our outstanding shares of common stock and owns fewer shares of common stock than the other demand holder. Following such date, such demand holder will be limited to an aggregate of two demand registrations.
132
We are not required to effect (i) any demand registration prior to the February 9, 2021 expiration date of the 180-day lockup period following the IPO, or (ii) more than one demand registration in any 90-day period following the effectiveness period of the previous demand registration statement, where the effectiveness period is the shorter of 180 days following the effective date of such registration statement and the period when all registrable securities covered thereunder are sold.
In addition, if we are eligible to file a shelf registration statement on Form S-3, each of Apax and Accenture can request that we register their shares for resale on such shelf registration statement or prospectus supplement to a previously filed shelf registration statement.
Piggyback Rights
Holders of registrable shares of common stock under the registration rights agreement are entitled to request to participate in, or “piggyback” on, registrations of certain securities for sale by us at any time following February 9, 2021. This piggyback right applies to any registration following February 9, 2021 other than registration statements on Form S-4 or S-8 (or any similar successor forms used for a purpose similar to the intended use of such forms) or a resale shelf registration statement on Form S-3.
Conditions and Limitations
The registration rights outlined above are subject to conditions and limitations, including the right of the underwriters to limit the number of shares included in a registration statement and our right to delay, suspend or withdraw a registration statement under specified circumstances. For example, we may delay the filing or effectiveness of any registration statement for an aggregate period of no more than 90 days in any calendar year if we determine, in good faith, that the filing or maintenance of a registration statement would, if not so deferred, materially and adversely affect a then proposed or pending significant business transaction, financial project, acquisition, merger or corporate reorganization. Additionally, in certain circumstances we may withdraw a registration statement upon request by the holder(s) of registrable securities.
Ongoing Relationship with Accenture
We continue to partner with Accenture as a SI that provides implementation and other related services to our customers. For the fiscal year ended August 31, 2020, we spent $0.2 million, with Accenture as an SI. Additionally, we provide certain professional services, software maintenance services and SaaS solutions to end customers as a subcontractor for Accenture in connection with the master reciprocal subcontractor agreement, entered into by and between us and Accenture in connection with the carve-out. For the fiscal year ended August 31, 2020, we recognized revenue of $2.2 million, relating to services performed in this subcontractor capacity.
Sale of Class E Preferred Units
On November 13, 2019, Disco Topco Holdings (Cayman), L.P., our predecessor prior to the Reorganization Transactions (as defined below) (the “Operating Partnership”), issued and sold 31,059,222 Class E Preferred Units of the Operating Partnership (“Class E Preferred Units”) to certain unrelated third party accredited investors in a private offering for $90.0 million, at a purchase price of $2.8977 per unit. The price per unit of each Class E Preferred Unit was based on arm’s-length negotiations with the third party investors. The Operating Partnership used $72.0 million of such proceeds from the sale to redeem 14,908,429 Class A Units of the Operating Partnership (“Class A Units”) and 9,938,949 Class B Units of the Operating Partnership (“Class B Units”) held by Apax and Accenture, respectively, at a purchase price of $2.8977 per unit, the same price per unit as the purchase price paid by the third party investors for the Class E Preferred Units.
On November 27, 2019, the Operating Partnership issued and sold 10,353,074 Class E Preferred Units to an unrelated third party accredited investor in a private offering for $30.0 million, at a purchase price of $2.8977 per unit. The price per unit of each Class E Preferred Unit was based on arm’s-length negotiations with the third party investor. On November 29, 2019, the Operating Partnership used $26.0 million of such proceeds from the sale to redeem 5,383,600 Class A Units and 3,589,064 Class B Units from Apax and Accenture, respectively, at a purchase
133
price of $2.8977 per unit, the same price per unit as the purchase price paid by the third party investor for the Class E Preferred Units.
On February 18, 2020, the Operating Partnership issued and sold 27,199,913 Class E Preferred Units to certain unrelated third party accredited investors in a private offering for $90.0 million, at a purchase price of $3.3088 per unit. The price per unit was based on arm’s-length negotiations with the third party investors.
On February 26, 2020, the Operating Partnership issued and sold 3,022,213 Class E Preferred Units to an unrelated third party accredited investor in a private offering for $10.0 million, at a purchase price of 3.3088 per unit. The price per unit was based on arm’s-length negotiations with the third party investors. On February 27, 2020, the Operating Partnership used $100.0 million of the proceeds from the sales on February 18, 2020 and February 26, 2020 to redeem 18,133,278 Class A Units and 12,088,848 Class B Units from Apax and Accenture, respectively, at a purchase price of $3.3088 per unit, the same price per unit as the purchase price paid by the third party investors for the Class E Preferred Units.
On June 5, 2020, the Operating Partnership issued and sold 50,603,459 Class E Preferred Units to certain accredited investors, including funds managed by Kayne Anderson Rudnick Investment Management, LLC, in a private offering for $200.0 million, at a purchase price of $3.9523 per unit. The price per unit was based on arm’s-length negotiations with the third party investors.
On June 8, 2020, the Operating Partnership issued and sold 7,590,517 Class E Preferred Units to an accredited investor in a private offering for $30.0 million, at a purchase price of $3.9523 per unit. The price per unit was based on arm’s-length negotiations with the third party investors. On June 8, 2020, the Operating Partnership used $200.0 million of the proceeds from the sales on June 5, 2020 and June 8, 2020 to redeem 30,362,073 Class A Units and 20,241,374 Class B Units from Apax and Accenture, respectively, at a purchase price of $3.9523 per unit, the same price per unit as the purchase price paid by the third party investors for the Class E Preferred Units.
The Reorganization Transactions
In connection with the various reorganization transactions that occurred concurrently with the IPO (the “Reorganization Transactions”), Apax received 45,838,508 shares of newly-issued common stock in the Company in exchange for its ownership interest in our pre-IPO company. Accenture contributed to the Company a portion of its equity interests in the Operating Partnership and all of its interests in the Operating Partnership’s general partner in exchange for newly-issued common stock in the Company. Certain members of management contributed to the Company, directly or indirectly, all of their respective equity interests in the Operating Partnership in exchange for (i) newly-issued common stock in the Company or (ii) restricted common stock in the Company and options to acquire common stock in the Company with an exercise price equal to the fair market value on the date of grant. Each of the other pre-IPO Investors (other than Apax, Accenture and another third party investor) contributed limited partnership units (“LP Units”) in the Operating Partnership to the Company in exchange for shares of newly-issued common stock. In connection with the Reorganization Transactions, Accenture contributed 115,421,206 LP Units in the Operating Partnership to the Company; Michael Jackowski, our Chief Executive Officer, contributed 6,956,715 LP Units in the Operating Partnership to the Company; Vincent Chippari, our Chief Financial Officer, contributed 3,285,301 LP Units in the Operating Partnership to the Company; and Matthew Foster, our Chief Operating Officer, contributed 3,785,301 LP Units in the Operating Partnership to the Company. Accenture retained 6,814,815 LP Units in the Operating Partnership that were repurchased using a portion of the proceeds from the IPO.
We used a portion of the net proceeds that we received from the IPO to repurchase from Apax 2,555,556 shares of common stock received by Apax in the Reorganization Transactions at a repurchase price equal to the price per share of common stock sold to the public in the IPO, less the applicable underwriting discounts and commissions. We contributed a portion of the net proceeds that we received from the IPO to the Operating Partnership, which the Operating Partnership used to redeem the remaining LP Units owned by Accenture at a redemption price per unit equal to the price per share of common stock sold to the public in the IPO, less the applicable underwriting discounts and commissions. One of our directors, Larry Wilson, is a limited partner in Disco (Guernsey) Holdings L.P. Inc., the shareholder of the Apax entity that held Apax’s LP Units prior to the Reorganization Transactions. Pursuant to the partnership agreement for Disco (Guernsey) Holdings L.P. Inc., Mr. Wilson was entitled to receive approximately 0.3% of any proceeds received by Disco (Guernsey) Holdings
134
L.P. Inc. from the repurchase of shares of common stock in the Company described above, following certain priority returns to Apax and Mr. Wilson. Of the $64.7 million paid by the Company to repurchase shares of common stock in the Company owned by Disco (Guernsey) Holdings L.P. Inc., Mr. Wilson received approximately $922,000 due to his limited partnership interest.
Policies and Procedures for Related Person Transactions
Our board of directors has adopted a written statement of policy regarding transactions with related persons (the “Related Person Policy”). Our Related Person Policy requires that a “related person” (as defined in paragraph (a) of Item 404 of Regulation S-K) must disclose to our General Counsel any “related person transaction” (defined as any transaction that is anticipated to be reportable by us under Item 404(a) of Regulation S-K in which we were or are to be a participant and the amount involved exceeds $120,000 and in which any related person had or will have a direct or indirect material interest) and all material facts with respect thereto. The General Counsel will then communicate that information to our audit committee, or chair thereof. No related person transaction will be executed without the approval or ratification of our board of directors or a duly authorized committee of our board of directors. It is our policy that directors interested in a related person transaction will recuse themselves from any vote on a related person transaction in which they have an interest.
135
Our board of directors has determined that Kathy Crusco, Charles Moran, Francis Pelzer and Larry Wilson are “independent directors” as defined under the listing requirements of Nasdaq. In making these determinations, our board of directors reviewed and discussed information provided by the directors and us with regard to each director’s business and personal activities and relationships as they may relate to us and our management, including the beneficial ownership of our capital stock by each non-employee director and the transactions involving them described in this section. In addition to determining whether each director satisfies the director independence requirements set forth in the listing requirements of Nasdaq, in the case of members of the audit committee and compensation committee, our board of directors will also make an affirmative determination that such members also satisfy separate independence requirements and current standards imposed by the SEC and Nasdaq regulations for audit committee members and by the SEC, Nasdaq and the IRS for compensation committee members.
Item 14. Principal Accounting Fees and Services.
Independent Registered Public Accounting Firm's Fees
The following table sets forth all fees billed for professional audit services and other services rendered by KPMG LLP for each of the years ended August 31, 2020 and 2019:
|
|
|
2020 |
|
|
2019 |
|
||
|
|
|
(in thousands) |
|
|||||
|
Audit Fees1 |
|
$ |
1,502 |
|
|
$ |
1,199 |
|
|
Audit-Related Fees |
|
|
— |
|
|
|
— |
|
|
Tax Fees |
|
|
— |
|
|
|
— |
|
|
All Other Fees |
|
|
— |
|
|
|
— |
|
|
Total |
|
$ |
1,502 |
|
|
$ |
1,199 |
|
|
|
(1) |
Relates to the audit of our annual financial statements, services rendered in connection with Form S-1 and Form S-8 filings related to our initial public offering, and statutory audits required by non-U.S. jurisdictions. |
Audit Committee Pre-Approval Policy
Our Audit Committee is responsible for approving all audit, audit-related and certain other services specified in its charter. Because our audit committee was not formed until August 7, 2020, the audit committee did not pre-approve all of the foregoing services, although any services rendered prior to the formation of our audit committee were approved by our board of directors. The Audit Committee reviews and, in its sole discretion, approves the independent auditors’ annual engagement letter, including the proposed fees contained therein, as well as all audit and all permitted non-audit engagements and relationships between the Company and such auditors. In compliance with the policies and procedures set forth in the current Audit Committee charter, the Audit Committee may, in accordance with applicable law, establish pre-approval policies and procedures for the engagement of independent auditors and any other registered public accounting firm to render services to the Company.
136
Item 15. Exhibits, Financial Statement Schedules.
(a)
|
|
1. |
Financial Statements. |
See the Index to the Consolidated Financial Statements in “Item 8. Financial Statements and Supplementary Data” of this Annual Report on Form 10-K, which is incorporated into this item by reference.
|
|
2. |
Financial Statement Schedules. |
No financial statement schedules have been submitted because they are not required or are not applicable or because the information required is included in the financial statements or the notes thereto.
|
|
3. |
List of Exhibits. |
See the Exhibit Index in Item 15(b) below, which is incorporated into this item by reference.
(b)
The exhibits listed in the following “Exhibit Index” are filed or incorporated by reference as part of this Annual Report on Form 10-K.
137
|
EXHIBIT |
|
DESCRIPTION OF EXHIBIT |
|
|
|
|
|
3.1 |
|
|
|
|
|
|
|
3.2 |
|
|
|
|
|
|
|
10.1 |
|
|
|
|
|
|
|
10.2 |
|
|
|
|
|
|
|
10.3 |
|
|
|
|
|
|
|
10.4† |
|
|
|
|
|
|
|
10.5† |
|
|
|
|
|
|
|
10.6† |
|
|
|
|
|
|
|
10.7† |
|
|
|
|
|
|
|
10.8† |
|
|
|
|
|
|
|
10.9† |
|
|
|
|
|
|
|
10.10 |
|
|
|
|
|
|
|
10.11 |
|
|
|
|
|
|
|
10.12 |
|
|
|
|
|
|
138
|
|
||
|
|
|
|
|
10.14† |
|
|
|
|
|
|
|
10.15† |
|
|
|
|
|
|
|
10.16† |
|
|
|
|
|
|
|
|
|
|
|
21.1 |
|
|
|
|
|
|
|
23.1* |
|
Consent of KPMG LLP, Independent Registered Public Accounting Firm |
|
|
|
|
|
24.1* |
|
Power of Attorney (included on signature page to this Form 10-K) |
|
|
|
|
|
31.1* |
|
|
|
|
|
|
|
31.2* |
|
|
|
|
|
|
|
32.1* |
|
|
|
|
|
|
|
32.2* |
|
|
|
|
|
|
|
|
|
|
|
* |
Filed herewith. |
|
† |
Compensatory plan or arrangement. |
None.
139
Pursuant to the requirements of Section 13 or 15(d) of the Securities Exchange Act of 1934, as amended, the Registrant has duly caused this Annual Report on Form 10-K to be signed on its behalf by the undersigned, thereunto duly authorized.
|
|
|
Duck Creek Technologies, Inc. |
|
|
|
|
|
|
|
Date: November 3, 2020 |
|
By: |
/s/ Michael Jackowski |
|
|
|
|
Michael Jackowski |
|
|
|
|
Chief Executive Officer |
KNOW ALL PERSONS BY THESE PRESENTS, that each person whose signature appears below hereby constitutes and appoints Michael Jackowski, Vincent Chippari and Christopher Stone, and each of them acting individually, as his or her true and lawful attorneys-in-fact and agents, each with full power of substitution, for him in any and all capacities, to sign any and all amendments to this annual report on Form 10-K, and to file the same, with all exhibits thereto, and other documents in connection therewith, with the Securities and Exchange Commission, granting unto said attorney-in-fact and agent, full power and authority to do and perform each and every act and thing requisite and necessary to be done in connection therewith, as fully to all intents and purposes as he might or could do in person, hereby ratifying and confirming all that said attorney-in-fact and agent, or his substitutes or substitute, may lawfully do or cause to be done by virtue hereof.
Pursuant to the requirements of the Securities Exchange Act of 1934, as amended, this Report has been signed below by the following persons on behalf of the Registrant in the capacities and on the dates indicated.
|
Signature |
|
Title |
|
Date |
|
|
|
|
|
|
|
/s/ Michael A. Jackowski |
|
Chief Executive Officer (principal executive officer and director |
|
November 3, 2020 |
|
Michael A. Jackowski |
|
|
|
|
|
|
|
|
|
|
|
/s/ Vincent A. Chippari |
|
Chief Financial Officer (principal financial officer and principal accounting officer) |
|
November 3, 2020 |
|
Vincent A. Chippari |
|
|
|
|
|
|
|
|
|
|
|
/s/ Kathy Crusco |
|
Director |
|
November 3, 2020 |
|
Kathy Crusco |
|
|
|
|
|
|
|
|
|
|
|
/s/ Roy Mackenzie |
|
Director |
|
November 3, 2020 |
|
Roy Mackenzie |
|
|
|
|
|
|
|
|
|
|
|
/s/ Domingo Miron |
|
Director |
|
November 3, 2020 |
|
Domingo Miron |
|
|
|
|
|
|
|
|
|
|
|
/s/ Charles Moran |
|
Director |
|
November 3, 2020 |
|
Charles Moran |
|
|
|
|
|
|
|
|
|
|
|
/s/ Stuart Nicoll |
|
Director |
|
November 3, 2020 |
|
Stuart Nicoll |
|
|
|
|
|
|
|
|
|
|
|
/s/ Francis Pelzer |
|
Director |
|
November 3, 2020 |
|
Francis Pelzer |
|
|
|
|
|
|
|
|
|
|
|
/s/ Larry Wilson |
|
Director |
|
November 3, 2020 |
|
Larry Wilson /s/ Jason Wright |
|
Director |
|
November 3, 2020 |
|
Jason Wright |
|
|
|
|
140