Attached files
| file | filename |
|---|---|
| EX-99.1 - EX-99.1 - Clearwater Paper Corp | clw-2020x930x8kex991.htm |
| 8-K - 8-K - Clearwater Paper Corp | clw-20201103.htm |

Clearwater Paper Corporation THIRD QUARTER 2020 EARNINGS RELEASE MATERIALS NOVEMBER 3, 2020 ARSEN S. KITCH PRESIDENT, CHIEF EXECUTIVE OFFICER AND DIRECTOR MICHAEL J. MURPHY SENIOR VICE PRESIDENT AND CHIEF FINANCIAL OFFICER

Forward-Looking Statements Cautionary Statement Regarding Forward Looking Statements This presentation of supplemental information contains, in addition to historical information, certain forward-looking statements within the meaning of the Private Securities Litigation Reform Act of 1995, including statements regarding our response to COVID-19 and the impact of COVID-19 on consumer behavior, our business and operations; industry trends in response to COVID-19; improvements to our cost structure; Q4 2020 outlook for Adjusted EBITDA; our assumptions for full year 2020 expenses including interest, capital, depreciation and amortization and income tax; the operational and financial benefits from the Shelby expansion; our capital structure and liquidity; our near-term capital allocation objectives; our scheduled debt maturity; 2021 and 2022 expectations; and near-term strategic positioning and market assessment. These forward-looking statements are based on management’s current expectations, estimates, assumptions and projections that are subject to change. Our actual results of operations may differ materially from those expressed or implied by the forward-looking statements contained in this presentation. Important factors that could cause or contribute to such differences include the risks and uncertainties described from time to time in the company's public filings with the Securities and Exchange Commission, including but not limited to the following: impact of COVID-19 on our operations and our supplier’s operations and on customer demand; competitive pricing pressures for our products, including as a result of increased capacity as additional manufacturing facilities are operated by our competitors and the impact of foreign currency fluctuations on the pricing of products globally; the loss of, changes in prices in regard to, or reduction in, orders from a significant customer; changes in the cost and availability of wood fiber and wood pulp; changes in transportation costs and disruptions in transportation services; changes in customer product preferences and competitors' product offerings; larger competitors having operational and other advantages; customer acceptance and timing and quantity of purchases of our tissue products, including the existence of sufficient demand for and the quality of tissue produced by our expanded Shelby, North Carolina operations; consolidation and vertical integration of converting operations in the paperboard industry; our ability to successfully implement our operational efficiencies and cost savings strategies, along with related capital projects, and achieve the expected operational or financial results of those projects, including from the continuous digester at our Lewiston, Idaho facility; changes in the U.S. and international economies and in general economic conditions in the regions and industries in which we operate; manufacturing or operating disruptions, including IT system and IT system implementation failures, equipment malfunctions and damage to our manufacturing facilities; cyber-security risks; changes in costs for and availability of packaging supplies, chemicals, energy and maintenance and repairs; labor disruptions; cyclical industry conditions; changes in expenses, required contributions and potential withdrawal costs associated with our pension plans; environmental liabilities or expenditures; reliance on a limited number of third-party suppliers for raw materials; our ability to attract, motivate, train and retain qualified and key personnel; our substantial indebtedness and ability to service our debt obligations; restrictions on our business from debt covenants and terms; negative changes in our credit agency ratings; and changes in laws, regulations or industry standards affecting our business. Forward-looking statements contained in this presentation present management’s views only as of the date of this presentation. We undertake no obligation to publicly update forward-looking statements, to retract future revisions of management's views based on events or circumstances occurring after the date of this presentation. Non-GAAP Financial Measures This presentation include certain financial measures that are not calculated in accordance with GAAP, including Adjusted EBITDA, Adjusted Income, Net debt and Free Cash Flow. The Company’s management believes that the presentation of these financial measures provides useful information to investors because these measures are regularly used by management in assessing the Company’s performance. These financial measures should be considered in addition to results prepared in accordance with GAAP but should not be considered substitutes for or superior to GAAP results. In addition, these non-GAAP financial measures may not be comparable to similarly-titled measures utilized by other companies, since such other companies may not calculate such measure in the same manner as we do. A reconciliation of these measures (Adjusted EBITDA, Adjusted Income, Net debt and Free Cash flow) to the most relevant GAAP measure is available in the appendix of this presentation with the exception of forward looking non-GAAP measures contained in our Outlook, which the company cannot reconcile to forward-looking GAAP results without unreasonable effort. Page 2 © Clearwater Paper Corporation 2020
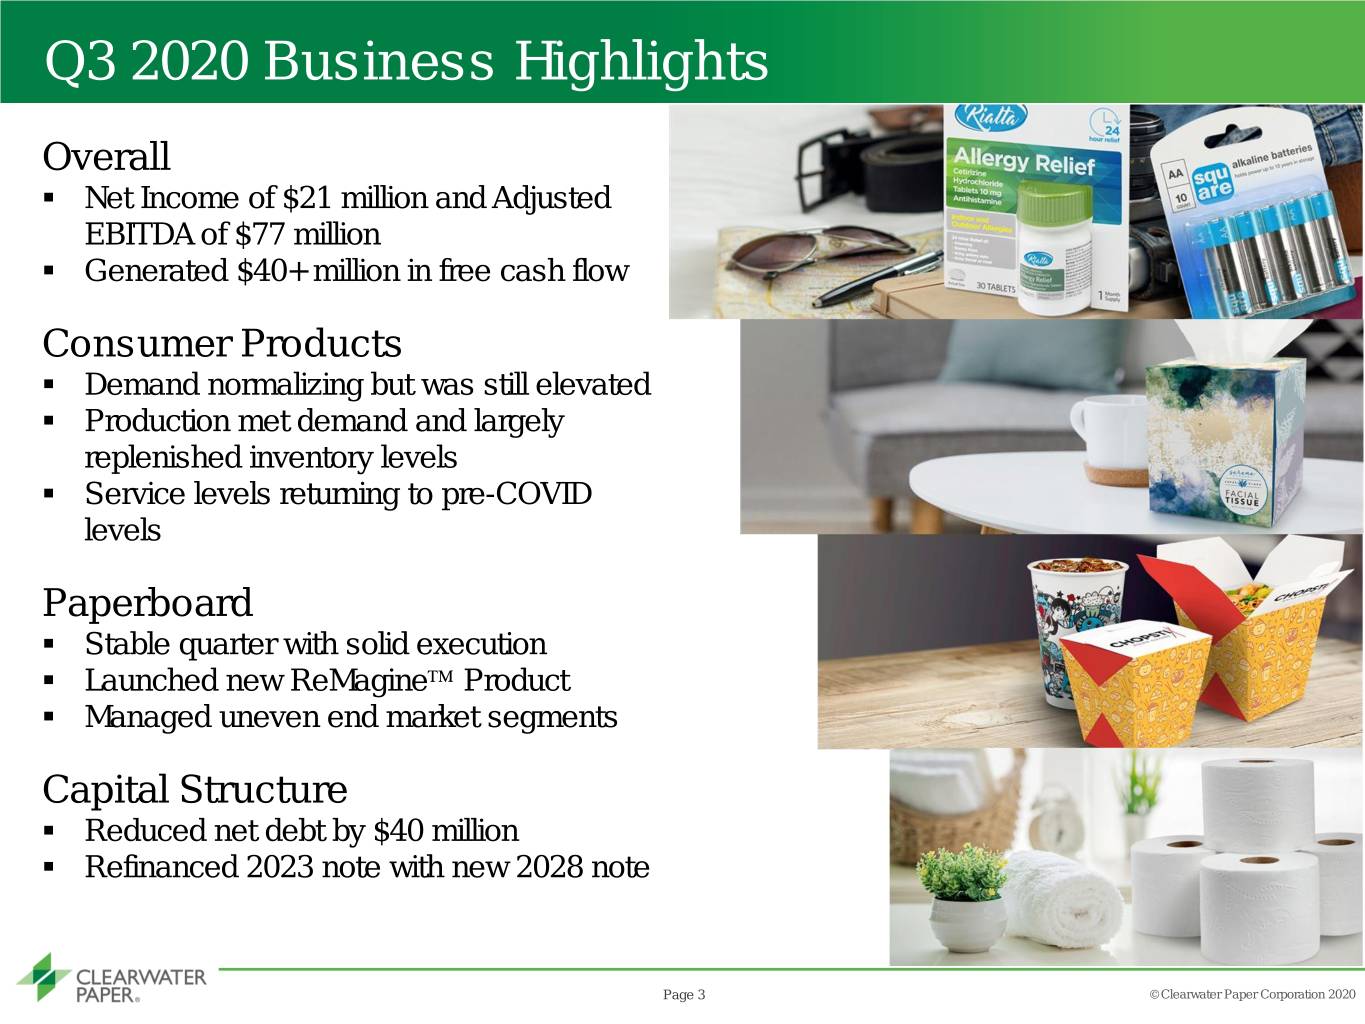
Q3 2020 Business Highlights Overall ▪ Net Income of $21 million and Adjusted EBITDA of $77 million ▪ Generated $40+ million in free cash flow Consumer Products ▪ Demand normalizing but was still elevated ▪ Production met demand and largely replenished inventory levels ▪ Service levels returning to pre-COVID levels Paperboard ▪ Stable quarter with solid execution ▪ Launched new ReMagine Product ▪ Managed uneven end market segments Capital Structure ▪ Reduced net debt by $40 million ▪ Refinanced 2023 note with new 2028 note Page 3 © Clearwater Paper Corporation 2020
Q3 2020 Operational Update Committed to protecting our two most important assets: our employees and our customer relationships Taking care of our employees: ▪ Temperature checks and sanitation practices ▪ Social distancing and face covering requirements ▪ Remote work access and travel restrictions ▪ Enhanced benefits Focusing on business continuity and customer service: ▪ Returning to pre-COVID service levels in tissue ▪ Supporting customers in rebuilding in-store inventory to acceptable levels ▪ Clearwater Paper’s reputation for reliability grew in Q3 2020 Page 4 © Clearwater Paper Corporation 2020

Business Update – Consumer Products COVID related demand for retail tissue continued to normalize in Q3 2020, as anticipated Industry ▪ Pre-COVID: ~10 million ton North America demand with ~2/3 at home and ~1/3 away from home ▪ COVID pandemic is leading to shift to at-home demand ▪ Paper towels are tracking above category demand trends in particular ▪ Rationalized product offering, introduction of tertiary brands and imported products to meet elevated demand Clearwater Paper ▪ Q3 2020 shipments were 14.5 million cases compared to 13.2 million in Q3 2019 and 16.0 million in Q2 2020, driven by COVID related demand ▪ Increased production levels led to higher fixed cost absorption ▪ Inventory levels largely replenished, in-stock conditions improving ▪ Expecting demand to decline in Q4 2020 relative to Q3 2020 due to consumer and retailer buying trends Page 5 © Clearwater Paper Corporation 2020

Business Update - Paperboard Diversified range of end-market products and flexibility in our supply chain provided overall stable financial results Industry ▪ We estimate ~2/3 of industry demand is driven by recession resilient end-market segments, such as food packaging and other consumer goods ▪ ~1/3 of demand is exposed to discretionary end-market segments, including food service, commercial print, luxury packaging etc. Clearwater Paper ▪ Lack of outage in Q3 2020 vs. Q3 2019 drove year over year earnings improvement ▪ Sales volumes and prices were down slightly compared to Q3 2019 ▪ Order backlogs are in line with previous years ▪ Launched ReMagine brand for SBS folding carton paperboard with up to 30% recycled content Page 6 © Clearwater Paper Corporation 2020

Financial Performance ($ in millions, except per share amounts) Quarter Ended Sept. 30, Nine Months Ended Sept. 30, 2020 2019 2020 2019 Net Sales $ 457.4 $ 445.2 $ 1,415.8 $ 1,326.0 Cost of Sales 378.6 418.7 1,198.3 1,212.8 Selling, general and adminstrative 29.3 27.0 89.4 83.9 Other operating charges, net 0.3 1.9 11.9 2.1 Income (loss) from operations 49.2 (2.4) 116.2 27.2 Non-operating expense (17.9) (17.2) (47.5) (39.5) Income tax provision (benefit) 9.9 (8.7) 14.1 (4.7) Net income (loss) $ 21.4 $ (11.0) $ 54.5 $ (7.6) Diluted income (loss) per share $ 1.28 $ (0.66) $ 3.27 $ (0.46) Non-GAAP income (loss) per share $ 1.59 $ (0.68) $ 3.81 $ (0.34) Page 7 © Clearwater Paper Corporation 2020

Revenue, Income and Adjusted EBITDA by Segment ($ in millions) Quarter Ended Sept. 30, Nine Months Ended Sept. 30, 2020 2019 2020 2019 Net Sales Consumer Products $ 248.3 $ 228.5 $ 789.1 $ 676.2 Paperboard 209.1 216.6 626.6 649.7 $ 457.4 $ 445.2 $ 1,415.8 $ 1,326.0 Operating Income Consumer Products $ 31.3 $ (4.4) $ 82.1 $ (8.3) Paperboard 32.8 17.1 91.6 80.1 Corporate and other (14.6) (13.2) (45.6) (42.5) Other operating charges, net (0.3) (1.9) (11.9) (2.1) $ 49.2 $ (2.4) $ 116.2 $ 27.2 Adjusted EBITDA Consumer Products $ 48.3 $ 14.6 $ 133.6 $ 42.9 Paperboard 42.0 28.3 119.2 110.2 Corporate and other (13.1) (11.4) (41.2) (37.5) $ 77.2 $ 31.5 $ 211.6 $ 115.6 Page 8 © Clearwater Paper Corporation 2020

Consumer Products Results Q3 2020 vs. Q3 2019 Segment Adjusted EBITDA ($ in millions) Higher volume from pandemic and Favorable mix new customer partially offset by programs lower pricing Improved cost absorption from higher volumes coupled with lower pulp and transportation costs Page 9 © Clearwater Paper Corporation 2020

Consumer Products Sales and Production ($ in millions) % changes % changes Q3 Q4 Q1 Q2 Q3 Q3 2020 vs Q3 2020 vs 2019 2019 2020 2020 2020 Q3 2019 Q2 2020 Sales, Cases 13.2 13.3 15.2 16.0 14.5 10.2% -9.4% Production, Cases 12.9 13.6 13.9 15.9 15.3 18.9% -3.7% Adjusted EBITDA $ 14.6 $ 20.2 $ 31.6 $ 53.7 $ 48.3 230.8% -10.1% IRI Panel Data - Total Tissue – All Outlets 2020 Year over Year Growth Rate in Dollars 120% Quarterly Growth Q1 – 34% 100% 100% Q2 – 23% Q3 – 12% 80% 60% 40% 37% 19% 20% 4% 17% 8% 11% 7% 11% 0% January February March April May June July August September Data Source: IRI Consumer Panel Data; Total US – All Outlets; 2020 YTD Week Ending September 27th Page 10 © Clearwater Paper Corporation 2020

Paperboard Results Q3 2020 vs. Q3 2019 Segment Adjusted EBITDA ($ in millions) Absence of Lower pricing major outage at Lower sales partially offset Idaho mill by favorable mix volume Page 11 © Clearwater Paper Corporation 2020
Outlook Q4 2020: $52 to $62 million of Adjusted EBITDA ▪ Tissue volumes expected to be at or below Q4 2019 sales of 13.3 million cases ▪ Tissue production will largely be similar to sales ▪ Continued stability in paperboard ▪ No major COVID disruptions Other FY 2020 assumptions ▪ Interest expense: $46 - $48 million ▪ Depreciation and amortization expense: $109 - $112 million ▪ CAPEX: ~$45 million ▪ Cash taxes: expect recorded tax refunds will fully offset any cash taxes owed Page 12 © Clearwater Paper Corporation 2020

Capital Structure and Allocation Capital structure: supportive and stable Liquidity Profile ($ in millions)1 ABL Availability $234.2 ▪ Capital structure provides ample liquidity Less Utilization (4.4) ▪ No material near-term debt maturities Plus Unrestricted Cash 47.5 ▪ Corporate/Issuer ratings: Ba2/BB- Liquidity $277.3 ▪ S&P removed its “negative outlook” ▪ Achieved lower pricing on our term loan in Q3 Scheduled Debt Maturity Profile ($ in millions)2 Capital allocation objectives $300.0 $275.0 ▪ Utilized $40 million of free cash flow to opportunistically reduce debt $199.3 ▪ Target net debt to adjusted EBITDA ratio of 2.5x ▪ Large capital spend complete ▪ Normalized $60 million / year $0.0 $0.0 $0.0 $0.0 $0.0 $0.0 ▪ 2020 level ~ $45 million 2020 2021 2022 2023 2024 2025 2026 2027 2028 1 Note: ABL availability based on borrowing base calculations and consolidated balance sheet as of September 30, 2020, and utilization includes ABL borrowing of $0 million and outstanding letters of credit of $4.4 million. 2 Note: This chart excludes finance leases as of September 30, 2020 and assumes that the 2025 notes are repaid or refinanced at least 91 days prior to their respective maturities. Current debt maturities include $300 million of 5.375% notes due 2025; Term Loan due 2026; and $275 million of 4.75% notes due 2028 Page 13 © Clearwater Paper Corporation 2020
Clearwater Paper Value Proposition Well positioned across two attractive businesses Consumer Products: ▪ Leading private brand provider with national scale & superior supply chain performance ▪ Shift to private-branded over branded product continues with long runway ▪ Tissue is need-based and economically resilient Paperboard: ▪ Diversified range of end-market, well-invested national footprint ▪ Focused on non-integrated customers with strong service and quality commitment ▪ Well positioned for trends towards sustainable packaging and food service products Near-term strategy is to prioritize free cash flow, reduce debt: ▪ Deliver benefits from Shelby expansion including incremental production, sales and supply chain ▪ Operational improvements ▪ Aggressively manage working capital ▪ Prudent capital allocation Page 14 © Clearwater Paper Corporation 2020

Appendix © Clearwater Paper Corporation 2020

Consumer Products Sequential Quarter Results Q3 2020 vs. Q2 2020 Segment Adjusted EBITDA ($ in millions) Favorable mix Normalization of Negative absorption pandemic driven from lower volume, demand increased input costs in transportation, and energy, partly offset by lower pulp prices Page 16 © Clearwater Paper Corporation 2020

Paperboard Sequential Quarter Results Q3 2020 vs. Q2 2020 Segment Adjusted EBITDA ($ in millions) Lower input costs Unfavorable mix in fiber offset by higher freight and chemical costs Page 17 © Clearwater Paper Corporation 2020

Key Segment Sales Information Q1 2019 Q2 2019 Q3 2019 Q4 2019 Q1 2020 Q2 2020 Q3 2020 Consumer Products Shipments in short tons Retail 73,356 76,175 79,526 79,748 90,791 95,432 86,292 Non-Retail (away from home and parent rolls) 10,266 6,623 6,882 8,393 9,002 5,812 3,799 Sales Price per short ton Retail $ 2,789 $ 2,764 $ 2,707 $ 2,698 $ 2,732 $ 2,729 $ 2,766 Non-Retail (away from home and parent rolls) $ 1,799 $ 1,851 $ 1,805 $ 1,590 $ 1,548 $ 1,746 $ 1,820 Converted Products (cases in thousands) 12,320 12,488 13,162 13,290 15,204 16,016 14,507 Pulp and Paperboard Shipments (short tons) 202,834 225,188 214,537 202,102 211,296 207,420 211,820 Sales price ($/short ton) $ 1,001 $ 1,004 $ 1,004 $ 1,009 $ 999 $ 984 $ 982 Page 18 © Clearwater Paper Corporation 2020
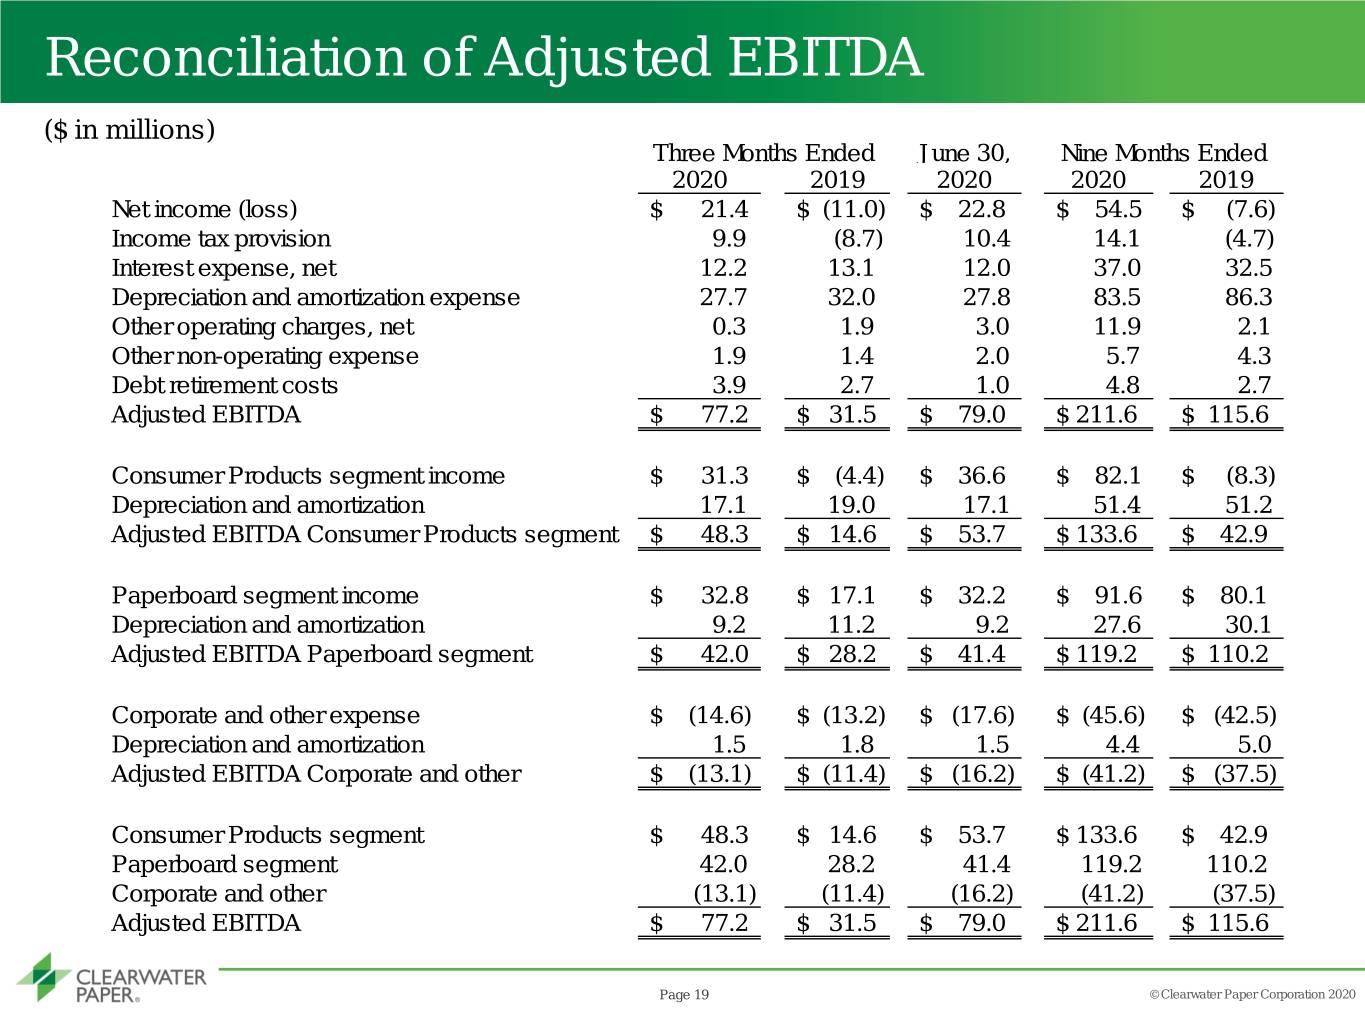
Reconciliation of Adjusted EBITDA ($ in millions) Three Months Ended June 30, Nine Months Ended 2020 2019 2020 2020 2019 Net income (loss) $ 21.4 $ (11.0) $ 22.8 $ 54.5 $ (7.6) Income tax provision 9.9 (8.7) 10.4 14.1 (4.7) Interest expense, net 12.2 13.1 12.0 37.0 32.5 Depreciation and amortization expense 27.7 32.0 27.8 83.5 86.3 Other operating charges, net 0.3 1.9 3.0 11.9 2.1 Other non-operating expense 1.9 1.4 2.0 5.7 4.3 Debt retirement costs 3.9 2.7 1.0 4.8 2.7 Adjusted EBITDA $ 77.2 $ 31.5 $ 79.0 $ 211.6 $ 115.6 Consumer Products segment income $ 31.3 $ (4.4) $ 36.6 $ 82.1 $ (8.3) Depreciation and amortization 17.1 19.0 17.1 51.4 51.2 Adjusted EBITDA Consumer Products segment $ 48.3 $ 14.6 $ 53.7 $ 133.6 $ 42.9 Paperboard segment income $ 32.8 $ 17.1 $ 32.2 $ 91.6 $ 80.1 Depreciation and amortization 9.2 11.2 9.2 27.6 30.1 Adjusted EBITDA Paperboard segment $ 42.0 $ 28.2 $ 41.4 $ 119.2 $ 110.2 Corporate and other expense $ (14.6) $ (13.2) $ (17.6) $ (45.6) $ (42.5) Depreciation and amortization 1.5 1.8 1.5 4.4 5.0 Adjusted EBITDA Corporate and other $ (13.1) $ (11.4) $ (16.2) $ (41.2) $ (37.5) Consumer Products segment $ 48.3 $ 14.6 $ 53.7 $ 133.6 $ 42.9 Paperboard segment 42.0 28.2 41.4 119.2 110.2 Corporate and other (13.1) (11.4) (16.2) (41.2) (37.5) Adjusted EBITDA $ 77.2 $ 31.5 $ 79.0 $ 211.6 $ 115.6 Page 19 © Clearwater Paper Corporation 2020

Reconciliation of Adjusted Income ($ in millions income, except per share amounts) Three Months ended Nine Months Ended 2020 2019 2020 2019 Net income (loss) $ 21.4 $ (11.0) $ 54.5 $ (7.6) Add back: Income tax provision (benefit) 9.9 (8.7) 14.1 (4.7) Income (loss) before income taxes 31.3 (19.7) 68.7 (12.2) Add back: Debt retirement costs 3.9 2.7 4.8 2.7 Other operating charges, net 0.3 1.9 11.9 2.1 Adjusted net income before tax 35.5 (15.0) 85.4 (7.4) Normalized income tax provision 8.9 (3.7) 21.3 (1.9) Adjusted net income (loss) $ 26.6 $ (11.2) $ 64.0 $ (5.6) Weighted average diluted shares 16,783 16,539 16,689 16,531 Adjusted net income (loss) per $ 1.59 $ (0.68) $ 3.81 $ (0.34) diluted share Page 20 © Clearwater Paper Corporation 2020

Additional Reconciliations ($ in millions) Reconciliation of Net Debt December 31, 2019 March 30, 2020 June 30, 2020 September 30, 2020 Cash $ 20.0 $ 60.8 $ 48.2 $ 47.5 Current debt 17.9 58.1 1.6 1.7 Long-term debt 884.5 883.9 827.9 785.5 add: Deferred debt costs 8.1 7.7 6.4 8.2 less: Financing leases (22.0) (22.0) (21.6) (21.2) 888.5 927.7 814.3 774.2 Net debt $ 868.5 $ 866.9 $ 766.1 $ 726.7 Reconciliation of Free Cash Flow Q3 2019 Q1 2020 Q2 2020 Q3 2020 Cash from operations $ (31.0) $ 12.1 $ 109.0 $ 55.7 Additions to property, plant and equipment (17.4) (10.5) (7.3) (9.7) Free cash flow $ (48.4) $ 1.6 $ 101.7 $ 46.0 Page 21 © Clearwater Paper Corporation 2020

Major Maintenance Schedule ($ in millions) $30 $25 - $30 $24 $22 $19 - $23 $18 $20 $7 $7 $18 $15 $17 $10 Idaho None None 1 2015 2016 2017 2018 2019 2020e 2021e 2022e 1 Q1 Q2 Q3 Q4 Total 1 This information is based upon management’s current expectations and estimates, as well as historical averages. Many factors are outside the control of management, and actual results may differ materially from the information set forth above. See “Forward-Looking Statements” on page 2. Page 22 © Clearwater Paper Corporation 2020

Key Commodity Consumption Volumes Approximate Annual1 Unit of Volume1 COGS Input Measure (in millions) Purchased Pulp Ton 0.3 Fiber Bone Dry Ton 1.6 Diesel Gallon 10 Electric MWh 1 Natural Gas MMBTU 10 Polyethylene Pound 30 Caustic Pound 90 Chlorate Pound 30 1 Approximated annual volume and expense amounts are based on historical average consumption and management's current expectations and estimates with respect to future volumes and expense, and these amounts may be significantly influenced by general market conditions and other factors outside of our control. Actual results may differ materially from the information set forth above. See "Forward-Looking Statements" on page 2. Page 23 © Clearwater Paper Corporation 2020
