Attached files
| file | filename |
|---|---|
| EX-99.1 - EX-99.1 - Yellow Corp | yrcw-ex991_6.htm |
| 8-K - 8-K - Yellow Corp | yrcw-8k_20201102.htm |

YRC WORLDWIDE THIRD QUARTER 2020 EARNINGS CONFERENCE CALL
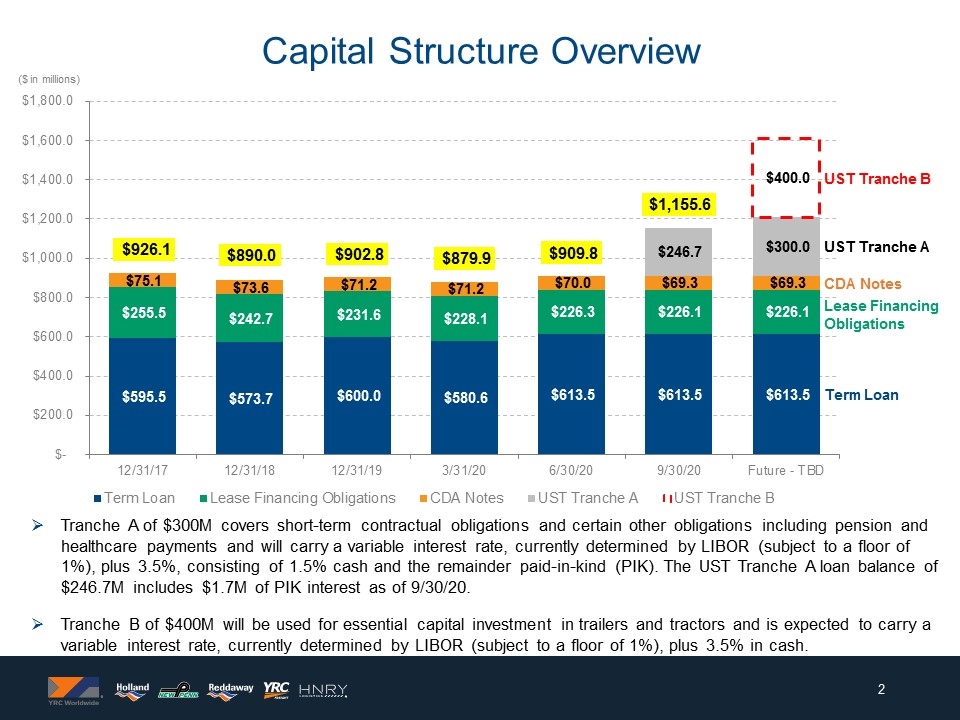
($ in millions) Term Loan Lease Financing Obligations CDA Notes UST Tranche A Capital Structure Overview Tranche A of $300M covers short-term contractual obligations and certain other obligations including pension and healthcare payments and will carry a variable interest rate, currently determined by LIBOR (subject to a floor of 1%), plus 3.5%, consisting of 1.5% cash and the remainder paid-in-kind (PIK). The UST Tranche A loan balance of $246.7M includes $1.7M of PIK interest as of 9/30/20. Tranche B of $400M will be used for essential capital investment in trailers and tractors and is expected to carry a variable interest rate, currently determined by LIBOR (subject to a floor of 1%), plus 3.5% in cash. UST Tranche B
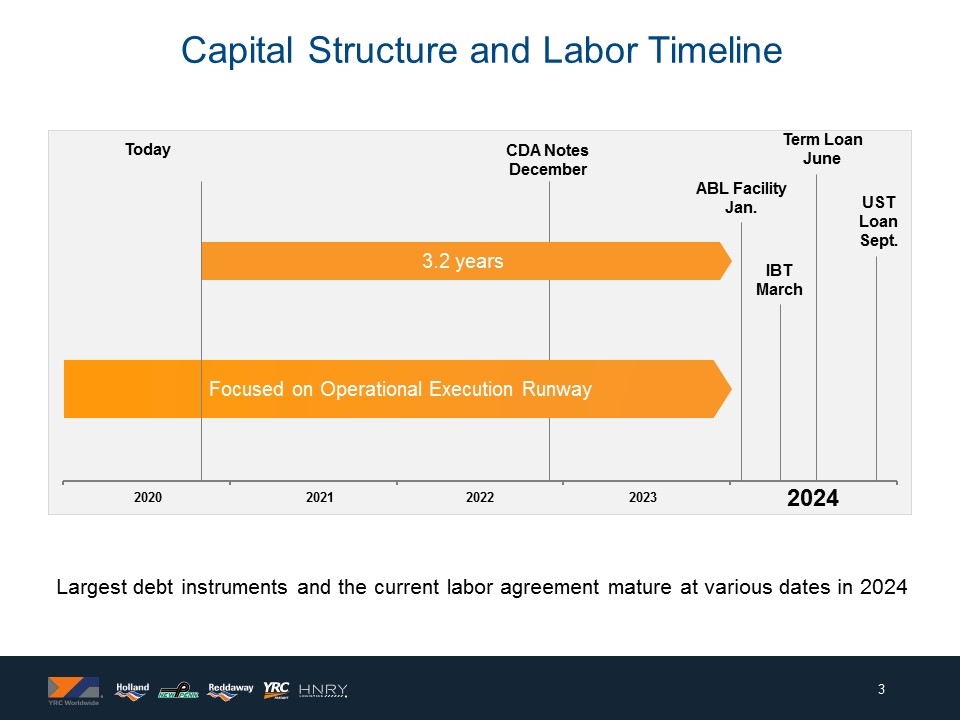
Largest debt instruments and the current labor agreement mature at various dates in 2024 Focused on Operational Execution Runway 3.2 years IBT March ABL Facility Jan. Term Loan June CDA Notes December UST Loan Sept. Capital Structure and Labor Timeline Today 2020 2021 2022 2023 2024
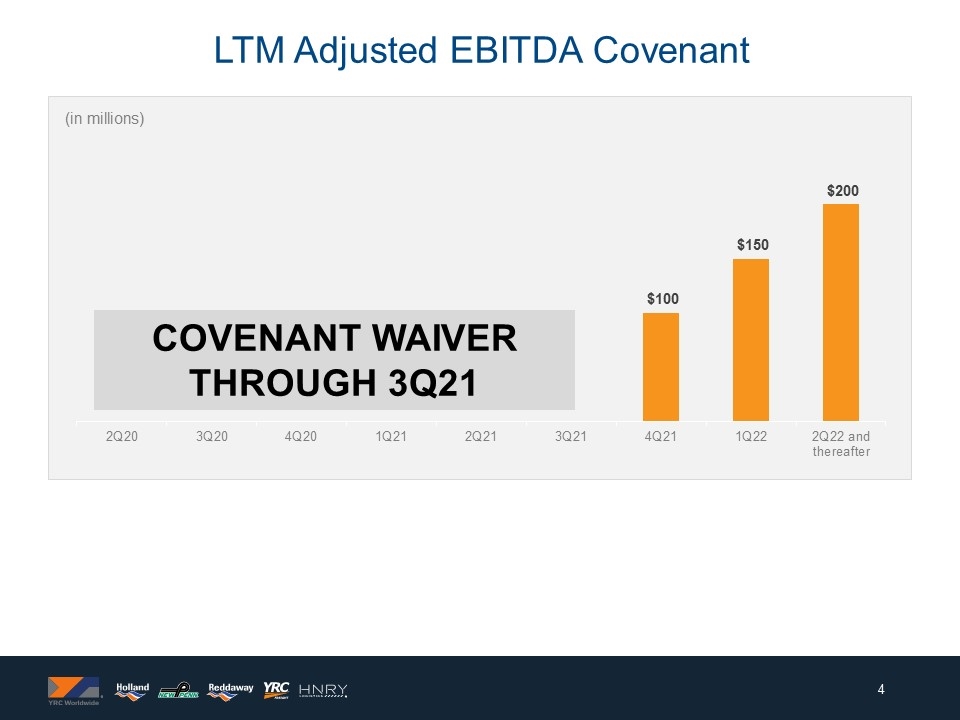
COVENANT WAIVER THROUGH 3Q21 LTM Adjusted EBITDA Covenant (in millions)
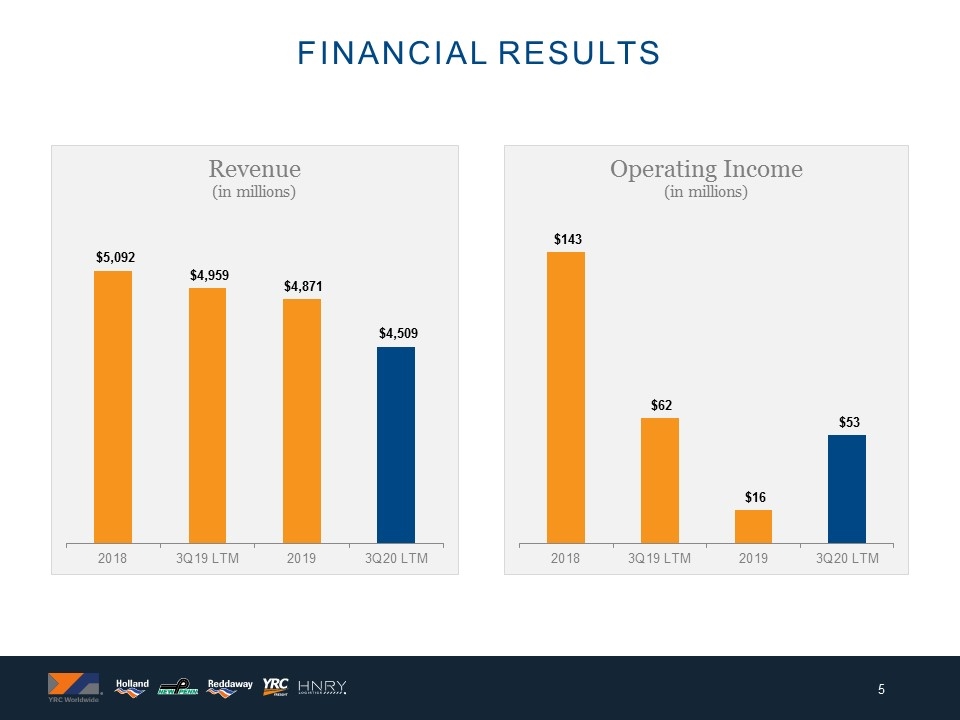
Financial results
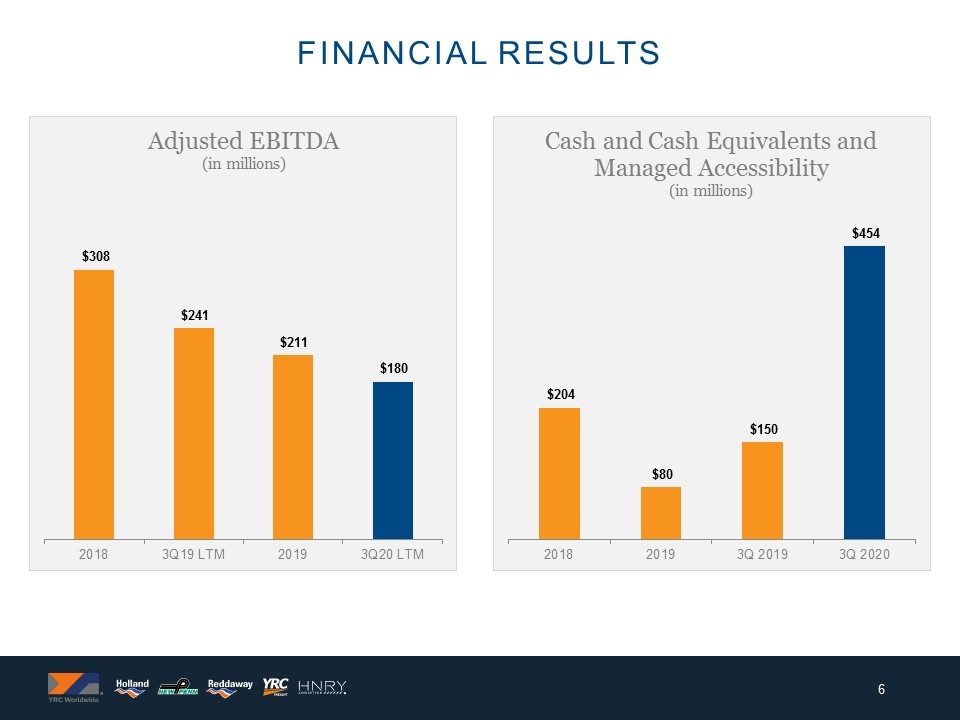
Financial results
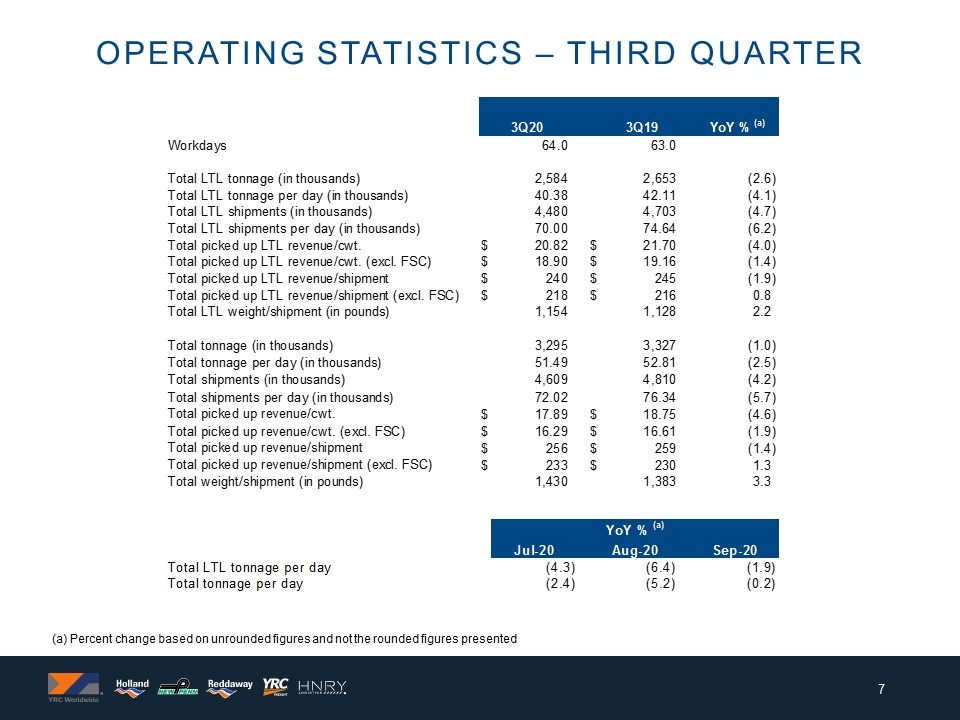
Operating statistics – THIRD QUARTER (a) Percent change based on unrounded figures and not the rounded figures presented
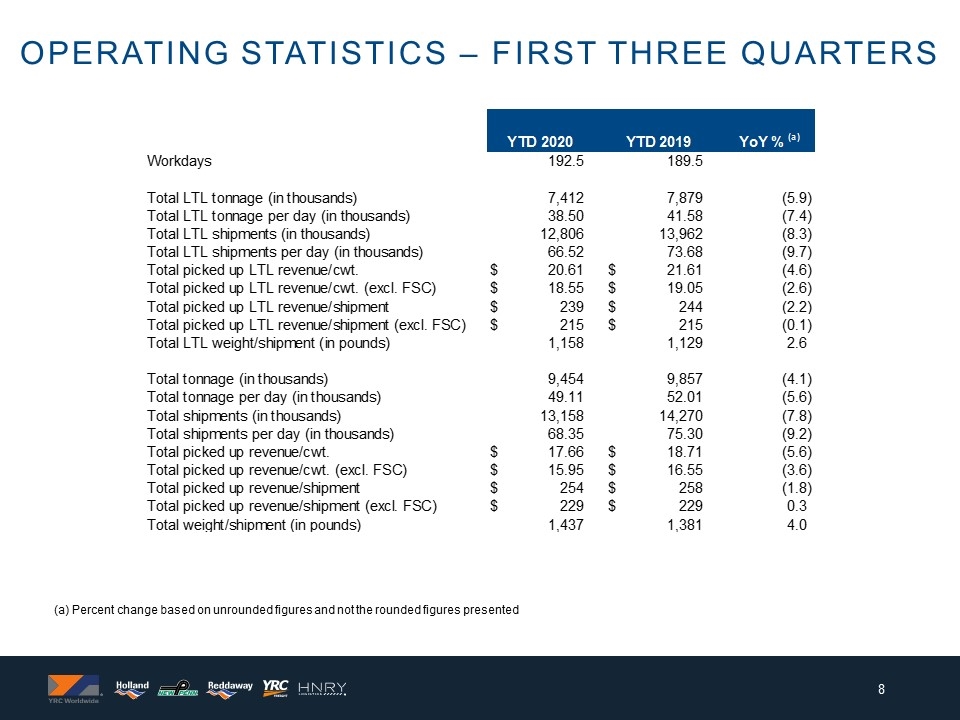
OPERATING STATISTICS – FIRST THREE QUARTERS (a) Percent change based on unrounded figures and not the rounded figures presented
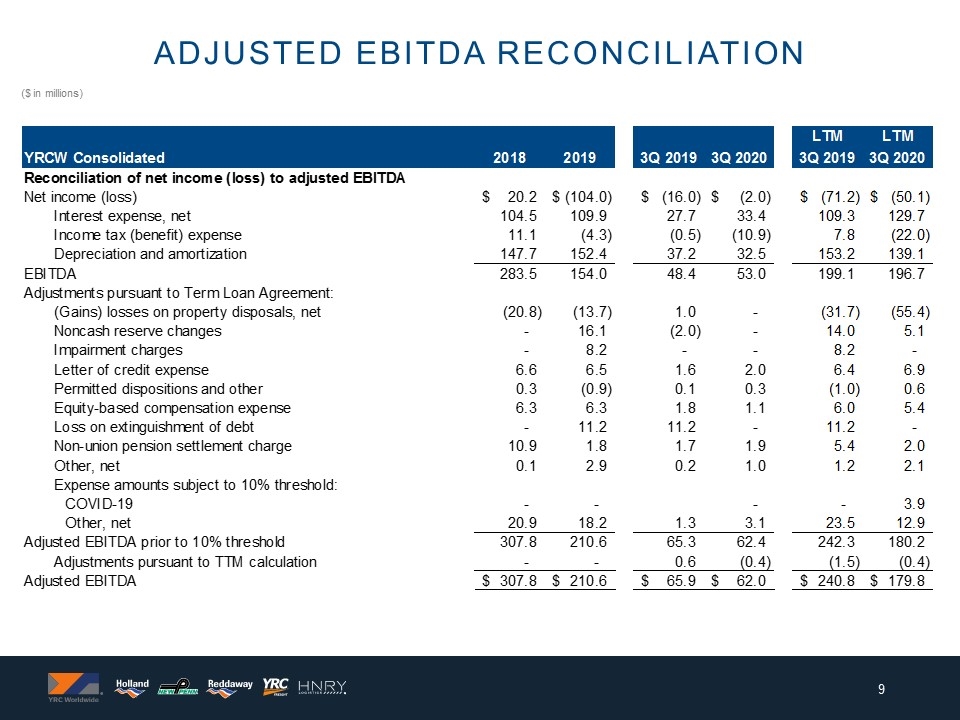
($ in millions) Adjusted Ebitda reconciliation YRCW Inc. Reconciliation of Net (Loss) Income to Adjusted EBITDA LTM LTM LTM LTM LTM LTM LTM **Make sure to do "ignore error" to get rid of green triangles YRCW Consolidated 2015 2016 2017 2018 2019 2Q 2018 2Q 2019 3Q 2019 1Q 2020 2Q 2020 3Q 2020 4Q 2018 1Q 2019 2Q 2019 3Q 2019 1Q 2020 2Q 2020 3Q 2020 Reconciliation of net income (loss) to adjusted EBITDA Net income (loss) $0.7 $21.5 $-10.8 $20.2 $-,103.99999999999928 $14.4 $-23.6 $-16 $4.3 $-37.099999999999909 $-2 $20.2 $-14.299999999999862 $-52.299999999999869 $-71.199999999999875 $-50.599999999999831 $-64.099999999999739 $-50.099999999999739 Interest expense, net 107.1 103 102.4 104.5 109.9 25.5 27.799999999999997 27.7 28.2 40.200000000000003 33.4 104.5 105.5 107.8 109.3 111.60000000000001 124.00000000000001 129.70000000000002 Income tax (benefit) expense -5.0999999999999996 3.1 -7.3 11.1 -4.3 10.4 9.1 -0.5 -0.4 -7.5 -10.9 11.1 14.3 13.000000000000002 7.8000000000000007 5 -11.6 -22 Depreciation and amortization 163.69999999999999 159.80000000000001 147.69999999999999 147.69999999999999 152.4 37.599999999999994 38.5 37.200000000000003 35.700000000000003 34.200000000000003 32.5 147.69999999999999 150 150.9 153.19999999999999 148.10000000000002 143.80000000000001 139.10000000000002 EBITDA $266.39999999999998 $287.39999999999998 232 283.5 154.00000000000074 $87.899999999999991 51.8 48.400000000000006 67.800000000000011 29.800000000000097 53 $283.5 $255.50000000000011 219.40000000000015 199.10000000000011 214.10000000000019 192.10000000000028 196.7000000000003 Adjustments pursuant to Term Loan Agreement: (Gains) losses on property disposals, net 1.9 -14.6 -0.6 -20.8 -13.7 2.2000000000000002 -6.1999999999999993 1 -39.299999999999997 -6 0 -20.8 -22.4 -30.8 -31.700000000000003 -54.599999999999994 -54.4 -55.4 Noncash reserve changes 0 0 0 0 16.100000000000001 0 16 -2 0.3 2.7 0 0 0 16 14 16.400000000000002 3.1000000000000014 5.1000000000000014 Impairment charges 0 0 0 0 8.1999999999999993 0 0 0 0 0 0 0 8.1999999999999993 8.1999999999999993 8.1999999999999993 0 0 0 Letter of credit expense 8.8000000000000007 7.7 6.8 6.6 6.5 1.7 1.6 1.6 1.6 1.6 2 6.6 6.5 6.4 6.4 6.5 6.5 6.9 Permitted dispositions and other 0.4 3 1.2 0.3 -0.9 0.19999999999999996 0 0.1 0.2 0 0.3 0.3 -1.3000000000000003 -1.5 -1 0.4 0.4 0.60000000000000009 Equity-based compensation expense 8.5 7.3 6.5 6.3 6.3 3.1999999999999997 1.1000000000000001 1.8 2 1.2000000000000002 1.1000000000000001 6.3 6.9999999999999991 4.9000000000000004 5.9999999999999991 6 6.1000000000000005 5.4 Loss on extinguishment of debt 0.6 0 0 0 11.2 0 0 11.2 0 0 0 0 0 0 11.2 11.2 11.2 0 Non-union pension settlement charge 28.7 0 7.6 10.9 1.8 0 0 1.7 0 0 1.9 10.9 10.9 10.9 5.4 1.8 1.8 2 Other, net #REF! #REF! 2.2999999999999998 0.1 2.9 1.4 1 0.2 -1.6 2.1 1 0.1 2.2999999999999998 1.9 1.2 0.19999999999999973 1.3 2.1 Expense amounts subject to 10% threshold: 5.0999999999999996 0 8.1 COVID-19 0 0 0 0.2 3.6999999999999997 0 0 0 0 0 0.2 3.9 3.9 Other, net 20.9 18.2 3.8 4.0999999999999996 1.3 2.9 2.8000000000000003 3.1 7.7 25.5 25.799999999999997 23.500000000000004 12.4 11.1 12.9 Adjusted EBITDA prior to 10% threshold 274.2000000000001 307.8 210.60000000000073 96.600000000000009 69.399999999999991 65.300000000000011 34.100000000000016 37.900000000000098 62.4 294.60000000000002 292.2000000000001 261.20000000000016 242.30000000000007 214.60000000000019 183.10000000000028 180.2000000000003 Adjustments pursuant to TTM calculation 0.2 0 0 0 0 0 -2.1 0.6 0 0 -0.4 2.2999999999999998 0 -2.1 -1.5 0 0 -0.4 hardcode for LTM! Adjusted EBITDA #REF! #REF! $274.2000000000001 $307.8 $210.60000000000073 $96.600000000000009 $67.3 $65.900000000000006 $34.100000000000016 $37.900000000000098 $62 $591.5 $292.2000000000001 $259.10000000000014 $240.80000000000007 $214.60000000000019 $183.10000000000028 $179.8000000000003
