Attached files
| file | filename |
|---|---|
| EX-99.1 - EXHIBIT 99.1 - Marathon Petroleum Corp | mpcq32020earningsrelea.htm |
| 8-K - 8-K - Marathon Petroleum Corp | mpcformq32020earningsr.htm |
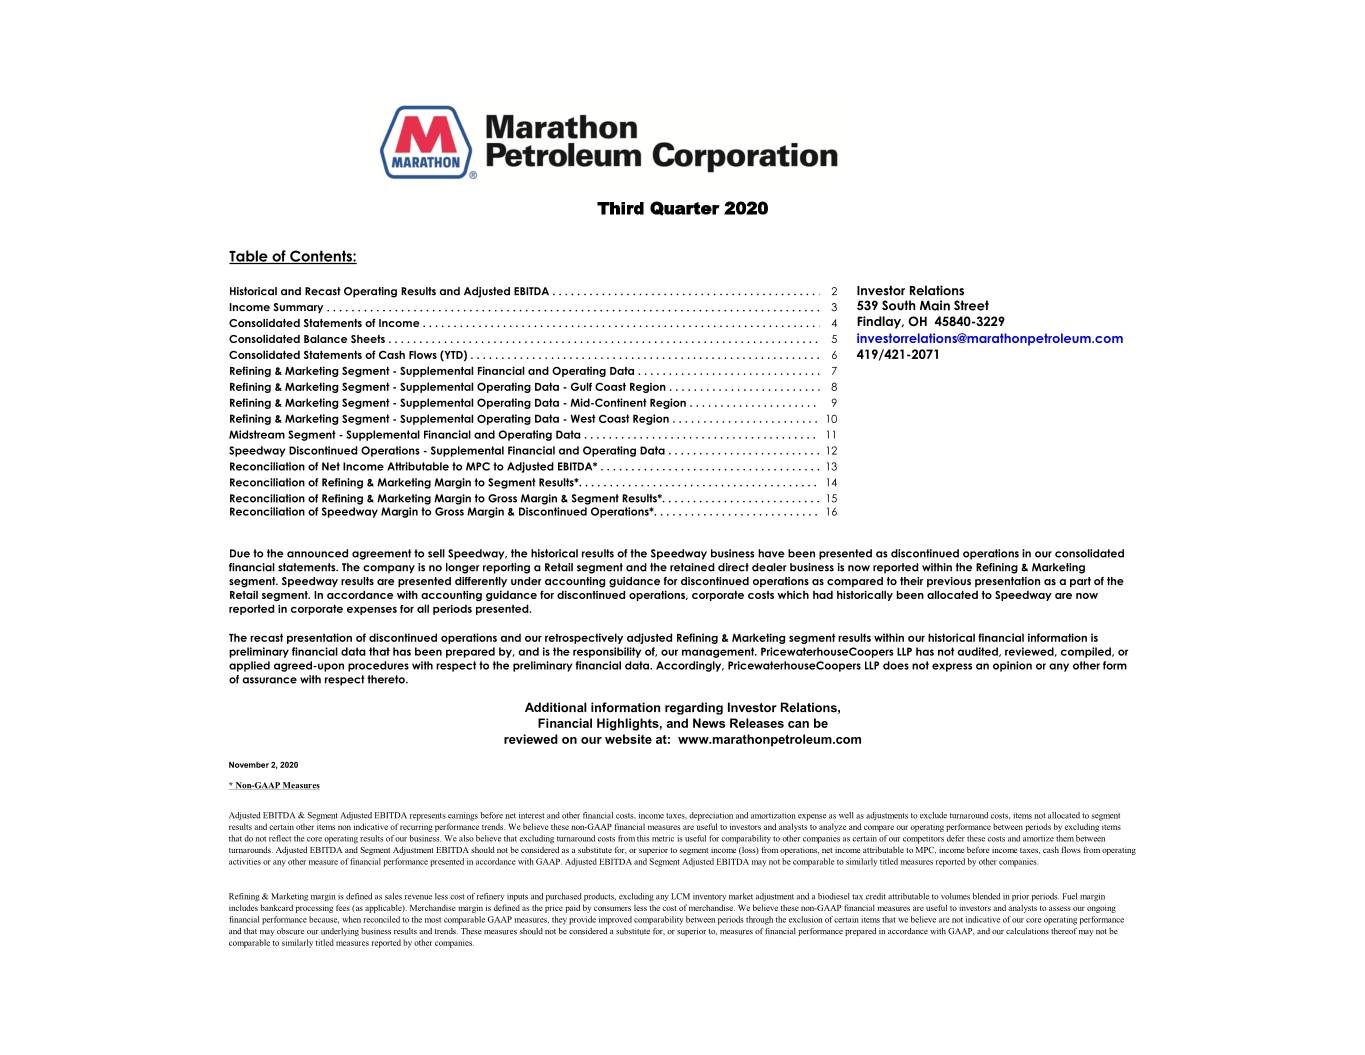
Third Quarter 2020 Table of Contents: Historical and Recast Operating Results and Adjusted EBITDA . . . . . . . . . . . . . . . . . . . . . . . . . . . . . . . . . . . . . . . . . . . . . .2 . . . .Investor . . . . . . . . Relations Income Summary . . . . . . . . . . . . . . . . . . . . . . . . . . . . . . . . . . . . . . . . . . . . . . . . . . . . . . . . . . . . . . . . . . . . . . . . . . . . . . . . . 3 539 South Main Street Consolidated Statements of Income . . . . . . . . . . . . . . . . . . . . . . . . . . . . . . . . . . . . . . . . . . . . . . . . . . . . . . . . . . . . . . . . . . 4 Findlay, OH 45840-3229 Consolidated Balance Sheets . . . . . . . . . . . . . . . . . . . . . . . . . . . . . . . . . . . . . . . . . . . . . . . . . . . . . . . . . . . . . . . . . . . . . . . 5 investorrelations@marathonpetroleum.com Consolidated Statements of Cash Flows (YTD) . . . . . . . . . . . . . . . . . . . . . . . . . . . . . . . . . . . . . . . . . . . . . . . . . . . . . . . . . . 6 419/421-2071 Refining & Marketing Segment - Supplemental Financial and Operating Data . . . . . . . . . . . . . . . . . . . . . . . . . . . . . . . 7 Refining & Marketing Segment - Supplemental Operating Data - Gulf Coast Region . . . . . . . . . . . . . . . . . . . . . . . . . . 8 Refining & Marketing Segment - Supplemental Operating Data - Mid-Continent Region . . . . . . . . . . . . . . . . . . . . . . . 9 Refining & Marketing Segment - Supplemental Operating Data - West Coast Region . . . . . . . . . . . . . . . . . . . . . . . . . 10 Midstream Segment - Supplemental Financial and Operating Data . . . . . . . . . . . . . . . . . . . . . . . . . . . . . . . . . . . . . . . 11 Speedway Discontinued Operations - Supplemental Financial and Operating Data . . . . . . . . . . . . . . . . . . . . . . . . . .12 . . . . . . . . . . . . . . . . . . . . . . . Reconciliation of Net Income Attributable to MPC to Adjusted EBITDA* . . . . . . . . . . . . . . . . . . . . . . . . . . . . . . . . . . . . 13 Reconciliation of Refining & Marketing Margin to Segment Results*. . . . . . . . . . . . . . . . . . . . . . . . . . . . . . . . . . . . . . . . 14. . . Reconciliation of Refining & Marketing Margin to Gross Margin & Segment Results*. . . . . . . . . . . . . . . . . . . . . . . . . . .15 . . . . . . . . . . . . . . . . Reconciliation of Speedway Margin to Gross Margin & Discontinued Operations*. . . . . . . . . . . . . . . . . . . . . . . . . . . . 16. . . . . . . Due to the announced agreement to sell Speedway, the historical results of the Speedway business have been presented as discontinued operations in our consolidated financial statements. The company is no longer reporting a Retail segment and the retained direct dealer business is now reported within the Refining & Marketing segment. Speedway results are presented differently under accounting guidance for discontinued operations as compared to their previous presentation as a part of the Retail segment. In accordance with accounting guidance for discontinued operations, corporate costs which had historically been allocated to Speedway are now reported in corporate expenses for all periods presented. The recast presentation of discontinued operations and our retrospectively adjusted Refining & Marketing segment results within our historical financial information is preliminary financial data that has been prepared by, and is the responsibility of, our management. PricewaterhouseCoopers LLP has not audited, reviewed, compiled, or applied agreed-upon procedures with respect to the preliminary financial data. Accordingly, PricewaterhouseCoopers LLP does not express an opinion or any other form of assurance with respect thereto. Additional information regarding Investor Relations, Financial Highlights, and News Releases can be reviewed on our website at: www.marathonpetroleum.com November 2, 2020 * Non-GAAP Measures Adjusted EBITDA & Segment Adjusted EBITDA represents earnings before net interest and other financial costs, income taxes, depreciation and amortization expense as well as adjustments to exclude turnaround costs, items not allocated to segment results and certain other items non indicative of recurring performance trends. We believe these non-GAAP financial measures are useful to investors and analysts to analyze and compare our operating performance between periods by excluding items that do not reflect the core operating results of our business. We also believe that excluding turnaround costs from this metric is useful for comparability to other companies as certain of our competitors defer these costs and amortize them between turnarounds. Adjusted EBITDA and Segment Adjustment EBITDA should not be considered as a substitute for, or superior to segment income (loss) from operations, net income attributable to MPC, income before income taxes, cash flows from operating activities or any other measure of financial performance presented in accordance with GAAP. Adjusted EBITDA and Segment Adjusted EBITDA may not be comparable to similarly titled measures reported by other companies. Refining & Marketing margin is defined as sales revenue less cost of refinery inputs and purchased products, excluding any LCM inventory market adjustment and a biodiesel tax credit attributable to volumes blended in prior periods. Fuel margin includes bankcard processing fees (as applicable). Merchandise margin is defined as the price paid by consumers less the cost of merchandise. We believe these non-GAAP financial measures are useful to investors and analysts to assess our ongoing financial performance because, when reconciled to the most comparable GAAP measures, they provide improved comparability between periods through the exclusion of certain items that we believe are not indicative of our core operating performance and that may obscure our underlying business results and trends. These measures should not be considered a substitute for, or superior to, measures of financial performance prepared in accordance with GAAP, and our calculations thereof may not be comparable to similarly titled measures reported by other companies.
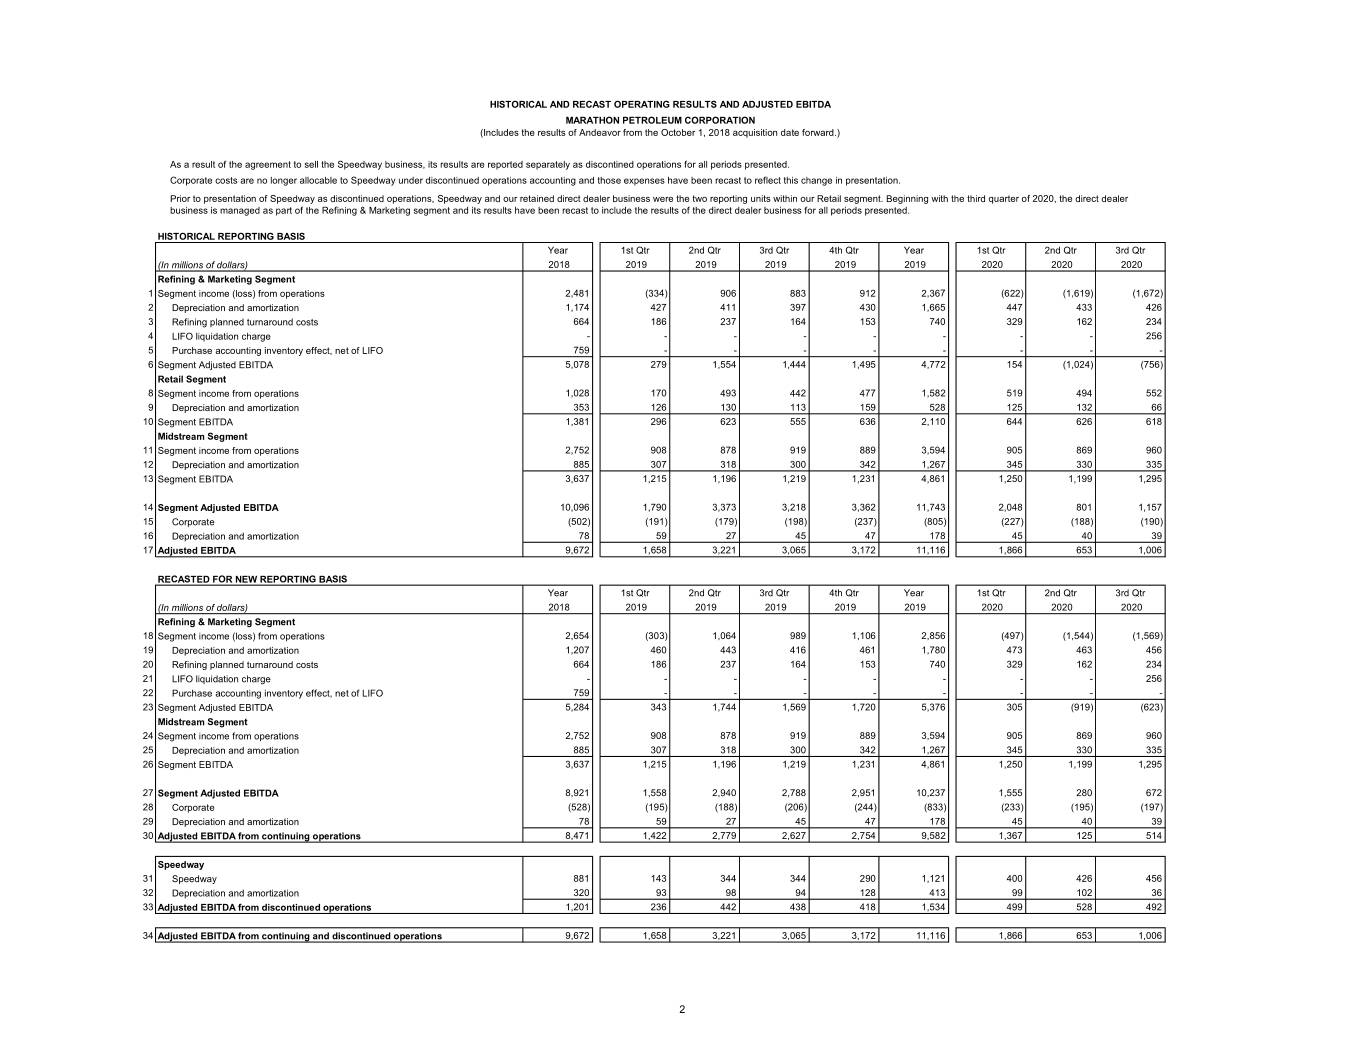
HISTORICAL AND RECAST OPERATING RESULTS AND ADJUSTED EBITDA MARATHON PETROLEUM CORPORATION (Includes the results of Andeavor from the October 1, 2018 acquisition date forward.) As a result of the agreement to sell the Speedway business, its results are reported separately as discontined operations for all periods presented. Corporate costs are no longer allocable to Speedway under discontinued operations accounting and those expenses have been recast to reflect this change in presentation. Prior to presentation of Speedway as discontinued operations, Speedway and our retained direct dealer business were the two reporting units within our Retail segment. Beginning with the third quarter of 2020, the direct dealer business is managed as part of the Refining & Marketing segment and its results have been recast to include the results of the direct dealer business for all periods presented. HISTORICAL REPORTING BASIS Year 1st Qtr 2nd Qtr 3rd Qtr 4th Qtr Year 1st Qtr 2nd Qtr 3rd Qtr (In millions of dollars) 2018 2019 2019 2019 2019 2019 2020 2020 2020 Refining & Marketing Segment 1 Segment income (loss) from operations 2,481 (334) 906 883 912 2,367 (622) (1,619) (1,672) 2 Depreciation and amortization 1,174 427 411 397 430 1,665 447 433 426 3 Refining planned turnaround costs 664 186 237 164 153 740 329 162 234 4 LIFO liquidation charge - - - - - - - - 256 5 Purchase accounting inventory effect, net of LIFO 759 - - - - - - - - 6 Segment Adjusted EBITDA 5,078 279 1,554 1,444 1,495 4,772 154 (1,024) (756) Retail Segment 8 Segment income from operations 1,028 170 493 442 477 1,582 519 494 552 9 Depreciation and amortization 353 126 130 113 159 528 125 132 66 10 Segment EBITDA 1,381 296 623 555 636 2,110 644 626 618 Midstream Segment 11 Segment income from operations 2,752 908 878 919 889 3,594 905 869 960 12 Depreciation and amortization 885 307 318 300 342 1,267 345 330 335 13 Segment EBITDA 3,637 1,215 1,196 1,219 1,231 4,861 1,250 1,199 1,295 14 Segment Adjusted EBITDA 10,096 1,790 3,373 3,218 3,362 11,743 2,048 801 1,157 15 Corporate (502) (191) (179) (198) (237) (805) (227) (188) (190) 16 Depreciation and amortization 78 59 27 45 47 178 45 40 39 17 Adjusted EBITDA 9,672 1,658 3,221 3,065 3,172 11,116 1,866 653 1,006 RECASTED FOR NEW REPORTING BASIS Year 1st Qtr 2nd Qtr 3rd Qtr 4th Qtr Year 1st Qtr 2nd Qtr 3rd Qtr (In millions of dollars) 2018 2019 2019 2019 2019 2019 2020 2020 2020 Refining & Marketing Segment 18 Segment income (loss) from operations 2,654 (303) 1,064 989 1,106 2,856 (497) (1,544) (1,569) 19 Depreciation and amortization 1,207 460 443 416 461 1,780 473 463 456 20 Refining planned turnaround costs 664 186 237 164 153 740 329 162 234 21 LIFO liquidation charge - - - - - - - - 256 22 Purchase accounting inventory effect, net of LIFO 759 - - - - - - - - 23 Segment Adjusted EBITDA 5,284 343 1,744 1,569 1,720 5,376 305 (919) (623) Midstream Segment 24 Segment income from operations 2,752 908 878 919 889 3,594 905 869 960 25 Depreciation and amortization 885 307 318 300 342 1,267 345 330 335 26 Segment EBITDA 3,637 1,215 1,196 1,219 1,231 4,861 1,250 1,199 1,295 27 Segment Adjusted EBITDA 8,921 1,558 2,940 2,788 2,951 10,237 1,555 280 672 28 Corporate (528) (195) (188) (206) (244) (833) (233) (195) (197) 29 Depreciation and amortization 78 59 27 45 47 178 45 40 39 30 Adjusted EBITDA from continuing operations 8,471 1,422 2,779 2,627 2,754 9,582 1,367 125 514 Speedway 31 Speedway 881 143 344 344 290 1,121 400 426 456 32 Depreciation and amortization 320 93 98 94 128 413 99 102 36 33 Adjusted EBITDA from discontinued operations 1,201 236 442 438 418 1,534 499 528 492 34 Adjusted EBITDA from continuing and discontinued operations 9,672 1,658 3,221 3,065 3,172 11,116 1,866 653 1,006 2
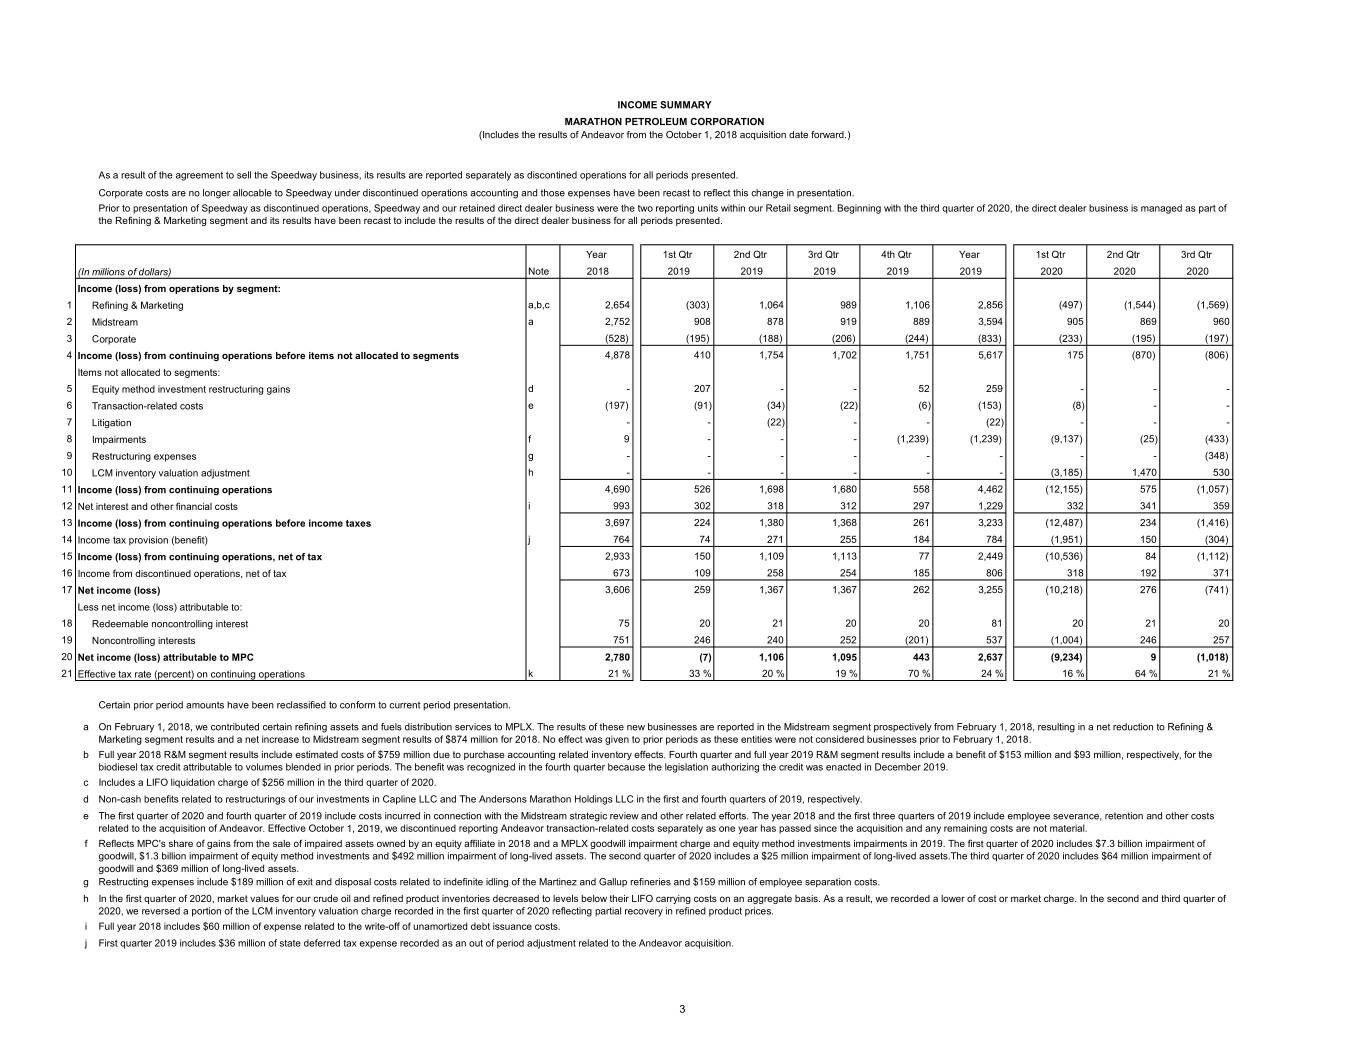
INCOME SUMMARY MARATHON PETROLEUM CORPORATION (Includes the results of Andeavor from the October 1, 2018 acquisition date forward.) As a result of the agreement to sell the Speedway business, its results are reported separately as discontined operations for all periods presented. Corporate costs are no longer allocable to Speedway under discontinued operations accounting and those expenses have been recast to reflect this change in presentation. Prior to presentation of Speedway as discontinued operations, Speedway and our retained direct dealer business were the two reporting units within our Retail segment. Beginning with the third quarter of 2020, the direct dealer business is managed as part of the Refining & Marketing segment and its results have been recast to include the results of the direct dealer business for all periods presented. Year 1st Qtr 2nd Qtr 3rd Qtr 4th Qtr Year 1st Qtr 2nd Qtr 3rd Qtr (In millions of dollars) Note 2018 2019 2019 2019 2019 2019 2020 2020 2020 Income (loss) from operations by segment: 1 Refining & Marketing a,b,c 2,654 (303) 1,064 989 1,106 2,856 (497) (1,544) (1,569) 2 Midstream a 2,752 908 878 919 889 3,594 905 869 960 3 Corporate (528) (195) (188) (206) (244) (833) (233) (195) (197) 4 Income (loss) from continuing operations before items not allocated to segments 4,878 410 1,754 1,702 1,751 5,617 175 (870) (806) Items not allocated to segments: 5 Equity method investment restructuring gains d - 207 - - 52 259 - - - 6 Transaction-related costs e (197) (91) (34) (22) (6) (153) (8) - - 7 Litigation - - (22) - - (22) - - - 8 Impairments f 9 - - - (1,239) (1,239) (9,137) (25) (433) 9 Restructuring expenses g - - - - - - - - (348) 10 LCM inventory valuation adjustment h - - - - - - (3,185) 1,470 530 11 Income (loss) from continuing operations 4,690 526 1,698 1,680 558 4,462 (12,155) 575 (1,057) 12 Net interest and other financial costs i 993 302 318 312 297 1,229 332 341 359 13 Income (loss) from continuing operations before income taxes 3,697 224 1,380 1,368 261 3,233 (12,487) 234 (1,416) 14 Income tax provision (benefit) j 764 74 271 255 184 784 (1,951) 150 (304) 15 Income (loss) from continuing operations, net of tax 2,933 150 1,109 1,113 77 2,449 (10,536) 84 (1,112) 16 Income from discontinued operations, net of tax 673 109 258 254 185 806 318 192 371 17 Net income (loss) 3,606 259 1,367 1,367 262 3,255 (10,218) 276 (741) Less net income (loss) attributable to: 18 Redeemable noncontrolling interest 75 20 21 20 20 81 20 21 20 19 Noncontrolling interests 751 246 240 252 (201) 537 (1,004) 246 257 20 Net income (loss) attributable to MPC 2,780 (7) 1,106 1,095 443 2,637 (9,234) 9 (1,018) 21 Effective tax rate (percent) on continuing operations k 21 % 33 % 20 % 19 % 70 % 24 % 16 % 64 % 21 % Certain prior period amounts have been reclassified to conform to current period presentation. a On February 1, 2018, we contributed certain refining assets and fuels distribution services to MPLX. The results of these new businesses are reported in the Midstream segment prospectively from February 1, 2018, resulting in a net reduction to Refining & Marketing segment results and a net increase to Midstream segment results of $874 million for 2018. No effect was given to prior periods as these entities were not considered businesses prior to February 1, 2018. b Full year 2018 R&M segment results include estimated costs of $759 million due to purchase accounting related inventory effects. Fourth quarter and full year 2019 R&M segment results include a benefit of $153 million and $93 million, respectively, for the biodiesel tax credit attributable to volumes blended in prior periods. The benefit was recognized in the fourth quarter because the legislation authorizing the credit was enacted in December 2019. c Includes a LIFO liquidation charge of $256 million in the third quarter of 2020. d Non-cash benefits related to restructurings of our investments in Capline LLC and The Andersons Marathon Holdings LLC in the first and fourth quarters of 2019, respectively. e The first quarter of 2020 and fourth quarter of 2019 include costs incurred in connection with the Midstream strategic review and other related efforts. The year 2018 and the first three quarters of 2019 include employee severance, retention and other costs related to the acquisition of Andeavor. Effective October 1, 2019, we discontinued reporting Andeavor transaction-related costs separately as one year has passed since the acquisition and any remaining costs are not material. f Reflects MPC's share of gains from the sale of impaired assets owned by an equity affiliate in 2018 and a MPLX goodwill impairment charge and equity method investments impairments in 2019. The first quarter of 2020 includes $7.3 billion impairment of goodwill, $1.3 billion impairment of equity method investments and $492 million impairment of long-lived assets. The second quarter of 2020 includes a $25 million impairment of long-lived assets.The third quarter of 2020 includes $64 million impairment of goodwill and $369 million of long-lived assets. g Restructing expenses include $189 million of exit and disposal costs related to indefinite idling of the Martinez and Gallup refineries and $159 million of employee separation costs. h In the first quarter of 2020, market values for our crude oil and refined product inventories decreased to levels below their LIFO carrying costs on an aggregate basis. As a result, we recorded a lower of cost or market charge. In the second and third quarter of 2020, we reversed a portion of the LCM inventory valuation charge recorded in the first quarter of 2020 reflecting partial recovery in refined product prices. i Full year 2018 includes $60 million of expense related to the write-off of unamortized debt issuance costs. j First quarter 2019 includes $36 million of state deferred tax expense recorded as an out of period adjustment related to the Andeavor acquisition. 3
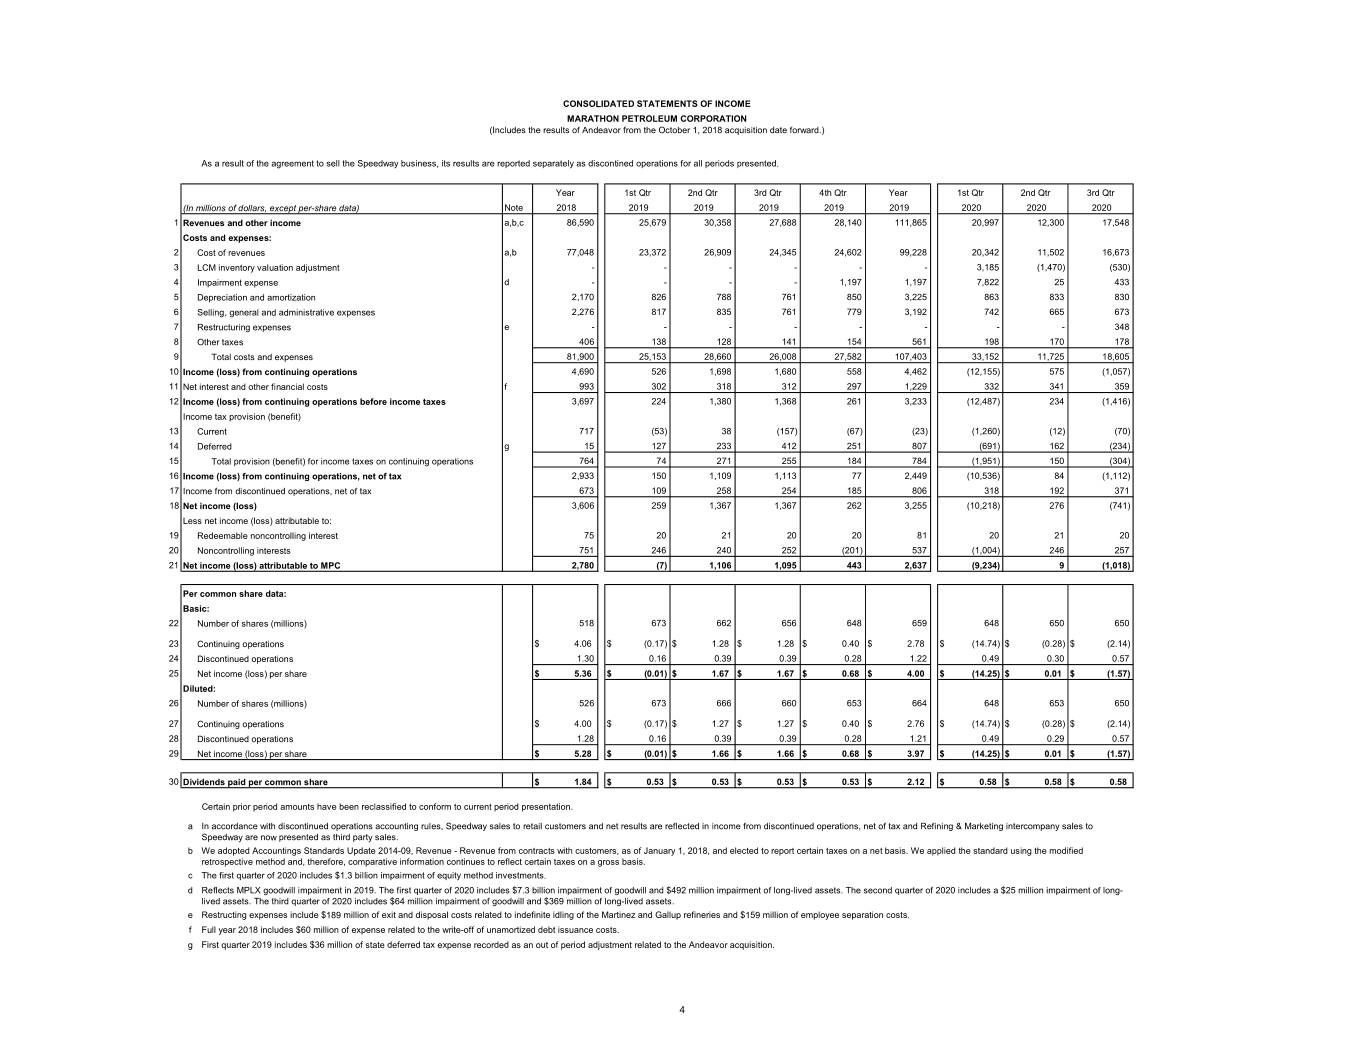
CONSOLIDATED STATEMENTS OF INCOME MARATHON PETROLEUM CORPORATION (Includes the results of Andeavor from the October 1, 2018 acquisition date forward.) As a result of the agreement to sell the Speedway business, its results are reported separately as discontined operations for all periods presented. Year 1st Qtr 2nd Qtr 3rd Qtr 4th Qtr Year 1st Qtr 2nd Qtr 3rd Qtr (In millions of dollars, except per-share data) Note 2018 2019 2019 2019 2019 2019 2020 2020 2020 1 Revenues and other income a,b,c 86,590 25,679 30,358 27,688 28,140 111,865 20,997 12,300 17,548 Costs and expenses: 2 Cost of revenues a,b 77,048 23,372 26,909 24,345 24,602 99,228 20,342 11,502 16,673 3 LCM inventory valuation adjustment - - - - - - 3,185 (1,470) (530) 4 Impairment expense d - - - - 1,197 1,197 7,822 25 433 5 Depreciation and amortization 2,170 826 788 761 850 3,225 863 833 830 6 Selling, general and administrative expenses 2,276 817 835 761 779 3,192 742 665 673 7 Restructuring expenses e - - - - - - - - 348 8 Other taxes 406 138 128 141 154 561 198 170 178 9 Total costs and expenses 81,900 25,153 28,660 26,008 27,582 107,403 33,152 11,725 18,605 10 Income (loss) from continuing operations 4,690 526 1,698 1,680 558 4,462 (12,155) 575 (1,057) 11 Net interest and other financial costs f 993 302 318 312 297 1,229 332 341 359 12 Income (loss) from continuing operations before income taxes 3,697 224 1,380 1,368 261 3,233 (12,487) 234 (1,416) Income tax provision (benefit) 13 Current 717 (53) 38 (157) (67) (23) (1,260) (12) (70) 14 Deferred g 15 127 233 412 251 807 (691) 162 (234) 15 Total provision (benefit) for income taxes on continuing operations 764 74 271 255 184 784 (1,951) 150 (304) 16 Income (loss) from continuing operations, net of tax 2,933 150 1,109 1,113 77 2,449 (10,536) 84 (1,112) 17 Income from discontinued operations, net of tax 673 109 258 254 185 806 318 192 371 18 Net income (loss) 3,606 259 1,367 1,367 262 3,255 (10,218) 276 (741) Less net income (loss) attributable to: 19 Redeemable noncontrolling interest 75 20 21 20 20 81 20 21 20 20 Noncontrolling interests 751 246 240 252 (201) 537 (1,004) 246 257 21 Net income (loss) attributable to MPC 2,780 (7) 1,106 1,095 443 2,637 (9,234) 9 (1,018) Per common share data: Basic: 22 Number of shares (millions) 518 673 662 656 648 659 648 650 650 23 Continuing operations $ 4.06 $ (0.17) $ 1.28 $ 1.28 $ 0.40 $ 2.78 $ (14.74) $ (0.28) $ (2.14) 24 Discontinued operations 1.30 0.16 0.39 0.39 0.28 1.22 0.49 0.30 0.57 25 Net income (loss) per share $ 5.36 $ (0.01) $ 1.67 $ 1.67 $ 0.68 $ 4.00 $ (14.25) $ 0.01 $ (1.57) Diluted: 26 Number of shares (millions) 526 673 666 660 653 664 648 653 650 27 Continuing operations $ 4.00 $ (0.17) $ 1.27 $ 1.27 $ 0.40 $ 2.76 $ (14.74) $ (0.28) $ (2.14) 28 Discontinued operations 1.28 0.16 0.39 0.39 0.28 1.21 0.49 0.29 0.57 29 Net income (loss) per share $ 5.28 $ (0.01) $ 1.66 $ 1.66 $ 0.68 $ 3.97 $ (14.25) $ 0.01 $ (1.57) 30 Dividends paid per common share $ 1.84 $ 0.53 $ 0.53 $ 0.53 $ 0.53 $ 2.12 $ 0.58 $ 0.58 $ 0.58 Certain prior period amounts have been reclassified to conform to current period presentation. a In accordance with discontinued operations accounting rules, Speedway sales to retail customers and net results are reflected in income from discontinued operations, net of tax and Refining & Marketing intercompany sales to Speedway are now presented as third party sales. b We adopted Accountings Standards Update 2014-09, Revenue - Revenue from contracts with customers, as of January 1, 2018, and elected to report certain taxes on a net basis. We applied the standard using the modified retrospective method and, therefore, comparative information continues to reflect certain taxes on a gross basis. c The first quarter of 2020 includes $1.3 billion impairment of equity method investments. d Reflects MPLX goodwill impairment in 2019. The first quarter of 2020 includes $7.3 billion impairment of goodwill and $492 million impairment of long-lived assets. The second quarter of 2020 includes a $25 million impairment of long- lived assets. The third quarter of 2020 includes $64 million impairment of goodwill and $369 million of long-lived assets. e Restructing expenses include $189 million of exit and disposal costs related to indefinite idling of the Martinez and Gallup refineries and $159 million of employee separation costs. f Full year 2018 includes $60 million of expense related to the write-off of unamortized debt issuance costs. g First quarter 2019 includes $36 million of state deferred tax expense recorded as an out of period adjustment related to the Andeavor acquisition. 4
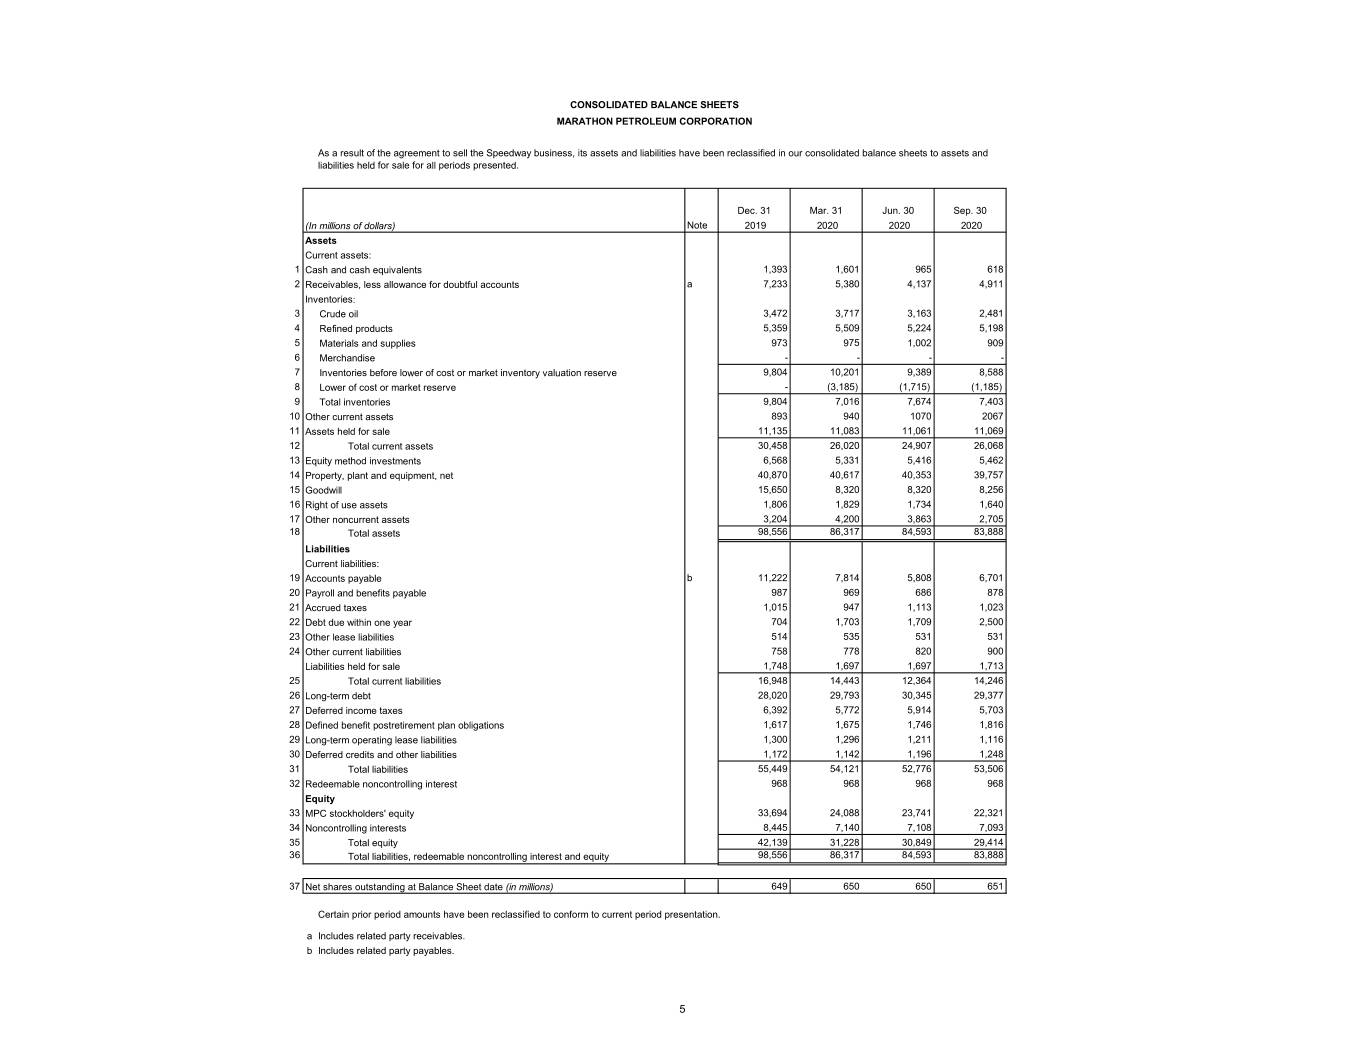
CONSOLIDATED BALANCE SHEETS MARATHON PETROLEUM CORPORATION As a result of the agreement to sell the Speedway business, its assets and liabilities have been reclassified in our consolidated balance sheets to assets and liabilities held for sale for all periods presented. Dec. 31 Mar. 31 Jun. 30 Sep. 30 (In millions of dollars) Note 2019 2020 2020 2020 Assets Current assets: 1 Cash and cash equivalents 1,393 1,601 965 618 2 Receivables, less allowance for doubtful accounts a 7,233 5,380 4,137 4,911 Inventories: 3 Crude oil 3,472 3,717 3,163 2,481 4 Refined products 5,359 5,509 5,224 5,198 5 Materials and supplies 973 975 1,002 909 6 Merchandise - - - - 7 Inventories before lower of cost or market inventory valuation reserve 9,804 10,201 9,389 8,588 8 Lower of cost or market reserve - (3,185) (1,715) (1,185) 9 Total inventories 9,804 7,016 7,674 7,403 10 Other current assets 893 940 1070 2067 11 Assets held for sale 11,135 11,083 11,061 11,069 12 Total current assets 30,458 26,020 24,907 26,068 13 Equity method investments 6,568 5,331 5,416 5,462 14 Property, plant and equipment, net 40,870 40,617 40,353 39,757 15 Goodwill 15,650 8,320 8,320 8,256 16 Right of use assets 1,806 1,829 1,734 1,640 17 Other noncurrent assets 3,204 4,200 3,863 2,705 18 Total assets 98,556 86,317 84,593 83,888 Liabilities Current liabilities: 19 Accounts payable b 11,222 7,814 5,808 6,701 20 Payroll and benefits payable 987 969 686 878 21 Accrued taxes 1,015 947 1,113 1,023 22 Debt due within one year 704 1,703 1,709 2,500 23 Other lease liabilities 514 535 531 531 24 Other current liabilities 758 778 820 900 Liabilities held for sale 1,748 1,697 1,697 1,713 25 Total current liabilities 16,948 14,443 12,364 14,246 26 Long-term debt 28,020 29,793 30,345 29,377 27 Deferred income taxes 6,392 5,772 5,914 5,703 28 Defined benefit postretirement plan obligations 1,617 1,675 1,746 1,816 29 Long-term operating lease liabilities 1,300 1,296 1,211 1,116 30 Deferred credits and other liabilities 1,172 1,142 1,196 1,248 31 Total liabilities 55,449 54,121 52,776 53,506 32 Redeemable noncontrolling interest 968 968 968 968 Equity 33 MPC stockholders' equity 33,694 24,088 23,741 22,321 34 Noncontrolling interests 8,445 7,140 7,108 7,093 35 Total equity 42,139 31,228 30,849 29,414 36 Total liabilities, redeemable noncontrolling interest and equity 98,556 86,317 84,593 83,888 37 Net shares outstanding at Balance Sheet date (in millions) 649 650 650 651 Certain prior period amounts have been reclassified to conform to current period presentation. a Includes related party receivables. b Includes related party payables. 5
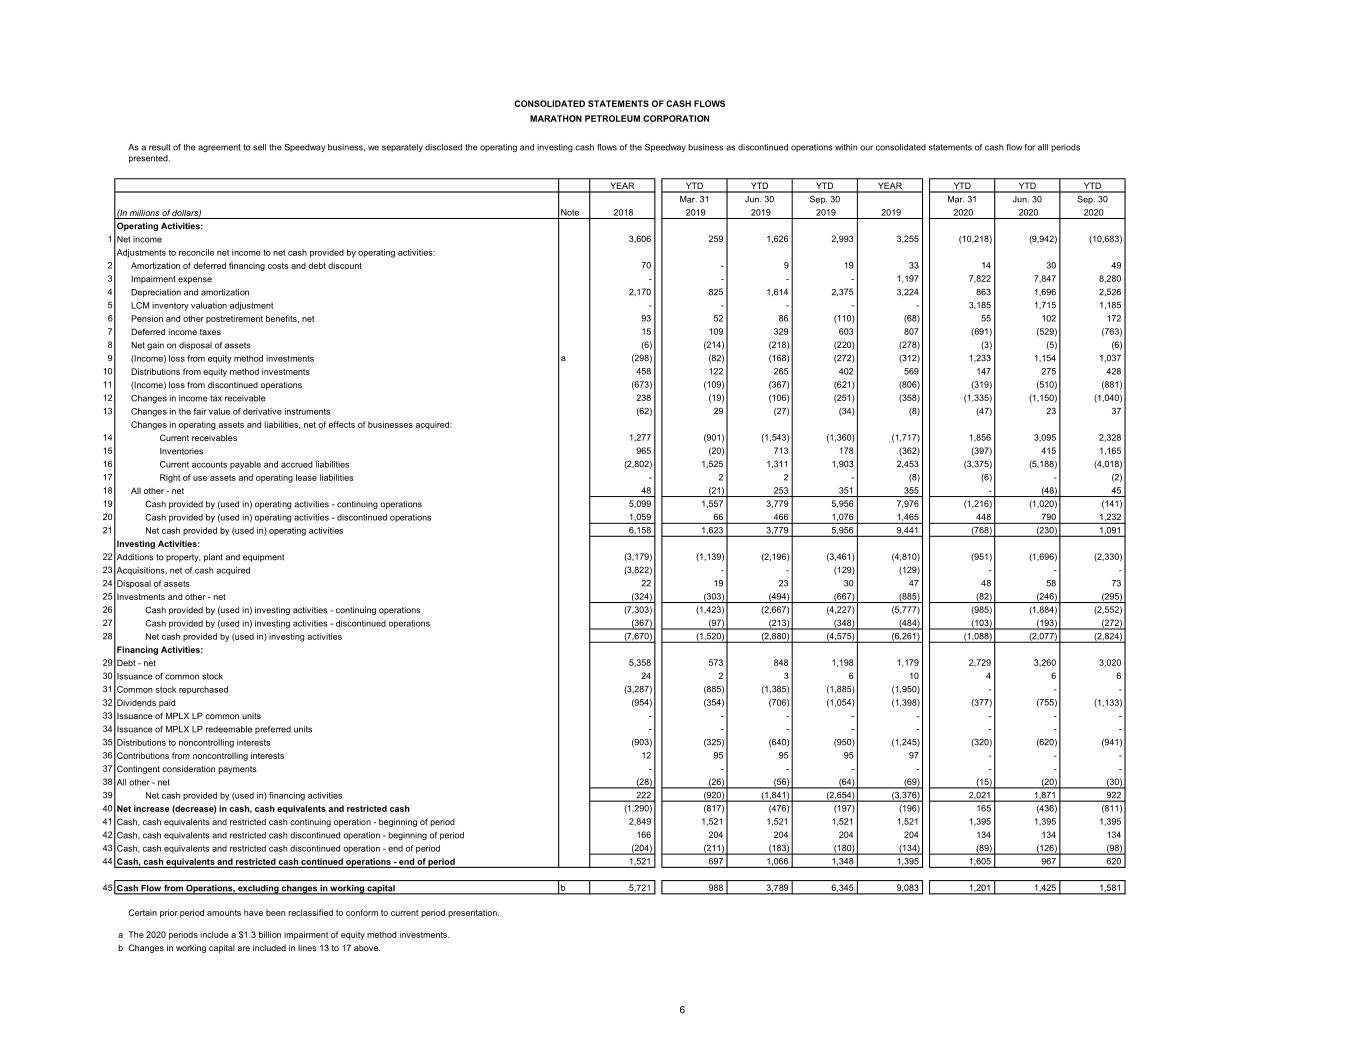
CONSOLIDATED STATEMENTS OF CASH FLOWS MARATHON PETROLEUM CORPORATION As a result of the agreement to sell the Speedway business, we separately disclosed the operating and investing cash flows of the Speedway business as discontinued operations within our consolidated statements of cash flow for alll periods presented. YEAR YTD YTD YTD YEAR YTD YTD YTD Mar. 31 Jun. 30 Sep. 30 Mar. 31 Jun. 30 Sep. 30 (In millions of dollars) Note 2018 2019 2019 2019 2019 2020 2020 2020 Operating Activities: 1 Net income 3,606 259 1,626 2,993 3,255 (10,218) (9,942) (10,683) Adjustments to reconcile net income to net cash provided by operating activities: 2 Amortization of deferred financing costs and debt discount 70 - 9 19 33 14 30 49 3 Impairment expense - - - - 1,197 7,822 7,847 8,280 4 Depreciation and amortization 2,170 825 1,614 2,375 3,224 863 1,696 2,526 5 LCM inventory valuation adjustment - - - - - 3,185 1,715 1,185 6 Pension and other postretirement benefits, net 93 52 86 (110) (68) 55 102 172 7 Deferred income taxes 15 109 329 603 807 (691) (529) (763) 8 Net gain on disposal of assets (6) (214) (218) (220) (278) (3) (5) (6) 9 (Income) loss from equity method investments a (298) (82) (168) (272) (312) 1,233 1,154 1,037 10 Distributions from equity method investments 458 122 265 402 569 147 275 428 11 (Income) loss from discontinued operations (673) (109) (367) (621) (806) (319) (510) (881) 12 Changes in income tax receivable 238 (19) (106) (251) (358) (1,335) (1,150) (1,040) 13 Changes in the fair value of derivative instruments (62) 29 (27) (34) (8) (47) 23 37 Changes in operating assets and liabilities, net of effects of businesses acquired: 14 Current receivables 1,277 (901) (1,543) (1,360) (1,717) 1,856 3,095 2,328 15 Inventories 965 (20) 713 178 (362) (397) 415 1,165 16 Current accounts payable and accrued liabilities (2,802) 1,525 1,311 1,903 2,453 (3,375) (5,188) (4,018) 17 Right of use assets and operating lease liabilities - 2 2 - (8) (6) - (2) 18 All other - net 48 (21) 253 351 355 - (48) 45 19 Cash provided by (used in) operating activities - continuing operations 5,099 1,557 3,779 5,956 7,976 (1,216) (1,020) (141) 20 Cash provided by (used in) operating activities - discontinued operations 1,059 66 466 1,076 1,465 448 790 1,232 21 Net cash provided by (used in) operating activities 6,158 1,623 3,779 5,956 9,441 (768) (230) 1,091 Investing Activities: 22 Additions to property, plant and equipment (3,179) (1,139) (2,196) (3,461) (4,810) (951) (1,696) (2,330) 23 Acquisitions, net of cash acquired (3,822) - - (129) (129) - - - 24 Disposal of assets 22 19 23 30 47 48 58 73 25 Investments and other - net (324) (303) (494) (667) (885) (82) (246) (295) 26 Cash provided by (used in) investing activities - continuing operations (7,303) (1,423) (2,667) (4,227) (5,777) (985) (1,884) (2,552) 27 Cash provided by (used in) investing activities - discontinued operations (367) (97) (213) (348) (484) (103) (193) (272) 28 Net cash provided by (used in) investing activities (7,670) (1,520) (2,880) (4,575) (6,261) (1,088) (2,077) (2,824) Financing Activities: 29 Debt - net 5,358 573 848 1,198 1,179 2,729 3,260 3,020 30 Issuance of common stock 24 2 3 6 10 4 6 6 31 Common stock repurchased (3,287) (885) (1,385) (1,885) (1,950) - - - 32 Dividends paid (954) (354) (706) (1,054) (1,398) (377) (755) (1,133) 33 Issuance of MPLX LP common units - - - - - - - - 34 Issuance of MPLX LP redeemable preferred units - - - - - - - - 35 Distributions to noncontrolling interests (903) (325) (640) (950) (1,245) (320) (620) (941) 36 Contributions from noncontrolling interests 12 95 95 95 97 - - - 37 Contingent consideration payments - - - - - - - - 38 All other - net (28) (26) (56) (64) (69) (15) (20) (30) 39 Net cash provided by (used in) financing activities 222 (920) (1,841) (2,654) (3,376) 2,021 1,871 922 40 Net increase (decrease) in cash, cash equivalents and restricted cash (1,290) (817) (476) (197) (196) 165 (436) (811) 41 Cash, cash equivalents and restricted cash continuing operation - beginning of period 2,849 1,521 1,521 1,521 1,521 1,395 1,395 1,395 42 Cash, cash equivalents and restricted cash discontinued operation - beginning of period 166 204 204 204 204 134 134 134 43 Cash, cash equivalents and restricted cash discontinued operation - end of period (204) (211) (183) (180) (134) (89) (126) (98) 44 Cash, cash equivalents and restricted cash continued operations - end of period 1,521 697 1,066 1,348 1,395 1,605 967 620 45 Cash Flow from Operations, excluding changes in working capital b 5,721 988 3,789 6,345 9,083 1,201 1,425 1,581 Certain prior period amounts have been reclassified to conform to current period presentation. a The 2020 periods include a $1.3 billion impairment of equity method investments. b Changes in working capital are included in lines 13 to 17 above. 6
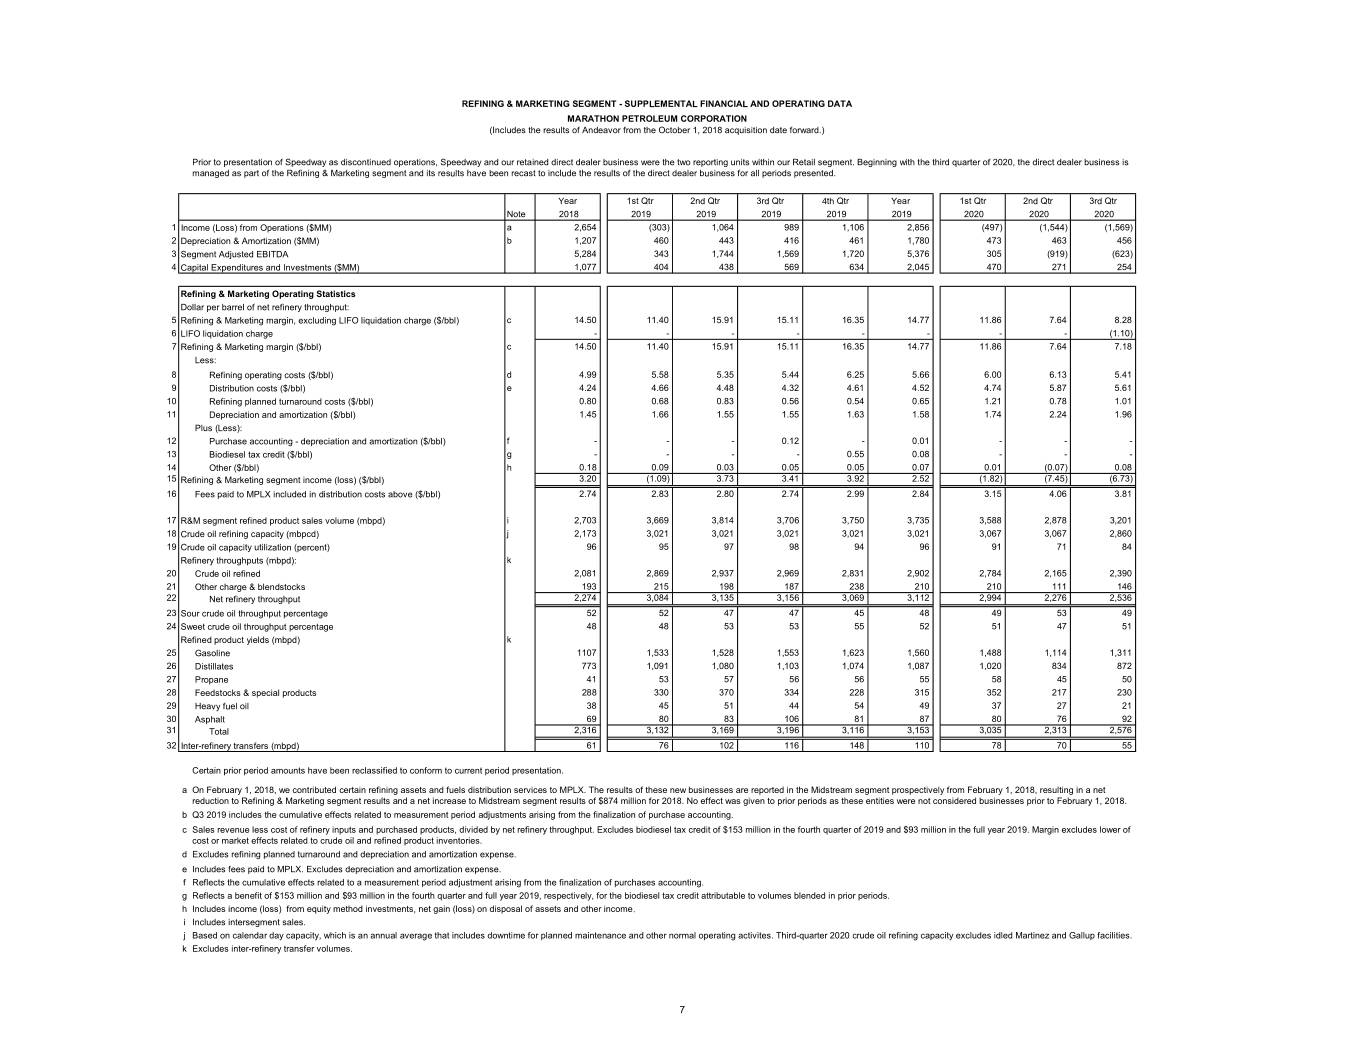
REFINING & MARKETING SEGMENT - SUPPLEMENTAL FINANCIAL AND OPERATING DATA MARATHON PETROLEUM CORPORATION (Includes the results of Andeavor from the October 1, 2018 acquisition date forward.) Prior to presentation of Speedway as discontinued operations, Speedway and our retained direct dealer business were the two reporting units within our Retail segment. Beginning with the third quarter of 2020, the direct dealer business is managed as part of the Refining & Marketing segment and its results have been recast to include the results of the direct dealer business for all periods presented. Year 1st Qtr 2nd Qtr 3rd Qtr 4th Qtr Year 1st Qtr 2nd Qtr 3rd Qtr Note 2018 2019 2019 2019 2019 2019 2020 2020 2020 1 Income (Loss) from Operations ($MM) a 2,654 (303) 1,064 989 1,106 2,856 (497) (1,544) (1,569) 2 Depreciation & Amortization ($MM) b 1,207 460 443 416 461 1,780 473 463 456 3 Segment Adjusted EBITDA 5,284 343 1,744 1,569 1,720 5,376 305 (919) (623) 4 Capital Expenditures and Investments ($MM) 1,077 404 438 569 634 2,045 470 271 254 Refining & Marketing Operating Statistics Dollar per barrel of net refinery throughput: 5 Refining & Marketing margin, excluding LIFO liquidation charge ($/bbl) c 14.50 11.40 15.91 15.11 16.35 14.77 11.86 7.64 8.28 6 LIFO liquidation charge - - - - - - - - (1.10) 7 Refining & Marketing margin ($/bbl) c 14.50 11.40 15.91 15.11 16.35 14.77 11.86 7.64 7.18 Less: 8 Refining operating costs ($/bbl) d 4.99 5.58 5.35 5.44 6.25 5.66 6.00 6.13 5.41 9 Distribution costs ($/bbl) e 4.24 4.66 4.48 4.32 4.61 4.52 4.74 5.87 5.61 10 Refining planned turnaround costs ($/bbl) 0.80 0.68 0.83 0.56 0.54 0.65 1.21 0.78 1.01 11 Depreciation and amortization ($/bbl) 1.45 1.66 1.55 1.55 1.63 1.58 1.74 2.24 1.96 Plus (Less): 12 Purchase accounting - depreciation and amortization ($/bbl) f - - - 0.12 - 0.01 - - - 13 Biodiesel tax credit ($/bbl) g - - - - 0.55 0.08 - - - 14 Other ($/bbl) h 0.18 0.09 0.03 0.05 0.05 0.07 0.01 (0.07) 0.08 15 Refining & Marketing segment income (loss) ($/bbl) 3.20 (1.09) 3.73 3.41 3.92 2.52 (1.82) (7.45) (6.73) 16 Fees paid to MPLX included in distribution costs above ($/bbl) 2.74 2.83 2.80 2.74 2.99 2.84 3.15 4.06 3.81 17 R&M segment refined product sales volume (mbpd) i 2,703 3,669 3,814 3,706 3,750 3,735 3,588 2,878 3,201 18 Crude oil refining capacity (mbpcd) j 2,173 3,021 3,021 3,021 3,021 3,021 3,067 3,067 2,860 19 Crude oil capacity utilization (percent) 96 95 97 98 94 96 91 71 84 Refinery throughputs (mbpd): k 20 Crude oil refined 2,081 2,869 2,937 2,969 2,831 2,902 2,784 2,165 2,390 21 Other charge & blendstocks 193 215 198 187 238 210 210 111 146 22 Net refinery throughput 2,274 3,084 3,135 3,156 3,069 3,112 2,994 2,276 2,536 23 Sour crude oil throughput percentage 52 52 47 47 45 48 49 53 49 24 Sweet crude oil throughput percentage 48 48 53 53 55 52 51 47 51 Refined product yields (mbpd) k 25 Gasoline 1107 1,533 1,528 1,553 1,623 1,560 1,488 1,114 1,311 26 Distillates 773 1,091 1,080 1,103 1,074 1,087 1,020 834 872 27 Propane 41 53 57 56 56 55 58 45 50 28 Feedstocks & special products 288 330 370 334 228 315 352 217 230 29 Heavy fuel oil 38 45 51 44 54 49 37 27 21 30 Asphalt 69 80 83 106 81 87 80 76 92 31 Total 2,316 3,132 3,169 3,196 3,116 3,153 3,035 2,313 2,576 32 Inter-refinery transfers (mbpd) 61 76 102 116 148 110 78 70 55 Certain prior period amounts have been reclassified to conform to current period presentation. a On February 1, 2018, we contributed certain refining assets and fuels distribution services to MPLX. The results of these new businesses are reported in the Midstream segment prospectively from February 1, 2018, resulting in a net reduction to Refining & Marketing segment results and a net increase to Midstream segment results of $874 million for 2018. No effect was given to prior periods as these entities were not considered businesses prior to February 1, 2018. b Q3 2019 includes the cumulative effects related to measurement period adjustments arising from the finalization of purchase accounting. c Sales revenue less cost of refinery inputs and purchased products, divided by net refinery throughput. Excludes biodiesel tax credit of $153 million in the fourth quarter of 2019 and $93 million in the full year 2019. Margin excludes lower of cost or market effects related to crude oil and refined product inventories. d Excludes refining planned turnaround and depreciation and amortization expense. e Includes fees paid to MPLX. Excludes depreciation and amortization expense. f Reflects the cumulative effects related to a measurement period adjustment arising from the finalization of purchases accounting. g Reflects a benefit of $153 million and $93 million in the fourth quarter and full year 2019, respectively, for the biodiesel tax credit attributable to volumes blended in prior periods. h Includes income (loss) from equity method investments, net gain (loss) on disposal of assets and other income. i Includes intersegment sales. j Based on calendar day capacity, which is an annual average that includes downtime for planned maintenance and other normal operating activites. Third-quarter 2020 crude oil refining capacity excludes idled Martinez and Gallup facilities. k Excludes inter-refinery transfer volumes. 7
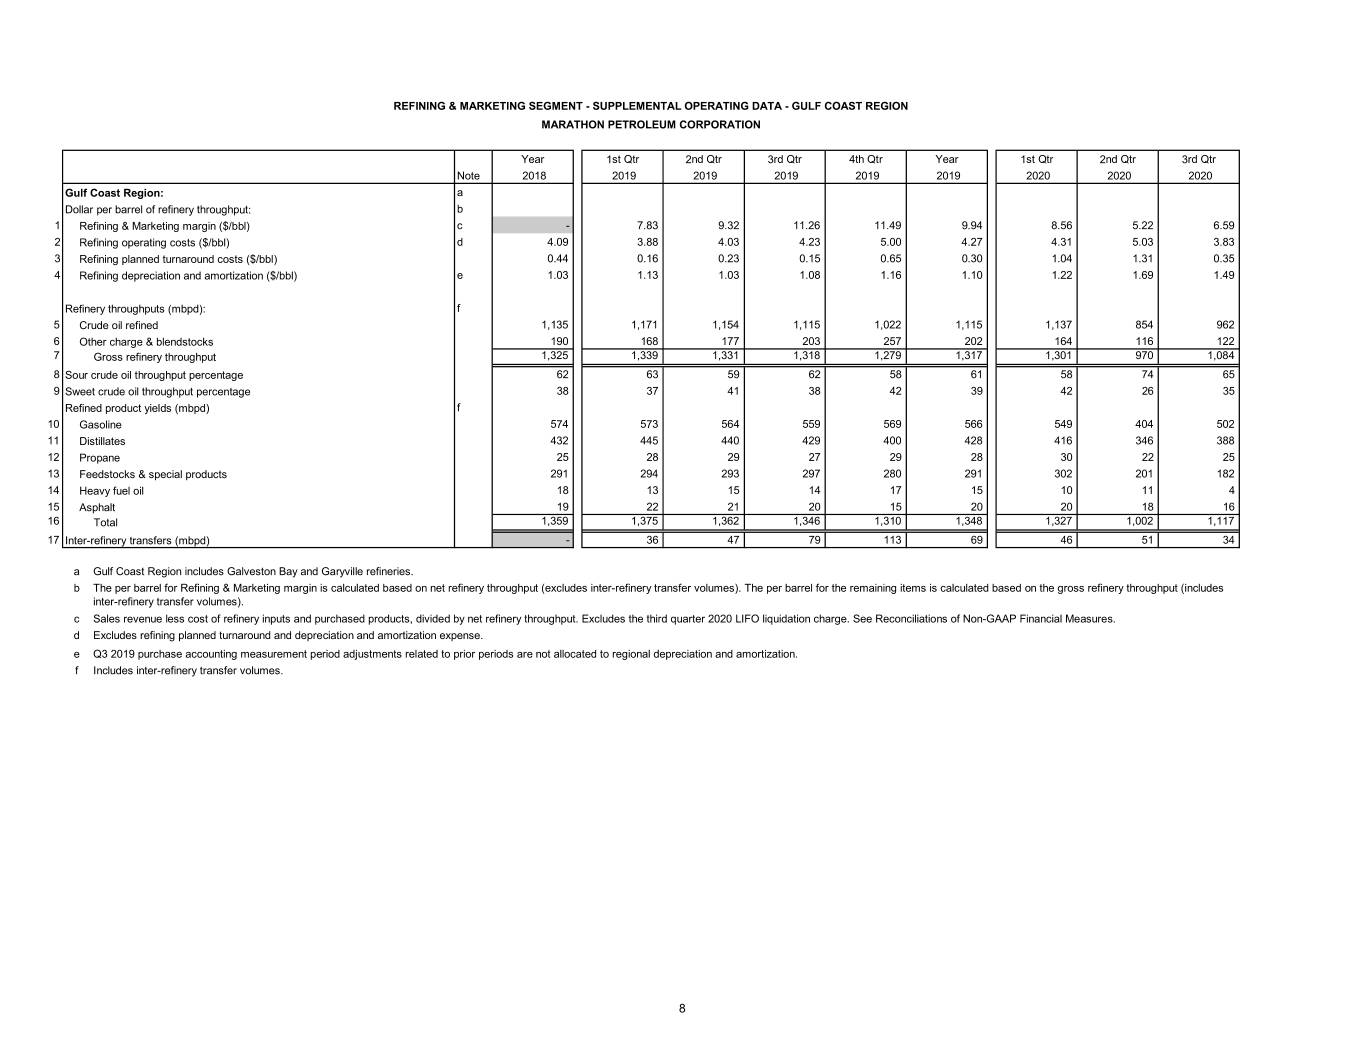
REFINING & MARKETING SEGMENT - SUPPLEMENTAL OPERATING DATA - GULF COAST REGION MARATHON PETROLEUM CORPORATION Year 1st Qtr 2nd Qtr 3rd Qtr 4th Qtr Year 1st Qtr 2nd Qtr 3rd Qtr Note 2018 2019 2019 2019 2019 2019 2020 2020 2020 Gulf Coast Region: a Dollar per barrel of refinery throughput: b 1 Refining & Marketing margin ($/bbl) c - 7.83 9.32 11.26 11.49 9.94 8.56 5.22 6.59 2 Refining operating costs ($/bbl) d 4.09 3.88 4.03 4.23 5.00 4.27 4.31 5.03 3.83 3 Refining planned turnaround costs ($/bbl) 0.44 0.16 0.23 0.15 0.65 0.30 1.04 1.31 0.35 4 Refining depreciation and amortization ($/bbl) e 1.03 1.13 1.03 1.08 1.16 1.10 1.22 1.69 1.49 Refinery throughputs (mbpd): f 5 Crude oil refined 1,135 1,171 1,154 1,115 1,022 1,115 1,137 854 962 6 Other charge & blendstocks 190 168 177 203 257 202 164 116 122 7 Gross refinery throughput 1,325 1,339 1,331 1,318 1,279 1,317 1,301 970 1,084 8 Sour crude oil throughput percentage 62 63 59 62 58 61 58 74 65 9 Sweet crude oil throughput percentage 38 37 41 38 42 39 42 26 35 Refined product yields (mbpd) f 10 Gasoline 574 573 564 559 569 566 549 404 502 11 Distillates 432 445 440 429 400 428 416 346 388 12 Propane 25 28 29 27 29 28 30 22 25 13 Feedstocks & special products 291 294 293 297 280 291 302 201 182 14 Heavy fuel oil 18 13 15 14 17 15 10 11 4 15 Asphalt 19 22 21 20 15 20 20 18 16 16 Total 1,359 1,375 1,362 1,346 1,310 1,348 1,327 1,002 1,117 17 Inter-refinery transfers (mbpd) - 36 47 79 113 69 46 51 34 a Gulf Coast Region includes Galveston Bay and Garyville refineries. b The per barrel for Refining & Marketing margin is calculated based on net refinery throughput (excludes inter-refinery transfer volumes). The per barrel for the remaining items is calculated based on the gross refinery throughput (includes inter-refinery transfer volumes). c Sales revenue less cost of refinery inputs and purchased products, divided by net refinery throughput. Excludes the third quarter 2020 LIFO liquidation charge. See Reconciliations of Non-GAAP Financial Measures. d Excludes refining planned turnaround and depreciation and amortization expense. e Q3 2019 purchase accounting measurement period adjustments related to prior periods are not allocated to regional depreciation and amortization. f Includes inter-refinery transfer volumes. 8
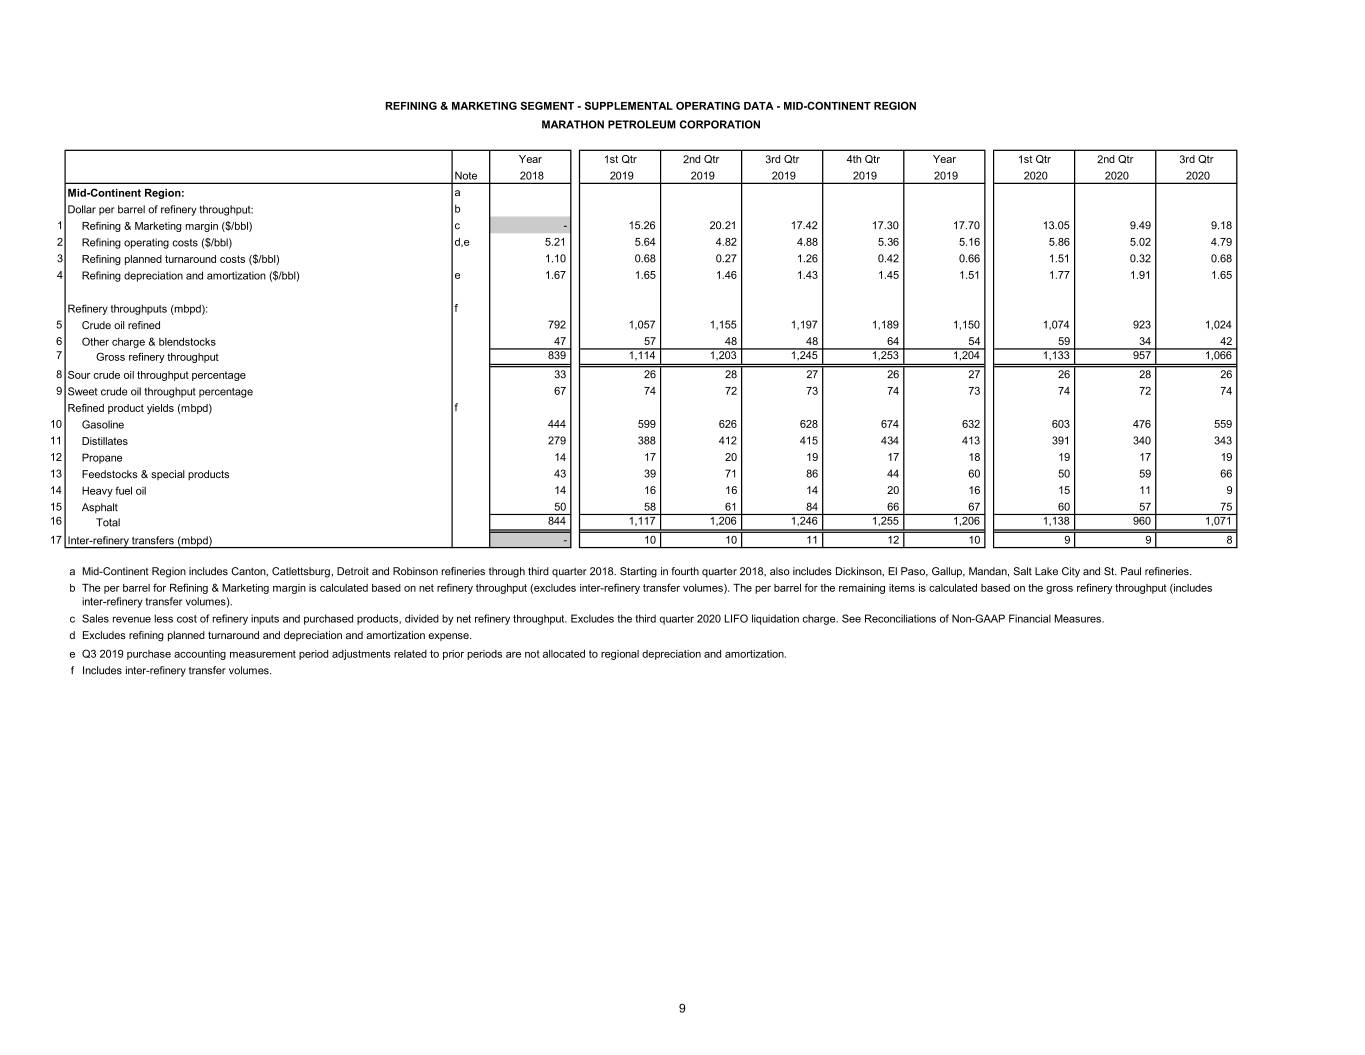
REFINING & MARKETING SEGMENT - SUPPLEMENTAL OPERATING DATA - MID-CONTINENT REGION MARATHON PETROLEUM CORPORATION Year 1st Qtr 2nd Qtr 3rd Qtr 4th Qtr Year 1st Qtr 2nd Qtr 3rd Qtr Note 2018 2019 2019 2019 2019 2019 2020 2020 2020 Mid-Continent Region: a Dollar per barrel of refinery throughput: b 1 Refining & Marketing margin ($/bbl) c - 15.26 20.21 17.42 17.30 17.70 13.05 9.49 9.18 2 Refining operating costs ($/bbl) d,e 5.21 5.64 4.82 4.88 5.36 5.16 5.86 5.02 4.79 3 Refining planned turnaround costs ($/bbl) 1.10 0.68 0.27 1.26 0.42 0.66 1.51 0.32 0.68 4 Refining depreciation and amortization ($/bbl) e 1.67 1.65 1.46 1.43 1.45 1.51 1.77 1.91 1.65 Refinery throughputs (mbpd): f 5 Crude oil refined 792 1,057 1,155 1,197 1,189 1,150 1,074 923 1,024 6 Other charge & blendstocks 47 57 48 48 64 54 59 34 42 7 Gross refinery throughput 839 1,114 1,203 1,245 1,253 1,204 1,133 957 1,066 8 Sour crude oil throughput percentage 33 26 28 27 26 27 26 28 26 9 Sweet crude oil throughput percentage 67 74 72 73 74 73 74 72 74 Refined product yields (mbpd) f 10 Gasoline 444 599 626 628 674 632 603 476 559 11 Distillates 279 388 412 415 434 413 391 340 343 12 Propane 14 17 20 19 17 18 19 17 19 13 Feedstocks & special products 43 39 71 86 44 60 50 59 66 14 Heavy fuel oil 14 16 16 14 20 16 15 11 9 15 Asphalt 50 58 61 84 66 67 60 57 75 16 Total 844 1,117 1,206 1,246 1,255 1,206 1,138 960 1,071 17 Inter-refinery transfers (mbpd) - 10 10 11 12 10 9 9 8 a Mid-Continent Region includes Canton, Catlettsburg, Detroit and Robinson refineries through third quarter 2018. Starting in fourth quarter 2018, also includes Dickinson, El Paso, Gallup, Mandan, Salt Lake City and St. Paul refineries. b The per barrel for Refining & Marketing margin is calculated based on net refinery throughput (excludes inter-refinery transfer volumes). The per barrel for the remaining items is calculated based on the gross refinery throughput (includes inter-refinery transfer volumes). c Sales revenue less cost of refinery inputs and purchased products, divided by net refinery throughput. Excludes the third quarter 2020 LIFO liquidation charge. See Reconciliations of Non-GAAP Financial Measures. d Excludes refining planned turnaround and depreciation and amortization expense. e Q3 2019 purchase accounting measurement period adjustments related to prior periods are not allocated to regional depreciation and amortization. f Includes inter-refinery transfer volumes. 9
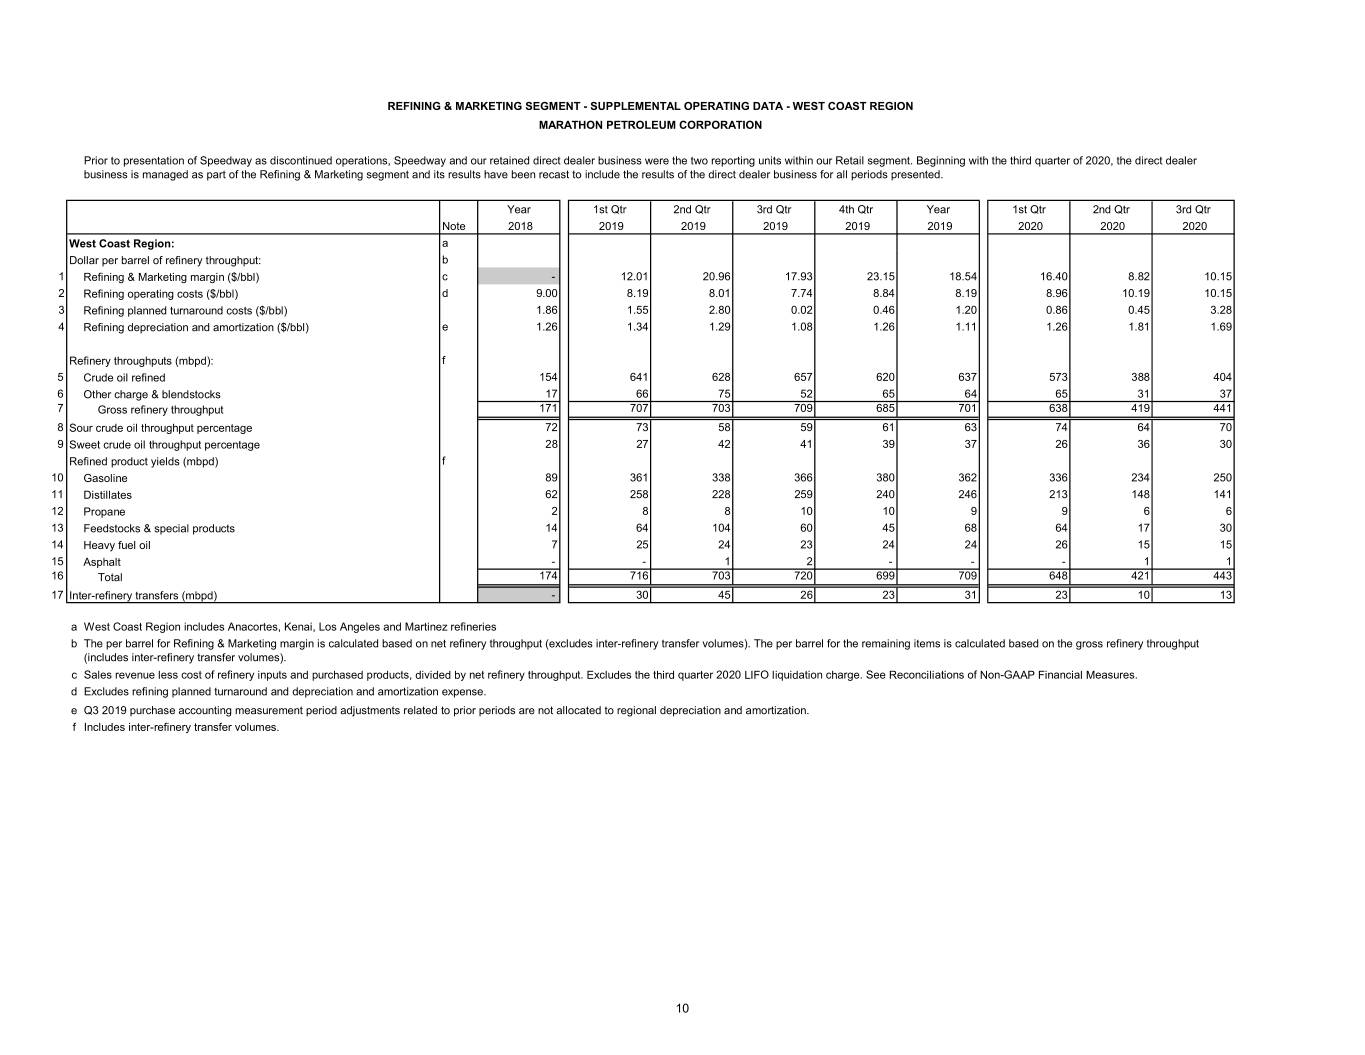
REFINING & MARKETING SEGMENT - SUPPLEMENTAL OPERATING DATA - WEST COAST REGION MARATHON PETROLEUM CORPORATION Prior to presentation of Speedway as discontinued operations, Speedway and our retained direct dealer business were the two reporting units within our Retail segment. Beginning with the third quarter of 2020, the direct dealer business is managed as part of the Refining & Marketing segment and its results have been recast to include the results of the direct dealer business for all periods presented. Year 1st Qtr 2nd Qtr 3rd Qtr 4th Qtr Year 1st Qtr 2nd Qtr 3rd Qtr Note 2018 2019 2019 2019 2019 2019 2020 2020 2020 West Coast Region: a Dollar per barrel of refinery throughput: b 1 Refining & Marketing margin ($/bbl) c - 12.01 20.96 17.93 23.15 18.54 16.40 8.82 10.15 2 Refining operating costs ($/bbl) d 9.00 8.19 8.01 7.74 8.84 8.19 8.96 10.19 10.15 3 Refining planned turnaround costs ($/bbl) 1.86 1.55 2.80 0.02 0.46 1.20 0.86 0.45 3.28 4 Refining depreciation and amortization ($/bbl) e 1.26 1.34 1.29 1.08 1.26 1.11 1.26 1.81 1.69 Refinery throughputs (mbpd): f 5 Crude oil refined 154 641 628 657 620 637 573 388 404 6 Other charge & blendstocks 17 66 75 52 65 64 65 31 37 7 Gross refinery throughput 171 707 703 709 685 701 638 419 441 8 Sour crude oil throughput percentage 72 73 58 59 61 63 74 64 70 9 Sweet crude oil throughput percentage 28 27 42 41 39 37 26 36 30 Refined product yields (mbpd) f 10 Gasoline 89 361 338 366 380 362 336 234 250 11 Distillates 62 258 228 259 240 246 213 148 141 12 Propane 2 8 8 10 10 9 9 6 6 13 Feedstocks & special products 14 64 104 60 45 68 64 17 30 14 Heavy fuel oil 7 25 24 23 24 24 26 15 15 15 Asphalt - - 1 2 - - - 1 1 16 Total 174 716 703 720 699 709 648 421 443 17 Inter-refinery transfers (mbpd) - 30 45 26 23 31 23 10 13 a West Coast Region includes Anacortes, Kenai, Los Angeles and Martinez refineries b The per barrel for Refining & Marketing margin is calculated based on net refinery throughput (excludes inter-refinery transfer volumes). The per barrel for the remaining items is calculated based on the gross refinery throughput (includes inter-refinery transfer volumes). c Sales revenue less cost of refinery inputs and purchased products, divided by net refinery throughput. Excludes the third quarter 2020 LIFO liquidation charge. See Reconciliations of Non-GAAP Financial Measures. d Excludes refining planned turnaround and depreciation and amortization expense. e Q3 2019 purchase accounting measurement period adjustments related to prior periods are not allocated to regional depreciation and amortization. f Includes inter-refinery transfer volumes. 10
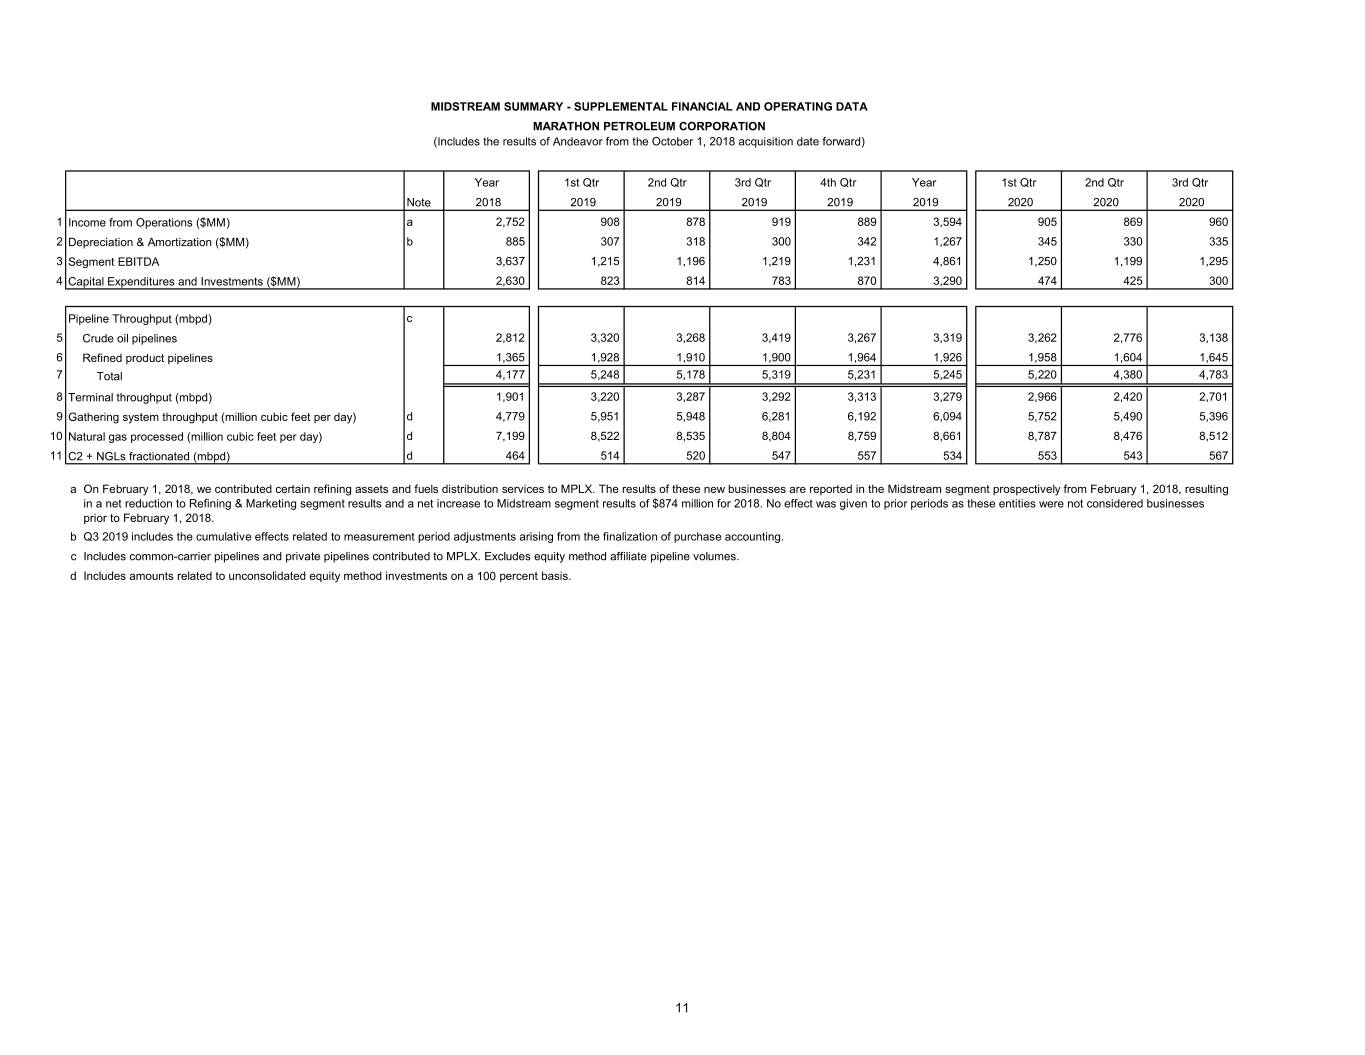
MIDSTREAM SUMMARY - SUPPLEMENTAL FINANCIAL AND OPERATING DATA MARATHON PETROLEUM CORPORATION (Includes the results of Andeavor from the October 1, 2018 acquisition date forward) Year 1st Qtr 2nd Qtr 3rd Qtr 4th Qtr Year 1st Qtr 2nd Qtr 3rd Qtr Note 2018 2019 2019 2019 2019 2019 2020 2020 2020 1 Income from Operations ($MM) a 2,752 908 878 919 889 3,594 905 869 960 2 Depreciation & Amortization ($MM) b 885 307 318 300 342 1,267 345 330 335 3 Segment EBITDA 3,637 1,215 1,196 1,219 1,231 4,861 1,250 1,199 1,295 4 Capital Expenditures and Investments ($MM) 2,630 823 814 783 870 3,290 474 425 300 Pipeline Throughput (mbpd) c 5 Crude oil pipelines 2,812 3,320 3,268 3,419 3,267 3,319 3,262 2,776 3,138 6 Refined product pipelines 1,365 1,928 1,910 1,900 1,964 1,926 1,958 1,604 1,645 7 Total 4,177 5,248 5,178 5,319 5,231 5,245 5,220 4,380 4,783 8 Terminal throughput (mbpd) 1,901 3,220 3,287 3,292 3,313 3,279 2,966 2,420 2,701 9 Gathering system throughput (million cubic feet per day) d 4,779 5,951 5,948 6,281 6,192 6,094 5,752 5,490 5,396 10 Natural gas processed (million cubic feet per day) d 7,199 8,522 8,535 8,804 8,759 8,661 8,787 8,476 8,512 11 C2 + NGLs fractionated (mbpd) d 464 514 520 547 557 534 553 543 567 a On February 1, 2018, we contributed certain refining assets and fuels distribution services to MPLX. The results of these new businesses are reported in the Midstream segment prospectively from February 1, 2018, resulting in a net reduction to Refining & Marketing segment results and a net increase to Midstream segment results of $874 million for 2018. No effect was given to prior periods as these entities were not considered businesses prior to February 1, 2018. b Q3 2019 includes the cumulative effects related to measurement period adjustments arising from the finalization of purchase accounting. c Includes common-carrier pipelines and private pipelines contributed to MPLX. Excludes equity method affiliate pipeline volumes. d Includes amounts related to unconsolidated equity method investments on a 100 percent basis. 11
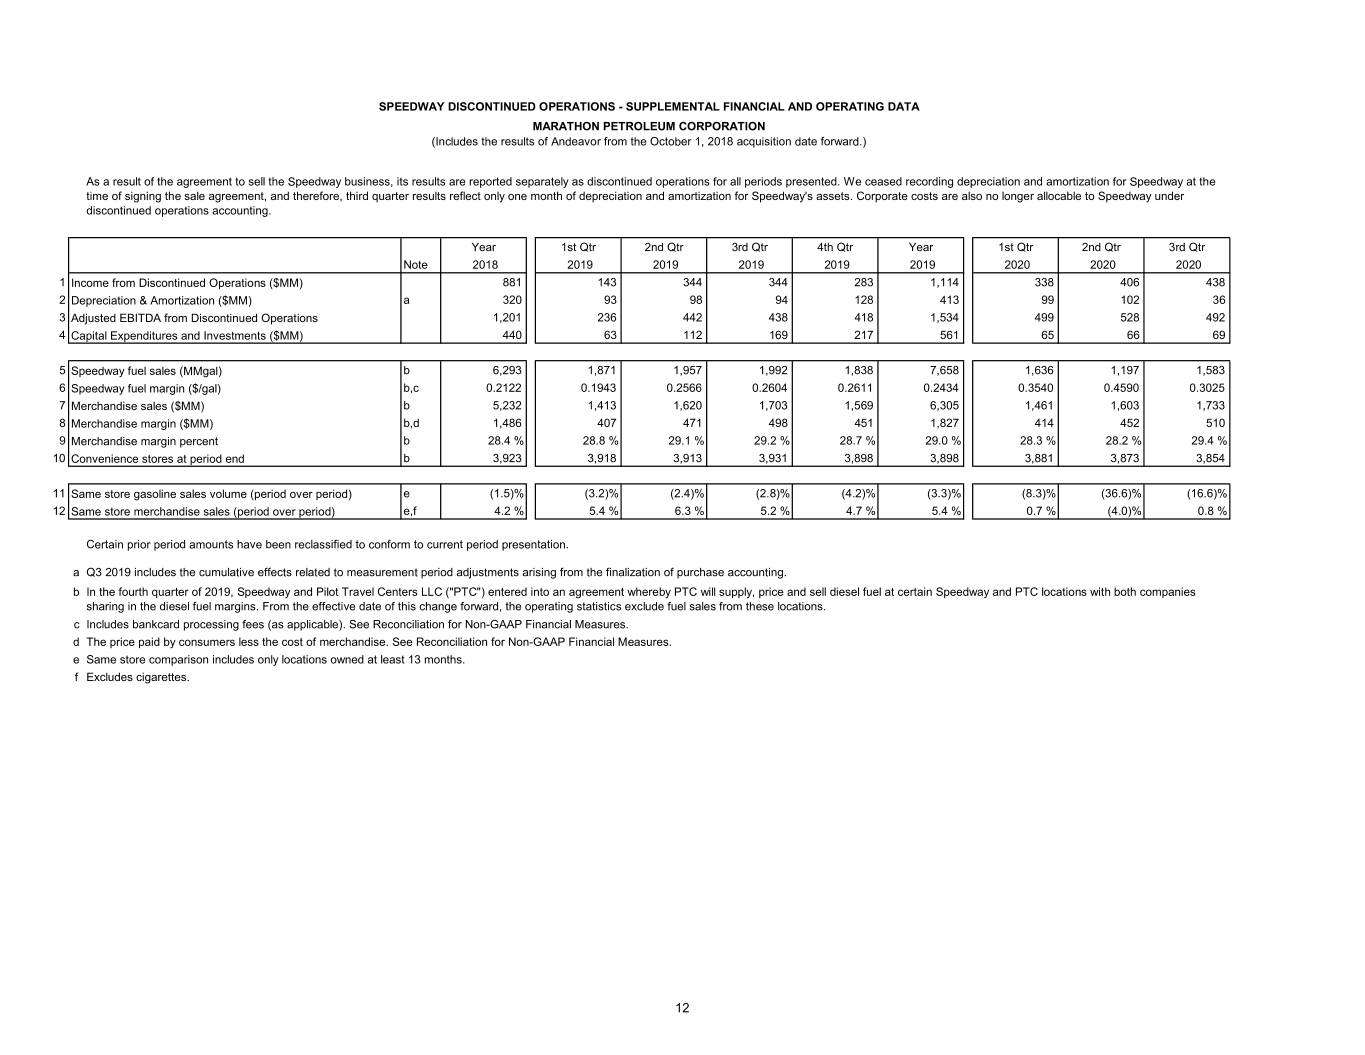
SPEEDWAY DISCONTINUED OPERATIONS - SUPPLEMENTAL FINANCIAL AND OPERATING DATA MARATHON PETROLEUM CORPORATION (Includes the results of Andeavor from the October 1, 2018 acquisition date forward.) As a result of the agreement to sell the Speedway business, its results are reported separately as discontinued operations for all periods presented. We ceased recording depreciation and amortization for Speedway at the time of signing the sale agreement, and therefore, third quarter results reflect only one month of depreciation and amortization for Speedway's assets. Corporate costs are also no longer allocable to Speedway under discontinued operations accounting. Year 1st Qtr 2nd Qtr 3rd Qtr 4th Qtr Year 1st Qtr 2nd Qtr 3rd Qtr Note 2018 2019 2019 2019 2019 2019 2020 2020 2020 1 Income from Discontinued Operations ($MM) 881 143 344 344 283 1,114 338 406 438 2 Depreciation & Amortization ($MM) a 320 93 98 94 128 413 99 102 36 3 Adjusted EBITDA from Discontinued Operations 1,201 236 442 438 418 1,534 499 528 492 4 Capital Expenditures and Investments ($MM) 440 63 112 169 217 561 65 66 69 5 Speedway fuel sales (MMgal) b 6,293 1,871 1,957 1,992 1,838 7,658 1,636 1,197 1,583 6 Speedway fuel margin ($/gal) b,c 0.2122 0.1943 0.2566 0.2604 0.2611 0.2434 0.3540 0.4590 0.3025 7 Merchandise sales ($MM) b 5,232 1,413 1,620 1,703 1,569 6,305 1,461 1,603 1,733 8 Merchandise margin ($MM) b,d 1,486 407 471 498 451 1,827 414 452 510 9 Merchandise margin percent b 28.4 % 28.8 % 29.1 % 29.2 % 28.7 % 29.0 % 28.3 % 28.2 % 29.4 % 10 Convenience stores at period end b 3,923 3,918 3,913 3,931 3,898 3,898 3,881 3,873 3,854 11 Same store gasoline sales volume (period over period) e (1.5)% (3.2)% (2.4)% (2.8)% (4.2)% (3.3)% (8.3)% (36.6)% (16.6)% 12 Same store merchandise sales (period over period) e,f 4.2 % 5.4 % 6.3 % 5.2 % 4.7 % 5.4 % 0.7 % (4.0)% 0.8 % Certain prior period amounts have been reclassified to conform to current period presentation. a Q3 2019 includes the cumulative effects related to measurement period adjustments arising from the finalization of purchase accounting. b In the fourth quarter of 2019, Speedway and Pilot Travel Centers LLC ("PTC") entered into an agreement whereby PTC will supply, price and sell diesel fuel at certain Speedway and PTC locations with both companies sharing in the diesel fuel margins. From the effective date of this change forward, the operating statistics exclude fuel sales from these locations. c Includes bankcard processing fees (as applicable). See Reconciliation for Non-GAAP Financial Measures. d The price paid by consumers less the cost of merchandise. See Reconciliation for Non-GAAP Financial Measures. e Same store comparison includes only locations owned at least 13 months. f Excludes cigarettes. 12
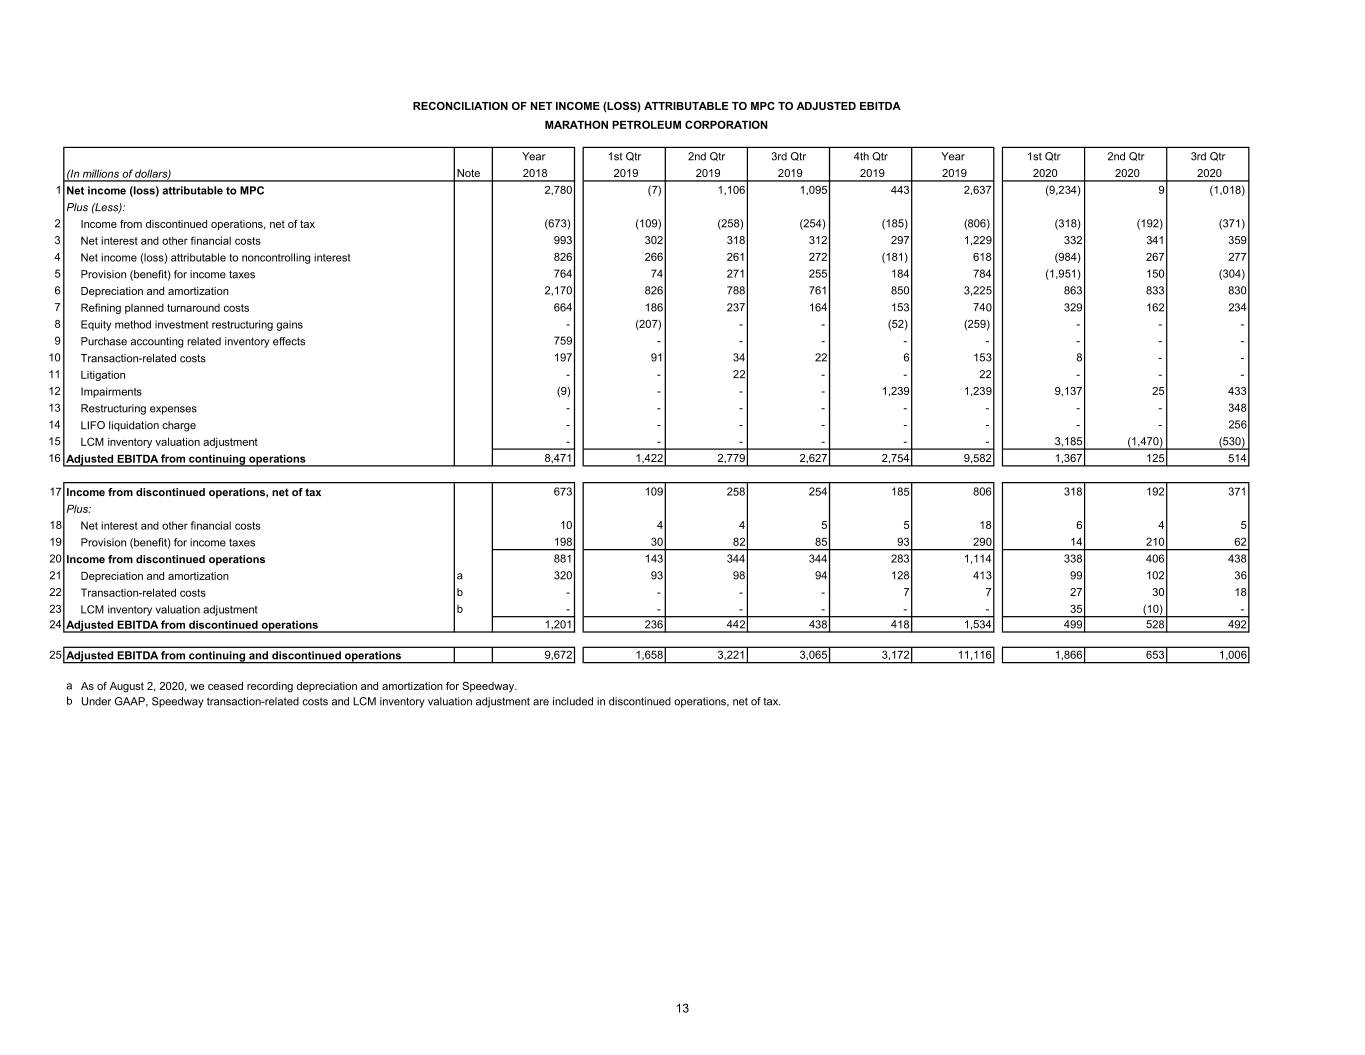
RECONCILIATION OF NET INCOME (LOSS) ATTRIBUTABLE TO MPC TO ADJUSTED EBITDA MARATHON PETROLEUM CORPORATION Year 1st Qtr 2nd Qtr 3rd Qtr 4th Qtr Year 1st Qtr 2nd Qtr 3rd Qtr (In millions of dollars) Note 2018 2019 2019 2019 2019 2019 2020 2020 2020 1 Net income (loss) attributable to MPC 2,780 (7) 1,106 1,095 443 2,637 (9,234) 9 (1,018) Plus (Less): 2 Income from discontinued operations, net of tax (673) (109) (258) (254) (185) (806) (318) (192) (371) 3 Net interest and other financial costs 993 302 318 312 297 1,229 332 341 359 4 Net income (loss) attributable to noncontrolling interest 826 266 261 272 (181) 618 (984) 267 277 5 Provision (benefit) for income taxes 764 74 271 255 184 784 (1,951) 150 (304) 6 Depreciation and amortization 2,170 826 788 761 850 3,225 863 833 830 7 Refining planned turnaround costs 664 186 237 164 153 740 329 162 234 8 Equity method investment restructuring gains - (207) - - (52) (259) - - - 9 Purchase accounting related inventory effects 759 - - - - - - - - 10 Transaction-related costs 197 91 34 22 6 153 8 - - 11 Litigation - - 22 - - 22 - - - 12 Impairments (9) - - - 1,239 1,239 9,137 25 433 13 Restructuring expenses - - - - - - - - 348 14 LIFO liquidation charge - - - - - - - - 256 15 LCM inventory valuation adjustment - - - - - - 3,185 (1,470) (530) 16 Adjusted EBITDA from continuing operations 8,471 1,422 2,779 2,627 2,754 9,582 1,367 125 514 17 Income from discontinued operations, net of tax 673 109 258 254 185 806 318 192 371 Plus: 18 Net interest and other financial costs 10 4 4 5 5 18 6 4 5 19 Provision (benefit) for income taxes 198 30 82 85 93 290 14 210 62 20 Income from discontinued operations 881 143 344 344 283 1,114 338 406 438 21 Depreciation and amortization a 320 93 98 94 128 413 99 102 36 22 Transaction-related costs b - - - - 7 7 27 30 18 23 LCM inventory valuation adjustment b - - - - - - 35 (10) - 24 Adjusted EBITDA from discontinued operations 1,201 236 442 438 418 1,534 499 528 492 25 Adjusted EBITDA from continuing and discontinued operations 9,672 1,658 3,221 3,065 3,172 11,116 1,866 653 1,006 a As of August 2, 2020, we ceased recording depreciation and amortization for Speedway. b Under GAAP, Speedway transaction-related costs and LCM inventory valuation adjustment are included in discontinued operations, net of tax. 13
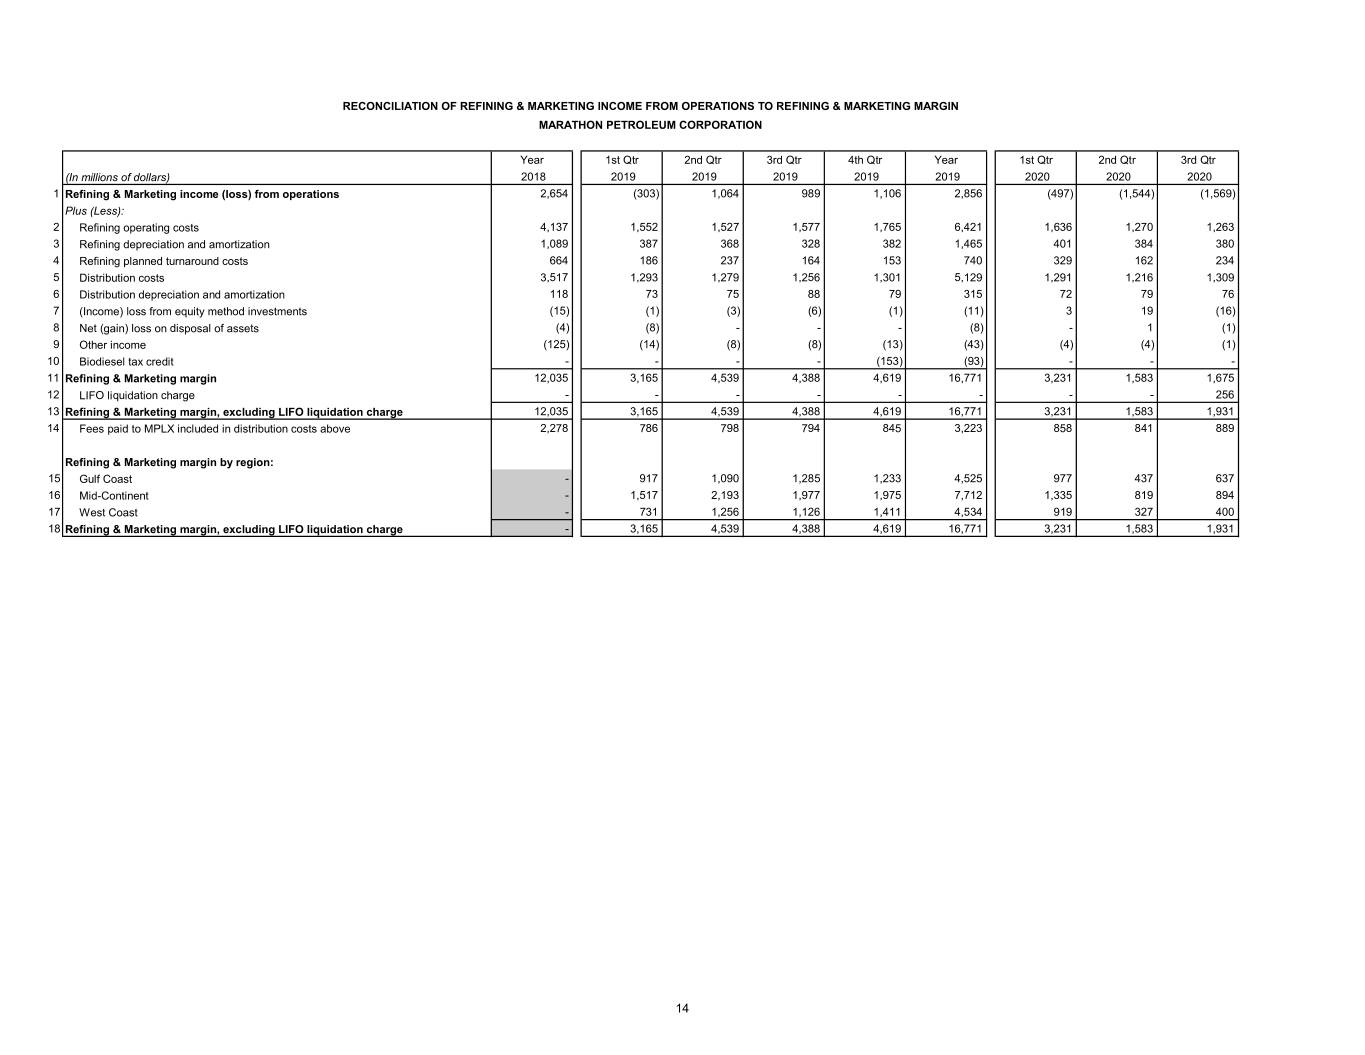
RECONCILIATION OF REFINING & MARKETING INCOME FROM OPERATIONS TO REFINING & MARKETING MARGIN MARATHON PETROLEUM CORPORATION Year 1st Qtr 2nd Qtr 3rd Qtr 4th Qtr Year 1st Qtr 2nd Qtr 3rd Qtr (In millions of dollars) 2018 2019 2019 2019 2019 2019 2020 2020 2020 1 Refining & Marketing income (loss) from operations 2,654 (303) 1,064 989 1,106 2,856 (497) (1,544) (1,569) Plus (Less): 2 Refining operating costs 4,137 1,552 1,527 1,577 1,765 6,421 1,636 1,270 1,263 3 Refining depreciation and amortization 1,089 387 368 328 382 1,465 401 384 380 4 Refining planned turnaround costs 664 186 237 164 153 740 329 162 234 5 Distribution costs 3,517 1,293 1,279 1,256 1,301 5,129 1,291 1,216 1,309 6 Distribution depreciation and amortization 118 73 75 88 79 315 72 79 76 7 (Income) loss from equity method investments (15) (1) (3) (6) (1) (11) 3 19 (16) 8 Net (gain) loss on disposal of assets (4) (8) - - - (8) - 1 (1) 9 Other income (125) (14) (8) (8) (13) (43) (4) (4) (1) 10 Biodiesel tax credit - - - - (153) (93) - - - 11 Refining & Marketing margin 12,035 3,165 4,539 4,388 4,619 16,771 3,231 1,583 1,675 12 LIFO liquidation charge - - - - - - - - 256 13 Refining & Marketing margin, excluding LIFO liquidation charge 12,035 3,165 4,539 4,388 4,619 16,771 3,231 1,583 1,931 14 Fees paid to MPLX included in distribution costs above 2,278 786 798 794 845 3,223 858 841 889 Refining & Marketing margin by region: 15 Gulf Coast - 917 1,090 1,285 1,233 4,525 977 437 637 16 Mid-Continent - 1,517 2,193 1,977 1,975 7,712 1,335 819 894 17 West Coast - 731 1,256 1,126 1,411 4,534 919 327 400 18 Refining & Marketing margin, excluding LIFO liquidation charge - 3,165 4,539 4,388 4,619 16,771 3,231 1,583 1,931 14
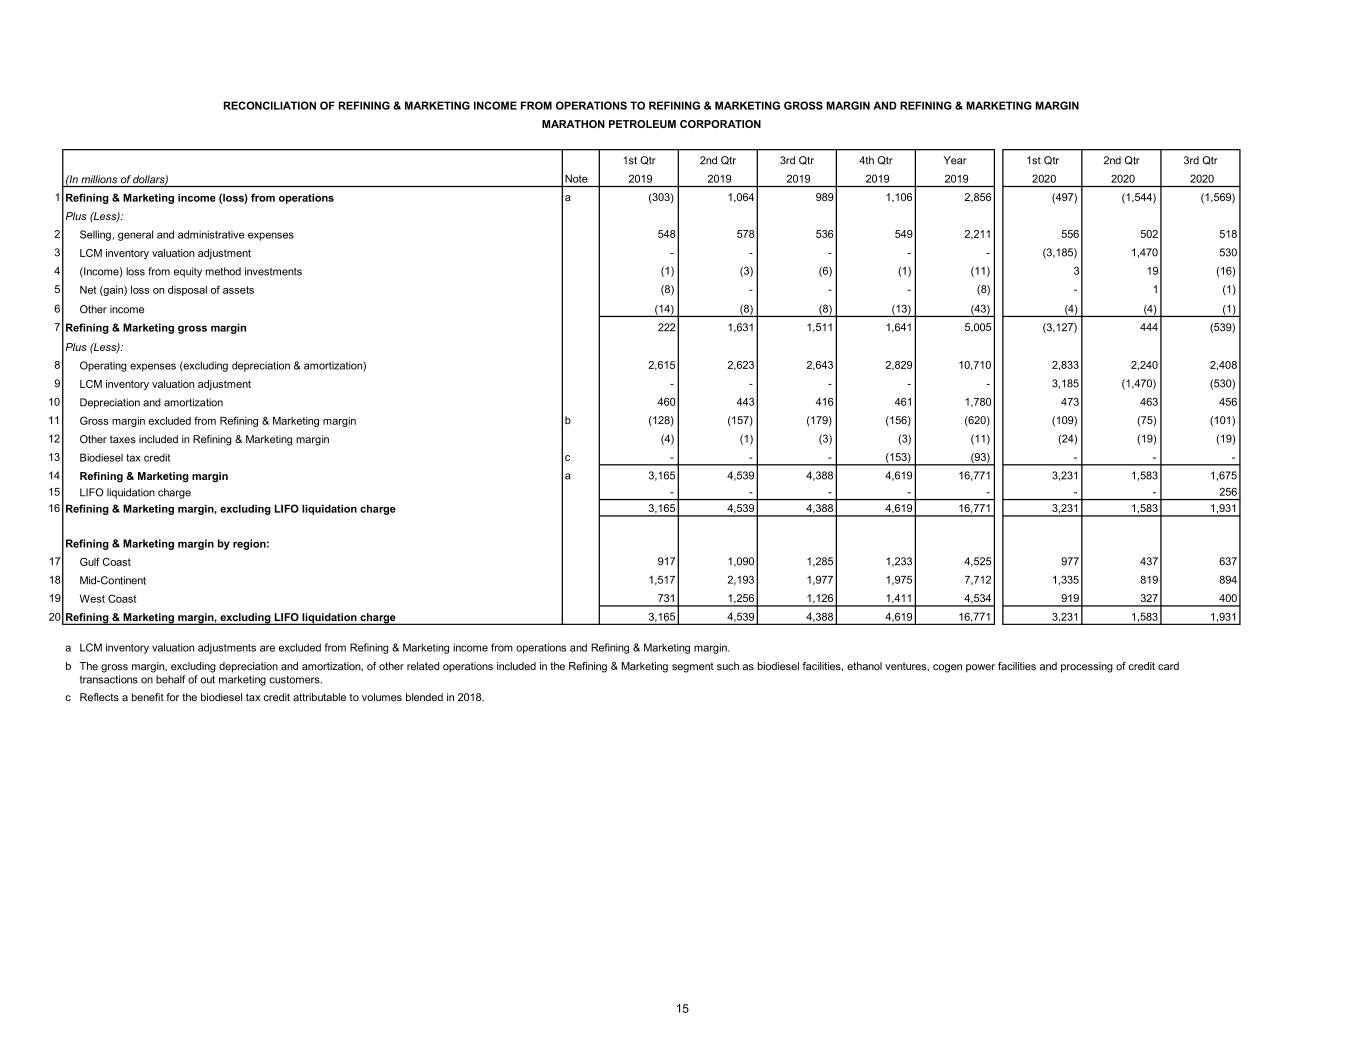
RECONCILIATION OF REFINING & MARKETING INCOME FROM OPERATIONS TO REFINING & MARKETING GROSS MARGIN AND REFINING & MARKETING MARGIN MARATHON PETROLEUM CORPORATION 1st Qtr 2nd Qtr 3rd Qtr 4th Qtr Year 1st Qtr 2nd Qtr 3rd Qtr (In millions of dollars) Note 2019 2019 2019 2019 2019 2020 2020 2020 1 Refining & Marketing income (loss) from operations a (303) 1,064 989 1,106 2,856 (497) (1,544) (1,569) Plus (Less): 2 Selling, general and administrative expenses 548 578 536 549 2,211 556 502 518 3 LCM inventory valuation adjustment - - - - - (3,185) 1,470 530 4 (Income) loss from equity method investments (1) (3) (6) (1) (11) 3 19 (16) 5 Net (gain) loss on disposal of assets (8) - - - (8) - 1 (1) 6 Other income (14) (8) (8) (13) (43) (4) (4) (1) 7 Refining & Marketing gross margin 222 1,631 1,511 1,641 5,005 (3,127) 444 (539) Plus (Less): 8 Operating expenses (excluding depreciation & amortization) 2,615 2,623 2,643 2,829 10,710 2,833 2,240 2,408 9 LCM inventory valuation adjustment - - - - - 3,185 (1,470) (530) 10 Depreciation and amortization 460 443 416 461 1,780 473 463 456 11 Gross margin excluded from Refining & Marketing margin b (128) (157) (179) (156) (620) (109) (75) (101) 12 Other taxes included in Refining & Marketing margin (4) (1) (3) (3) (11) (24) (19) (19) 13 Biodiesel tax credit c - - - (153) (93) - - - 14 Refining & Marketing margin a 3,165 4,539 4,388 4,619 16,771 3,231 1,583 1,675 15 LIFO liquidation charge - - - - - - - 256 16 Refining & Marketing margin, excluding LIFO liquidation charge 3,165 4,539 4,388 4,619 16,771 3,231 1,583 1,931 Refining & Marketing margin by region: 17 Gulf Coast 917 1,090 1,285 1,233 4,525 977 437 637 18 Mid-Continent 1,517 2,193 1,977 1,975 7,712 1,335 819 894 19 West Coast 731 1,256 1,126 1,411 4,534 919 327 400 20 Refining & Marketing margin, excluding LIFO liquidation charge 3,165 4,539 4,388 4,619 16,771 3,231 1,583 1,931 a LCM inventory valuation adjustments are excluded from Refining & Marketing income from operations and Refining & Marketing margin. b The gross margin, excluding depreciation and amortization, of other related operations included in the Refining & Marketing segment such as biodiesel facilities, ethanol ventures, cogen power facilities and processing of credit card transactions on behalf of out marketing customers. c Reflects a benefit for the biodiesel tax credit attributable to volumes blended in 2018. 15
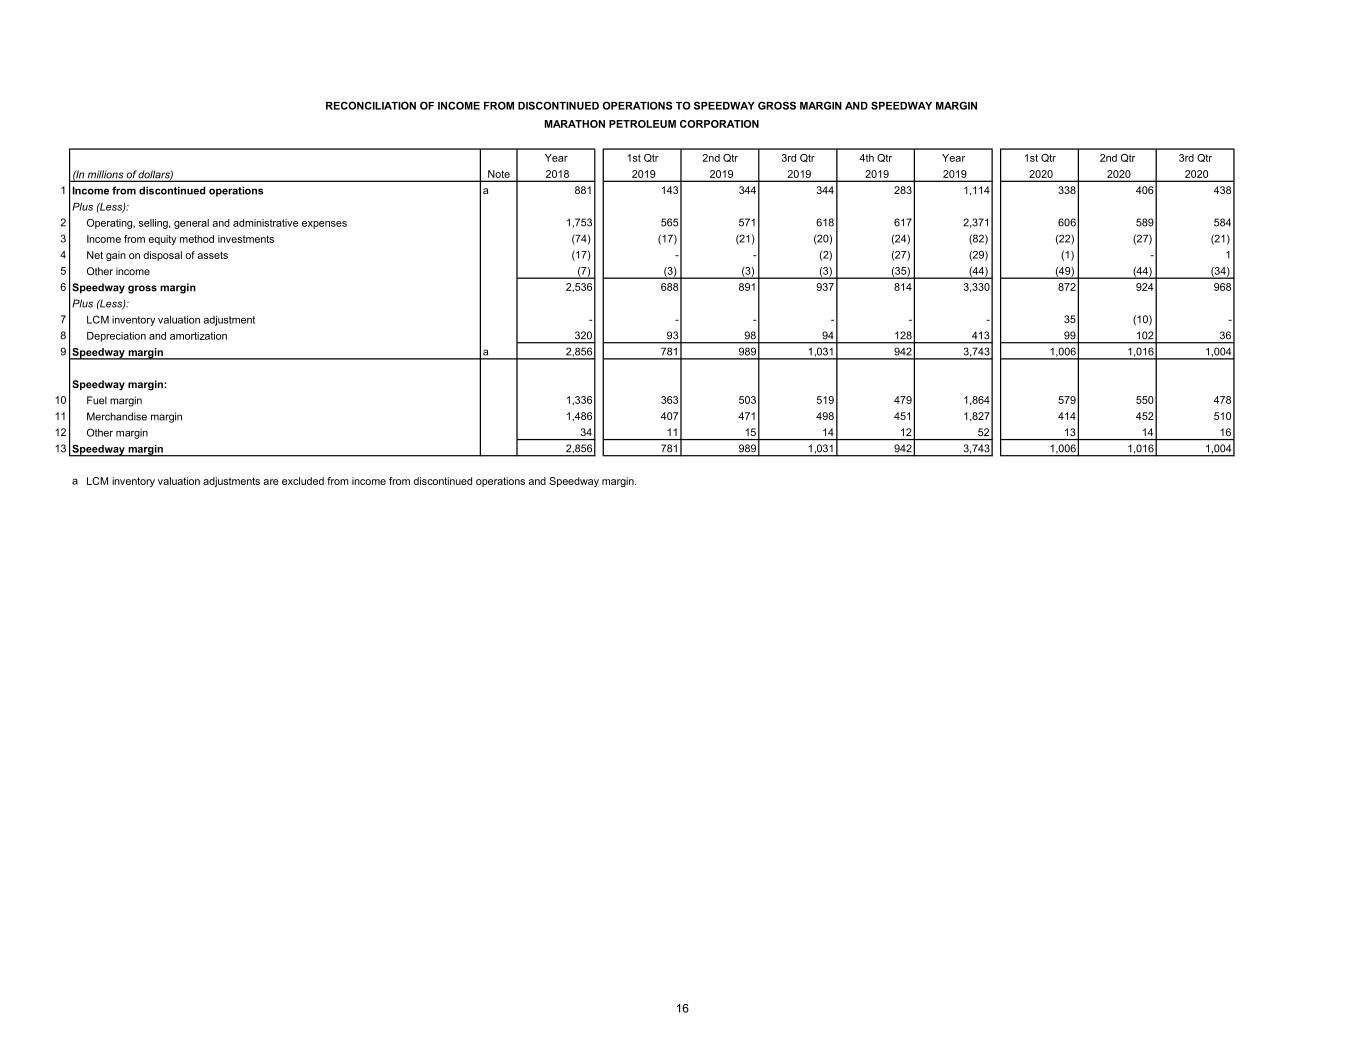
RECONCILIATION OF INCOME FROM DISCONTINUED OPERATIONS TO SPEEDWAY GROSS MARGIN AND SPEEDWAY MARGIN MARATHON PETROLEUM CORPORATION Year 1st Qtr 2nd Qtr 3rd Qtr 4th Qtr Year 1st Qtr 2nd Qtr 3rd Qtr (In millions of dollars) Note 2018 2019 2019 2019 2019 2019 2020 2020 2020 1 Income from discontinued operations a 881 143 344 344 283 1,114 338 406 438 Plus (Less): 2 Operating, selling, general and administrative expenses 1,753 565 571 618 617 2,371 606 589 584 3 Income from equity method investments (74) (17) (21) (20) (24) (82) (22) (27) (21) 4 Net gain on disposal of assets (17) - - (2) (27) (29) (1) - 1 5 Other income (7) (3) (3) (3) (35) (44) (49) (44) (34) 6 Speedway gross margin 2,536 688 891 937 814 3,330 872 924 968 Plus (Less): 7 LCM inventory valuation adjustment - - - - - - 35 (10) - 8 Depreciation and amortization 320 93 98 94 128 413 99 102 36 9 Speedway margin a 2,856 781 989 1,031 942 3,743 1,006 1,016 1,004 Speedway margin: 10 Fuel margin 1,336 363 503 519 479 1,864 579 550 478 11 Merchandise margin 1,486 407 471 498 451 1,827 414 452 510 12 Other margin 34 11 15 14 12 52 13 14 16 13 Speedway margin 2,856 781 989 1,031 942 3,743 1,006 1,016 1,004 a LCM inventory valuation adjustments are excluded from income from discontinued operations and Speedway margin. 16
