Attached files
| file | filename |
|---|---|
| 8-K - 8-K - HarborOne Bancorp, Inc. | hone-20201102x8k.htm |
Exhibit 99.1
| Investor Presentation Growth Oriented. Community Driven. Trusted and Respected. November 2020 |
| Forward Looking Statements 2 Certain statements herein constitute forward-looking statements within the meaning of Section 27A of the Securities Act of 1933, as amended, and Section 21E of the Securities Exchange Act of 1934, as amended and are intended to be covered by the safe harbor provisions of the Private Securities Litigation Reform Act of 1995. Such statements may be identified by words such as ”may,” “will,” “should,” “could,” “would,” “plan,” “potential,” “estimate,” “project,” “believe,” “intend,” “anticipate,” “expect,” “target” and similar expressions. These statements are based upon the current assumptions and beliefs of the Company’s management, are expectations of future results, and are subject to significant risks and uncertainties. Actual results may differ materially from those set forth in the forward-looking statements as a result of numerous factors. Factors that could cause such differences to exist include, but are not limited to, the negative impacts and disruptions of the COVID-19 pandemic and measures taken to contain its spread on our employees, customers, business operations, credit quality, financial position, liquidity and results of operations; the length and extent of the economic contraction as a result of the COVID-19 pandemic; continued deterioration in employment levels and other general business and economic conditions on a national basis and in the local markets in which the Company operates; changes in customer behavior; the possibility that future credit losses, loan defaults and charge-off rates are higher than expected due to changes in economic assumptions or adverse economic developments; turbulence in the capital and debt markets; changes in interest rates; decreases in the value of securities and other assets; decreases in deposit levels necessitating increased borrowing to fund loans and investments; competitive pressures from other financial institutions; operational risks including, but not limited to, cybersecurity incidents, fraud, natural disasters and future pandemics; changes in regulation; reputational risks relating to the Company’s participation in the Paycheck Protection Program and other pandemic-related legislative and regulatory initiatives and programs; changes in accounting standards and practices; the risk that goodwill and intangibles recorded in our financial statements will become impaired; risks related to the implementation of acquisitions, dispositions, and restructurings, including the risk that acquisitions may not produce results at levels or within time frames originally anticipated; the risk that we may not be successful in the implementation of our business strategy; changes in assumptions used in making such forward-looking statements; and the other risks and uncertainties detailed in the Company’s Annual Report on Form 10-K and Quarterly Reports on Form 10-Q as filed with the Securities and Exchange Commission (the “SEC”), which are available at the SEC’s website, www.sec.gov. Should one or more of these risks materialize or should underlying beliefs or assumptions prove incorrect, HarborOne Bancorp, Inc.’s actual results could differ materially from those discussed. Forward-looking statements speak only as of the date on which they are made. The Company does not undertake any obligation to update any forward-looking statement to reflect circumstances or events that occur after the date the forward-looking statements aremade. |
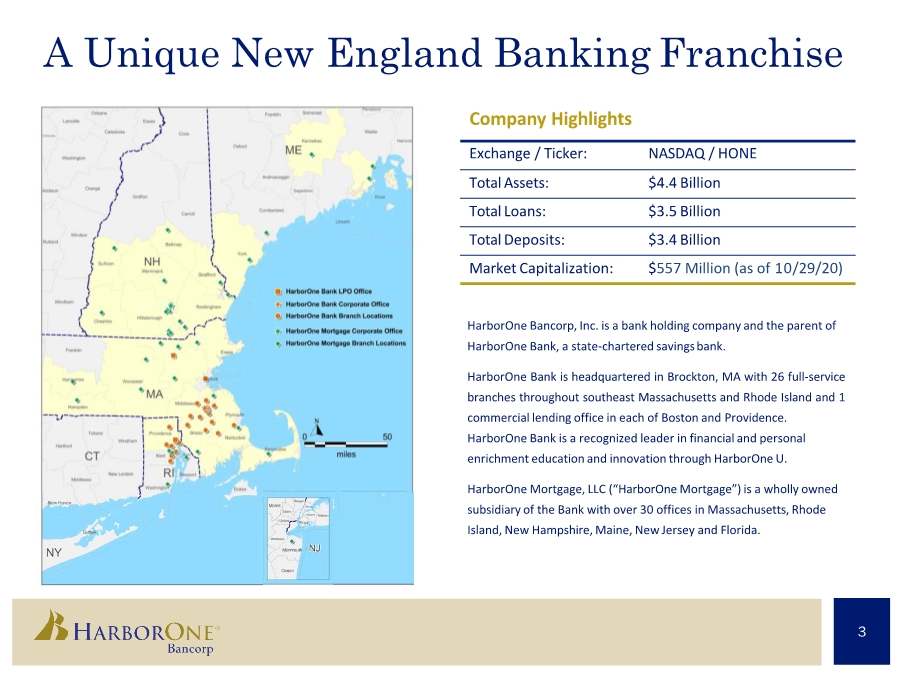
| Exchange / Ticker: NASDAQ / HONE Total Assets: $4.4 Billion Total Loans: $3.5 Billion Total Deposits: $3.4 Billion Market Capitalization: $557 Million (as of 10/29/20) Company Highlights HarborOne Bancorp, Inc. is a bank holding company and the parent of HarborOne Bank, a state-chartered savingsbank. HarborOne Bank is headquartered in Brockton, MA with 26 full-service branches throughout southeast Massachusetts and Rhode Island and 1 commercial lending office in each of Boston and Providence. HarborOne Bank is a recognized leader in financial and personal enrichment education and innovation through HarborOne U. HarborOne Mortgage, LLC (“HarborOne Mortgage”) is a wholly owned subsidiary of the Bank with over 30 offices in Massachusetts, Rhode Island, New Hampshire, Maine, New Jersey and Florida. A Unique New England Banking Franchise 3 |
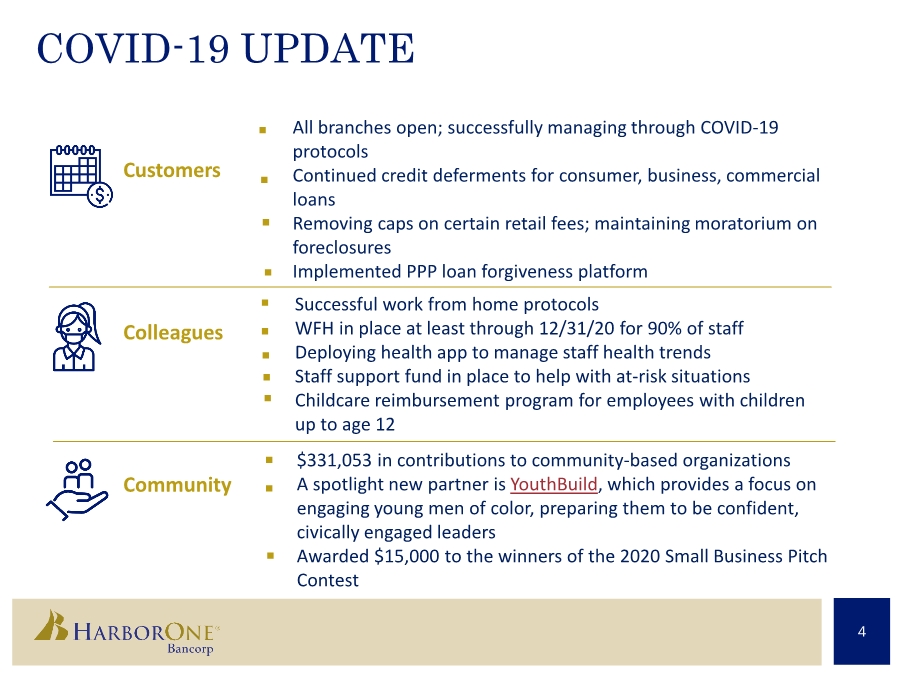
| COVID-19 UPDATE Colleagues Community Customers . . $331,053 in contributions to community-based organizations A spotlight new partner is YouthBuild, which provides a focus on engaging young men of color, preparing them to be confident, civically engaged leaders Awarded $15,000 to the winners of the 2020 Small Business Pitch Contest 4 All branches open; successfully managing through COVID-19 protocols Continued credit deferments for consumer, business, commercial loans Removing caps on certain retail fees; maintaining moratorium on foreclosures Implemented PPP loan forgiveness platform . . Successful work from home protocols WFH in place at least through 12/31/20 for 90% of staff Deploying health app to manage staff health trends Staff support fund in place to help with at-risk situations Childcare reimbursement program for employees with children up to age 12 . . . . . . . . |
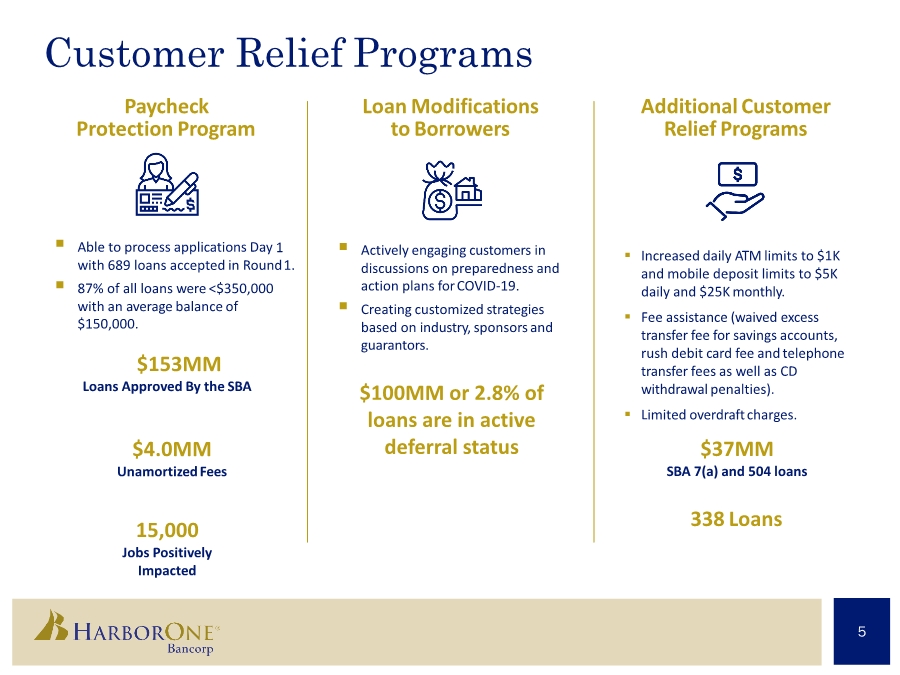
| Customer Relief Programs Paycheck Protection Program . Able to process applications Day 1 with 689 loans accepted in Round1. . 87% of all loans were <$350,000 with an average balance of $150,000. $153MM Loans Approved By the SBA $4.0MM UnamortizedFees 15,000 Jobs Positively Impacted Loan Modifications to Borrowers . Actively engaging customers in discussions on preparedness and action plans forCOVID-19. . Creating customized strategies based on industry, sponsorsand guarantors. Additional Customer Relief Programs . Increased daily ATM limits to $1K and mobile deposit limits to $5K daily and $25K monthly. . Fee assistance (waived excess transfer fee for savings accounts, rush debit card fee andtelephone transfer fees as well as CD withdrawal penalties). . Limited overdraftcharges. $100MM or 2.8% of loans are in active deferral status 5 $37MM SBA 7(a) and 504 loans 338 Loans |
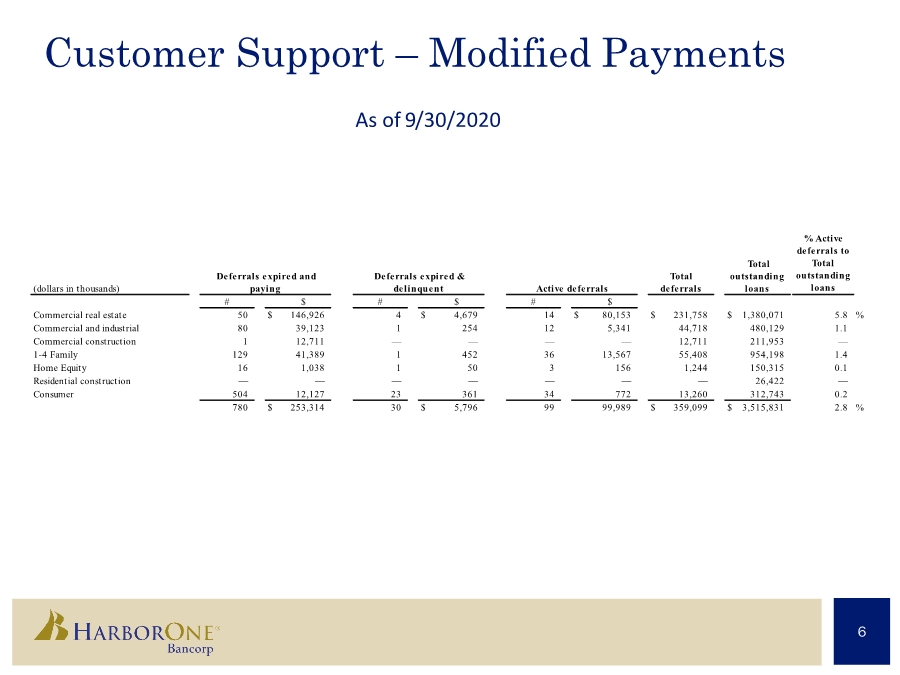
| Customer Support – Modified Payments As of 9/30/2020 6 (dollars in thousands) % Acti ve deferrals to To t a l outstanding loans # $ # $ # $ Commercial real estate 50 $ 146,926 4 $ 4,679 14 $ 80,153 $ 231,758 $ 1,380,071 5.8 % Commercial and industrial 80 39,123 1 254 12 5,341 44,718 480,129 1.1 Commercial construction 1 12,711 — — — — 12,711 211,953 — 1-4 Family 129 41,389 1 452 36 13,567 55,408 954,198 1.4 Home Equit y 16 1,038 1 50 3 156 1,244 150,315 0.1 Residential construction — — — — — — — 26,422 — Consumer 504 12,127 23 361 34 772 13,260 312,743 0.2 780 $ 253,314 30 $ 5,796 99 99,989 $ 359,099 $ 3,515,831 2.8 % Deferrals expired and paying Total outstanding loans Deferrals expired & delinquent Active deferrals Total deferrals |
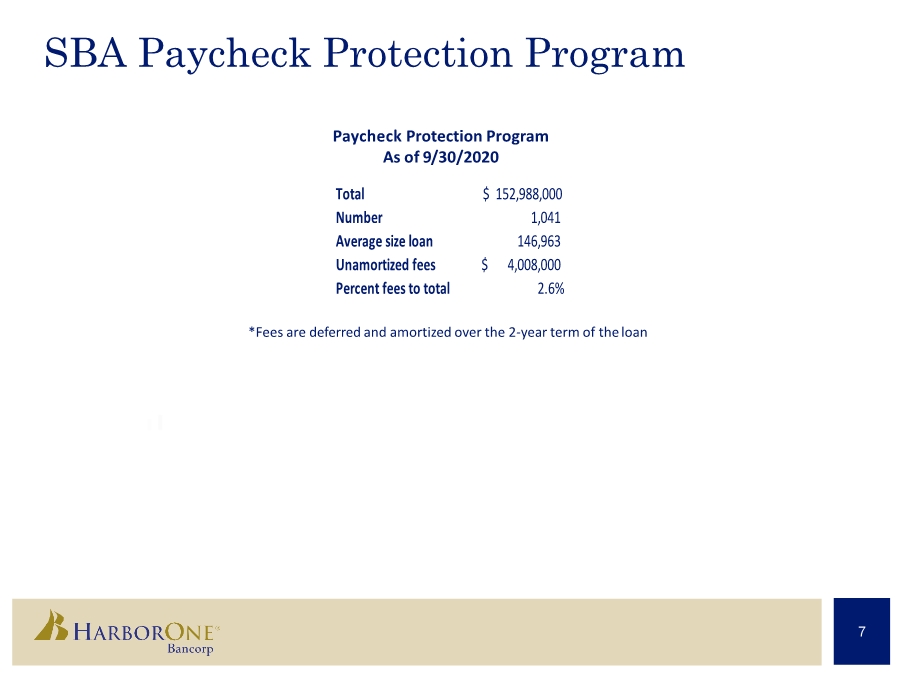
| SBA Paycheck Protection Program Paycheck Protection Program As of 9/30/2020 *Fees are deferred and amortized over the 2-year term of theloan 7 Total $ 152,988,000 Number 1,041 Average size loan 146,963 Unamortized fees 4,008,000 $ Percent fees to total 2.6% |
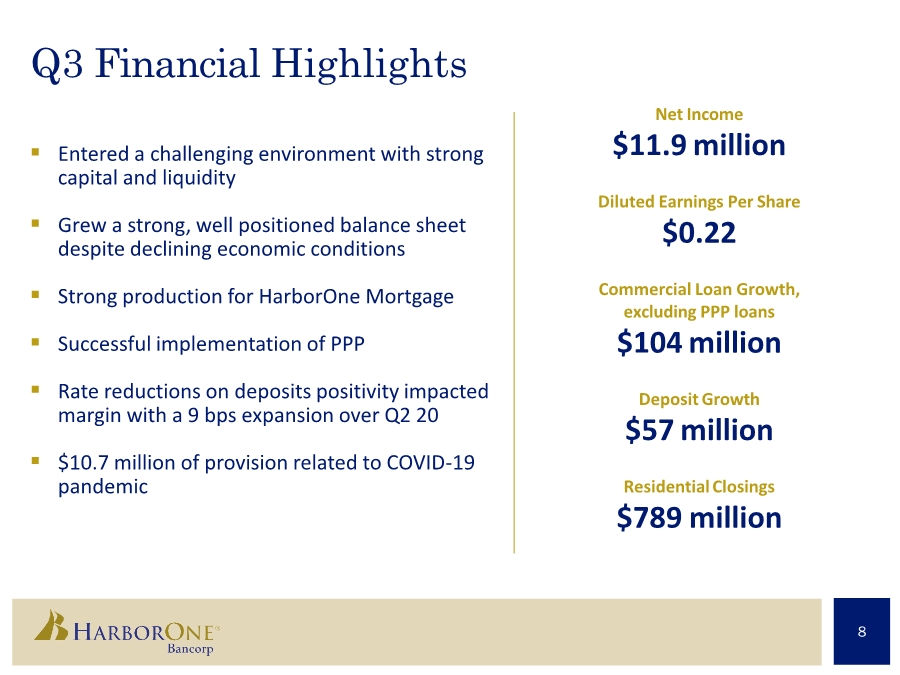
| Q3 Financial Highlights . Entered a challenging environment with strong capital and liquidity . Grew a strong, well positioned balance sheet despite declining economic conditions . Strong production for HarborOne Mortgage . Successful implementation of PPP . Rate reductions on deposits positivity impacted margin with a 9 bps expansion over Q2 20 . $10.7 million of provision related to COVID-19 pandemic Net Income $11.9 million Diluted Earnings Per Share $0.22 Commercial Loan Growth, excluding PPP loans $104 million DepositGrowth $57 million ResidentialClosings $789 million 8 |
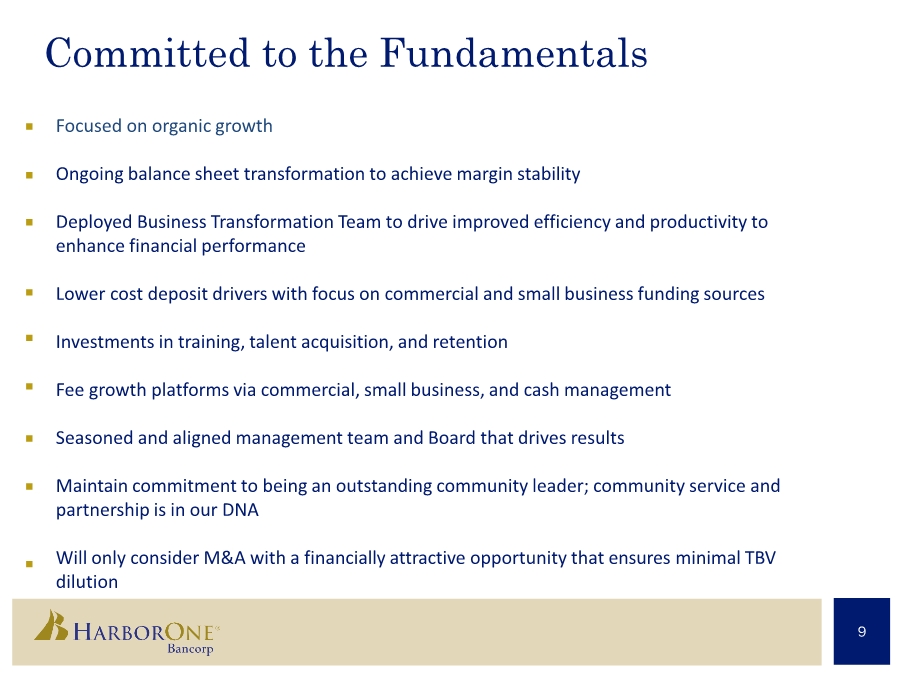
| Committed to the Fundamentals 9 . Focused on organic growth Ongoing balance sheet transformation to achieve margin stability Deployed Business Transformation Team to drive improved efficiency and productivity to enhance financial performance Lower cost deposit drivers with focus on commercial and small business funding sources Investments in training, talent acquisition, and retention Fee growth platforms via commercial, small business, and cash management Seasoned and aligned management team and Board that drives results Maintain commitment to being an outstanding community leader; community service and partnership is in our DNA Will only consider M&A with a financially attractive opportunity that ensures minimal TBV dilution . . . . . . . . |
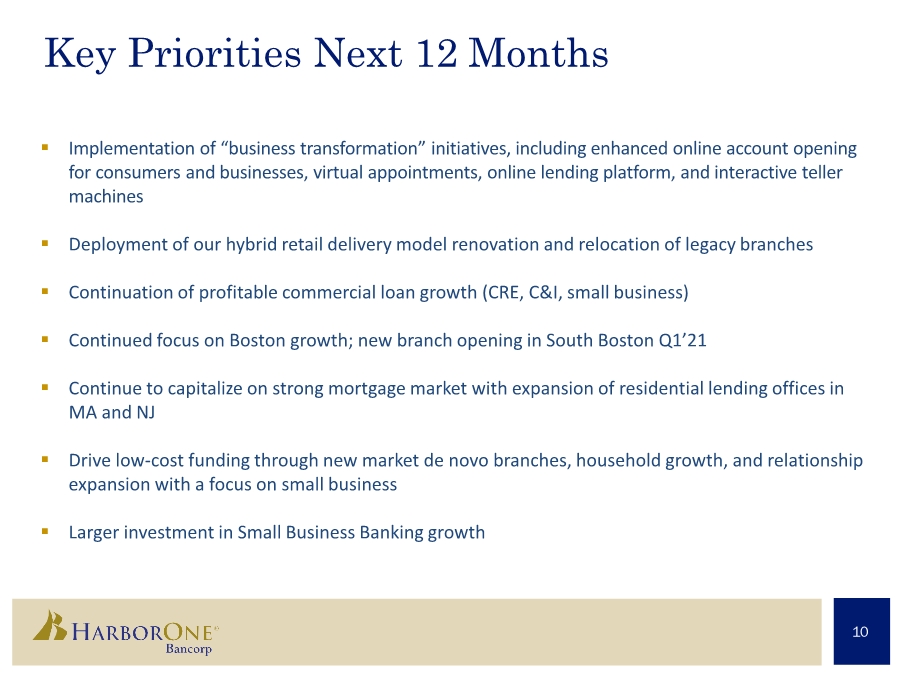
| Key Priorities Next 12 Months 10 . Implementation of “business transformation” initiatives, including enhanced online account opening for consumers and businesses, virtual appointments, online lending platform, and interactive teller machines . Deployment of our hybrid retail delivery model renovation and relocation of legacy branches . Continuation of profitable commercial loan growth (CRE, C&I, small business) . Continued focus on Boston growth; new branch opening in South Boston Q1’21 . Continue to capitalize on strong mortgage market with expansion of residential lending offices in MA and NJ . Drive low-cost funding through new market de novo branches, household growth, and relationship expansion with a focus on small business . Larger investment in Small Business Banking growth |
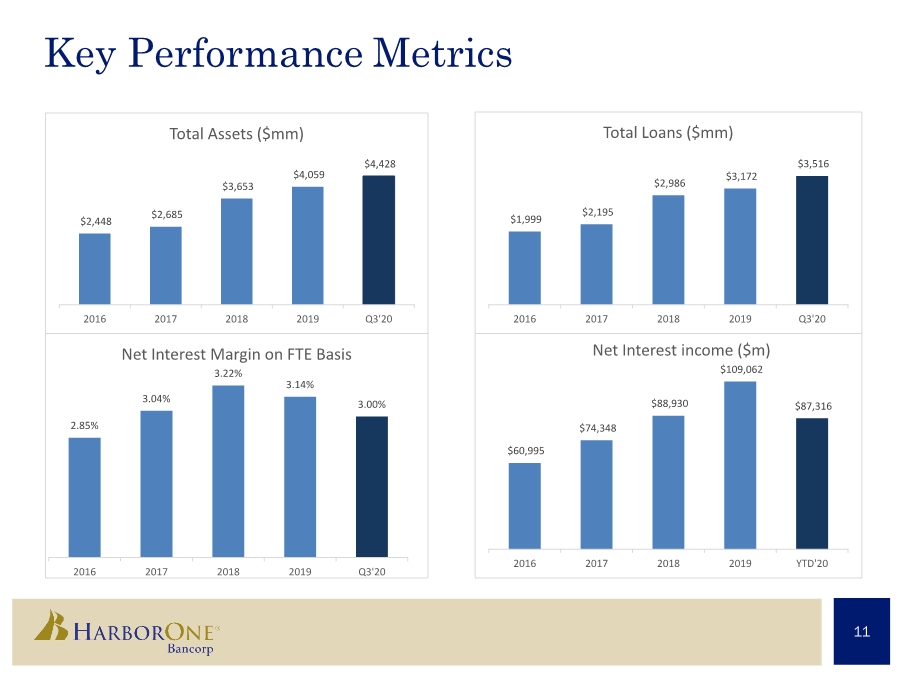
| Key Performance Metrics 11 $2,448 $2,685 $3,653 $4,059 $4,428 2016 2017 2018 2019 Q3'20 Total Assets ($mm) $1,999 $2,195 $2,986 $3,172 $3,516 2016 2017 2018 2019 Q3'20 Total Loans ($mm) 2.85% 3.04% 3.22% 3.14% 3.00% 2016 2017 2018 2019 Q3'20 Net Interest Margin on FTE Basis $60,995 $74,348 $88,930 $109,062 $87,316 2016 2017 2018 2019 YTD'20 Net Interest income ($m) |
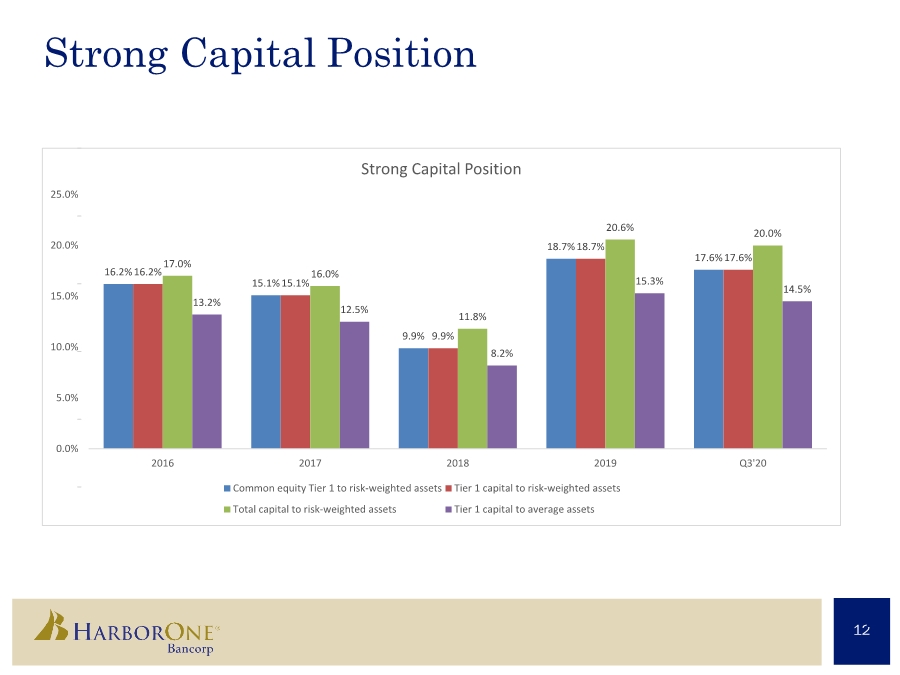
| Strong Capital Position 1 1 2 2 16.2% 15.1% 9.9% 18.7% 17.6% 16.2% 15.1% 9.9% 18.7% 17.6% 17.0% 16.0% 11.8% 20.6% 20.0% 13.2% 12.5% 8.2% 15.3% 14.5% 0.0% 5.0% 10.0% 15.0% 20.0% 25.0% 2016 2017 2018 2019 Q3'20 Strong Capital Position Common equity Tier 1 to risk-weighted assets Tier 1 capital to risk-weighted assets Total capital to risk-weighted assets Tier 1 capital to average assets |
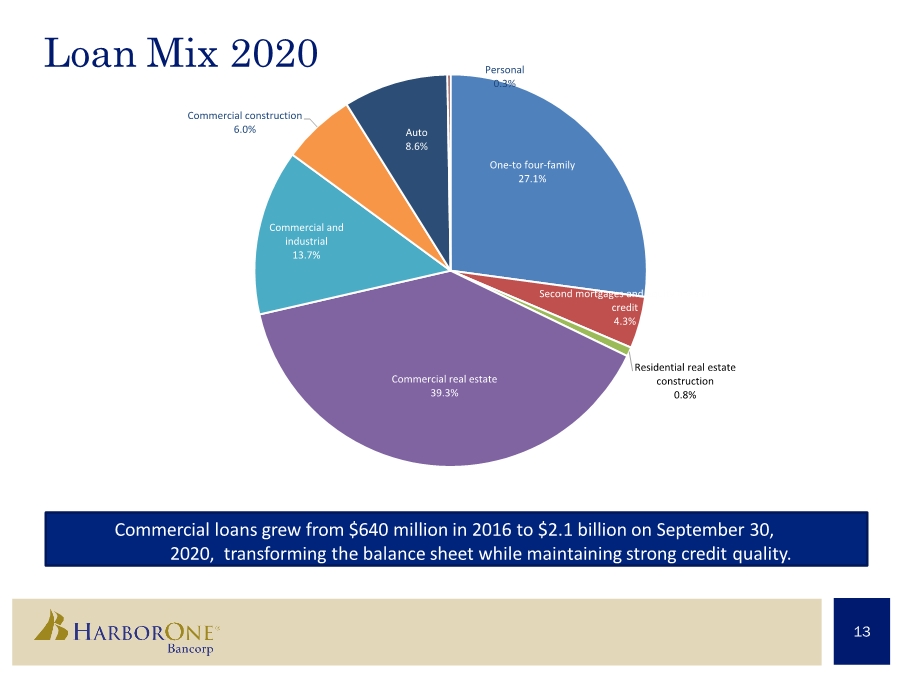
| Loan Mix 2020 Commercial loans grew from $640 million in 2016 to $2.1 billion on September 30, 2020, transforming the balance sheet while maintaining strong credit quality. 13 One-to four-family 27.1% Second mortgages and equity lines of credit 4.3% Residential real estate construction 0.8% Commercial real estate 39.3% Commercial and industrial 13.7% Commercial construction 6.0% Auto 8.6% Personal 0.3% |
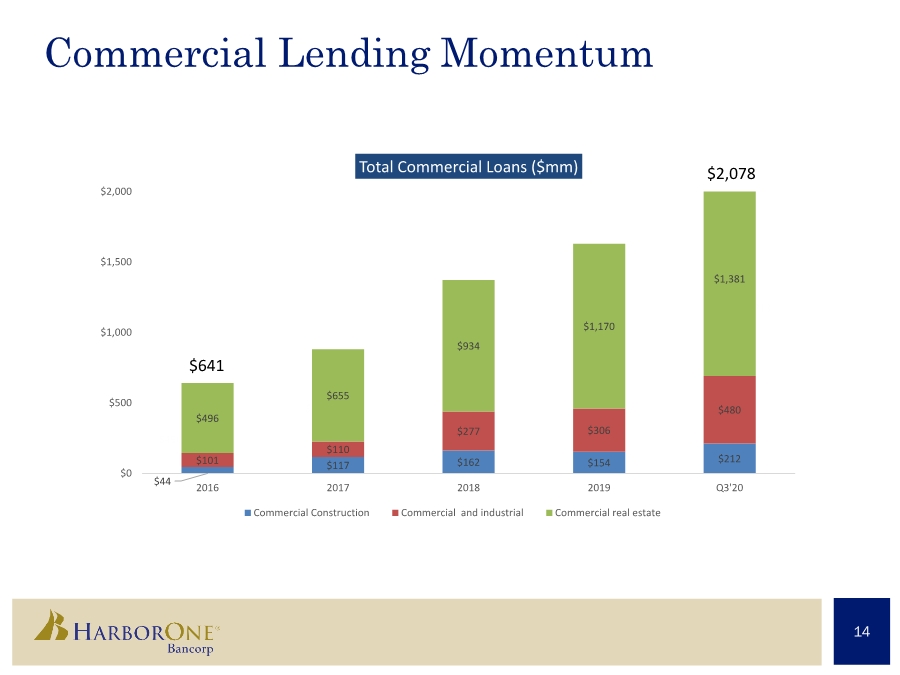
| Commercial Lending Momentum $496 $655 $934 $1,170 $1,213 14 $44 $117 $162 $154 $212 $101 $110 $277 $306 $480 $496 $655 $934 $1,170 $1,381 $0 $500 $1,000 $1,500 $2,000 2016 2017 2018 2019 Q3'20 Total Commercial Loans ($mm) Commercial Construction Commercial and industrial Commercial real estate $2,078 $641 |
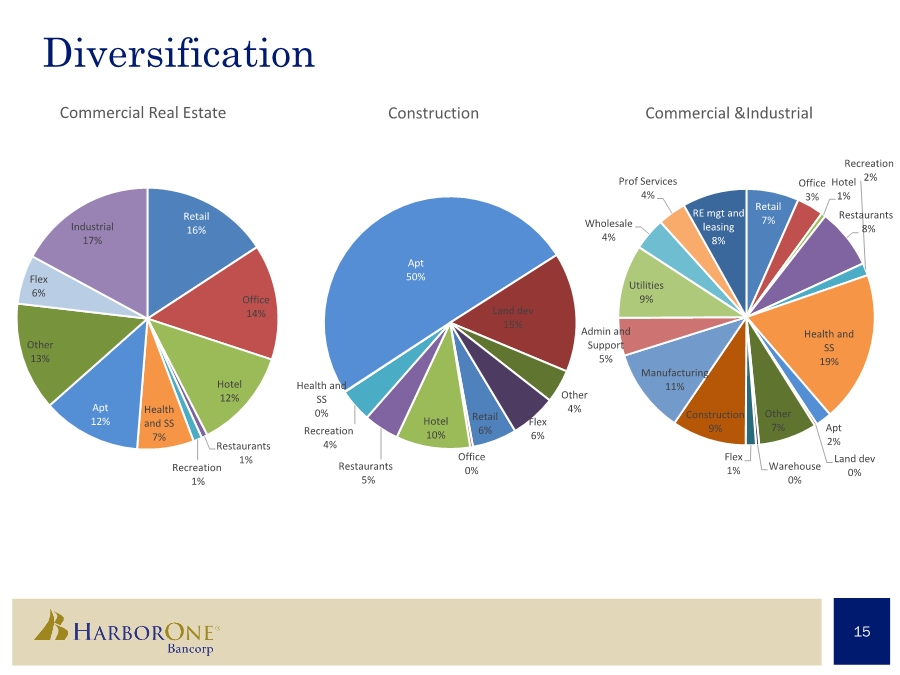
| Diversification 15 Retail 6% Office 0% Hotel 10% Restaurants 5% Recreation 4% Health and SS 0% Apt 50% Land dev 15% Other 4% Flex 6% Construction Retail 7% Office 3% Hotel 1% Restaurants 8% Recreation 2% Health and SS 19% Apt 2% Land dev 0% Other 7% Warehouse 0% Flex 1% Construction 9% Manufacturing 11% Admin and Support 5% Utilities 9% Wholesale 4% Prof Services 4% RE mgt and leasing 8% Commercial &Industrial Retail 16% Office 14% Hotel 12% Restaurants 1% Recreation 1% Health and SS 7% Apt 12% Other 13% Flex 6% Industrial 17% Commercial Real Estate |
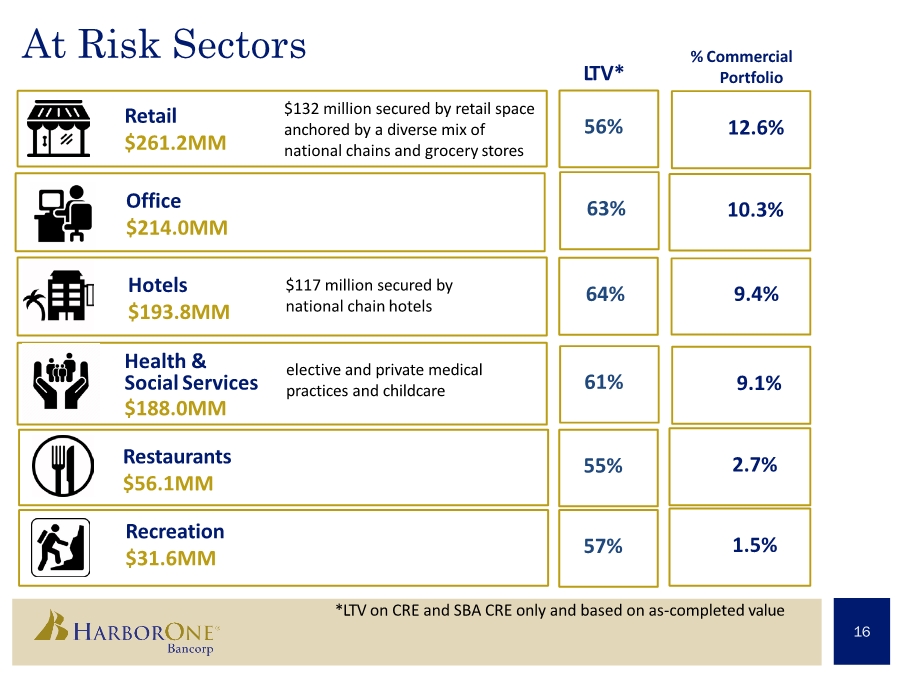
| At Risk Sectors *LTV on CRE and SBA CRE only and based on as-completed value Retail $261.2MM $132 million secured by retail space anchored by a diverse mix of national chains and grocery stores Hotels $193.8MM $117 million secured by national chain hotels Health & Social Services $188.0MM elective and private medical practices and childcare 16 L TV* % Commercial Portfolio 56% 12.6% 64% 9.4% 61% 9.1% Office $214.0MM 63% 10.3% Recreation $31.6MM 57% 1.5% Restaurants $56.1MM 55% 2.7% |
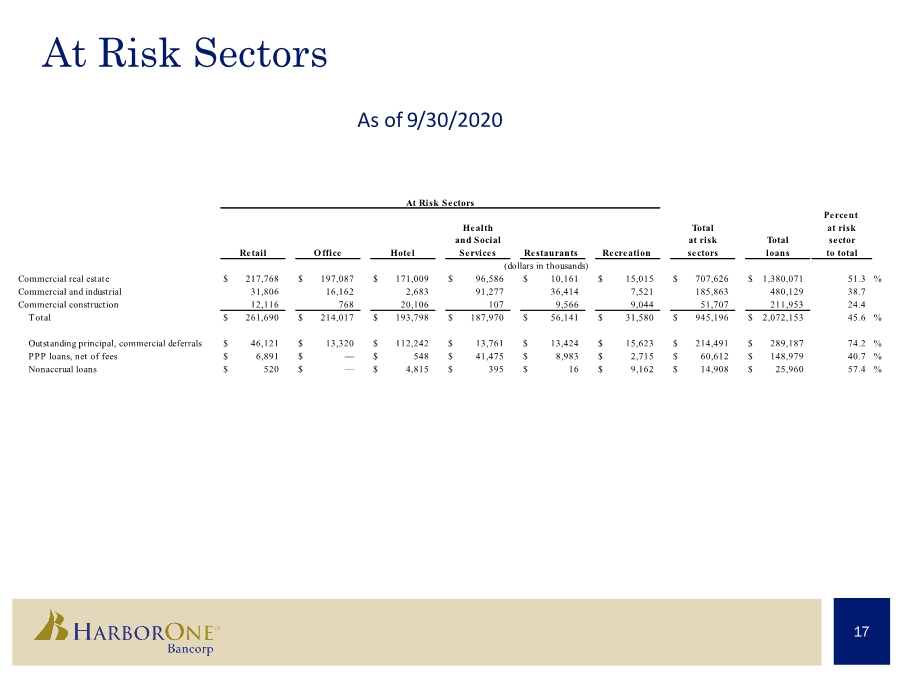
| At Risk Sectors 17 Percent at risk sector to total Commercial real estate $ 217,768 $ 197,087 $ 171,009 $ 96,586 $ 10,161 $ 15,015 $ 707,626 $ 1,380,071 51.3 % Commercial and industrial 31,806 16,162 2,683 91,277 36,414 7,521 185,863 480,129 38.7 Commercial construction 12,116 768 20,106 107 9,566 9,044 51,707 211,953 24.4 Total $ 261,690 $ 214,017 $ 193,798 $ 187,970 $ 56,141 $ 31,580 $ 945,196 $ 2,072,153 45.6 % Outstanding principal, commercial deferrals $ 46,121 $ 13,320 $ 112,242 $ 13,761 $ 13,424 $ 15,623 $ 214,491 $ 289,187 74.2 % PPP loans, net of fees $ 6,891 $ — $ 548 $ 41,475 $ 8,983 $ 2,715 $ 60,612 $ 148,979 40.7 % Nonaccrual loans $ 520 $ — $ 4,815 $ 395 $ 16 $ 9,162 $ 14,908 $ 25,960 57.4 % Total at risk Recreation At Risk Sectors and Social Health Total loans sectors (dollars in thousands) Office Hotel Services Restaurants Retail As of 9/30/2020 |
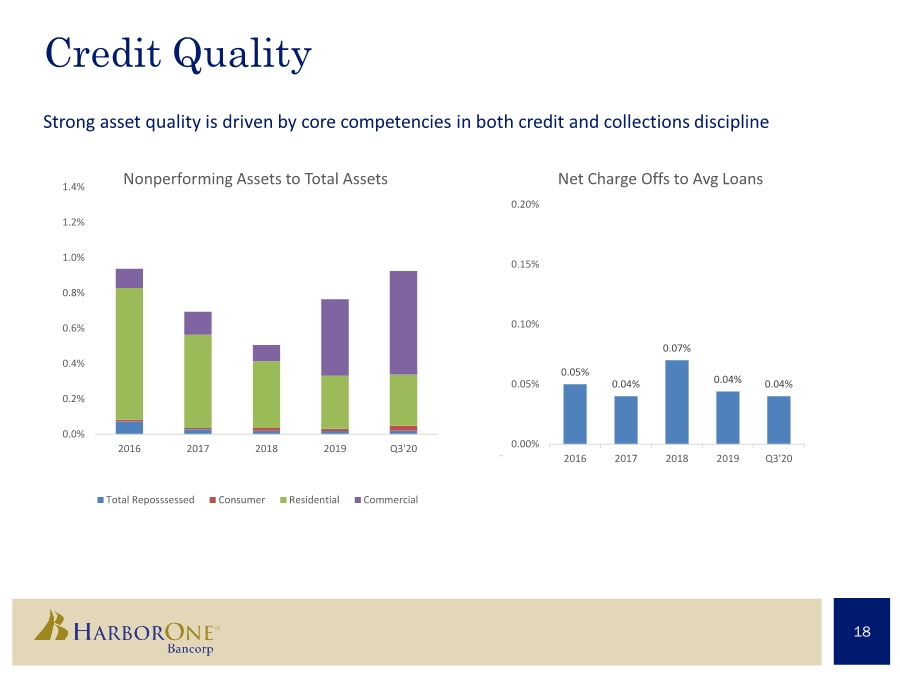
| Credit Quality Strong asset quality is driven by core competencies in both credit and collections discipline 18 0.05% 0.04% 0.07% 0.04% 0.04% 0.00% 0.05% 0.10% 0.15% 0.20% 2016 2017 2018 2019 Q3'20 Net Charge Offs to Avg Loans 0.0% 0.2% 0.4% 0.6% 0.8% 1.0% 1.2% 1.4% 2016 2017 2018 2019 Q3'20 Nonperforming Assets to Total Assets Total Reposssessed Consumer Residential Commercial |
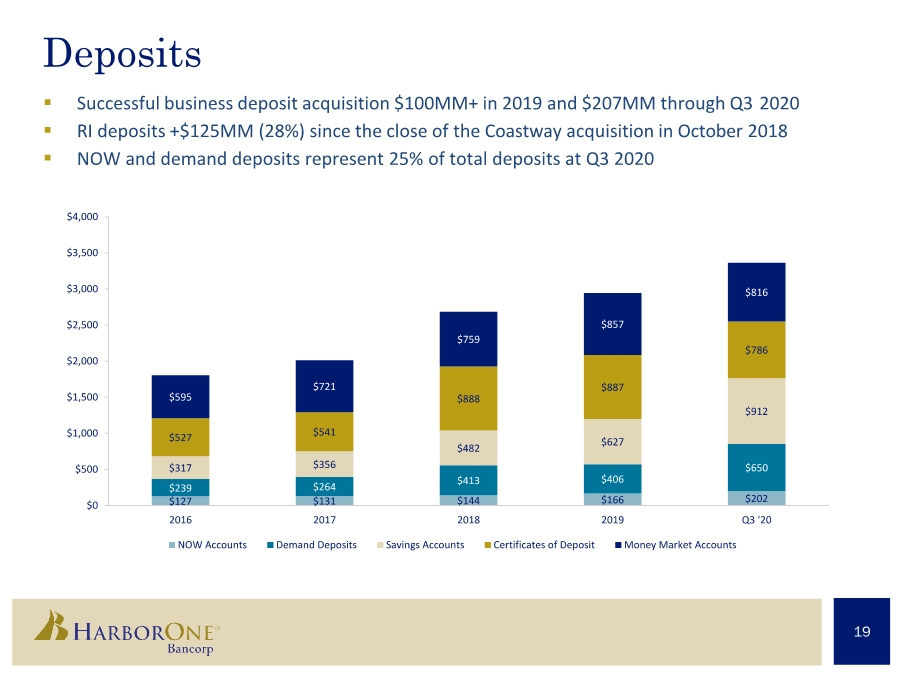
| Deposits . Successful business deposit acquisition $100MM+ in 2019 and $207MM through Q3 2020 . RI deposits +$125MM (28%) since the close of the Coastway acquisition in October 2018 . NOW and demand deposits represent 25% of total deposits at Q3 2020 19 $127 $131 $144 $166 $202 $239 $264 $413 $406 $650 $317 $356 $482 $627 $912 $527 $541 $888 $887 $786 $595 $721 $759 $857 $816 $0 $500 $1,000 $1,500 $2,000 $2,500 $3,000 $3,500 $4,000 2016 2017 2018 2019 Q3 '20 NOW Accounts Demand Deposits Savings Accounts Certificates of Deposit Money Market Accounts |
| Retail Branch Expansion . Quincy Branch opened October 19, 2020 . South Boston opening Q1 2021 Drive to Digital Virtual Appointment Banking slated for Q1 2021 . “$25 for 25” promotion to introduce mobile banking to non-adopters . Added 2,700 new eBanking users on top of the 3,000 new users in Q2 2020 . eBanking user sessions grew by ~1,000 sessions Transformed Retail Model . Continue to implement the relationship banker model across 85% of branches. Model includes higher skilled cross-trained positions. . Highly focused on relationship development for both consumer and small business . Planning stages for legacy branch remodels to support the relationship banker model 20 . . |
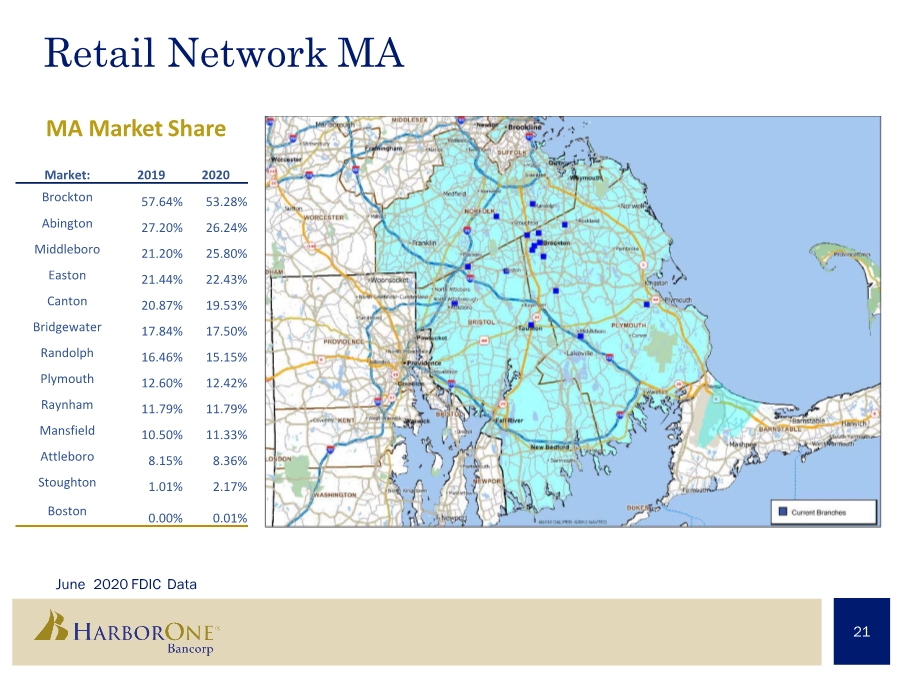
| Retail Network MA June 2020 FDIC Data 21 MA Market Share Market: 2019 2020 Brockton 57.64% 53.28% Abington 27.20% 26.24% Middleboro 21.20% 25.80% Easton 21.44% 22.43% Canton 20.87% 19.53% Bridgewater 17.84% 17.50% Randolph 16.46% 15.15% Plymouth 12.60% 12.42% Raynham 11.79% 11.79% Mansfield 10.50% 11.33% Attleboro 8.15% 8.36% Stoughton 1.01% 2.17% Boston 0.00% 0.01% |
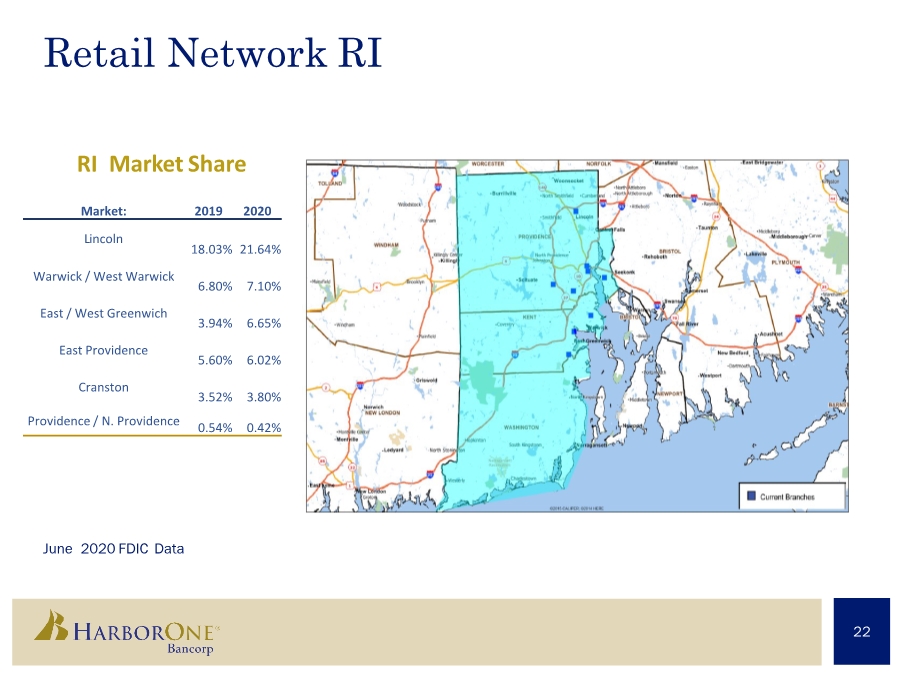
| Retail Network RI June 2020 FDIC Data 22 RI Market Share Market: 2019 2020 Lincoln 18.03% 21.64% Warwick / West Warwick 6.80% 7.10% East / West Greenwich 3.94% 6.65% East Providence 5.60% 6.02% Cranston 3.52% 3.80% Providence / N. Providence 0.54% 0.42% |
| * Data source: The WarrenGroup 23 . 107 loan originators across 6 states (MA/NH/ME/RI/NJ/FL) that also support limited business in CT and VT. . Exceeded $789 million in fundings in Q3 2020 verses $857 million in Q2 2019. Given current pipeline and market expectations on interest rates, we are expecting strong fundings to continue into Q4. Market share for purchases are 3rd in NH, 9th in RI, 13th in ME, 17th in MA*. 50%/50% purchase-to-refi split in Q3 2020. Q1 2020 was 30%/70% split. Disciplined and flexible sales structure to match market expansion and contraction. Q3 2020 earnings of $16.1 million. This included a positive $984,000 mark on mortgage servicing rights. . |
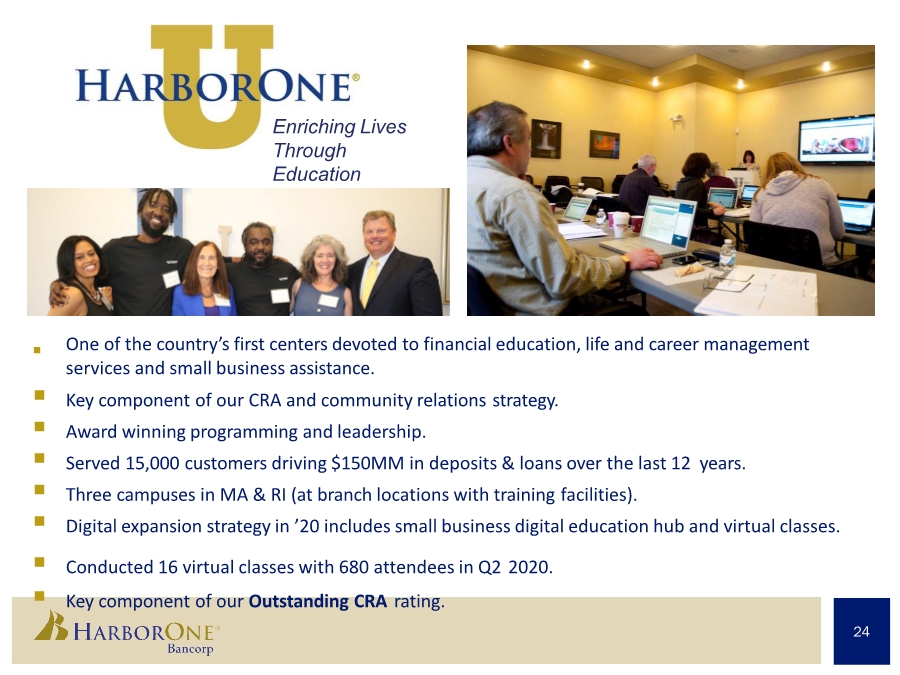
| . One of the country’s first centers devoted to financial education, life and career management services and small business assistance. . Key component of our CRA and community relations strategy. . Award winning programming and leadership. . Served 15,000 customers driving $150MM in deposits & loans over the last 12 years. . Three campuses in MA & RI (at branch locations with training facilities). . Digital expansion strategy in ’20 includes small business digital education hub and virtual classes. . Conducted 16 virtual classes with 680 attendees in Q2 2020. . Key component of our Outstanding CRA rating. Enriching Lives Through Education 24 |
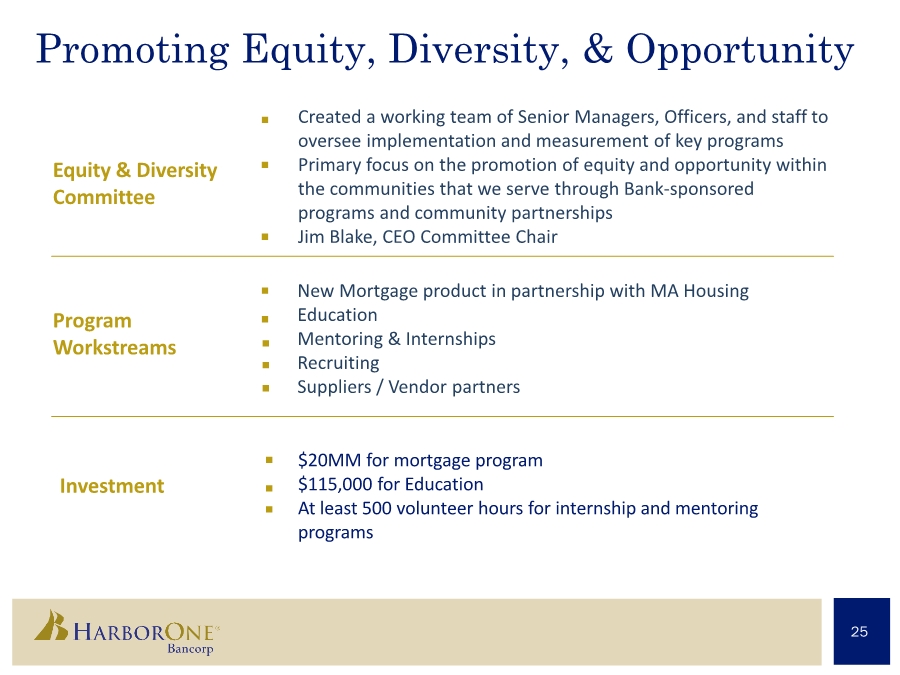
| Promoting Equity, Diversity, & Opportunity Program Workstreams Investment Equity & Diversity Committee . . $20MM for mortgage program $115,000 for Education At least 500 volunteer hours for internship and mentoring programs 25 Created a working team of Senior Managers, Officers, and staff to oversee implementation and measurement of key programs Primary focus on the promotion of equity and opportunity within the communities that we serve through Bank-sponsored programs and community partnerships Jim Blake, CEO Committee Chair . . . New Mortgage product in partnership with MA Housing Education Mentoring & Internships Recruiting Suppliers / Vendor partners . . . . . . |
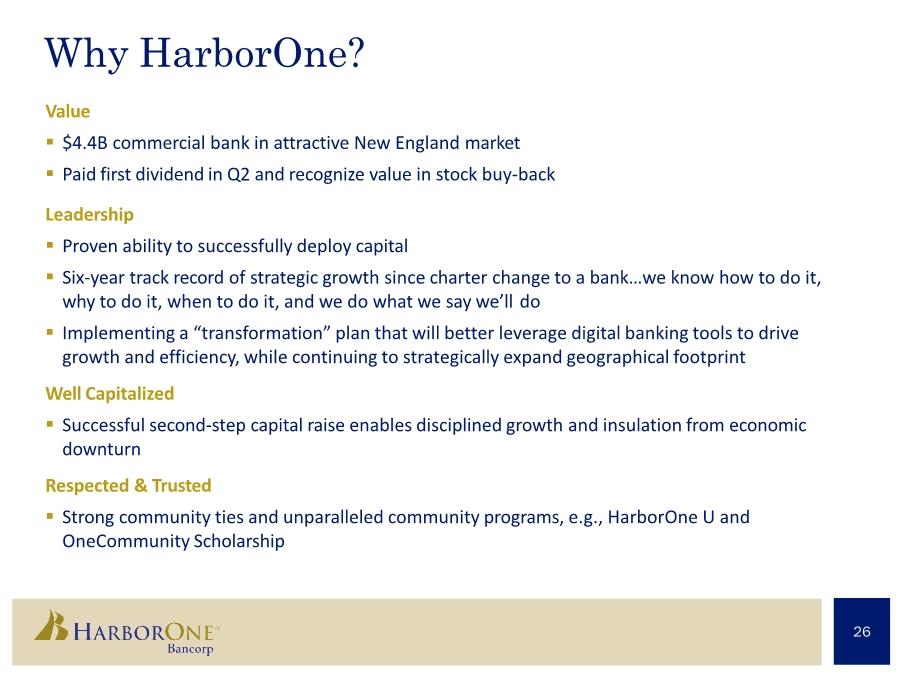
| Why HarborOne? 26 Value . $4.4B commercial bank in attractive New England market . Paid first dividend in Q2 and recognize value in stock buy-back Leadership . Proven ability to successfully deploy capital . Six-year track record of strategic growth since charter change to a bank…we know how to do it, why to do it, when to do it, and we do what we say we’ll do . Implementing a “transformation” plan that will better leverage digital banking tools to drive growth and efficiency, while continuing to strategically expand geographical footprint Well Capitalized . Successful second-step capital raise enables disciplined growth and insulation from economic downturn Respected & Trusted . Strong community ties and unparalleled community programs, e.g., HarborOne U and OneCommunity Scholarship |
| A Commitment To Doing What’s Right Mission Statement We provide a personalized experience while caring about every customer. We focus on understanding their financial goals for today and dreams for tomorrow. We are unwavering in our commitment to the communities that we serve. Vision Statement To be our customers’ most trusted financial partner. 27 Our Values Integrity. Teamwork. Trust. Respect. Accountability. |
| “ Our vision for the future is disciplined, organic growth. Our commitment to those we serve and each other is to be the very best that we can be, every day. We embrace challenge, seek opportunity, and are steadfast in our focus to build an exceptional company.” 28 – Jim Blake, CEO |