Attached files
| file | filename |
|---|---|
| EX-99.1 - EXHIBIT 99.1 - New Senior Investment Group Inc. | a52317346ex99_1.htm |
| 8-K - NEW SENIOR INVESTMENT GROUP INC. 8-K - New Senior Investment Group Inc. | a52317346.htm |
|
|
Exhibit 99.2
|
Company Update October 30, 2020 Stone LodgeBend, OR
Forward-Looking Statements, Non-GAAP and Other Information 1 IN GENERAL. This disclaimer applies to
this document and the verbal or written comments of any person presenting it. This document, taken together with any such verbal or written comments, is referred to herein as the “Presentation.” Throughout this Presentation, New Senior
Investment Group Inc. (NYSE: SNR) is referred to as “New Senior,” the “Company,” “SNR” or “we.”FORWARD-LOOKING STATEMENTS. Certain information in this Presentation may constitute “forward-looking statements” within the meaning of the Private
Securities Litigation Reform Act of 1995, including without limitation statements regarding expectations with respect to the potential range of 2020 financial results, the expected impact of the COVID-19 pandemic on our business, liquidity,
properties, operators and the health systems and populations that we serve; the cost and effectiveness of measures we have taken to respond to the COVID-19 pandemic, including health and safety protocols that are intended to limit the
transmission of COVID-19 at our properties; and our expected occupancy rates and operating expenses. These statements are not historical facts. They represent management’s current expectations regarding future events and are subject to a
number of risks and uncertainties, many of which are beyond our control, that could cause actual results to differ materially from those described in the forward-looking statements. These risks and uncertainties include, but are not limited
to, risks and uncertainties relating to the continuing impact of COVID-19 on our operations and the operation of our facilities, including ongoing cases at certain of our facilities, the speed, geographic reach and duration of the COVID-19
pandemic; the legal, regulatory and administrative developments that occur at the federal, state and local levels; the efficacy of our operators’ infectious disease protocols and prevention efforts; the broader impact of the pandemic on local
economies and labor markets; the overall demand for our communities in the recovery period following the pandemic; our ability to successfully manage the asset management by third parties; and market conditions generally which affect demand
and supply for senior housing. We believe that the adverse impact that COVID-19 will have on the future operations and financial results at our communities will depend upon many factors, most of which are beyond our ability to control or
predict. Accordingly, you should not place undue reliance on any forward-looking statements contained herein. For a discussion of these and other risks and important factors that could affect such forward-looking statements, see the sections
entitled “Risk Factors” and “Management’s Discussion and Analysis of Financial Condition and Results of Operations” in the Company’s most recent annual and quarterly reports filed with the Securities and Exchange Commission, which are
available on the Company’s website (www.newseniorinv.com). New risks and uncertainties emerge from time to time, and it is not possible for us to predict or assess the impact of every factor that may cause our results to differ materially
from those anticipated by any forward-looking statements. Forward-looking statements contained herein, and all statements made in this Presentation, speak only as of the date of this Presentation, and the Company expressly disclaims any duty
or obligation to release publicly any updates or revisions to any statements contained herein to reflect any change in the Company’s expectations with regard thereto or change in events, conditions or circumstances on which any statement is
based.ROUNDING. Throughout this Presentation, totals and subtotals of certain tables may not sum due to rounding.NON-GAAP FINANCIAL INFORMATION. This Presentation includes information based on financial measures that are not recognized under
generally accepted accounting principles (“GAAP”), such as NOI, cash NOI, adjusted same store cash NOI, Normalized FFO, AFFO and Normalized FAD. You should use non‐GAAP information in addition to, and not as an alternative to, financial
information prepared in accordance with GAAP. See the end of this Presentation for reconciliations to the most comparable GAAP measures and an explanation of each of our non-GAAP measures. Our non-GAAP measures may not be identical or
comparable to measures with the same name presented by other companies due to differences in calculation, capital structure or other factors. PAST PERFORMANCE. In all cases where historical results are presented or past performance is
described, we note that past performance is not a reliable indicator of future results and performance.GLOSSARY. See the Glossary at the end of this Presentation for an explanation of various terms used herein.

Table of Contents SECTIONS PAGES I. Executive Summary & Company Overview 4 –
7 II. COVID-19 Situation Update 9 – 11 III. Financial Update 13 – 20 IV. Reconciliations and Glossary 22 – 27 2
Executive Summary & Company Overview Madison EstatesSan Antonio, TX
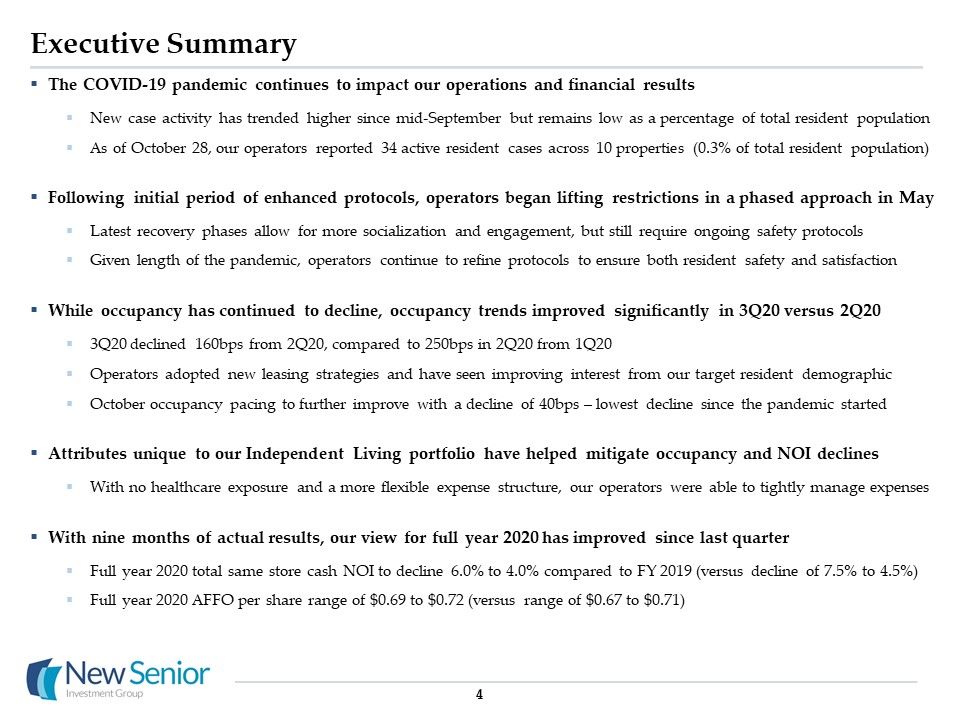
Executive Summary 4 The COVID-19 pandemic continues to impact our operations and financial results
New case activity has trended higher since mid-September but remains low as a percentage of total resident populationAs of October 28, our operators reported 34 active resident cases across 10 properties (0.3% of total resident
population)Following initial period of enhanced protocols, operators began lifting restrictions in a phased approach in MayLatest recovery phases allow for more socialization and engagement, but still require ongoing safety protocolsGiven
length of the pandemic, operators continue to refine protocols to ensure both resident safety and satisfactionWhile occupancy has continued to decline, occupancy trends improved significantly in 3Q20 versus 2Q203Q20 declined 160bps from 2Q20,
compared to 250bps in 2Q20 from 1Q20 Operators adopted new leasing strategies and have seen improving interest from our target resident demographic October occupancy pacing to further improve with a decline of 40bps – lowest decline since the
pandemic started Attributes unique to our Independent Living portfolio have helped mitigate occupancy and NOI declines With no healthcare exposure and a more flexible expense structure, our operators were able to tightly manage expensesWith
nine months of actual results, our view for full year 2020 has improved since last quarterFull year 2020 total same store cash NOI to decline 6.0% to 4.0% compared to FY 2019 (versus decline of 7.5% to 4.5%)Full year 2020 AFFO per share range
of $0.69 to $0.72 (versus range of $0.67 to $0.71)

New Senior Overview New Senior Investment Group Inc. (NYSE: SNR) is a publicly-traded REIT with a
portfolio of 102 Independent Living (IL) properties and one NNN leased property Pure Play REIT Uniquely Positioned Geographic Diversification & Scale Experienced Operator Mix Uniquely positioned to capitalize on
long-term industry fundamentals95% of NOI from high-margin IL properties(1) The only pure play, publicly-traded senior housing REIT in the U.S.100% private pay senior housingAll properties wholly owned Partnered with experienced senior
housing operators4 operator relationships Holiday: 3rd largest senior housing operator(2) One of the largest owners of senior housing with a national footprint11th largest owner of senior housing(2)Diversified across 36 states Percentage
calculated based on 3Q20 NOI.ASHA, “50 Largest U.S. Seniors Housing Real Estate Owners and Operators,” June 1, 2020. 103 Properties12,405 Units 5

Geographically Diversified Portfolio Portfolio of 103 properties located in 36 different
statesProperties located in markets with favorable demographic trends Properties predominately located outside of major metropolitan areas66% of NOI generated from properties located in secondary and tertiary markets(1) 6 Top Markets and
States National Footprint As defined by National Investment Center for Seniors Housing & Care (NIC); Tertiary markets include Additional markets and markets not covered by NIC.Percentages calculated based on 3Q20
NOI. Top
5 States Properties % of NOI(2) California 9 11% North Carolina 8 10% Pennsylvania 5 9% Florida 9 8% Oregon 8 8% Markets(1) Properties % of NOI(2) Primary 32 34% Secondary 32 33% Tertiary 39 33% Managed
IL PropertiesNNN Lease
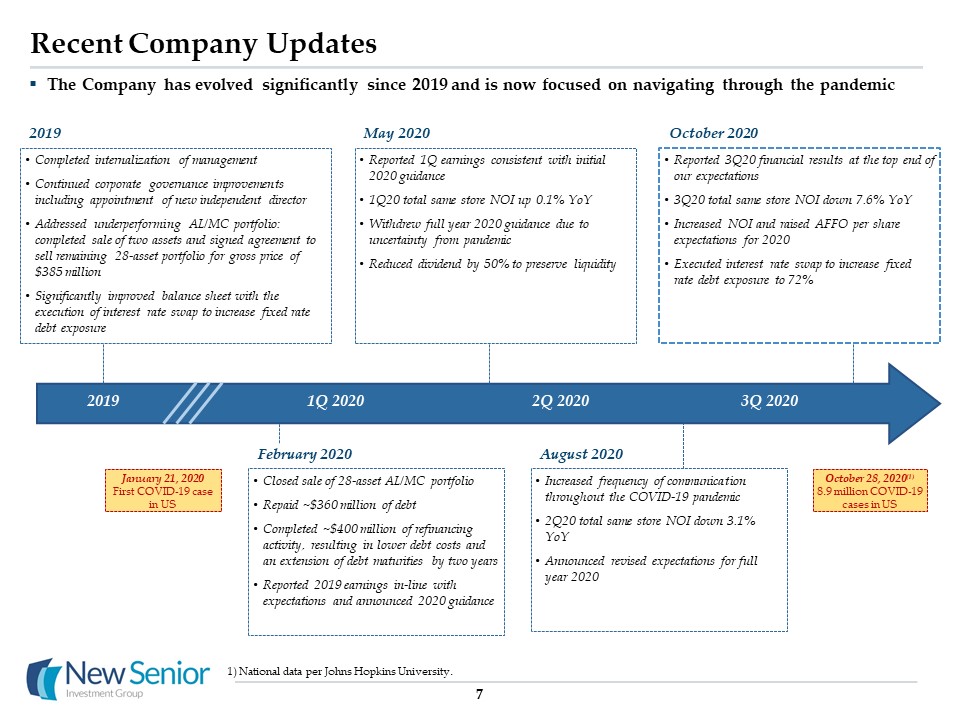
7 Recent Company Updates The Company has evolved significantly since 2019 and is now focused on
navigating through the pandemic Completed internalization of managementContinued corporate governance improvements including appointment of new independent directorAddressed underperforming AL/MC portfolio: completed sale of two assets
and signed agreement to sell remaining 28-asset portfolio for gross price of $385 millionSignificantly improved balance sheet with the execution of interest rate swap to increase fixed rate debt exposure 2019 Closed sale of 28-asset AL/MC
portfolioRepaid ~$360 million of debt Completed ~$400 million of refinancing activity, resulting in lower debt costs and an extension of debt maturities by two yearsReported 2019 earnings in-line with expectations and announced 2020
guidance February 2020 2019 1Q 2020 3Q 2020 2Q 2020 Reported 1Q earnings consistent with initial 2020 guidance1Q20 total same store NOI up 0.1% YoY Withdrew full year 2020 guidance due to uncertainty from pandemicReduced dividend by 50%
to preserve liquidity May 2020 Increased frequency of communication throughout the COVID-19 pandemic 2Q20 total same store NOI down 3.1% YoY Announced revised expectations for full year 2020 August 2020 Reported 3Q20 financial results at
the top end of our expectations 3Q20 total same store NOI down 7.6% YoY Increased NOI and raised AFFO per share expectations for 2020 Executed interest rate swap to increase fixed rate debt exposure to 72% October 2020 January 21, 2020
First COVID-19 case in US October 28, 2020(1)8.9 million COVID-19 cases in US National data per Johns Hopkins University.

COVID-19 Situation Update Copley PlaceCopley, OH
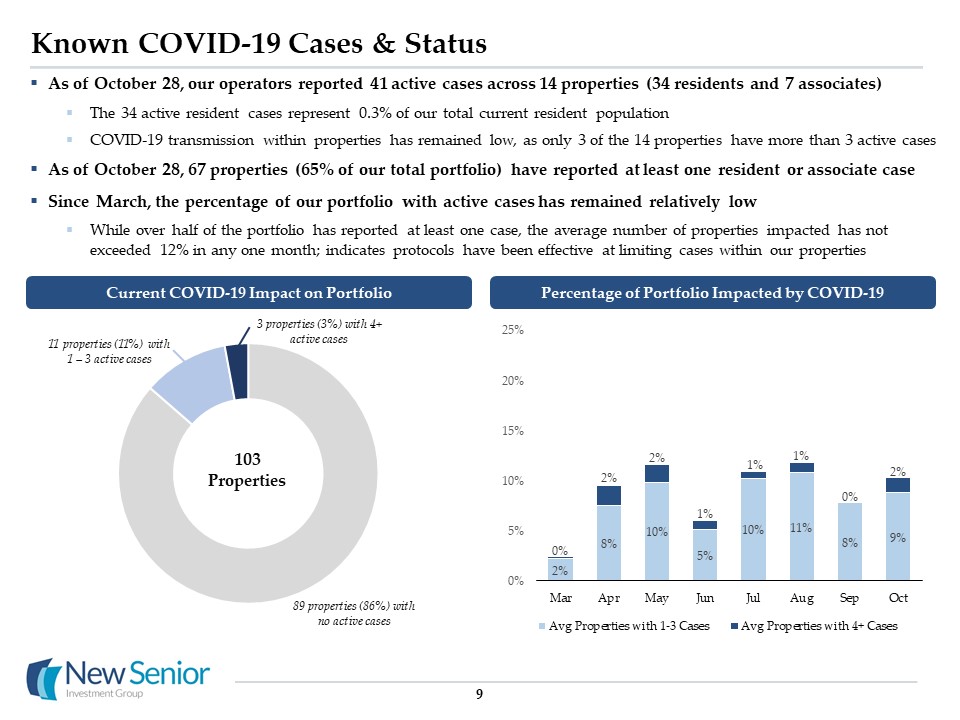
Known COVID-19 Cases & Status As of October 28, our operators reported 41 active cases across 14
properties (34 residents and 7 associates)The 34 active resident cases represent 0.3% of our total current resident populationCOVID-19 transmission within properties has remained low, as only 3 of the 14 properties have more than 3 active
cases As of October 28, 67 properties (65% of our total portfolio) have reported at least one resident or associate caseSince March, the percentage of our portfolio with active cases has remained relatively low While over half of the
portfolio has reported at least one case, the average number of properties impacted has not exceeded 12% in any one month; indicates protocols have been effective at limiting cases within our properties 9 Percentage of Portfolio Impacted
by COVID-19 Current COVID-19 Impact on Portfolio 103 Properties 89 properties (86%) with no active cases 11 properties (11%) with 1 – 3 active cases 3 properties (3%) with 4+ active cases
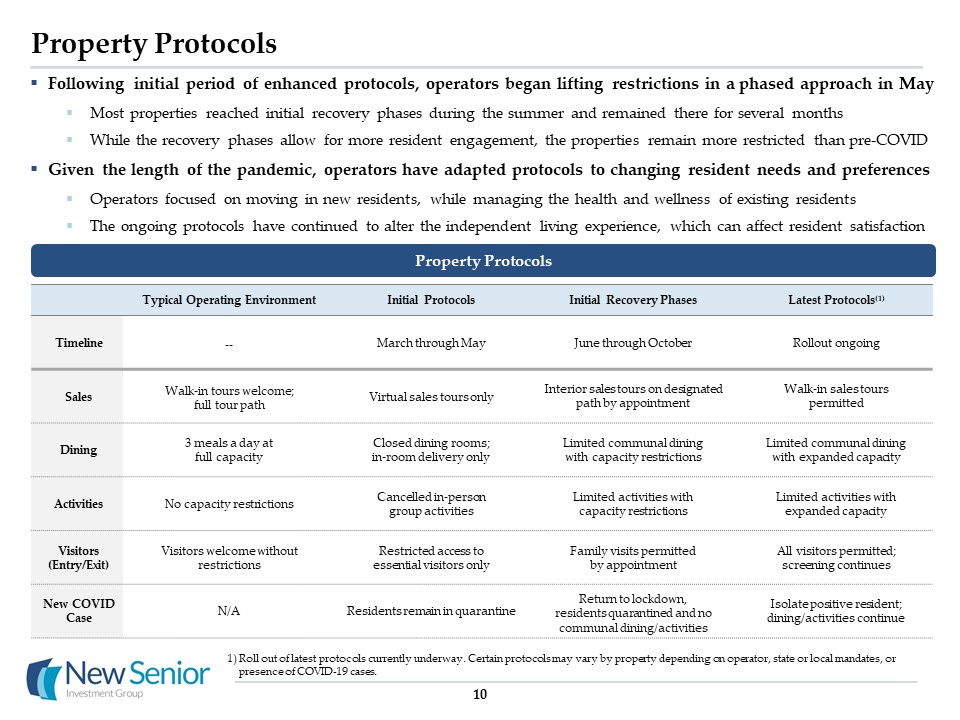
Property Protocols Property Protocols Roll out of latest protocols currently underway. Certain
protocols may vary by property depending on operator, state or local mandates, or presence of COVID-19 cases. Typical Operating Environment Initial Protocols Initial Recovery Phases Latest Protocols(1) Timeline -- March through May
June through October Rollout ongoing Sales Walk-in tours welcome;full tour path Virtual sales tours only Interior sales tours on designated path by appointment Walk-in sales tourspermitted Dining 3 meals a day at full
capacity Closed dining rooms; in-room delivery only Limited communal dining with capacity restrictions Limited communal dining with expanded capacity Activities No capacity restrictions Cancelled in-person group activities Limited
activities with capacity restrictions Limited activities with expanded capacity Visitors (Entry/Exit) Visitors welcome without restrictions Restricted access to essential visitors only Family visits permitted by appointment All visitors
permitted; screening continues New COVID Case N/A Residents remain in quarantine Return to lockdown, residents quarantined and no communal dining/activities Isolate positive resident; dining/activities continue Following initial period
of enhanced protocols, operators began lifting restrictions in a phased approach in MayMost properties reached initial recovery phases during the summer and remained there for several monthsWhile the recovery phases allow for more resident
engagement, the properties remain more restricted than pre-COVIDGiven the length of the pandemic, operators have adapted protocols to changing resident needs and preferences Operators focused on moving in new residents, while managing the
health and wellness of existing residents The ongoing protocols have continued to alter the independent living experience, which can affect resident satisfaction 10
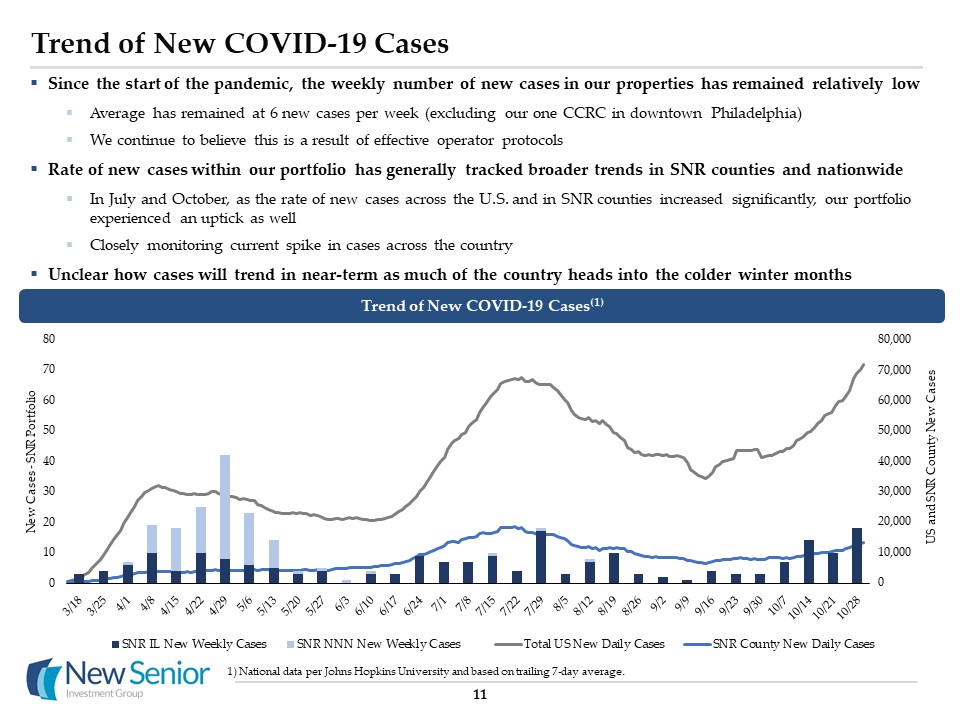
Trend of New COVID-19 Cases Since the start of the pandemic, the weekly number of new cases in our
properties has remained relatively low Average has remained at 6 new cases per week (excluding our one CCRC in downtown Philadelphia)We continue to believe this is a result of effective operator protocolsRate of new cases within our portfolio
has generally tracked broader trends in SNR counties and nationwide In July and October, as the rate of new cases across the U.S. and in SNR counties increased significantly, our portfolio experienced an uptick as wellClosely monitoring
current spike in cases across the country Unclear how cases will trend in near-term as much of the country heads into the colder winter months 11 Trend of New COVID-19 Cases(1) National data per Johns Hopkins University and based on
trailing 7-day average.
Financial Update The JeffersonMiddleton, WI
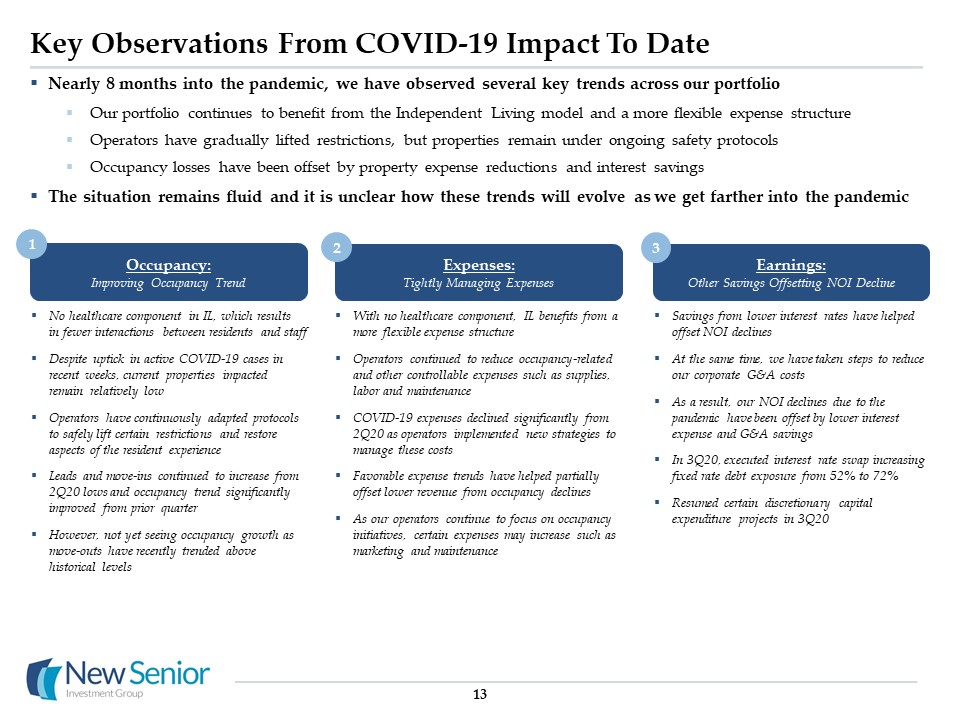
Key Observations From COVID-19 Impact To Date 13 Occupancy:Improving Occupancy Trend
Expenses:Tightly Managing Expenses Earnings:Other Savings Offsetting NOI Decline No healthcare component in IL, which results in fewer interactions between residents and staffDespite uptick in active COVID-19 cases in recent weeks,
current properties impacted remain relatively low Operators have continuously adapted protocols to safely lift certain restrictions and restore aspects of the resident experienceLeads and move-ins continued to increase from 2Q20 lows and
occupancy trend significantly improved from prior quarterHowever, not yet seeing occupancy growth as move-outs have recently trended above historical levels With no healthcare component, IL benefits from a more flexible expense
structureOperators continued to reduce occupancy-related and other controllable expenses such as supplies, labor and maintenanceCOVID-19 expenses declined significantly from 2Q20 as operators implemented new strategies to manage these costs
Favorable expense trends have helped partially offset lower revenue from occupancy declinesAs our operators continue to focus on occupancy initiatives, certain expenses may increase such as marketing and maintenance Savings from lower
interest rates have helped offset NOI declines At the same time, we have taken steps to reduce our corporate G&A costs As a result, our NOI declines due to the pandemic have been offset by lower interest expense and G&A savingsIn
3Q20, executed interest rate swap increasing fixed rate debt exposure from 52% to 72% Resumed certain discretionary capital expenditure projects in 3Q20 1 2 3 Nearly 8 months into the pandemic, we have observed several key trends across
our portfolio Our portfolio continues to benefit from the Independent Living model and a more flexible expense structure Operators have gradually lifted restrictions, but properties remain under ongoing safety protocols Occupancy losses have
been offset by property expense reductions and interest savings The situation remains fluid and it is unclear how these trends will evolve as we get farther into the pandemic

Summary of 3Q 2020 Results & October Trends 14 Ending occupancy down 160bps sequentially from
2Q20 to 3Q20, down 540bps since February (pandemic start)Move-in volume recovered to pre-COVID levels in July and August; October trending to be best month since pandemicMove-outs are trending above historical average and continue to outpace
move-ins; October ending occupancy pacing to decline 40bps from September Occupancy 3Q20 total same store cash NOI down 7.6% YoY and down 6.5% QoQ 3Q20 cash interest expense down 5% or $0.7 million versus 2Q20 3Q20 AFFO per share of $0.17,
down $0.02 per share versus 2Q20 and flat versus 3Q19 NOI & AFFO YoY: 3Q20 expenses down 1.4% from 3Q19, decrease driven by occupancy-related and other controllable expensesExcluding COVID-19 expenses 3Q20 expenses were down 3.0% QoQ:
3Q20 expenses up 2.5% from 2Q20, increase driven by typical seasonality (warmer summer months) Operating Expenses 3Q20 was the second full quarter where COVID-19 impacted the Company’s results 3Q20 total same store cash NOI and AFFO per
share were at the top end of our expectationsOccupancy declines offset by lower occupancy-related, other controllable expenses and COVID-19 expensesInterest expense continued to decline sequentially driven by lower LIBOR rates, offsetting NOI
declines
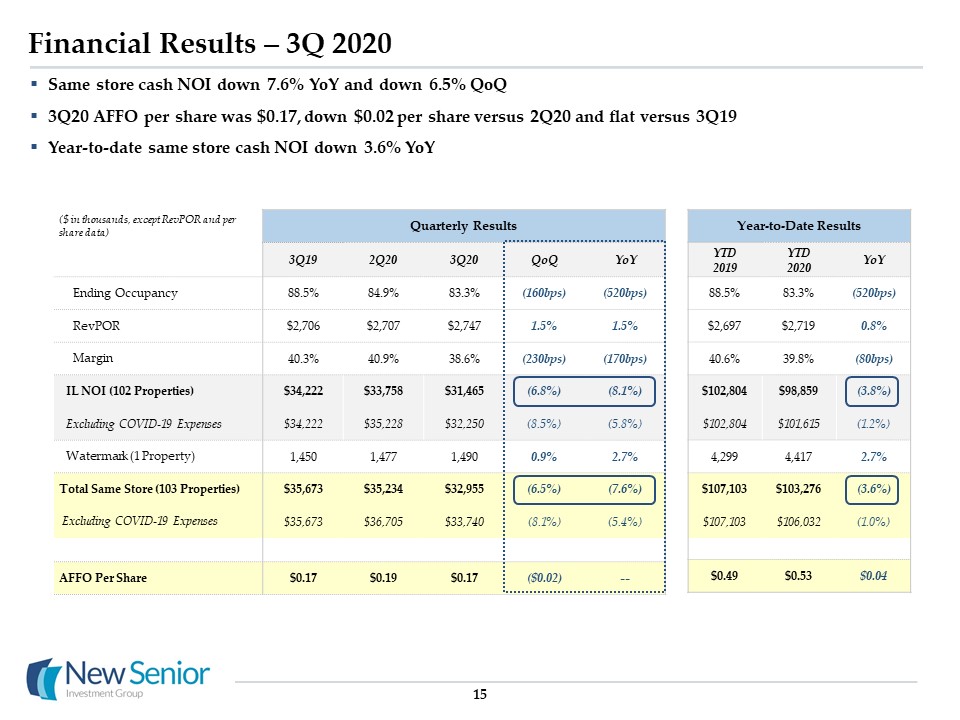
Year-to-Date Results YTD2019 YTD2020 YoY 88.5% 83.3% (520bps) $2,697 $2,719
0.8% 40.6% 39.8% (80bps) $102,804 $98,859 (3.8%) $102,804 $101,615 (1.2%) 4,299 4,417 2.7% $107,103 $103,276 (3.6%) $107,103 $106,032 (1.0%) $0.49 $0.53 $0.04 15 Financial Results – 3Q 2020 Same store
cash NOI down 7.6% YoY and down 6.5% QoQ3Q20 AFFO per share was $0.17, down $0.02 per share versus 2Q20 and flat versus 3Q19Year-to-date same store cash NOI down 3.6% YoY ($ in thousands, except RevPOR and per share data) Quarterly Results
3Q19 2Q20 3Q20 QoQ YoY Ending Occupancy 88.5% 84.9% 83.3% (160bps) (520bps) RevPOR $2,706 $2,707 $2,747 1.5% 1.5% Margin 40.3% 40.9% 38.6% (230bps) (170bps) IL NOI (102 Properties) $34,222 $33,758
$31,465 (6.8%) (8.1%) Excluding COVID-19 Expenses $34,222 $35,228 $32,250 (8.5%) (5.8%) Watermark (1 Property) 1,450 1,477 1,490 0.9% 2.7% Total Same Store (103 Properties) $35,673 $35,234 $32,955
(6.5%) (7.6%) Excluding COVID-19 Expenses $35,673 $36,705 $33,740 (8.1%) (5.4%) AFFO Per Share $0.17 $0.19 $0.17 ($0.02) --

Lead and Move-in Trends 16 2020 Monthly Lead Trends 2020 Monthly Move-In Trends +67% Total lead
volume in September increased 67% from April low pointAfter reaching low point in April, leads grew quickly from May to July and held steady through the rest of 3Q20October leads pacing to increase from September and are expected to surpass
2019 average for the first time in 2020Move-ins also increased significantly from April to July and held steady throughout 3Q20October move-ins pacing to increase from September and return closer to 2019 averageUnclear how leads and move-ins
will trend for rest of 4Q20 given current resurgence in national cases +106%
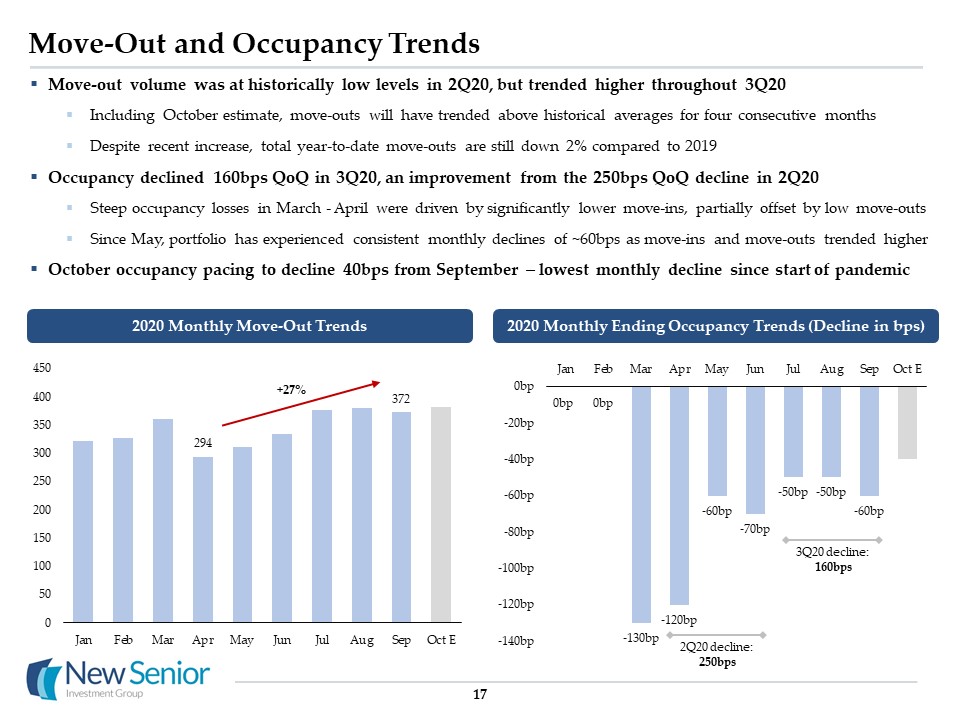
Move-Out and Occupancy Trends 17 Move-out volume was at historically low levels in 2Q20, but trended
higher throughout 3Q20Including October estimate, move-outs will have trended above historical averages for four consecutive monthsDespite recent increase, total year-to-date move-outs are still down 2% compared to 2019Occupancy declined
160bps QoQ in 3Q20, an improvement from the 250bps QoQ decline in 2Q20Steep occupancy losses in March - April were driven by significantly lower move-ins, partially offset by low move-outsSince May, portfolio has experienced consistent
monthly declines of ~60bps as move-ins and move-outs trended higherOctober occupancy pacing to decline 40bps from September – lowest monthly decline since start of pandemic 2020 Monthly Move-Out Trends 2020 Monthly Ending Occupancy Trends
(Decline in bps) +27% 3Q20 decline: 160bps 2Q20 decline: 250bps

18 Expense Trends With no healthcare exposure, our IL portfolio has continued to benefit from a more
flexible expense structureOperators continue to tightly manage occupancy-related and other controllable expenses (marketing, maintenance) Total expenses in 3Q20 were down 1.4% YoY and down 3.0% excluding COVID-19 expenses COVID-19 expenses in
3Q20 decreased 43% from 2Q20 as operators implemented new strategies to reduce costs As a result, margins have continued to remain relatively stable despite occupancy losses 3Q20 Expenses Vs 3Q19 Expenses 1Q 2Q 3Q 4Q Historical
Operating Margins $50.7mm $50.0mm Total expenses down 1.4% YoY
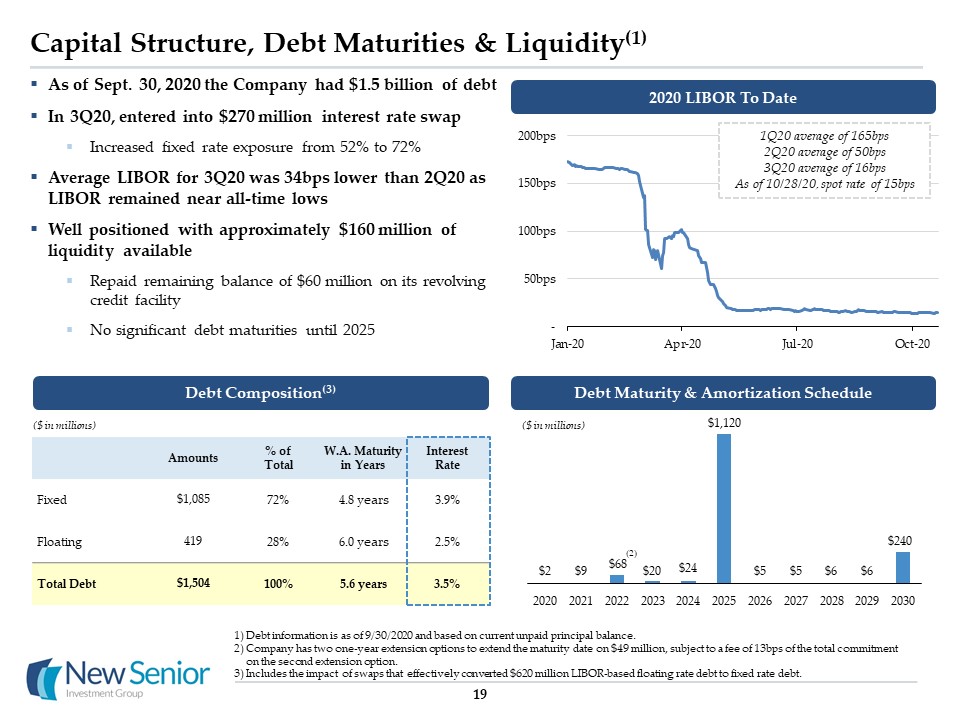
Capital Structure, Debt Maturities & Liquidity(1) Debt information is as of 9/30/2020 and based on
current unpaid principal balance.Company has two one-year extension options to extend the maturity date on $49 million, subject to a fee of 13bps of the total commitment on the second extension option.Includes the impact of swaps that
effectively converted $620 million LIBOR-based floating rate debt to fixed rate debt. 19 Amounts % of Total W.A. Maturity in Years Interest Rate Fixed $1,085 72% 4.8 years 3.9% Floating 419 28% 6.0 years 2.5% Total
Debt $1,504 100% 5.6 years 3.5% As of Sept. 30, 2020 the Company had $1.5 billion of debt In 3Q20, entered into $270 million interest rate swapIncreased fixed rate exposure from 52% to 72%Average LIBOR for 3Q20 was 34bps lower than
2Q20 as LIBOR remained near all-time lows Well positioned with approximately $160 million of liquidity availableRepaid remaining balance of $60 million on its revolving credit facilityNo significant debt maturities until 2025 Debt
Composition(3) Debt Maturity & Amortization Schedule ($ in millions) ($ in millions) (2) 2020 LIBOR To Date 1Q20 average of 165bps2Q20 average of 50bps3Q20 average of 16bpsAs of 10/28/20, spot rate of 15bps
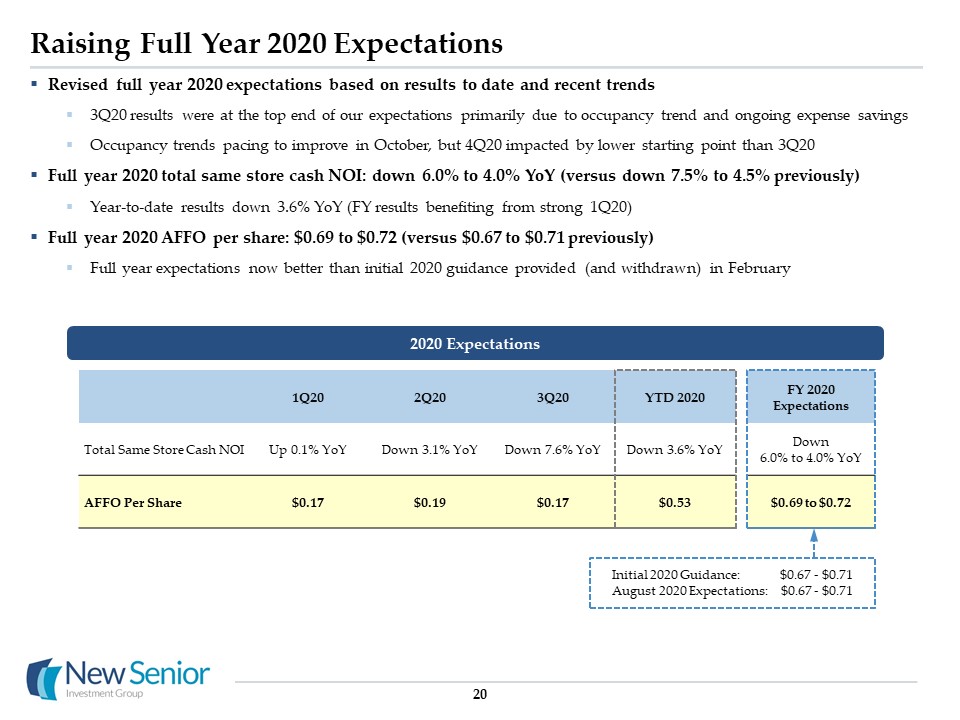
Raising Full Year 2020 Expectations 20 Revised full year 2020 expectations based on results to date
and recent trends3Q20 results were at the top end of our expectations primarily due to occupancy trend and ongoing expense savingsOccupancy trends pacing to improve in October, but 4Q20 impacted by lower starting point than 3Q20 Full year
2020 total same store cash NOI: down 6.0% to 4.0% YoY (versus down 7.5% to 4.5% previously) Year-to-date results down 3.6% YoY (FY results benefiting from strong 1Q20)Full year 2020 AFFO per share: $0.69 to $0.72 (versus $0.67 to $0.71
previously)Full year expectations now better than initial 2020 guidance provided (and withdrawn) in February 1Q20 2Q20 3Q20 YTD 2020 FY 2020 Expectations Total Same Store Cash NOI Up 0.1% YoY Down 3.1% YoY Down 7.6% YoY Down
3.6% YoY Down 6.0% to 4.0% YoY AFFO Per Share $0.17 $0.19 $0.17 $0.53 $0.69 to $0.72 2020 Expectations Initial 2020 Guidance: $0.67 - $0.71August 2020 Expectations: $0.67 - $0.71
Reconciliations & Glossary Echo RidgeKnoxville, TN
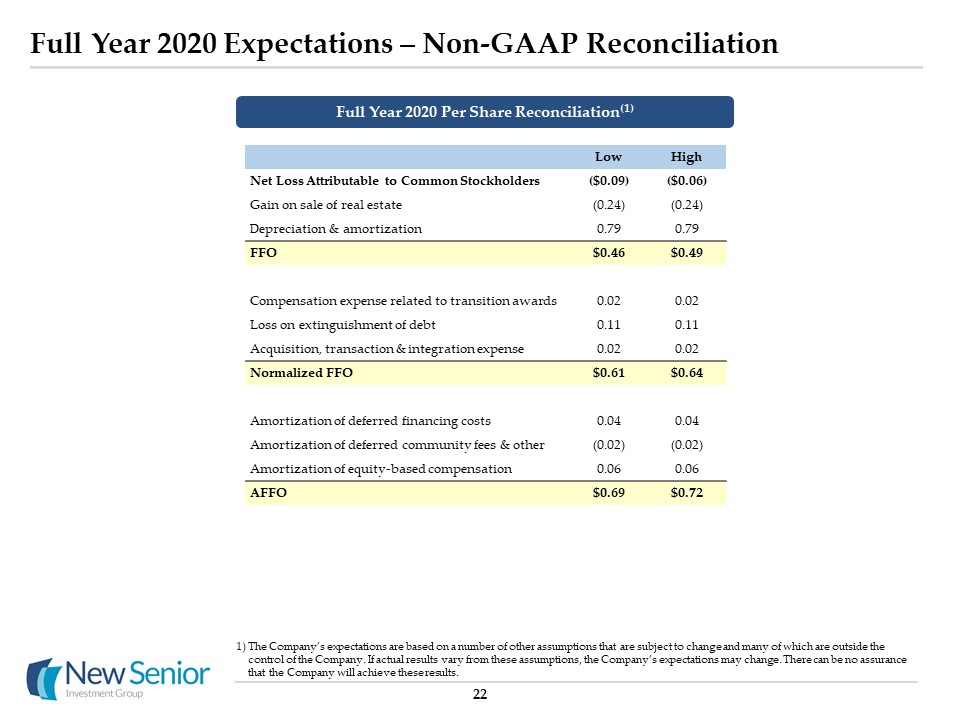
Full Year 2020 Expectations – Non-GAAP Reconciliation 22 Low High Net Loss Attributable to
Common Stockholders ($0.09) ($0.06) Gain on sale of real estate (0.24) (0.24) Depreciation & amortization 0.79 0.79 FFO $0.46 $0.49 Compensation expense related to transition awards 0.02 0.02 Loss on
extinguishment of debt 0.11 0.11 Acquisition, transaction & integration expense 0.02 0.02 Normalized FFO $0.61 $0.64 Amortization of deferred financing costs 0.04 0.04 Amortization of deferred community fees
& other (0.02) (0.02) Amortization of equity-based compensation 0.06 0.06 AFFO $0.69 $0.72 Full Year 2020 Per Share Reconciliation(1) The Company’s expectations are based on a number of other assumptions that are subject to
change and many of which are outside the control of the Company. If actual results vary from these assumptions, the Company’s expectations may change. There can be no assurance that the Company will achieve these results.
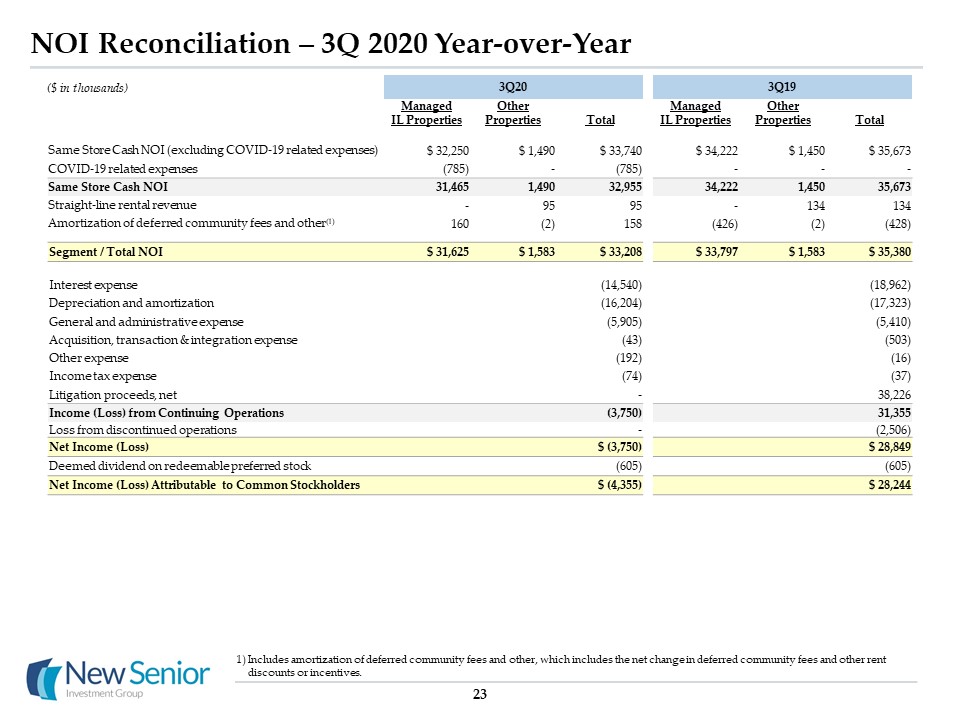
3Q20 3Q19 Managed IL Properties Other Properties Total Managed IL
Properties Other Properties Total Same Store Cash NOI (excluding COVID-19 related expenses) $ 32,250 $ 1,490 $ 33,740 $ 34,222 $ 1,450 $ 35,673 COVID-19 related expenses (785) - (785) - - - Same Store Cash
NOI 31,465 1,490 32,955 34,222 1,450 35,673 Straight-line rental revenue - 95 95 - 134 134 Amortization of deferred community fees and other(1) 160 (2) 158 (426) (2) (428) Segment / Total
NOI $ 31,625 $ 1,583 $ 33,208 $ 33,797 $ 1,583 $ 35,380 Interest expense (14,540) (18,962) Depreciation and amortization (16,204) (17,323) General and administrative expense
(5,905) (5,410) Acquisition, transaction & integration expense (43) (503) Other expense (192) (16) Income tax expense (74) (37) Litigation proceeds, net - 38,226 Income
(Loss) from Continuing Operations (3,750) 31,355 Loss from discontinued operations - (2,506) Net Income (Loss) $ (3,750) $ 28,849 Deemed dividend on redeemable preferred stock (605)
(605) Net Income (Loss) Attributable to Common Stockholders $ (4,355) $ 28,244 NOI Reconciliation – 3Q 2020 Year-over-Year 23 Includes amortization of deferred community fees and other, which includes the net change in
deferred community fees and other rent discounts or incentives. ($ in thousands)

NOI Reconciliation – 3Q 2020 Quarter-over-Quarter 24 Includes amortization of deferred community fees
and other, which includes the net change in deferred community fees and other rent discounts or incentives. 3Q20 2Q20 Managed IL Properties Other Properties Total Managed IL Properties Other
Properties Total Same Store Cash NOI (excluding COVID-19 related expenses) $ 32,250 $ 1,490 $ 33,740 $ 35,228 $ 1,477 $ 36,705 COVID-19 related expenses (785) - (785) (1,470) - (1,470) Same Store Cash
NOI 31,465 1,490 32,955 33,758 1,477 35,234 Straight-line rental revenue - 95 95 - 108 108 Amortization of deferred community fees and other(1) 160 (2) 158 434 (2) 432 Segment / Total NOI $
31,625 $ 1,583 $ 33,208 $ 34,191 $ 1,582 $ 35,773 Interest expense (14,540) (15,281) Depreciation and amortization (16,204) (16,782) General and administrative expense
(5,905) (5,894) Acquisition, transaction & integration expense (43) (19) Other expense (192) (433) Income tax expense (74) (22) Net Loss $ (3,750) $ (2,658) Deemed
dividend on redeemable preferred stock (605) (599) Net Loss Attributable to Common Stockholders $ (4,355) $ (3,257) ($ in thousands)
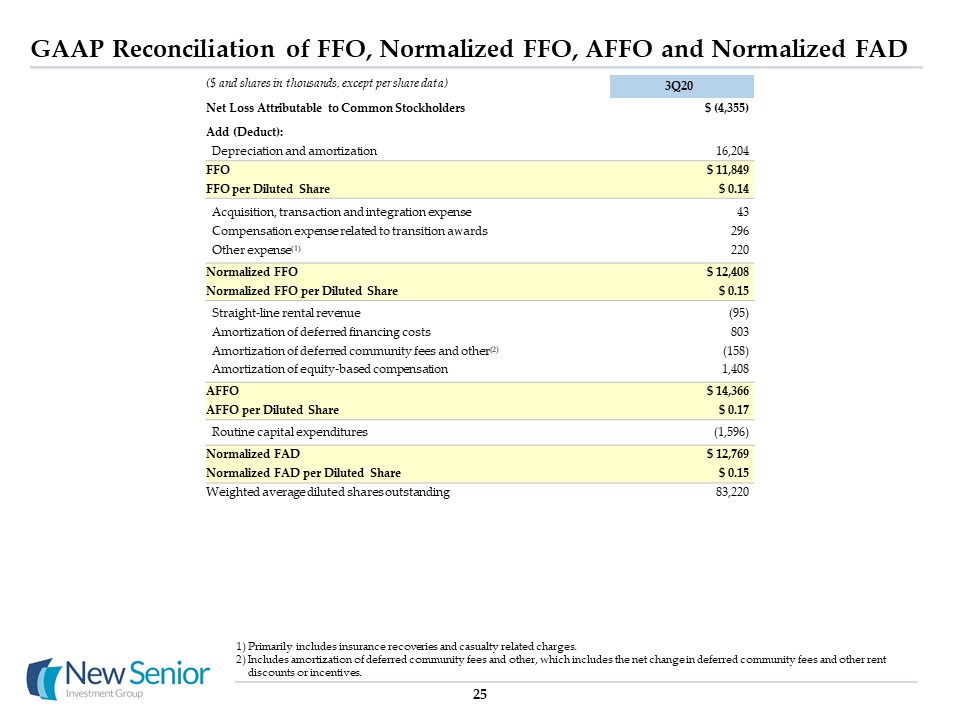
GAAP Reconciliation of FFO, Normalized FFO, AFFO and Normalized FAD 25 Primarily includes insurance
recoveries and casualty related charges.Includes amortization of deferred community fees and other, which includes the net change in deferred community fees and other rent discounts or incentives. 3Q20 Net Loss Attributable to Common
Stockholders $ (4,355) Add (Deduct): Depreciation and amortization 16,204 FFO $ 11,849 FFO per Diluted Share $ 0.14 Acquisition, transaction and integration expense 43 Compensation expense related to transition
awards 296 Other expense(1) 220 Normalized FFO $ 12,408 Normalized FFO per Diluted Share $ 0.15 Straight-line rental revenue (95) Amortization of deferred financing costs 803 Amortization of deferred community fees
and other(2) (158) Amortization of equity-based compensation 1,408 AFFO $ 14,366 AFFO per Diluted Share $ 0.17 Routine capital expenditures (1,596) Normalized FAD $ 12,769 Normalized FAD per Diluted Share $
0.15 Weighted average diluted shares outstanding 83,220 ($ and shares in thousands, except per share data)
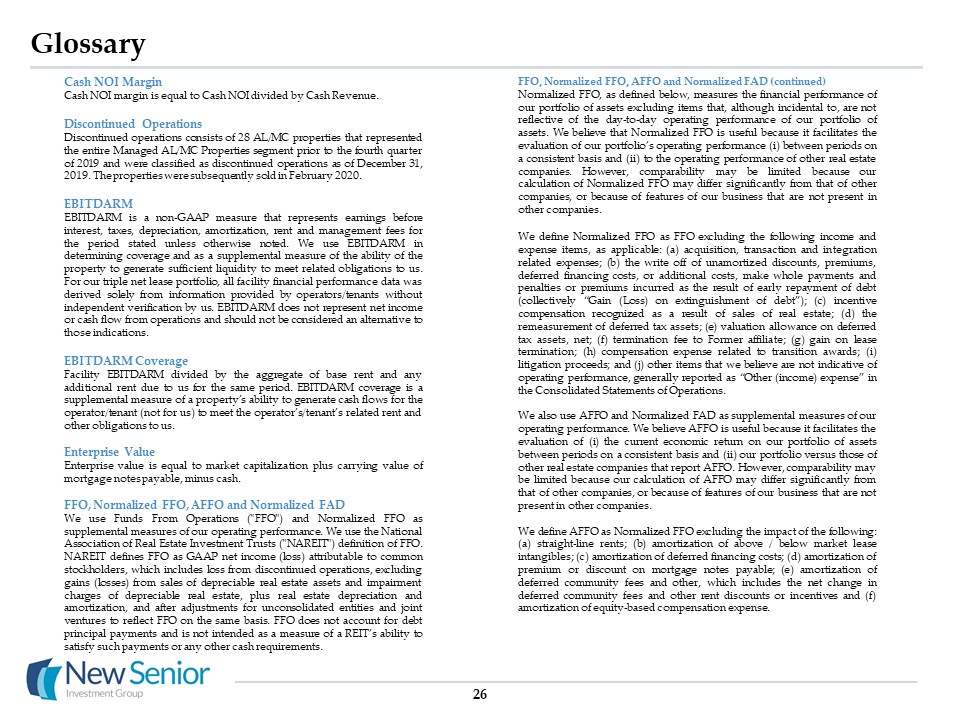
Glossary Cash NOI MarginCash NOI margin is equal to Cash NOI divided by Cash Revenue.Discontinued
OperationsDiscontinued operations consists of 28 AL/MC properties that represented the entire Managed AL/MC Properties segment prior to the fourth quarter of 2019 and were classified as discontinued operations as of December 31, 2019. The
properties were subsequently sold in February 2020. EBITDARMEBITDARM is a non-GAAP measure that represents earnings before interest, taxes, depreciation, amortization, rent and management fees for the period stated unless otherwise noted. We
use EBITDARM in determining coverage and as a supplemental measure of the ability of the property to generate sufficient liquidity to meet related obligations to us. For our triple net lease portfolio, all facility financial performance data
was derived solely from information provided by operators/tenants without independent verification by us. EBITDARM does not represent net income or cash flow from operations and should not be considered an alternative to those indications.
EBITDARM CoverageFacility EBITDARM divided by the aggregate of base rent and any additional rent due to us for the same period. EBITDARM coverage is a supplemental measure of a property’s ability to generate cash flows for the operator/tenant
(not for us) to meet the operator’s/tenant’s related rent and other obligations to us. Enterprise ValueEnterprise value is equal to market capitalization plus carrying value of mortgage notes payable, minus cash. FFO, Normalized FFO, AFFO and
Normalized FADWe use Funds From Operations ("FFO") and Normalized FFO as supplemental measures of our operating performance. We use the National Association of Real Estate Investment Trusts ("NAREIT") definition of FFO. NAREIT defines FFO as
GAAP net income (loss) attributable to common stockholders, which includes loss from discontinued operations, excluding gains (losses) from sales of depreciable real estate assets and impairment charges of depreciable real estate, plus real
estate depreciation and amortization, and after adjustments for unconsolidated entities and joint ventures to reflect FFO on the same basis. FFO does not account for debt principal payments and is not intended as a measure of a REIT’s ability
to satisfy such payments or any other cash requirements. FFO, Normalized FFO, AFFO and Normalized FAD (continued)Normalized FFO, as defined below, measures the financial performance of our portfolio of assets excluding items that, although
incidental to, are not reflective of the day-to-day operating performance of our portfolio of assets. We believe that Normalized FFO is useful because it facilitates the evaluation of our portfolio’s operating performance (i) between periods
on a consistent basis and (ii) to the operating performance of other real estate companies. However, comparability may be limited because our calculation of Normalized FFO may differ significantly from that of other companies, or because of
features of our business that are not present in other companies.We define Normalized FFO as FFO excluding the following income and expense items, as applicable: (a) acquisition, transaction and integration related expenses; (b) the write off
of unamortized discounts, premiums, deferred financing costs, or additional costs, make whole payments and penalties or premiums incurred as the result of early repayment of debt (collectively “Gain (Loss) on extinguishment of debt”); (c)
incentive compensation recognized as a result of sales of real estate; (d) the remeasurement of deferred tax assets; (e) valuation allowance on deferred tax assets, net; (f) termination fee to Former affiliate; (g) gain on lease termination;
(h) compensation expense related to transition awards; (i) litigation proceeds; and (j) other items that we believe are not indicative of operating performance, generally reported as “Other (income) expense” in the Consolidated Statements of
Operations. We also use AFFO and Normalized FAD as supplemental measures of our operating performance. We believe AFFO is useful because it facilitates the evaluation of (i) the current economic return on our portfolio of assets between
periods on a consistent basis and (ii) our portfolio versus those of other real estate companies that report AFFO. However, comparability may be limited because our calculation of AFFO may differ significantly from that of other companies, or
because of features of our business that are not present in other companies. We define AFFO as Normalized FFO excluding the impact of the following: (a) straight-line rents; (b) amortization of above / below market lease intangibles; (c)
amortization of deferred financing costs; (d) amortization of premium or discount on mortgage notes payable; (e) amortization of deferred community fees and other, which includes the net change in deferred community fees and other rent
discounts or incentives and (f) amortization of equity-based compensation expense. 26
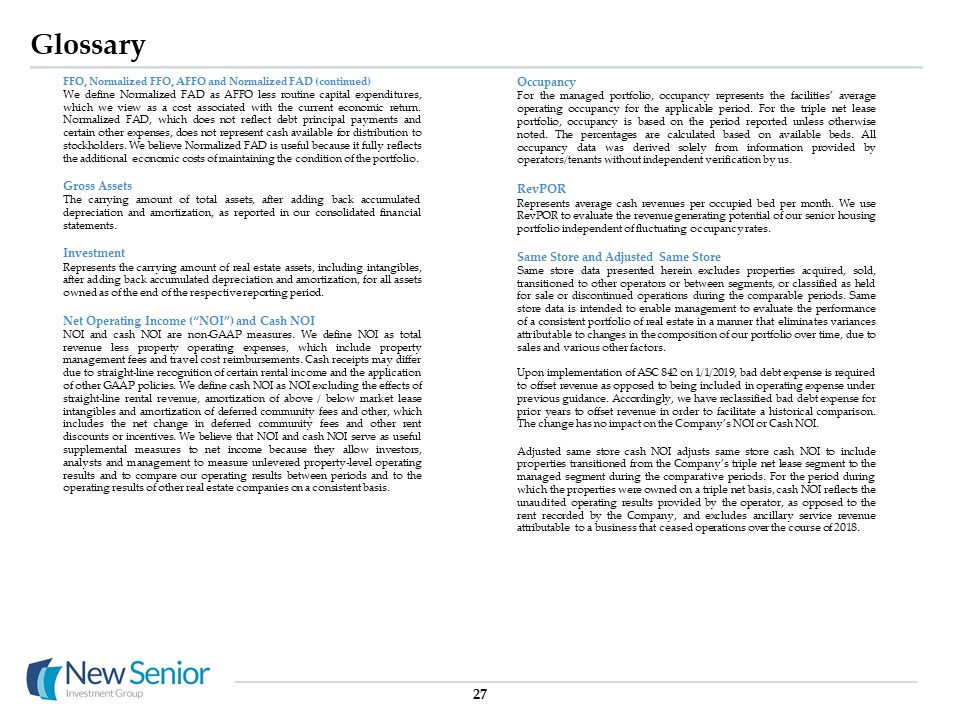
Glossary FFO, Normalized FFO, AFFO and Normalized FAD (continued)We define Normalized FAD as AFFO less
routine capital expenditures, which we view as a cost associated with the current economic return. Normalized FAD, which does not reflect debt principal payments and certain other expenses, does not represent cash available for distribution
to stockholders. We believe Normalized FAD is useful because it fully reflects the additional economic costs of maintaining the condition of the portfolio.Gross Assets The carrying amount of total assets, after adding back accumulated
depreciation and amortization, as reported in our consolidated financial statements. Investment Represents the carrying amount of real estate assets, including intangibles, after adding back accumulated depreciation and amortization, for all
assets owned as of the end of the respective reporting period. Net Operating Income (“NOI”) and Cash NOINOI and cash NOI are non-GAAP measures. We define NOI as total revenue less property operating expenses, which include property management
fees and travel cost reimbursements. Cash receipts may differ due to straight-line recognition of certain rental income and the application of other GAAP policies. We define cash NOI as NOI excluding the effects of straight-line rental
revenue, amortization of above / below market lease intangibles and amortization of deferred community fees and other, which includes the net change in deferred community fees and other rent discounts or incentives. We believe that NOI and
cash NOI serve as useful supplemental measures to net income because they allow investors, analysts and management to measure unlevered property-level operating results and to compare our operating results between periods and to the operating
results of other real estate companies on a consistent basis. 27 Occupancy For the managed portfolio, occupancy represents the facilities’ average operating occupancy for the applicable period. For the triple net lease portfolio, occupancy
is based on the period reported unless otherwise noted. The percentages are calculated based on available beds. All occupancy data was derived solely from information provided by operators/tenants without independent verification by us.
RevPORRepresents average cash revenues per occupied bed per month. We use RevPOR to evaluate the revenue generating potential of our senior housing portfolio independent of fluctuating occupancy rates.Same Store and Adjusted Same StoreSame
store data presented herein excludes properties acquired, sold, transitioned to other operators or between segments, or classified as held for sale or discontinued operations during the comparable periods. Same store data is intended to
enable management to evaluate the performance of a consistent portfolio of real estate in a manner that eliminates variances attributable to changes in the composition of our portfolio over time, due to sales and various other factors. Upon
implementation of ASC 842 on 1/1/2019, bad debt expense is required to offset revenue as opposed to being included in operating expense under previous guidance. Accordingly, we have reclassified bad debt expense for prior years to offset
revenue in order to facilitate a historical comparison. The change has no impact on the Company’s NOI or Cash NOI.Adjusted same store cash NOI adjusts same store cash NOI to include properties transitioned from the Company’s triple net lease
segment to the managed segment during the comparative periods. For the period during which the properties were owned on a triple net basis, cash NOI reflects the unaudited operating results provided by the operator, as opposed to the rent
recorded by the Company, and excludes ancillary service revenue attributable to a business that ceased operations over the course of 2018.