Attached files
| file | filename |
|---|---|
| EX-32.1 - EXHIBIT 32.1 - URANIUM ENERGY CORP | ex_208621.htm |
| EX-31.2 - EXHIBIT 31.2 - URANIUM ENERGY CORP | ex_208620.htm |
| EX-31.1 - EXHIBIT 31.1 - URANIUM ENERGY CORP | ex_208619.htm |
| EX-23.2 - EXHIBIT 23.2 - URANIUM ENERGY CORP | ex_209364.htm |
| EX-23.1 - EXHIBIT 23.1 - URANIUM ENERGY CORP | ex_208618.htm |
| EX-21.1 - EXHIBIT 21.1 - URANIUM ENERGY CORP | ex_208617.htm |
UNITED STATES
SECURITIES AND EXCHANGE COMMISSION
Washington, D.C. 20549
FORM 10-K
|
☒ |
ANNUAL REPORT PURSUANT TO SECTION 13 OR 15(d) OF THE SECURITIES EXCHANGE ACT OF 1934 |
For the fiscal year ended July 31, 2020
|
☐ |
TRANSITION REPORT PURSUANT TO SECTION 13 OR 15(d) OF THE SECURITIES EXCHANGE ACT OF 1934 |
For the transition period from ________________ to ________________
Commission file number: 001-33706
URANIUM ENERGY CORP.
(Exact name of registrant as specified in its charter)
|
Nevada |
98-0399476 |
1030 West Georgia Street, Suite 1830, Vancouver, British Columbia, Canada, V6E 2Y3
(Address of principal executive offices)
(604) 682-9775
(Registrant’s telephone number, including area code)
Securities registered pursuant to Section 12(b) of the Act:
|
Title of each class: |
Trading Symbol(s) |
Name of each exchange on which registered: |
|
Common Stock |
UEC |
NYSE American |
Securities registered pursuant to Section 12(g) of the Act:
N/A
(Title of class)
Indicate by check mark if the registrant is a well-known seasoned issuer, as defined in Rule 405 of the Securities Act.
Yes ☐ No ☒
Indicate by check mark if the registrant is not required to file reports pursuant to Section 13 or Section 15(d) of the Act.
Yes ☐ No ☒
Indicate by check mark whether the registrant (1) has filed all reports required to be filed by Section 13 or 15(d) of the Securities Exchange Act of 1934 during the preceding 12 months (or for such shorter period that the registrant was required to file such reports), and (2) has been subject to such filing requirements for the past 90 days.
Yes ☒ No ☐
Indicate by check mark whether the registrant has submitted electronically every Interactive Data File required to be submitted pursuant to Rule 405 of Regulation S-T (§232.405 of this chapter) during the preceding 12 months (or for such shorter period that the registrant was required to submit such files). Yes ☒ No ☐
Indicate by checkmark whether the registrant is a large accelerated filer, an accelerated filer, a non-accelerated filer, a smaller reporting company, or an emerging growth company. See the definitions of “large accelerated filer”, “accelerated filer”, “smaller reporting company” and “emerging growth company” in Rule 12b-2 of the Exchange Act.
|
☐ Large accelerated filer |
☐ Accelerated filer |
|
☒ Non-accelerated filer |
☒ Smaller reporting company |
|
☐ Emerging growth company |
If an emerging growth company, indicate by check mark if the registrant has elected not to use the extended transition period for complying with any new or revised financial accounting standards provided pursuant to Section 13(a) of the Exchange Act. ☐
Indicate by check mark whether the registrant has filed a report on and attestation to its management’s assessment of the effectiveness of its internal control over financial reporting under Section 404(b) of the Sarbanes-Oxley Act (15 U.S.C. 7262(b)) by the registered public accounting firm that prepared or issued its audit report. ☐
Indicate by checkmark whether the registrant is a shell company (as defined in Rule 12b-2 of the Exchange Act).
Yes ☐ No ☒
The aggregate market value of the voting and non-voting common equity held by non-affiliates computed by reference to the price at which the common equity was last sold as of the last business day of the registrant’s most recently completed second fiscal quarter ($0.83 on January 31, 2020) was approximately $152,449,266.
The registrant had 197,376,792 shares of common stock outstanding as of October 27, 2020.
__________
CAUTIONARY NOTE REGARDING FORWARD-LOOKING STATEMENTS
This Form 10-K Annual Report and any documents incorporated herein by reference (collectively, the “Annual Report”) include statements and information about our strategy, objectives, plans and expectations for the future that are not statements or information of historical fact. These statements and information are considered to be forward-looking statements, or forward-looking information, within the meaning of and under the protection provided by the safe harbor provisions for forward-looking statements as contained in the Private Securities Litigation Reform Act of 1995 and similar Canadian securities laws.
Forward-looking statements, and any estimates and assumptions upon which they are based, are made in good faith and reflect our views and expectations for the future as of the date of this Annual Report, which can change significantly. Furthermore, forward-looking statements are subject to known and unknown risks and uncertainties which may cause actual results, performance, achievements or events to be materially different from any future results, performance, achievements or events implied, suggested or expressed by such forward-looking statements. Accordingly, forward-looking statements in this Annual Report should not be unduly relied upon.
Forward-looking statements may be based on a number of material estimates and assumptions, of which any one or more may prove to be incorrect. Forward-looking statements may be identifiable by terminology concerning the future, such as “anticipate”, “believe”, “continue”, “could”, “estimate”, “expect”, “forecast”, “intend”, “goal”, “likely”, “may”, “might”, “outlook”, “plan”, “predict”, “potential”, “project”, “should”, “schedule”, “strategy”, “target”, “will” or “would”, and similar expressions or variations thereof including the negative use of such terminology. Examples in this Annual Report include, but are not limited to, such forward-looking statements reflecting or pertaining to:
|
● |
our overall strategy, objectives, plans and expectations for the fiscal year ending July 31, 2021 (“Fiscal 2021”) and beyond; |
|
● |
our expectations for worldwide nuclear power generation and future uranium supply and demand, including long-term market prices for U3O8; |
|
● |
our belief and expectations of in-situ recovery mining for our uranium projects, where applicable; |
|
● |
our estimation of mineralized materials, which are based on certain estimates and assumptions, and the economics of future extraction for our uranium projects including the Palangana Mine; |
|
● |
our plans and expectations including anticipated expenditures relating to exploration, pre-extraction, extraction and reclamation activities for our uranium projects including the Palangana Mine; |
|
● |
our ability to obtain, maintain and amend, within a reasonable period of time, required rights, permits and licenses from landowners, governments and regulatory authorities; |
|
● |
our ability to obtain adequate additional financing including access to the equity and credit markets; |
|
● |
our ability to remain in compliance with the terms of our indebtedness; and |
|
● |
our belief and expectations including the possible impact of any legal proceedings or regulatory actions against the Company. |
Forward-looking statements, and any estimates and assumptions upon which they are based, are made as of the date of this Annual Report, and we do not intend or undertake to revise, update or supplement any forward-looking statements to reflect actual results, future events or changes in estimates and assumptions or other factors affecting such forward-looking statements, except as required by applicable securities laws. Should one or more forward-looking statements be revised, updated or supplemented, no inference should be made that we will revise, update or supplement any other forward-looking statements.
Forward-looking statements are subject to known and unknown risks and uncertainties. As discussed in more detail under Item 1A. Risk Factors herein, we have identified a number of material risks and uncertainties which reflect our outlook and conditions known to us as of the date of this Annual Report, including but not limited to the following:
|
● |
our limited financial and operating history; |
|
● |
our need for additional financing; |
|
● |
our ability to service our indebtedness; |
|
● |
our limited uranium extraction and sales history; |
|
● |
our operations are inherently subject to numerous significant risks and uncertainties, of which many are beyond our control; |
|
● |
our exploration activities on our mineral properties may not result in commercially recoverable quantities of uranium; |
|
● |
limits to our insurance coverage; |
|
● |
the level of government regulation, including environmental regulation; |
|
● |
changes in governmental regulation and administrative practices; |
|
● |
nuclear incidents; |
|
● |
the marketability of uranium concentrates; |
|
● |
the competitive environment in which we operate; |
|
● |
our dependence on key personnel; and |
|
● |
conflicts of interest of our directors and officers. |
Any one of the foregoing material risks and uncertainties has the potential to cause actual results, performance, achievements or events to be materially different from any future results, performance, achievements or events implied, suggested or expressed by any forward-looking statements made by us or by persons acting on our behalf. Furthermore, there is no assurance that we will be successful in preventing the material adverse effects that any one or more of these material risks and uncertainties may cause on our business, prospects, financial condition and operating results, or that the foregoing list represents a complete list of the material risks and uncertainties facing us. There may be additional risks and uncertainties of a material nature that, as of the date of this Annual Report, we are unaware of or that we consider immaterial that may become material in the future, any one or more of which may result in a material adverse effect on us.
Forward-looking statements made by us or by persons acting on our behalf are expressly qualified in their entirety by the foregoing cautionary information.
REFERENCES
As used in this Annual Report: (i) the terms “we”, “us”, “our”, “Uranium Energy” and the “Company” mean Uranium Energy Corp., including its wholly-owned subsidiaries and a controlled partnership; (ii) “SEC” refers to the United States Securities and Exchange Commission; (iii) “Securities Act” refers to the United States Securities Act of 1933, as amended; (iv) “Exchange Act” refers to the United States Securities Exchange Act of 1934, as amended; and (v) all dollar amounts refer to United States dollars unless otherwise indicated.
_________
table of contents
|
PART I |
2 |
|
Item 1. Business |
2 |
|
Item 1A. Risk Factors |
12 |
|
Item 1B. Unresolved Staff Comments |
22 |
|
Item 2. Properties |
22 |
|
Item 3. Legal Proceedings |
63 |
|
Item 4. Mine Safety Disclosures |
64 |
|
PART II |
65 |
|
Item 5. Market for Registrant’s Common Equity, Related Stockholder Matters and Issuer Purchases of Equity Securities |
65 |
|
Item 6. Selected Financial Data |
69 |
| Item 7. Management’s Discussion and Analysis of Financial Condition and Results of Operations | 70 |
|
Item 7A. Quantitative and Qualitative Disclosures About Market Risk |
83 |
|
Item 8. Financial Statements and Supplementary Data |
83 |
|
Item 9. Changes in and Disagreements with Accountants on Accounting and Financial Disclosure |
84 |
|
Item 9A. Controls and Procedures |
84 |
|
Item 9B. Other Information |
85 |
|
Part III |
86 |
|
Item 10. Directors, Executive Officers and Corporate Governance |
86 |
|
Item 11. Executive Compensation |
92 |
|
Item 12. Security Ownership of Certain Beneficial Owners and Management and Related Stockholder Matters |
109 |
|
Item 13. Certain Relationships and Related Transactions, and Director Independence |
111 |
|
Item 14. Principal Accounting Fees and Services |
112 |
|
Part IV |
113 |
|
Item 15. Exhibits, Financial Statement Schedules |
113 |
PART I
Item 1. Business
Corporate Organization
Uranium Energy Corp. was incorporated under the laws of the State of Nevada on May 16, 2003 under the name Carlin Gold Inc. During 2004 we changed our business operations and focus from precious metals exploration to uranium exploration in the United States. On January 24, 2005, we completed a reverse stock split of our common stock on the basis of one share for each two outstanding shares and amended our Articles of Incorporation to change our name to Uranium Energy Corp. Effective February 28, 2006, we completed a forward stock split of our common stock on the basis of 1.5 shares for each outstanding share and amended our Articles of Incorporation to increase our authorized capital from 75,000,000 shares of common stock with a par value of $0.001 per share to 750,000,000 shares of common stock with a par value of $0.001 per share. In June 2007 we changed our fiscal year end from December 31 to July 31 (in each instance our “Fiscal” year now).
On December 31, 2007, we incorporated a wholly-owned subsidiary, UEC Resources Ltd., under the laws of the Province of British Columbia, Canada. On December 18, 2009, we acquired a 100% interest in the South Texas Mining Venture, L.L.P. (“STMV”), a Texas limited liability partnership, from each of URN Resources Inc., a subsidiary of Uranium One Inc., and Everest Exploration, Inc. On September 3, 2010, we incorporated a wholly-owned subsidiary, UEC Paraguay Corp., under the laws of the State of Nevada. On May 24, 2011, we acquired a 100% interest in Piedra Rica Mining S.A., a private company incorporated in Paraguay. On September 9, 2011, we acquired a 100% interest in Concentric Energy Corp., a private company incorporated in the State of Nevada. On March 30, 2012, we acquired a 100% interest in Cue Resources Ltd. (“Cue”), a formerly publicly-traded company incorporated in the Province of British Columbia, Canada. On March 4, 2016, we acquired a 100% interest in JDL Resources Inc., a private company incorporated in Cayman Islands. On July 7, 2017, we acquired a 100% interest in CIC Resources (Paraguay) Inc., a private company incorporated in Cayman Islands. On August 9, 2017, we acquired a 100% interest in AUC Holdings (US), Inc. On January 31, 2018, we incorporated a wholly-owned subsidiary under the laws of the Province of Saskatchewan, Canada, UEC Resources (SK) Corp.
Our principal offices are located at 500 North Shoreline Boulevard, Suite 800N, Corpus Christi, Texas, 78401, and at 1030 West Georgia Street, Suite 1830, Vancouver, British Columbia, Canada, V6E 2Y3.
General Business
We are pre-dominantly engaged in uranium mining and related activities, including exploration, pre-extraction, extraction and processing, on uranium projects located in the United States and Paraguay. We utilize in-situ recovery (“ISR”) mining where possible which we believe, when compared to conventional open pit or underground mining, requires lower capital and operating expenditures with a shorter lead time to extraction and a reduced impact on the environment. We do not expect, however, to utilize ISR mining for all of our mineral rights in which case we would expect to rely on conventional open pit and/or underground mining techniques. We have one uranium mine located in the State of Texas, the Palangana Mine, which utilizes ISR mining and commenced extraction of uranium oxide (“U3O8”), or yellowcake, in November 2010. We have one uranium processing facility located in the State of Texas, the Hobson Processing Facility, which processes material from the Palangana Mine into drums of U3O8, our only sales product and source of revenue, for shipping to a third-party storage and sales facility. Since commencement of uranium extraction from the Palangana Mine in November 2010 to July 31, 2020, the Hobson Processing Facility has processed 580,100 pounds of U3O8. At July 31, 2020, we had no uranium supply or “off-take” agreements in place.
Our fully-licensed and 100%-owned Hobson Processing Facility forms the basis for our regional operating strategy in the State of Texas, specifically in the South Texas Uranium Belt, where we utilize ISR mining. We utilize a “hub-and-spoke” strategy whereby the Hobson Processing Facility acts as the central processing site (the “hub”) for our Palangana Mine and future satellite uranium mining activities, such as our Burke Hollow and Goliad Projects, located within the South Texas Uranium Belt (the “spokes”). The Hobson Processing Facility has a physical capacity to process uranium-loaded resins up to a total of two million pounds of U3O8 annually and is licensed to process up to one million pounds of U3O8 annually.
As at July 31, 2020, we hold certain mineral rights in various stages in the States of Arizona, Colorado, New Mexico, Texas and Wyoming, in Canada and in the Republic of Paraguay, many of which are located in historically successful mining areas and have been the subject of past exploration and pre-extraction activities by other mining companies. We do not expect, however, to utilize ISR mining for all of our mineral rights in which case we would expect to rely on conventional open pit and/or underground mining techniques.
Our operating and strategic framework is based on expanding our uranium extraction activities, which includes advancing certain uranium projects with established mineralized materials towards uranium extraction, and establishing additional mineralized materials on our existing uranium projects or through acquisition of additional uranium projects.
During the year ended July 31, 2020 (“Fiscal 2020”), we continued to operate the Palangana Mine at a reduced pace since implementing our strategic plan in September 2013, to align our operations to a weak uranium market in a challenging post-Fukushima environment. This strategy has included the deferral of major pre-extraction expenditures and remaining in a state of operational readiness in anticipation of a recovery in uranium prices.
During Fiscal 2020, we made significant advancements in various aspects of our operations, including:
|
● |
completing a drilling campaign to prepare for the development of the first production area where we drilled 57 exploration/delineation holes and completed 76 monitor wells totaling 54,724 feet at our Burke Hollow Project. We enlarged our first production area with the discovery of additional mineralization in new and existing trends; |
|
● |
completing a drilling campaign to prepare for a Preliminary Economic Assessment (“PEA”) where we drilled 49 holes at our Alto Parana Project; |
|
● |
maintaining our strategic focus of acquiring and developing U.S. ISR projects that are environmentally friendly and are a lower cost alternative to conventional mining and controlling the largest U.S. resource base of fully permitted ISR projects in Texas and Wyoming. We are ideally positioned to supply potential U.S. government purchases for a national uranium reserve as well as longer-term utility demand; |
|
● |
maintaining a perfect safety record with no lost-time accidents and no reportable medical aids during the year. In response to the COVID-19 pandemic, we arranged for our teams at our Vancouver, Corpus Christi and Paraguay offices to work remotely. Maintenance protocols at our Hobson Processing Facility and at our Palangana Mine remained unchanged. Our Hobson Processing Facility and Palangana Mine remain on standby for future extraction. We postponed plans to resume drilling at our Burke Hollow Project; and |
|
● |
the Company’s shares remain listed on the Russell 3000 and related growth and value indexes. |
Uranium Industry Background
The need for reliable, non-intermittent, pollution free electricity continues to rise as the world’s population grows to new record levels. The world’s population of 7.8 billion in 2020 is projected to increase over 1% per year to near 8.5 billion by 2030. The related need for more electricity and efforts to reach associated global climate change goals are important drivers for the projected long-term increase in nuclear power’s carbon-free electricity and uranium demand. The world’s current operating fleet of nuclear power plants, in addition to the global growth in new reactors under construction and those planned, is testimony to the confidence in nuclear power to provide safe, economical and carbon free electricity as part of an overall energy supply mix.
The International Energy Agency (“IEA”) reported “global electricity demand grew 0.9 percent in 2019”. The World Nuclear Association (“WNA”) reported “Nuclear generation reached a near-record high in 2019, with output reaching 2657 TWh, enough to meet more than 10% of the world’s electricity demand”. Also in 2019, while nine reactors were retired around the globe, six new reactors were connected to the grid and construction began on five new units. In total, the IEA noted nuclear power grew 3.5% last year, eclipsing the growth seen in 2018. As of September 2020, WNA data showed a total of 442 nuclear reactors operable, 53 new reactors under construction, 106 reactors planned or on order and another 329 proposed.
In the 2020 Nuclear Technology Review, the IEA reported; “Thirty countries currently use nuclear power and 28 are considering, planning or actively working to include it in their energy mix”. Most of the growth is coming from countries like China and Russia, although there is also notable growth in other countries, including India and the United Arab Emirates, as well as new prospective entries like Saudi Arabia. Some of these countries have embarked on sovereign-backed uranium acquisition programs, building inventory stockpiles for their future requirements. This also includes substantial long-term contracting with western suppliers and taking controlling interests in individual mines. In addition, Russia, China and South Korea are aggressively pursuing programs to sell their reactors around the globe. In many cases the sales agreements contain turnkey provisions, including uranium supply as a component of the reactor package that will require far more uranium than they currently produce. As such, they will need to carve out large supply sources in the coming years.
While global generation from nuclear power has eclipsed pre-Fukushima levels, Japan restarts have been slower than expected. To date, a total of 27 reactors have applied for restart and include the nine reactors that have restarted. More restarts are expected as Japan completes additional safety programs and ramps back up towards a policy goal of 20-22 percent of their total electrical generation from nuclear power by 2030.
The WNA’s most recent Fuel Report noted “Rapid growth in uranium demand will lead to a need for additional mined uranium in the period to 2040 in all scenarios”. The reference scenario in the report “shows a 26% increase in uranium demand over 2020-30”. World base case uranium demand is forecasted to be about 182 million pounds U3O8 in 2020, exceeding the 122 million pounds of projected production by about 60 million pounds (source: UxC 2020 Q3 UMO). About 19 million pounds of that gap is attributable to the shutdowns of several uranium mines in response to the COVID-19 virus. While some producers have announced plans to restart, the COVID shutdowns have nonetheless accelerated inventory drawdowns and the lost production will not be made up. Producers that shut down production in response to the virus have been purchasing uranium quantities for delivery commitments and have placed additional upside pressure on uranium prices. In 2021, the gap between production and utility requirements is expected to be about 44 million pounds. The gap includes the 18 million pounds per year impact from the indefinite shutdown of the worlds’ largest uranium mine in Canada as well as other producer shutdowns and production cuts.
While the difference between primary production and reactor demand is currently being filled with secondary market supplies, this is not a sustainable long-term supply source. Recent forecasts expect secondary sources to drop more than 40%, from 64 million pounds U3O8 in 2020 to about 36 million pounds by 2024. While there are different estimates on timing, it is clear that secondary supply (that includes inventory drawdown) will be insufficient to fill a projected supply-demand gap, and new production will be required. As this transition evolves, the market will become more production cost driven as opposed to inventory driven.
The United States has the world’s largest nuclear fleet and produces about 30% of the globe’s nuclear generation. The U.S. led global nuclear generation with approximately 809,400 GWh in 2019, a new record high and at an average capacity factor of 93.4 percent - the highest capacity factor on record (TradeTech June 2020 Nuclear Review). In 2019 electricity production from the fleet accounted for about 20% of the country’s total electrical generation and about 55% of the nation’s clean air energy. As of September 2020, the operating U.S. reactor fleet stands at 95 reactors, with two new commercial reactors under construction (Vogtle 3 and 4 in Georgia). While some U.S. reactors have been shut down prematurely, the overall generating capacity remains strong as a result of plant reactor upgrade programs and license extensions. In terms of uranium demand, the U.S. nuclear fleet is the world’s largest uranium consumer and has averaged about 47 million pounds of uranium a year over the past decade.
The U.S. uranium mining industry was formerly the world’s largest producer but is now producing virtually none of U.S. reactor requirements. The United States has become almost entirely dependent on foreign supply, with more than 40% of requirements being imported from State Owned Organizations (“SOE”) in Russia and other former Soviet Union countries. However, actions taken by the U.S. federal government over the past couple of years have culminated in a foundation for the industry to recover. Most notably, the President established the U.S. Nuclear Fuel Working Group (“NFWG”) comprised of various government agencies “to develop recommendations for reviving and expanding domestic nuclear fuel production”.
This year, the NFWG recommendations were released in a report entitled “Restoring America’s Competitive Nuclear Energy Advantage”. The report broadly advocates for increased American leadership in nuclear energy, both at home and abroad, with a focus on U.S. national security objectives that includes lessening dependence on SOE supply. Uranium mining is the starting point in the strategy with a program to purchase 17 to 19 million pounds of U.S. uranium for a strategic Uranium Reserve (“UR”). The administration’s budget outlined a $150 million expenditure for fiscal 2021 as part of a 10-year $1.5 billion UR program. The Department of Energy is currently developing this program and various Congressional avenues are being pursued for appropriations, including recently introduced bipartisan legislation entitled the “American Nuclear Infrastructure Act of 2020”. A companion bill has also been introduced in the House to establish the UR; the “Nuclear Prosperity and Security Act”.
Also consistent with the U.S. Administration’s NFWG report recommendations, in early October of 2020, the United States Department of Commerce (“DOC”) finalized an agreement with the Russian State Atomic Energy Corp., (“Rosatom”), extending the previously renegotiated Russian Suspension Agreement (“RSA”) through 2040. The previous RSA limited Russian low enriched uranium imports to 20% of U.S. requirements and was set to expire at the end of 2020. However, the DOC asserted in a preliminary determination that the conditions of Russian dumping would likely continue in absence of restrictions. This determination, and pressure from the U.S. Congress and the U.S. Administration, provided impetus for a negotiated settlement. The amended RSA considers the components of nuclear fuel in low enriched uranium with various limits depending on the specific component. The amount of enrichment services varies but are set to average about 17% of U.S. requirements through 2040 and are capped at 15% after 2027. The DOC noted that the natural uranium and conversion components “will be equivalent to approximately 7% of U.S. enrichment demand, and no higher than 5% starting in 2026”. This amounts to a reduction in Russian natural uranium imports of up to 75% from prior limits. For context, with U.S. consumption at about 47 million pounds U3O8 annually, the extended RSA reduces the annual natural uranium component limit from about 9.4 million pounds of Russian U3O8 to about 2.4 million pounds.
The global uranium market has suffered a long downturn after peaking in 2007 at $138 per pound U3O8 that was followed by a rebound and then a subsequent drop of about 75% from early 2011 into the 2016 low at $17.75 per pound. However, the spot market is up over 75% as at September 2020 since the 2016 low. Global fundamentals are in process of rebalancing the uranium market and driving an improvement in the price of uranium. As outlined above, increased levels of production cuts from major producers, plus significant purchasing by producers to fill long-term supply contracts as well as fund buying, are all contributing to the upward movement in uranium prices.
Ultimately, the forces of supply and demand will dictate the uranium market’s future direction. While the global market has clearly improved since the 2016 low, we still expect several major drivers to further bolster prices. Higher priced contracts that have supported high production costs are continuing to roll out of producer and utility supply portfolios. These higher priced contracts are not replaceable with current market prices below production costs for the vast majority of western producers. This will likely continue the trend of production cuts and deferrals until prices rise sufficiently to sustain long-term mining operations. In addition, some projects are in their final stages of production as their resources become depleted. Over the next year, two projects that currently represent about 6.5 million pounds of annual production will be permanently shut down. SOE supply is also likely to be reduced in the U.S. market with government’s intent to close the national security risk that overdependence presents. On the demand side of the equation, further upside market pressure also appears likely to evolve as utilities return to a longer-term contracting cycle to replace expiring contracts. For the U.S. producer, contracts to supply the UR will be at levels that are more reflective of production costs to sustain operations and should provide a needed boost to their balance sheets.
As these and other market forces unfold, the inventory and SOE supply should become less important drivers, paving the way for a more production cost driven market. Lead times for new production typically range from seven to 10 years or longer. The market appears to be within the time frames required for investment to bring new supply online to meet those lead times. However, prices are not yet at levels that incentivize future production, increasing the probability of the potential for less supply than the market is currently pricing in. All things considered, we believe the supply and demand fundamentals should continue to exert upward pressure on uranium prices.
Titanium (TiO2) Industry Updates
During Fiscal 2020, the market fundamentals for titanium dioxide remained positive. There is no economical substitute or environmentally safe alternative to titanium dioxide. Titanium dioxide is used in many "quality of life" products for which demand historically has been linked to global gross domestic product (“GDP), ongoing urbanization trends and discretionary spending. 90% of all the mined titanium feedstocks are used to manufacture pure titanium dioxides – a pigment that enhances brightness and opacity in paints, inks, paper, plastics, food products and cosmetics. The remaining 10% of supply is used in the production of titanium metal and steel fabrication.
Demand for titanium feedstocks, such as ilmenite, is closely tied to titanium dioxide pigment demand. The global titanium pigment demand fundamentals are underpinned by urbanization and rising living standards and as such the long-term demand fundamentals remain robust. Through the first half of 2020, most producers reported ilmenite price increases, although it is expected to become subdued during the second half of 2020 due to COVID-19 pandemic downstream demand impact.
The supply side of titanium feedstock remains under pressure due to recent mine closures and grade decline from existing operations as they reach maturity and, as a result, we believe that a supply deficit is inevitable in the absence of new supply. Furthermore, and apart from the supply constraints, the nature of feedstock supply is also changing. China, the world's largest feedstock market, is increasingly more reliant on higher quality feedstocks. Chinese domestic ilmenite is mainly unsuitable for processing under the stricter environmental regulations and, as such, the long-term global shift towards chloride pigment production will continue to drive overall high-quality feedstock demand and price.
In our view, what appear to be longer-term supply and demand fundamentals and, more specifically, the long-term global shift towards higher grade feedstocks, may have potential to keep upward pressure on high-quality feedstock prices.
In-Situ Recovery (ISR) Mining
We utilize or plan on utilizing in-situ recovery or ISR uranium mining for our South Texas projects, including our Palangana Mine, as well as our Reno Creek Project in Wyoming, and will continue to utilize ISR mining whenever such alternative is available to conventional mining. When compared to conventional mining, ISR mining requires lower capital expenditures and has a reduced impact on the environment, as well as a shorter lead time to uranium recovery.
ISR mining involves circulating oxidized water through an underground uranium deposit, dissolving the uranium and then pumping the uranium-rich solution to the surface for processing. Oxidizing solution enters the formation through a series of injection wells and is drawn to a series of communicating extraction wells. To create a localized hydrologic cone of depression in each wellfield, more groundwater will be produced than injected. Under this gradient, the natural groundwater movement from the surrounding area is toward the wellfield, providing control of the injection fluid. Over-extraction is adjusted as necessary to maintain a cone of depression which ensures that the injection fluid does not move outside the permitted area.
The uranium-rich solution is pumped from an ore zone to the surface and circulated through a series of ion exchange columns located at the mine site. The solution flows through resin beds inside an ion exchange column where the uranium bonds to small resin beads. As the solution exits the ion exchange column, it is mostly void of uranium and is re-circulated back to the wellfield and through the ore zone. Once the resin beads are fully-loaded with uranium, they are transported by truck to the Hobson Processing Facility and transferred to a tank for flushing with a brine solution, or elution, which strips the uranium from the resin beads. The stripped resin beads are then transported back to the mine and reused in the ion exchange columns. The uranium solution, now free from the resin, is precipitated out and concentrated into a slurry mixture and fed to a filter press to remove unwanted solids and contaminants. The slurry is then dried in a zero-emissions rotary vacuum dryer, packed in metal drums and shipped out as uranium concentrates, or yellowcake, to ConverDyn for storage and sales.
Each project is divided into a mining unit, known as a Production Area Authorization (“PAA”), which lies inside an approved Mine Permit Boundary. Each PAA will be developed, extracted and restored as one unit and will have its own set of monitor wells. It is common to have multiple PAAs in extraction at any one time with additional units in various states of exploration, pre-extraction and/or restoration.
After mining is complete in a PAA, aquifer restoration will begin as soon as practicable and will continue until the groundwater is restored to pre-mining conditions. Once restoration is complete, a stability period of no less than one year is scheduled with quarterly baseline and monitor well sampling. Wellfield reclamation will follow after aquifer restoration is complete and the stability period has passed.
Hobson Processing Facility
Our Hobson Processing Facility is located in Karnes County, Texas, about 100 miles northwest of Corpus Christi. It was originally licensed and constructed in 1978, serving as the hub for several satellite mining projects until 1996, and completely refurbished in 2008. On December 18, 2009, we acquired the Hobson Processing Facility as part of our acquisition of STMV.
With a physical capacity to process uranium-loaded resins up to a total of two million pounds of U3O8 annually, and licensed to process up to one million pounds of U3O8 annually, our fully-licensed and 100%-owned Hobson Processing Facility forms the basis for our “hub-and-spoke” strategy in the State of Texas, specifically in the South Texas Uranium Belt, where we utilize ISR mining.
Palangana Mine
We hold various mining lease and surface use agreements generally having an initial five-year term with extension provisions, granting us the exclusive right to explore, develop and mine for uranium at our Palangana Mine, a 6,987-acre property located in Duval County, Texas, approximately 100 miles south of the Hobson Processing Facility. These agreements are subject to certain royalty and overriding royalty interests indexed to the sales price of uranium.
On December 18, 2009, we acquired the Palangana Mine as part of our acquisition of STMV. In November 2010, the Palangana Mine commenced uranium extraction utilizing ISR mining and in January 2011 the Hobson Processing Facility began processing resins received from the Palangana Mine.
Material Relationships Including Long-Term Delivery Contracts
At July 31, 2020, we had no uranium supply or “off-take” agreements in place.
Given that there are up to approximately 60 different companies as potential buyers in the uranium market, we are not substantially dependent upon any single customer to purchase uranium extracted by us.
Seasonality
The timing of our uranium concentrate sales is dependent upon factors such as extraction results from our mining activities, cash requirements, contractual requirements and perception of the uranium market. As a result, our sales are neither tied to nor dependent upon any particular season. In addition, our ability to extract and process uranium does not change on a seasonal basis. Over the past ten years uranium prices have tended to decline during the calendar third quarter before rebounding during the fourth quarter, but there does not appear to be a strong correlation.
Mineral Rights
In Texas our mineral rights are held exclusively through private leases from the owners of the land/mineral/surface rights with varying terms. In general, these leases provide for uranium and certain other specified mineral rights only including surface access rights for an initial term of five years and renewal for a second five-year term. We have amended the majority of the leases to extend the time period for an additional five years past the original five-year renewal periods. Our Burke Hollow and some of our Goliad leases have a fixed royalty amount based on net proceeds from sales of uranium, and our other projects have production royalties calculated on a sliding-scale basis tied to the gross sales price of uranium. Remediation of a property is required in accordance with regulatory standards, which may include the posting of reclamation bonds.
In Arizona, Colorado, New Mexico and Wyoming our mineral rights are held either exclusively or through a combination of federal mining claims and state and private mineral leases. Remediation of a property is required in accordance with regulatory standards, which may include the posting of reclamation bonds. Our federal mining claims consist of both unpatented lode and placer mining claims registered with the U.S. Bureau of Land Management (“BLM”) and the appropriate counties. These claims provide for all mineral rights including surface access rights for an indefinite period. Annual maintenance requirements include BLM claim fees of $165 per claim due yearly on September 1. Our state mineral leases are registered with their respective states. These leases provide for all mineral rights, including surface access rights, subject to a production royalty of 4% in Wyoming and 5% to 6% in Arizona, ranging from a five-year term in Arizona to a ten-year term in Wyoming. Annual maintenance requirements include lease fees of $1 and $3 per acre and minimum exploration expenditure requirements of $10 and $20 per acre in Arizona. Our private mineral leases are negotiated directly with the owners of the land/mineral/surface rights with varying terms. These leases provide for uranium and certain other specified mineral rights only, including surface access rights, subject to production royalties, ranging from an initial term of five to seven years and renewal for a second five-year to seven-year term, and some of which have an initial term of 20 years.
Under the mining laws of Saskatchewan, Canada, title to mineral rights for our Diabase Project is held through The Crown Minerals Act of the Province of Saskatchewan. In addition, The Mineral Resources Act, 1985 and The Mineral Tenure Registry Regulations affect the rights and administration of mineral tenure in Saskatchewan. Our Diabase Project lands are currently claimed as “Crown dispositions” or “mineral dispositions”. Subject to section 19 of The Crown Minerals Act, a claim grants to the holder the exclusive right to explore for any Crown minerals that are subject to these regulations within the claim lands. Claims are renewed annually and the claim holder is required to satisfy work expenditure requirements. Expenditure requirements are $nil for the first year, $15 per hectare for the second year to the tenth year of assessment work periods and $25 per hectare for the eleventh year and subsequent assessment work periods. For registering exploration expenditures, mineral dispositions may be grouped at the time of submission if the total mineral disposition area is not greater than 18,000 hectares. The holder may also submit a cash payment or cash deposit in lieu of a work assessment submission for not more than three consecutive work periods. A claim may be converted to a mineral lease upon application and payment of a registration fee.
Under the mining laws of the Republic of Paraguay, title to mineral rights for our Yuty Project is held through a “Mineral Concession Contract” approved by the National Congress and signed between the Government of the Republic of Paraguay and the Company, and titles to mineral rights for our Oviedo Project and our Alto Paraná Titanium Project are held through “Exploration Mining Permits” granted by the Ministry of Public Works and Communications (“MOPC”), the mining regulator in Paraguay. These mineral rights provide for the exploration of metallic and non-metallic minerals and precious and semi-precious gems within the territory of Paraguay for up to a six-year period, and for the exploitation of minerals for a minimum period of 20 years from the beginning of the production phase, extendable for an additional ten years.
|
● |
Burke Hollow Project, Texas |
We hold various mining lease and surface use agreements having an initial five-year term with extension provisions, granting us the exclusive right to explore, develop and mine for uranium at our Burke Hollow Project, a 19,335-acre property located in Bee County, Texas, subject to a fixed royalty amount based on the net proceeds from sales of uranium.
|
● |
Goliad Project, Texas |
We hold various mining lease and surface use agreements having an initial five-year term with extension provisions, granting us the exclusive right to explore, develop and mine for uranium at the Goliad Project, a 995-acre property located in Goliad County, Texas, subject to certain fixed royalty interests or indexed to the sale price of uranium.
|
● |
Longhorn Project, Texas |
We hold various mining lease and surface use agreements having an initial five-year term with extension provisions, granting us the exclusive right to explore, develop and mine for uranium at the Longhorn Project, a 651-acre property located in Live Oak County, Texas, subject to certain royalty interests indexed to the sale price of uranium.
|
● |
Reno Creek Project, Wyoming |
We hold 18,763 gross mineral acres consisting of federal lode claims, private leases and state of Wyoming leases located in Campbell County, Wyoming.
|
● |
Salvo Project, Texas |
We hold various mining lease and surface use agreements having an initial five-year term with extension provisions, granting us the exclusive right to explore, develop and mine for uranium at our Salvo Project, a 1,340-acre property located in Bee County, Texas, subject to certain royalty interests indexed to the sale price of uranium.
|
● |
Anderson Project, Arizona |
We hold an undivided 100% interest in contiguous mineral lode claims and state leases in our Anderson Project, an 8,268-acre property located in Yavapai County, Arizona.
|
● |
Workman Creek Project, Arizona |
We hold an undivided 100% interest in contiguous mineral lode claims in our Workman Creek Project, a 4,036-acre property located in Gila County, Arizona, subject to a 3.0% net smelter royalty requiring an annual advance royalty payment of $100,000 for 2018 and thereafter.
|
● |
Los Cuatros Project, Arizona |
We hold an undivided 100% interest in a state lease in our Los Cuatros Project, a 640-acre property located in Maricopa County, Arizona.
|
● |
Slick Rock Project, Colorado |
We hold an undivided 100% interest in contiguous mineral lode claims in our Slick Rock Project, a 5,333-acre property located in San Miguel County, Colorado. Certain claims of the Slick Rock Project are subject to a 1.0% or 3.0% net smelter royalty, the latter requiring an annual advance royalty payment of $30,000 which began in November 2017.
|
● |
Diabase Project, Canada |
We hold an undivided 100% interest in 10 mineral claims in our Diabase Project, a 54,236-acre property located in the Athabasca region of Saskatchewan, Canada.
|
● |
Yuty Project, Paraguay |
Our Yuty Project is a 289,680-acre property held under one exploitation concession located in Paraguay, which is subject to an overriding royalty payable of $0.21 per pound of uranium produced from the property.
|
● |
Oviedo Project, Paraguay |
Our Oviedo Project is a 223,749-acre property under one exploration mining permit located in Paraguay. The Oviedo Project is subject to a 1.5% gross overriding royalty over which we have an exclusive right and option at any time to acquire 0.5% for $166,667 and a right of first refusal to acquire all or any portion of the remaining 1.0%.
|
● |
Alto Paraná Titanium Project, Paraguay |
Our Alto Paraná Titanium Project is a 174,200-acre property held under five exploration mining permits located in Paraguay. The Alto Paraná Titanium Project is subject to 1.5% net smelter returns royalty. We have the right, exercisable at any time for a period of six years following the acquisition of the project, to acquire 0.5% of the royalty at a purchase price of $500,000.
Environmental Regulation
Our activities will be subject to existing federal, state and local laws and regulations governing environmental quality and pollution control. Our operations will be subject to stringent environmental regulation by state and federal authorities including the Railroad Commission of Texas (“RCT”), the Texas Commission on Environmental Quality (“TCEQ”) and the United States Environmental Protection Agency (“EPA”).
In Texas surface extraction and exploration for uranium is regulated by the RCT, while ISR uranium extraction is regulated by the TCEQ. An exploration permit is the initial permit granted by the RCT that authorizes exploration drilling activities inside an approved area. This permit authorizes specific drilling and plugging activities requiring documentation for each borehole drilled. All documentation is submitted to the RCT on a monthly basis and each borehole drilled under the exploration permit is inspected by an RCT inspector to ensure compliance. At July 31, 2019, we held one exploration permit in each of Bee, Duval and Goliad Counties.
Before ISR uranium extraction can begin in Texas, a number of permits must be granted by the TCEQ.
A Mine Area Permit (“MAP”) application is required for submission to the TCEQ to establish a specific permit area boundary, aquifer exemption boundary and the mineral zones of interests or production zones. The application also includes a financial surety plan to ensure funding for all plugging and abandonment requirements. Funding for surety is in the form of cash or bonds, including an excess of 15% for contingencies and 10% for overhead, adjusted annually for inflation. At July 31, 2020, we held MAPs for our Palangana Mine, Goliad Project and Burke Hollow Project.
A Radioactive Material License (“RML”) application is also required for submission to the TCEQ for authorization to operate a uranium recovery facility. The application includes baseline environmental data for soil, vegetation, surface water and groundwater along with operational sampling frequencies and locations. A Radiation Safety Manual is a key component of the application which defines the environmental health and safety programs and procedures to protect employees and the environment. Another important component of the application is a financial surety mechanism to ensure plant and wellfield decommissioning is properly funded and maintained. Surety funding is in the form of cash or bonds and includes an excess of 15% for contingencies and 10% for overhead, adjusted annually for inflation. At July 31, 2020, we held RMLs for our Palangana Mine, Burke Hollow Project, Goliad Project and Hobson Processing Facility.
PAA applications are also required for submission to the TCEQ to establish specific extraction areas inside the MAP boundary. These are typically 30 to 100-acre units that have been delineated and contain producible quantities of uranium. The PAA application includes baseline water quality data that is characteristic of that individual unit, proposes upper control limits for monitor well analysis and establishes restoration values. The application will also include a financial security plan for wellfield restoration and reclamation which must be funded and in place prior to commencing uranium extraction. At July 31, 2020, we held four PAA permits for our Palangana Mine and one for our Goliad Project.
A Class I disposal well permit application is also required for submission to the TCEQ for authorization for deep underground wastewater injection. It is the primary method for disposing of excess fluid from the extraction areas and for reverse osmosis concentrate during the restoration phase. This permit authorizes injection into a specific injection zone within a designated injection interval. The permit requires continuous monitoring of numerous parameters including injection flow rate, injection pressure, annulus pressure and injection/annulus differential pressure. Mechanical integrity testing is required initially and annually to ensure the well is mechanically sound. Surety funding for plugging and abandonment of each well is in the form of cash or bonds, including 15% for contingencies and 10% for overhead, adjusted annually for inflation. At July 31, 2020, we held two Class I disposal well permits for each of our Hobson Processing Facility, our Palangana Satellite Facility, our Burke Hollow Project and our Goliad Project.
The federal Safe Drinking Water Act (“SDWA”) creates a regulatory program to protect groundwater and is administered by the EPA. The SDWA allows states to issue underground injection control (“UIC”) permits under two conditions: the state’s program must have been granted primacy; and the EPA must have granted an aquifer exemption upon the state’s request. Texas, being a primacy state, is therefore authorized to grant UIC permits and makes the official requests for an aquifer exemption to the EPA. The aquifer exemption request is submitted by the Company to the TCEQ and, once approved, is then submitted by the TCEQ to the EPA for concurrence and final issuance. At July 31, 2020, we held an aquifer exemption for our Palangana Mine, our Goliad Project and our Burke Hollow Project.
Waste Disposal
The Resource Conservation and Recovery Act (“RCRA”) and comparable state statutes affect minerals exploration and production activities by imposing regulations on the generation, transportation, treatment, storage, disposal and cleanup of “hazardous wastes” and on the disposal of non-hazardous wastes. Under the auspices of the EPA, the individual states administer some or all of the provisions of RCRA, sometimes in conjunction with their own, more stringent requirements.
Comprehensive Environmental Response, Compensation and Liability Act
The federal Comprehensive Environmental Response, Compensation and Liability Act (“CERCLA”) imposes joint and several liability for costs of investigation and remediation and for natural resource damages, without regard to fault or the legality of the original conduct, on certain classes of persons with respect to the release into the environment of substances designated under CERCLA as hazardous substances (collectively, “Hazardous Substances”). These classes of persons or potentially responsible parties include the current and certain past owners and operators of a facility or property where there is or has been a release or threat of release of a Hazardous Substance and persons who disposed of or arranged for the disposal of the Hazardous Substances found at such a facility. CERCLA also authorizes the EPA and, in some cases, third parties, to take actions in response to threats to the public health or the environment and to seek to recover the costs of such action. We may also in the future become an owner of facilities on which Hazardous Substances have been released by previous owners or operators. We may in the future be responsible under CERCLA for all or part of the costs to clean up facilities or property at which such substances have been released and for natural resource damages.
Air Emissions
Our operations are subject to local, state and federal regulations for the control of emissions of air pollution. Major sources of air pollutants are subject to more stringent, federally imposed permitting requirements. Administrative enforcement actions for failure to comply strictly with air pollution regulations or permits are generally resolved by payment of monetary fines and correction of any identified deficiencies. Alternatively, regulatory agencies could require us to forego construction, modification or operation of certain air emission sources. In Texas the TCEQ issues an exemption for those processes that meet the criteria for low to zero emission by issuing a Permit by Rule. Presently our Palangana Mine, our Hobson Processing Facility and our Goliad Project all have Permits by Rule covering air emissions.
Clean Water Act
The Clean Water Act (“CWA”) imposes restrictions and strict controls regarding the discharge of wastes, including mineral processing wastes, into waters of the United States, a term broadly defined. Permits must be obtained to discharge pollutants into federal waters. The CWA provides for civil, criminal and administrative penalties for unauthorized discharges of hazardous substances and other pollutants. It imposes substantial potential liability for the costs of removal or remediation associated with discharges of oil or hazardous substances. State laws governing discharges to water also provide varying civil, criminal and administrative penalties and impose liabilities in the case of a discharge of petroleum or its derivatives, or other hazardous substances, into state waters. In addition, the EPA has promulgated regulations that may require us to obtain permits to discharge storm water runoff. In the event of an unauthorized discharge of wastes, we may be liable for penalties and costs. Management believes that we are in substantial compliance with current applicable environmental laws and regulations.
Competition
The uranium industry is highly competitive, and our competition includes larger, more established companies with longer operating histories that not only explore for and produce uranium but also market uranium and other products on a regional, national or worldwide basis. Due to their greater financial and technical resources, we may not be able to acquire additional uranium projects in a competitive bidding process involving such companies. Additionally, these larger companies have greater resources to continue with their operations during periods of depressed market conditions.
The global titanium market is highly competitive, with the top six producers accounting for approximately 60% of the world’s production capacity according to TZ Minerals International Pty. Ltd. Competition is based on a number of factors, such as price, product quality and service. Among our competitors are companies that are vertically-integrated (those that have their own raw material resources).
Research and Development Activities
No research and development expenditures have been incurred, either on our account or sponsored by customers, for our three most recently completed fiscal years.
Employees
Amir Adnani is our President and Chief Executive Officer and, effective October 29, 2015, Pat Obara was appointed our Chief Financial Officer. These individuals are primarily responsible for all our day-to-day operations. Effective September 8, 2014, Scott Melbye was appointed our Executive Vice President. Other services are provided by outsourcing and consulting and special purpose contracts. As of July 31, 2020, we had 45 persons employed on a full-time basis and three individuals providing services on a contractual basis.
Available Information
The Company’s website address is www.uraniumenergy.com and our annual reports on Form 10-K and quarterly reports on Form 10-Q, and amendments to such reports, are available free of charge on our website as soon as reasonably practicable after such materials are filed or furnished electronically with the SEC. These same reports, as well as our current reports on Form 8-K, and amendments to those reports, filed or furnished electronically with the SEC are available for review at the SEC’s website at www.sec.gov. Printed copies of the foregoing materials are available free of charge upon written request by email at info@uraniumenergy.com. Additional information about the Company can be found on our website, however, such information is neither incorporated by reference nor included as part of this or any other report or information filed with or furnished to the SEC.
Item 1A. Risk Factors
In addition to the information contained in this Form 10-K Annual Report, we have identified the following material risks and uncertainties which reflect our outlook and conditions known to us as of the date of this Annual Report. These material risks and uncertainties should be carefully reviewed by our stockholders and any potential investors in evaluating the Company, our business and the market value of our common stock. Furthermore, any one of these material risks and uncertainties has the potential to cause actual results, performance, achievements or events to be materially different from any future results, performance, achievements or events implied, suggested or expressed by any forward-looking statements made by us or by persons acting on our behalf. Refer to “Cautionary Note Regarding Forward-looking Statements”.
There is no assurance that we will be successful in preventing the material adverse effects that any one or more of the following material risks and uncertainties may cause on our business, prospects, financial condition and operating results, which may result in a significant decrease in the market price of our common stock. Furthermore, there is no assurance that these material risks and uncertainties represent a complete list of the material risks and uncertainties facing us. There may be additional risks and uncertainties of a material nature that, as of the date of this Annual Report, we are unaware of or that we consider immaterial that may become material in the future, any one or more of which may result in a material adverse effect on us. You could lose all or a significant portion of your investment due to any one of these material risks and uncertainties.
Risks Related to Our Company and Business
Evaluating our future performance may be difficult since we have a limited financial and operating history, with significant negative cash flow and an accumulated deficit to date. Our long-term success will depend ultimately on our ability to achieve and maintain profitability and to develop positive cash flow from our mining activities.
As more fully described under Item 1. Business herein, Uranium Energy Corp. was incorporated under the laws of the State of Nevada on May 16, 2003 and, since 2004, we have been engaged in uranium mining and related activities, including exploration, pre-extraction, extraction and processing, on projects located in the United States, Canada and Paraguay. In November 2010, we commenced uranium extraction for the first time at our Palangana Mine utilizing ISR methods and processed those materials at our Hobson Processing Facility into drums of U3O8, our only sales product and source of revenue. We also hold uranium projects in various stages of exploration and pre-extraction in the States of Arizona, Colorado, New Mexico, Texas and Wyoming, in Canada and the Republic of Paraguay. Since we completed the acquisition of our Alto Paraná Project located in the Republic of Paraguay in July 2017, we are also involved in mining and related activities, including exploration, pre-extraction, extraction and processing, of titanium minerals.
As more fully described under “Liquidity and Capital Resources” of Item 7. Management’s Discussion and Analysis of Financial Condition and Result of Operations herein, we have a history of significant negative cash flow and net losses, with an accumulated deficit balance of $276.8 million at July 31, 2020. Historically, we have been reliant primarily on equity financings from the sale of our common stock and on debt financing in order to fund our operations. Although we generated revenues from sales of U3O8 during Fiscal 2015, Fiscal 2013 and Fiscal 2012 of $3.1 million, $9.0 million and $13.8 million, respectively, with no revenues from sales of U3O8 generated during any other fiscal years, we have yet to achieve profitability or develop positive cash flow from our operations, and we do not expect to achieve profitability or develop positive cash flow from operations in the near term. As a result of our limited financial and operating history, including our significant negative cash flow and net losses to date, it may be difficult to evaluate our future performance.
At July 31, 2020, we had working capital of $4.6 million including cash and cash equivalents of $5.1 million. Subsequent to July 31, 2020, we completed a public offering (the “September 2020 Offering”) of 12,500,000 units at a price of $1.20 per unit for gross proceeds of $15 million, which substantially increased our cash and cash equivalent and improved our working capital position. As a consequence, our existing cash resources and cash received from the September 2020 Offering are expected to provide sufficient funds to carry out our planned operations for 12 months from the date of this Annual Report. Our continuation as a going concern for a period beyond those 12 months will be dependent upon our ability to obtain adequate additional financing, as our operations are capital intensive and future capital expenditures are expected to be substantial. Our continued operations, including the recoverability of the carrying values of our assets, are dependent ultimately on our ability to achieve and maintain profitability and positive cash flow from our operations.
Our reliance on equity and debt financings is expected to continue for the foreseeable future, and their availability whenever such additional financing is required will be dependent on many factors beyond our control including, but not limited to, the market price of uranium, the continuing public support of nuclear power as a viable source of electrical generation, the volatility in the global financial markets affecting our stock price and the status of the worldwide economy, any one of which may cause significant challenges in our ability to access additional financing, including access to the equity and credit markets. We may also be required to seek other forms of financing, such as asset divestitures or joint venture arrangements, to continue advancing our uranium projects which would depend entirely on finding a suitable third party willing to enter into such an arrangement, typically involving an assignment of a percentage interest in the mineral project.
Our long-term success, including the recoverability of the carrying values of our assets and our ability to acquire additional uranium projects and continue with exploration and pre-extraction activities and mining activities on our existing uranium projects, will depend ultimately on our ability to achieve and maintain profitability and positive cash flow from our operations by establishing ore bodies that contain commercially recoverable uranium and to develop these into profitable mining activities. The economic viability of our mining activities, including the expected duration and profitability of our Palangana Mine and of any future satellite ISR mines, such as our Burke Hollow and Goliad Projects located within the South Texas Uranium Belt, our Reno Creek Project located in the Powder River Basin, Wyoming, and our projects in Canada and in the Republic of Paraguay, have many risks and uncertainties. These include, but are not limited to: (i) a significant, prolonged decrease in the market price of uranium and titanium minerals; (ii) difficulty in marketing and/or selling uranium concentrates; (iii) significantly higher than expected capital costs to construct the mine and/or processing plant; (iv) significantly higher than expected extraction costs; (v) significantly lower than expected mineral extraction; (vi) significant delays, reductions or stoppages of uranium extraction activities; and (vi) the introduction of significantly more stringent regulatory laws and regulations. Our mining activities may change as a result of any one or more of these risks and uncertainties and there is no assurance that any ore body that we extract mineralized materials from will result in achieving and maintaining profitability and developing positive cash flow.
Our operations are capital intensive, and we will require significant additional financing to acquire additional mineral projects and continue with our exploration and pre-extraction activities on our existing projects.
Our operations are capital intensive and future capital expenditures are expected to be substantial. We will require significant additional financing to fund our operations, including acquiring additional mineral projects and continuing with our exploration and pre-extraction activities which include assaying, drilling, geological and geochemical analysis and mine construction costs. In the absence of such additional financing we would not be able to fund our operations or continue with our exploration and pre-extraction activities, which may result in delays, curtailment or abandonment of any one or all of our projects.
If we are unable to service our indebtedness, we may be faced with accelerated repayments or lose the assets securing our indebtedness. Furthermore, restrictive covenants governing our indebtedness may restrict our ability to pursue our business strategies.
During Fiscal 2019, we entered into the Third Amended and Restated Credit Agreement (the “Third Amended and Restated Credit Agreement”) with our lenders (the “Lenders”) under which we had previously drawn down the maximum of $20 million in principal under our credit facility (the “Credit Facility”). The Credit Facility requires monthly interest payments calculated at 8% per annum and other periodic fees. Our ability to continue making these scheduled payments will be dependent on and may change as a result of our financial condition and operating results. Failure to make any of these scheduled payments will put us in default with the Credit Facility which, if not addressed or waived, could require accelerated repayment of our indebtedness and/or enforcement by the Lenders against our assets. Enforcement against our assets would have a material adverse effect on our financial condition and operating results. Furthermore, our Credit Facility includes restrictive covenants that, among other things, limit our ability to sell our assets or to incur additional indebtedness other than permitted indebtedness, which may restrict our ability to pursue certain business strategies from time to time. If we do not comply with these restrictive covenants, we could be in default which, if not addressed or waived, could require accelerated repayment of our indebtedness and/or enforcement by the Lenders against our assets.
Our uranium extraction and sales history is limited, with our uranium extraction to date originating from a single uranium mine. Our ability to continue generating revenue is subject to a number of factors, any one or more of which may adversely affect our financial condition and operating results.
We have a limited history of uranium extraction and generating revenue. In November 2010, we commenced uranium extraction at our Palangana Mine, which has been our sole source of generating revenues from the sales of U3O8 during Fiscal 2015, Fiscal 2013 and Fiscal 2012, with no revenues from sales of U3O8 generated during other fiscal years.
During Fiscal 2020, we continued to operate our Palangana Mine at a reduced pace since implementing our strategic plan in September 2013 to align our operations to a weak uranium commodity market in a challenging post-Fukushima environment. This strategy has included the deferral of major pre-extraction expenditures and remaining in a state of operational readiness in anticipation of a recovery in uranium prices. Our ability to continue generating revenue from the Palangana Mine is subject to a number of factors which include, but are not limited to: (i) a significant, prolonged decrease in the market price of uranium; (ii) difficulty in marketing and/or selling uranium concentrates; (iii) significantly higher than expected capital costs to construct the mine and/or processing plant; (iv) significantly higher than expected extraction costs; (v) significantly lower than expected uranium extraction; (vi) significant delays, reductions or stoppages of uranium extraction activities; and (vii) the introduction of significantly more stringent regulatory laws and regulations. Furthermore, continued mining activities at the Palangana Mine will eventually deplete the Palangana Mine or cause such activities to become uneconomical, and if we are unable to directly acquire or develop existing uranium projects, such as our Burke Hollow and Goliad Projects, into additional uranium mines from which we can commence uranium extraction, it will negatively impact our ability to generate revenues. Any one or more of these occurrences may adversely affect our financial condition and operating results.
Exploration and pre-extraction programs and mining activities are inherently subject to numerous significant risks and uncertainties, and actual results may differ significantly from expectations or anticipated amounts. Furthermore, exploration programs conducted on our projects may not result in the establishment of ore bodies that contain commercially recoverable uranium.
Exploration and pre-extraction programs and mining activities are inherently subject to numerous significant risks and uncertainties, with many beyond our control and including, but not limited to: (i) unanticipated ground and water conditions and adverse claims to water rights; (ii) unusual or unexpected geological formations; (iii) metallurgical and other processing problems; (iv) the occurrence of unusual weather or operating conditions and other force majeure events; (v) lower than expected ore grades; (vi) industrial accidents; (vii) delays in the receipt of or failure to receive necessary government permits; (viii) delays in transportation; (ix) availability of contractors and labor; (x) government permit restrictions and regulation restrictions; (xi) unavailability of materials and equipment; and (xii) the failure of equipment or processes to operate in accordance with specifications or expectations. These risks and uncertainties could result in: (i) delays, reductions or stoppages in our mining activities; (ii) increased capital and/or extraction costs; (iii) damage to, or destruction of, our mineral projects, extraction facilities or other properties; (iv) personal injuries; (v) environmental damage; (vi) monetary losses; and (vii) legal claims.
Success in mineral exploration is dependent on many factors, including, without limitation, the experience and capabilities of a company’s management, the availability of geological expertise and the availability of sufficient funds to conduct the exploration program. Even if an exploration program is successful and commercially recoverable material is established, it may take a number of years from the initial phases of drilling and identification of the mineralization until extraction is possible, during which time the economic feasibility of extraction may change such that the material ceases to be economically recoverable. Exploration is frequently non-productive due, for example, to poor exploration results or the inability to establish ore bodies that contain commercially recoverable material, in which case the project may be abandoned and written-off. Furthermore, we will not be able to benefit from our exploration efforts and recover the expenditures that we incur on our exploration programs if we do not establish ore bodies that contain commercially recoverable material and develop these projects into profitable mining activities, and there is no assurance that we will be successful in doing so for any of our projects.
Whether an ore body contains commercially recoverable material depends on many factors including, without limitation: (i) the particular attributes, including material changes to those attributes, of the ore body such as size, grade, recovery rates and proximity to infrastructure; (ii) the market price of uranium, which may be volatile; and (iii) government regulations and regulatory requirements including, without limitation, those relating to environmental protection, permitting and land use, taxes, land tenure and transportation.
We have not established proven or probable reserves through the completion of a “final” or “bankable” feasibility study for any of our projects, including the Palangana Mine. Furthermore, we have no plans to establish proven or probable reserves for any of our projects for which we plan on utilizing ISR mining, such as the Palangana Mine. Since we commenced extraction of mineralized materials from the Palangana Mine without having established proven or probable reserves, it may result in our mining activities at the Palangana Mine, and at any future projects for which proven or probable reserves are not established, being inherently riskier than other mining activities for which proven or probable reserves have been established.
We have established the existence of mineralized materials for certain projects, including the Palangana Mine. We have not established proven or probable reserves, as defined by the SEC under Industry Guide 7 (“Industry Guide 7”), through the completion of a “final” or “bankable” feasibility study for any of our projects, including the Palangana Mine. Furthermore, we have no plans to establish proven or probable reserves for any of our projects for which we plan on utilizing ISR mining, such as the Palangana Mine. Since we commenced uranium extraction at the Palangana Mine without having established proven or probable reserves, there may be greater inherent uncertainty as to whether or not any mineralized material can be economically extracted as originally planned and anticipated. Any mineralized materials established or extracted from the Palangana Mine should not in any way be associated with having established or produced from proven or probable reserves.
Since we are in the Exploration Stage, pre-production expenditures including those related to pre-extraction activities are expensed as incurred, the effects of which may result in our consolidated financial statements not being directly comparable to the financial statements of companies in the Production Stage.
Despite the fact that we commenced uranium extraction at the Palangana Mine in November 2010, we remain in the Exploration Stage as defined under Industry Guide 7, and will continue to remain in the Exploration Stage until such time proven or probable reserves have been established, which may never occur. We prepare our consolidated financial statements in accordance with United States generally accepted accounting principles (“U.S. GAAP”) under which acquisition costs of mineral rights are initially capitalized as incurred while pre-production expenditures are expensed as incurred until such time we exit the Exploration Stage. Expenditures relating to exploration activities are expensed as incurred and expenditures relating to pre-extraction activities are expensed as incurred until such time proven or probable reserves are established for that uranium project, after which subsequent expenditures relating to mine development activities for that particular project are capitalized as incurred.
We have neither established nor have any plans to establish proven or probable reserves for our uranium projects for which we plan on utilizing ISR mining, such as the Palangana Mine. Companies in the Production Stage, as defined by the SEC under Industry Guide 7, having established proven and probable reserves and exited the Exploration Stage, typically capitalize expenditures relating to ongoing development activities, with corresponding depletion calculated over proven and probable reserves using the units-of-production method and allocated to future reporting periods to inventory and, as that inventory is sold, to cost of goods sold. As we are in the Exploration Stage, it has resulted in us reporting larger losses than if we had been in the Production Stage due to the expensing, instead of capitalization, of expenditures relating to ongoing mill and mine pre-extraction activities. Additionally, there would be no corresponding amortization allocated to our future reporting periods since those costs would have been expensed previously, resulting in both lower inventory costs and cost of goods sold and results of operations with higher gross profits and lower losses than if we had been in the Production Stage. Any capitalized costs, such as acquisition costs of mineral rights, are depleted over the estimated extraction life using the straight-line method. As a result, our consolidated financial statements may not be directly comparable to the financial statements of companies in the Production Stage.
Estimated costs of future reclamation obligations may be significantly exceeded by actual costs incurred in the future. Furthermore, only a portion of the financial assurance required for the future reclamation obligations has been funded.
We are responsible for certain remediation and decommissioning activities in the future, primarily for our Hobson Processing Facility, our Palangana Mine, our Reno Creek Project and our Alto Paraná Project, and have recorded a liability of $3.7 million on our balance sheet at July 31, 2020, to recognize the present value of the estimated costs of such reclamation obligations. Should the actual costs to fulfill these future reclamation obligations materially exceed these estimated costs, it may have an adverse effect on our financial condition and operating results, including not having the financial resources required to fulfill such obligations when required to do so.
During Fiscal 2015, we secured $5.6 million of surety bonds as an alternate source of financial assurance for the estimated costs of the reclamation obligations of our Hobson Processing Facility and Palangana Mine, of which we have $1.7 million funded and held as restricted cash for collateral purposes as required by the surety. We may be required at any time to fund the remaining $3.9 million or any portion thereof for a number of reasons including, but not limited to, the following: (i) the terms of the surety bonds are amended, such as an increase in collateral requirements; (ii) we are in default with the terms of the surety bonds; (iii) the surety bonds are no longer acceptable as an alternate source of financial assurance by the regulatory authorities; or (iv) the surety encounters financial difficulties. Should any one or more of these events occur in the future, we may not have the financial resources to fund the remaining amount or any portion thereof when required to do so.
We do not insure against all of the risks we face in our operations.
In general, where coverage is available and not prohibitively expensive relative to the perceived risk, we will maintain insurance against such risk, subject to exclusions and limitations. We currently maintain insurance against certain risks including securities and general commercial liability claims and certain physical assets used in our operations, subject to exclusions and limitations, however, we do not maintain insurance to cover all of the potential risks and hazards associated with our operations. We may be subject to liability for environmental, pollution or other hazards associated with our exploration, pre-extraction and extraction activities, which we may not be insured against, which may exceed the limits of our insurance coverage or which we may elect not to insure against because of high premiums or other reasons. Furthermore, we cannot provide assurance that any insurance coverage we currently have will continue to be available at reasonable premiums or that such insurance will adequately cover any resulting liability.
Acquisitions that we may make from time to time could have an adverse impact on us.
From time to time we examine opportunities to acquire additional mining assets and businesses. Any acquisition that we may choose to complete may be of a significant size, may change the scale of our business and operations and may expose us to new geographic, political, operating, financial and geological risks. Our success in our acquisition activities depends on our ability to identify suitable acquisition candidates, negotiate acceptable terms for any such acquisition and integrate the acquired operations successfully with those of our Company. Any acquisitions would be accompanied by risks which could have a material adverse effect on our business. For example: (i) there may be a significant change in commodity prices after we have committed to complete the transaction and established the purchase price or exchange ratio; (ii) a material ore body may prove to be below expectations; (iii) we may have difficulty integrating and assimilating the operations and personnel of any acquired companies, realizing anticipated synergies and maximizing the financial and strategic position of the combined enterprise, and maintaining uniform standards, policies and controls across the organization; (iv) the integration of the acquired business or assets may disrupt our ongoing business and our relationships with employees, customers, suppliers and contractors; and (v) the acquired business or assets may have unknown liabilities which may be significant. In the event that we choose to raise debt capital to finance any such acquisition, our leverage will be increased. If we choose to use equity as consideration for such acquisition, existing shareholders may suffer dilution. Alternatively, we may choose to finance any such acquisition with our existing resources. There can be no assurance that we would be successful in overcoming these risks or any other problems encountered in connection with such acquisitions.
The uranium and titanium industries are subject to numerous stringent laws, regulations and standards, including environmental protection laws and regulations. If any changes occur that would make these laws, regulations and standards more stringent, it may require capital outlays in excess of those anticipated or cause substantial delays, which would have a material adverse effect on our operations.
Uranium and titanium exploration and pre-extraction programs and mining activities are subject to numerous stringent laws, regulations and standards at the federal, state, and local levels governing permitting, pre-extraction, extraction, exports, taxes, labor standards, occupational health, waste disposal, protection and reclamation of the environment, protection of endangered and protected species, mine safety, hazardous substances and other matters. Our compliance with these requirements requires significant financial and personnel resources.
The laws, regulations, policies or current administrative practices of any government body, organization or regulatory agency in the United States or any other applicable jurisdiction, may change or be applied or interpreted in a manner which may also have a material adverse effect on our operations. The actions, policies or regulations, or changes thereto, of any government body or regulatory agency or special interest group, may also have a material adverse effect on our operations.
Uranium and titanium exploration and pre-extraction programs and mining activities are subject to stringent environmental protection laws and regulations at the federal, state and local levels. These laws and regulations include permitting and reclamation requirements, regulate emissions, water storage and discharges and disposal of hazardous wastes. Uranium mining activities are also subject to laws and regulations which seek to maintain health and safety standards by regulating the design and use of mining methods. Various permits from governmental and regulatory bodies are required for mining to commence or continue, and no assurance can be provided that required permits will be received in a timely manner.
Our compliance costs, including the posting of surety bonds associated with environmental protection laws and regulations and health and safety standards, have been significant to date, and are expected to increase in scale and scope as we expand our operations in the future. Furthermore, environmental protection laws and regulations may become more stringent in the future, and compliance with such changes may require capital outlays in excess of those anticipated or cause substantial delays, which would have a material adverse effect on our operations.
To the best of our knowledge, our operations are in compliance, in all material respects, with all applicable laws, regulations and standards. If we become subject to liability for any violations, we may not be able or may elect not to insure against such risk due to high insurance premiums or other reasons. Where coverage is available and not prohibitively expensive relative to the perceived risk, we will maintain insurance against such risk, subject to exclusions and limitations. However, we cannot provide any assurance that such insurance will continue to be available at reasonable premiums or that such insurance will be adequate to cover any resulting liability.
We may not be able to obtain, maintain or amend rights, authorizations, licenses, permits or consents required for our operations.
Our exploration and mining activities are dependent upon the grant of appropriate rights, authorizations, licences, permits and consents, as well as continuation and amendment of these rights, authorizations, licences, permits and consents already granted, which may be granted for a defined period of time, or may not be granted or may be withdrawn or made subject to limitations. There can be no assurance that all necessary rights, authorizations, licences, permits and consents will be granted to us, or that authorizations, licences, permits and consents already granted will not be withdrawn or made subject to limitations.
Major nuclear and global market incidents may have adverse effects on the nuclear and uranium industries.
The nuclear incident that occurred in Japan in March 2011 had significant and adverse effects on both the nuclear and uranium industries. If another nuclear incident were to occur, it may have further adverse effects for both industries. Public opinion of nuclear power as a source of electrical generation may be adversely affected, which may cause governments of certain countries to further increase regulation for the nuclear industry, reduce or abandon current reliance on nuclear power or reduce or abandon existing plans for nuclear power expansion. Any one of these occurrences has the potential to reduce current and/or future demand for nuclear power, resulting in lower demand for uranium and lower market prices for uranium, adversely affecting the operations and prospects of our Company. Furthermore, the growth of the nuclear and uranium industries is dependent on continuing and growing public support of nuclear power as a viable source of electrical generation.
In March 2020 the COVID-19 pandemic has resulted in a black swan event impacting about 50% of the world’s uranium production and has accelerated the market rebalancing. The timing for the return of global uranium production to pre-COVID-19 levels is highly uncertain as of the date of this Annual Report. Recent and significant production cuts were announced in response to the global COVID-19 pandemic, including uranium facilities in Canada, Kazakhstan, and Namibia. It is unknown at this time exactly how long the shutdowns will last or how much uranium production will ultimately be removed from the market as a result of these shutdowns. It is the Company’s belief that the recent shutdowns are only going to further tighten the market. The Company also believes that a large degree of uncertainty exists in the market, primarily due to the size of mobile uranium inventories, transportation issues, premature reactor shutdowns in the U.S. and the length of time of any uranium mine, conversion or enrichment shutdowns.
The marketability of uranium concentrates will be affected by numerous factors beyond our control which may result in our inability to receive an adequate return on our invested capital.
The marketability of uranium concentrates extracted by us will be affected by numerous factors beyond our control. These factors include: (i) macroeconomic factors; (ii) fluctuations in the market price of uranium; (iii) governmental regulations; (iv) land tenure and use; (v) regulations concerning the importing and exporting of uranium; and (vi) environmental protection regulations. The future effects of these factors cannot be accurately predicted, but any one or a combination of these factors may result in our inability to receive an adequate return on our invested capital.
The titanium industry is affected by global economic factors, including risks associated with volatile economic conditions, and the market for many titanium products is cyclical and volatile, and we may experience depressed market conditions for such products.
Titanium is used in many “quality of life” products for which demand historically has been linked to global, regional and local GDP and discretionary spending, which can be negatively impacted by regional and world events or economic conditions. Such events are likely to cause a decrease in demand for products and, as a result, may have an adverse effect on our results of operations and financial condition. The timing and extent of any changes to currently prevailing market conditions is uncertain, and supply and demand may be unbalanced at any time. Uncertain economic conditions and market instability make it particularly difficult for us to forecast demand trends. As a consequence, we may not be able to accurately predict future economic conditions or the effect of such conditions on our financial condition or results of operations. We can give no assurances as to the timing, extent or duration of the current or future economic cycles impacting the industries in which we operate.
Historically, the market for large volume titanium applications, including coatings, paper and plastics, has experienced alternating periods of tight supply, causing prices and margins to increase, followed by periods of lower capacity utilization resulting in declining prices and margins. The volatility this market experiences occurs as a result of significant changes in the demand for products as a consequence of global economic activity and changes in customers’ requirements. The supply-demand balance is also impacted by capacity additions or reductions that result in changes of utilization rates. In addition, titanium margins are impacted by significant changes in major input costs such as energy and feedstock. Demand for titanium depends in part on the housing and construction industries. These industries are cyclical in nature and have historically been impacted by downturns in the economy. In addition, pricing may affect customer inventory levels as customers may from time to time accelerate purchases of titanium in advance of anticipated price increases or defer purchases of titanium in advance of anticipated price decreases. The cyclicality and volatility of the titanium industry results in significant fluctuations in profits and cash flow from period to period and over the business cycle.
The uranium industry is highly competitive and we may not be successful in acquiring additional projects.
The uranium industry is highly competitive, and our competition includes larger, more established companies with longer operating histories that not only explore for and produce uranium, but also market uranium and other products on a regional, national or worldwide basis. Due to their greater financial and technical resources, we may not be able to acquire additional uranium projects in a competitive bidding process involving such companies. Additionally, these larger companies have greater resources to continue with their operations during periods of depressed market conditions.
The titanium industry is concentrated and highly competitive, and we may not be able to compete effectively with our competitors that have greater financial resources or those that are vertically integrated, which could have a material adverse effect on our business, results of operations and financial condition.
The global titanium market is highly competitive, with the top six producers accounting for approximately 60% of the world’s production capacity. Competition is based on a number of factors, such as price, product quality and service. Competition is based on a number of factors, such as price, product quality and service. Among our competitors are companies that are vertically-integrated (those that have their own raw material resources). Changes in the competitive landscape could make it difficult for us to retain our competitive position in various products and markets throughout the world. Our competitors with their own raw material resources may have a competitive advantage during periods of higher raw material prices. In addition, some of the companies with whom we compete may be able to produce products more economically than we can. Furthermore, some of our competitors have greater financial resources, which may enable them to invest significant capital into their businesses, including expenditures for research and development.
We hold mineral rights in foreign jurisdictions which could be subject to additional risks due to political, taxation, economic and cultural factors.
We hold certain mineral rights located in the Republic of Paraguay through Piedra Rica Mining S.A., Transandes Paraguay S.A. Trier S.A. and Metalicos Y No Metalicos S.R.L., which are incorporated in Paraguay. Operations in foreign jurisdictions outside of the United States and Canada, especially in developing countries, may be subject to additional risks as they may have different political, regulatory, taxation, economic and cultural environments that may adversely affect the value or continued viability of our rights. These additional risks include, but are not limited to: (i) changes in governments or senior government officials; (ii) changes to existing laws or policies on foreign investments, environmental protection, mining and ownership of mineral interests; (iii) renegotiation, cancellation, expropriation and nationalization of existing permits or contracts; (iv) foreign currency controls and fluctuations; and (v) civil disturbances, terrorism and war.
In the event of a dispute arising at our foreign operations in Paraguay, we may be subject to the exclusive jurisdiction of foreign courts or may not be successful in subjecting foreign persons to the jurisdiction of the courts in the United States or Canada. We may also be hindered or prevented from enforcing our rights with respect to a government entity or instrumentality because of the doctrine of sovereign immunity. Any adverse or arbitrary decision of a foreign court may have a material and adverse impact on our business, prospects, financial condition and results of operations.
The title to our mineral property interests may be challenged.
Although we have taken reasonable measures to ensure proper title to our interests in mineral properties and other assets, there is no guarantee that the title to any of such interests will not be challenged. No assurance can be given that we will be able to secure the grant or the renewal of existing mineral rights and tenures on terms satisfactory to us, or that governments in the jurisdictions in which we operate will not revoke or significantly alter such rights or tenures or that such rights or tenures will not be challenged or impugned by third parties, including local governments, aboriginal peoples or other claimants. The Company has had communications and filings with the MOPC, whereby the MOPC is taking the position that certain concessions forming part of the Company’s Yuty Project and Alto Paraná Project are not eligible for extension as to exploration or continuation to exploitation in their current stages. While we remain fully committed to our development path forward in Paraguay, we have filed certain applications and appeals in Paraguay to reverse the MOPC’s position in order to protect the Company’s continuing rights in those concessions. Our mineral properties may be subject to prior unregistered agreements, transfers or claims, and title may be affected by, among other things, undetected defects. A successful challenge to the precise area and location of our claims could result in us being unable to operate on our properties as permitted or being unable to enforce our rights with respect to our properties.
Due to the nature of our business, we may be subject to legal proceedings which may divert management’s time and attention from our business and result in substantial damage awards.
Due to the nature of our business, we may be subject to numerous regulatory investigations, securities claims, civil claims, lawsuits and other proceedings in the ordinary course of our business including those described under Item 3. Legal Proceedings. The outcome of these lawsuits is uncertain and subject to inherent uncertainties, and the actual costs to be incurred will depend upon many unknown factors. We may be forced to expend significant resources in the defense of these suits, and we may not prevail. Defending against these and other lawsuits in the future may not only require us to incur significant legal fees and expenses, but may become time-consuming for us and detract from our ability to fully focus our internal resources on our business activities. The results of any legal proceeding cannot be predicted with certainty due to the uncertainty inherent in litigation, the difficulty of predicting decisions of regulators, judges and juries and the possibility that decisions may be reversed on appeal. There can be no assurances that these matters will not have a material adverse effect on our business, financial position or operating results.
We depend on certain key personnel, and our success will depend on our continued ability to retain and attract such qualified personnel.
Our success is dependent on the efforts, abilities and continued service of certain senior officers and key employees and consultants. A number of our key employees and consultants have significant experience in the uranium industry. A loss of service from any one of these individuals may adversely affect our operations, and we may have difficulty or may not be able to locate and hire a suitable replacement.
Certain directors and officers may be subject to conflicts of interest.
The majority of our directors and officers are involved in other business ventures including similar capacities with other private or publicly-traded companies. Such individuals may have significant responsibilities to these other business ventures, including consulting relationships, which may require significant amounts of their available time. Conflicts of interest may include decisions on how much time to devote to our business affairs and what business opportunities should be presented to us. Our Code of Business Conduct and Ethics provides for guidance on conflicts of interest.
The laws of the State of Nevada and our Articles of Incorporation may protect our directors and officers from certain types of lawsuits.
The laws of the State of Nevada provide that our directors and officers will not be liable to our Company or to our stockholders for monetary damages for all but certain types of conduct as directors and officers. Our Bylaws provide for broad indemnification powers to all persons against all damages incurred in connection with our business to the fullest extent provided or allowed by law. These indemnification provisions may require us to use our limited assets to defend our directors and officers against claims, and may have the effect of preventing stockholders from recovering damages against our directors and officers caused by their negligence, poor judgment or other circumstances.
Several of our directors and officers are residents outside of the United States, and it may be difficult for stockholders to enforce within the United States any judgments obtained against such directors or officers.
Several of our directors and officers are nationals and/or residents of countries other than the United States, and all or a substantial portion of such persons’ assets are located outside of the United States. As a result, it may be difficult for investors to effect service of process on such directors and officers, or enforce within the United States any judgments obtained against such directors and officers, including judgments predicated upon the civil liability provisions of the securities laws of the United States or any state thereof. Consequently, stockholders may be effectively prevented from pursuing remedies against such directors and officers under United States federal securities laws. In addition, stockholders may not be able to commence an action in a Canadian court predicated upon the civil liability provisions under United States federal securities laws. The foregoing risks also apply to those experts identified in this document that are not residents of the United States.
Disclosure controls and procedures and internal control over financial reporting, no matter how well designed and operated, are designed to obtain reasonable, and not absolute, assurance as to its reliability and effectiveness.
Management’s evaluation on the effectiveness of disclosure controls and procedures is designed to ensure that information required for disclosure in our public filings is recorded, processed, summarized and reported on a timely basis to our senior management, as appropriate, to allow timely decisions regarding required disclosure. Management’s report on internal control over financial reporting is designed to provide reasonable assurance that transactions are properly authorized, assets are safeguarded against unauthorized or improper use and transactions are properly recorded and reported. However, any system of controls, no matter how well designed and operated, is based in part upon certain assumptions designed to obtain reasonable, and not absolute, assurance as to its reliability and effectiveness. Any failure to maintain effective disclosure controls and procedures in the future may result in our inability to continue meeting our reporting obligations in a timely manner, qualified audit opinions or restatements of our financial reports, any one of which may affect the market price for our common stock and our ability to access the capital markets.
Risks Related to Our Common Stock
Historically, the market price of our common stock has been and may continue to fluctuate significantly.
On September 28, 2007, our common stock commenced trading on the NYSE American (formerly known as the American Stock Exchange, the NYSE Amex Equities Exchange and the NYSE MKT) and prior to that, traded on the OTC Bulletin Board.
The global markets have experienced significant and increased volatility in the past, and have been impacted by the effects of mass sub-prime mortgage defaults and liquidity problems of the asset-backed commercial paper market, resulting in a number of large financial institutions requiring government bailouts or filing for bankruptcy. The effects of these past events and any similar events in the future may continue to or further affect the global markets, which may directly affect the market price of our common stock and our accessibility for additional financing. Although this volatility may be unrelated to specific company performance, it can have an adverse effect on the market price of our shares which, historically, has fluctuated significantly and may continue to do so in the future.
In addition to the volatility associated with general economic trends and market conditions, the market price of our common stock could decline significantly due to the impact of any one or more events including, but not limited to, the following: (i) volatility in the uranium market; (ii) occurrence of a major nuclear incident such as the events in Fukushima in March 2011; (iii) changes in the outlook for the nuclear power and uranium industries; (iv) failure to meet market expectations on our exploration, pre-extraction or extraction activities, including abandonment of key uranium projects; (v) sales of a large number of our shares held by certain stockholders including institutions and insiders; (vi) downward revisions to previous estimates on us by analysts; (vii) removal from market indices; (viii) legal claims brought forth against us; and (ix) introduction of technological innovations by competitors or in competing technologies.
A prolonged decline in the market price of our common stock could affect our ability to obtain additional financing which would adversely affect our operations.
Historically, we have relied on equity financing and more recently, on debt financing, as primary sources of financing. A prolonged decline in the market price of our common stock or a reduction in our accessibility to the global markets may result in our inability to secure additional financing which would have an adverse effect on our operations.
Additional issuances of our common stock may result in significant dilution to our existing shareholders and reduce the market value of their investment.
We are authorized to issue 750,000,000 shares of common stock of which 184,635,870 shares were issued and outstanding as of July 31, 2020. Future issuances for financings, mergers and acquisitions, exercise of stock options and share purchase warrants and for other reasons may result in significant dilution to and be issued at prices substantially below the price paid for our shares held by our existing stockholders. Significant dilution would reduce the proportionate ownership and voting power held by our existing stockholders and may result in a decrease in the market price of our shares.
We are subject to the Continued Listing Criteria of the NYSE American and our failure to satisfy these criteria may result in delisting of our common stock.
Our common stock is currently listed on the NYSE American. In order to maintain this listing, we must maintain certain share prices, financial and share distribution targets, including maintaining a minimum amount of shareholders’ equity and a minimum number of public shareholders. In addition to these objective standards, the NYSE American may delist the securities of any issuer (i) if, in its opinion, the issuer’s financial condition and/or operating results appear unsatisfactory; (ii) if it appears that the extent of public distribution or the aggregate market value of the security has become so reduced as to make continued listing on the NYSE American inadvisable; (iii) if the issuer sells or disposes of principal operating assets or ceases to be an operating company; (iv) if an issuer fails to comply with the NYSE American’s listing requirements; (v) if an issuer’s common stock sells at what the NYSE American considers a “low selling price” and the issuer fails to correct this via a reverse split of shares after notification by the NYSE American; or (vi) if any other event occurs or any condition exists which makes continued listing on the NYSE American, in its opinion, inadvisable.
If the NYSE American delists our common stock, investors may face material adverse consequences including, but not limited to, a lack of trading market for our securities, reduced liquidity, decreased analyst coverage of our securities, and an inability for us to obtain additional financing to fund our operations.
Item 1B. Unresolved Staff Comments
Not applicable
Item 2. Properties
General
At July 31, 2020, we held mineral rights in uranium projects located in the U.S. States of Arizona, Colorado, New Mexico, Texas and Wyoming, in Canada and in the Republic of Paraguay by way of federal mining claims, state and private mineral leases and mineral concessions. We also held a wholly-owned uranium processing facility located in the State of Texas, the Hobson Processing Facility, which processes material extracted from our Palangana Mine.
We have prepared and will continue to prepare, from time to time, various technical reports (each, a “Technical Report”), in accordance with the provisions and requirements of National Instrument 43-101 Standards of Disclosure for Mineral Properties (“NI 43-101”), of the Canadian Securities Administrators (the “CSA”), respecting various of our mineral projects. Each of our Technical Reports have been and will continue to be filed by us on the public disclosure website of the CSA at www.sedar.com (“SEDAR”) as required by NI 43-101 and its companion policy and form. As also required by NI 43-101, each Technical Report is prepared by and authored by a qualified person as defined under NI 41-101.
As set forth and required by NI 43-101, each Technical Report may contain certain disclosure relating to mineral resource estimates and/or an exploration target for a subject mineral project. Such mineral resources, if any, have and will have been estimated in accordance with the definition standards on mineral resources of the Canadian Institute of Mining, Metallurgy and Petroleum referred to in NI 43-101. Inferred mineral resources and exploration targets, while recognized and required by Canadian regulations, are not defined terms under the SEC’s Industry Guide, and are normally not permitted to be used in reports and registration statements filed with the SEC. Accordingly, we have not and will not report them in this Annual Report or otherwise in the United States. Investors are cautioned not to assume that any part or all of the mineral resources in these categories will ever be converted into mineral reserves. These amounts have great uncertainty as to their existence and to their economic and legal feasibility. In particular, it should be noted that mineral resources, which are not mineral reserves, do not have demonstrated economic viability. It cannot be assumed that all or any part of measured mineral resources, indicated mineral resources or inferred mineral resources discussed in a Technical Report will ever be upgraded to a higher category. In accordance with Canadian rules, estimates of inferred mineral resources cannot form the basis of feasibility or other economic studies. Investors are cautioned not to assume that any part of the reported inferred mineral resources referred to in a Technical Report are economically or legally mineable. Exploration targets have a greater amount of uncertainty as to their existence, and great uncertainty as to their economic and legal feasibility. In particular, it should be noted that exploration targets do not have demonstrated economic viability. It cannot be assumed that all or any part of the exploration target discussed in a Technical Report will ever be upgraded to a higher category, or if additional exploration will result in discovery of an economic mineral resource on the property.
We have not established proven or probable reserves, as defined by the SEC under Industry Guide 7, through the completion of a “final” or “bankable” feasibility study for any of our mineral projects, including our Palangana Mine. Furthermore, we have no plans to establish proven or probable reserves for any of our mineral projects for which we plan on utilizing ISR mining, such as the Palangana Mine.
Texas Processing Facility and Projects
The following map shows the location of our Hobson Processing Facility and main projects in Texas:
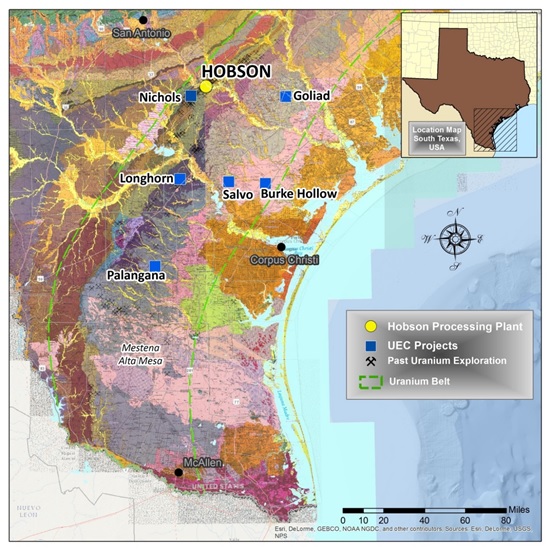
Hobson Processing Facility
Property Description and Location
The Hobson Processing Facility is a fully-licensed and permitted in-situ recovery or ISR uranium processing plant designed to process uranium-loaded resins from satellite ISR mining facilities to the final product, U3O8 or yellowcake. The Hobson Processing Facility was originally constructed in 1978 and served as a central processing site for several satellite ISR mining projects until 1996. It was completely refurbished in 2008 and, on December 18, 2009, we acquired the Hobson Processing Facility through the acquisition of STMV.
The Hobson Processing Facility is located in Karnes County, Texas, on a 7.286-acre leased tract of land, approximately one mile south of the community of Hobson and about 100 miles northwest of Corpus Christi, Texas. The surface lease of the Hobson Processing Facility is for an initial term of five years commencing May 30, 2007, and thereafter so long as uranium, thorium and other fissionable or spatially associated substances are being processed or refined without cessation of more than five consecutive years.
The Hobson Processing Facility has a physical capacity to process two million pounds of U3O8 annually and is licensed to process up to one million pounds of U3O8 annually, which provides for the capacity to process uranium-loaded resins from a number of satellite ISR mining facilities in South Texas. We utilize a “hub-and-spoke” strategy whereby the Hobson Processing Facility acts as our central uranium processing site (the “hub”) for our Palangana Mine and for future satellite ISR mines, including our Burke Hollow and Goliad Projects (the “spokes”), located within the South Texas Uranium Belt.
In January 2011 the Hobson Processing Facility began processing uranium-loaded resins received from the Palangana Mine upon commencement of uranium extraction in November 2010. Since then the Hobson Processing Facility has processed 578,000 pounds of uranium concentrates. During Fiscal 2019, the Hobson Processing facility was in a state of operational readiness.
Uranium Processing System
Once the uranium-loaded resin from the satellite ISR mining facility is delivered to the Hobson Processing Facility by semi-trailer, the material is transferred and placed in a pressure vessel for elution which involves flushing with a brine solution. The uranium is stripped from the resin in a three-stage elution process and concentrated into a rich eluate tank, at which point the solution is analyzed for total uranium concentration. After the uranium is eluted from the resin, the resin is washed to remove excess brine solution, transferred back to the trailer and returned to the satellite ISR mining facility to again begin the cycle of capturing uranium from the wellfield, transport to the Hobson Processing Facility and subsequent elution.
The uranium-rich solution remaining at the Hobson Processing Facility after elution is agitated and chemicals are added to precipitate the uranium. In this precipitation process sulfuric acid is added to reduce the pH to between 2 and 3. Hydrogen peroxide (“H2O2”) is then added at the rate of 0.2 to 0.5 pounds of H2O2 per pound of uranium while maintaining the pH of the solution between two and three using sodium hydroxide. Once the precipitation reaction is complete the solution is allowed to set in order for the uranium to precipitate and settle to the bottom of the tank. The excess overflow is decanted to a storage tank or to the waste disposal system. All waste process solutions from the plant area report to a chemical waste storage tank and waste solutions are pumped to a Class I, non-hazardous, waste disposal well system.
The remaining material, at approximately 3% to 5% solids, is pumped to a filter press where the uranium is separated from the liquid. After the uranium, or yellowcake, has been filtered, fresh water is pumped through to remove the entrained salts, with the resulting liquids pumped to the fresh eluate makeup system or the waste disposal system. From the filter press the thickened yellowcake, at 50% to 60% solids, is transferred to the drying package for drying and drumming. A zero-emissions vacuum dryer removes moisture from the yellowcake and a scrubber system removes these vapors from the dryer and discharges the gases to an exhaust stack. The dried yellowcake is packaged in 55-gallon drums. Each drum is weighed, cleaned, surveyed and analyzed, after which it is transferred to a temporary yellowcake storage area at the Hobson Processing Facility. The drums are then shipped to a third-party storage and sales facility.
Palangana Mine, Duval County, Texas
Property Description and Location
The Palangana Mine is located in Texas near the center of the extensive South Texas Uranium Belt. The Palangana Mine consists of multiple leases that would allow the mining of uranium by ISR methods while utilizing the land surface (with variable conditions), as needed, for mining wells and aboveground facilities for fluid processing and ore capture during the mining and groundwater restoration phases of the project. The Palangana Mine is situated in Duval County, Texas, and is located approximately 25 miles west of the town of Alice, six miles north of the town of Benavides, 15 miles southeast of the town of Freer and 12 miles southwest of the town of San Diego, as shown in the map below:
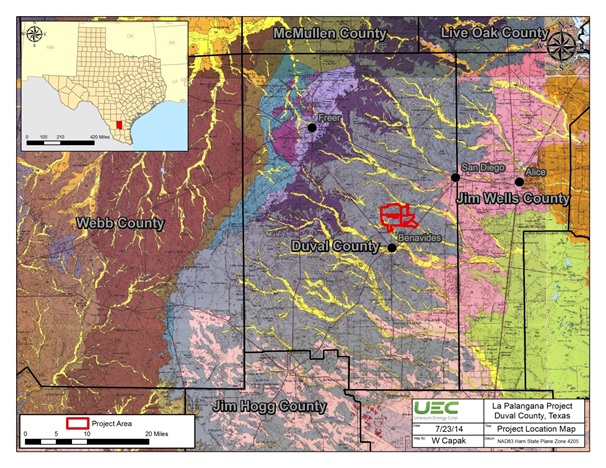
Mineral Titles
At July 31, 2020, there were nine leases covering 6,987 acres at the Palangana Mine. PAA-1 is on the de Hoyos leases while PAA-2, PAA-3 and the Dome trend are on the Palangana Ranch Management, LLC lease. Bordering the east side of the Palangana Ranch Management, LLC lease is the White Bell Ranch lease, comprised of 1,006 acres, which contains the Jemison Fence and Jemison East trends. The fourth major lease is the Garcia/Booth property comprised of 1,278 acres which borders the east side of the De Hoyos property and contains the NE Garcia and SW Garcia trends.
Lease ownership is held by STMV, which is wholly-owned by the Company.
Accessibility, Climate, Local Resources, Infrastructure and Physiography
Topography, Elevation and Vegetation
Surface elevations at the Palangana Mine range from about 410 feet to 500 feet above sea level.
Climate and Length of Operating Season
The region’s subtropical climate allows uninterrupted, year-round mining activities. Temperatures during the summer range from 75°F to 95°F, although highs above 100°F are common while winter temperatures range from 45°F to 65°F. Humidity is generally over 85% year-round and commonly exceeds 90% during the summer months. Average annual rainfall is 30 inches.
Physiography
The dome area to the west of the PAA-1 and PAA-2 deposits is a concentric collapsed area with the surrounding landscape being hilly and elevated. Surface water generally drains away from the dome area although no prominent creeks or rivers are evident.
Access to Property
The Palangana Mine occurs in the South Texas Uranium Belt between San Antonio and Corpus Christi in Duval County. Corpus Christi, the largest nearby metropolitan district, is about 65 miles to the east of the Palangana Mine. Approximately halfway between San Diego and Freer on Texas Highway 44 is a turn-off to the south referred to as Ranch Road 3196 that runs directly through the property about eight miles from the turn-off. The road continues southward about six miles to the town of Benavides. Access is excellent, with major two-lane roads connecting the three surrounding towns and unpaved secondary roads connecting to Palangana.
Surface Rights
The uranium leaseholders under most of the current leases have conveyed the surface rights under certain conditions of remuneration. These conditions essentially require payments for surface area taken out of usage.
Local Resources and Infrastructure
An entire infrastructure is in place including office buildings, access roads, electrical power and maintenance faculties. Each property has sources of water for drilling operations for both exploration and extraction drilling.
Manpower
A nearby workforce of field technicians, welders, electricians, drillers and pipefitters exists in the local communities. The technical workforce for facility operations from the area is sparse although ample qualified resources can be found in the South Texas area from the petrochemical industry.
History prior to acquisition by our Company
Uranium mineralization was discovered during potash exploration drilling of the Palangana Dome’s gypsum-anhydrite cap rock in 1952 by Columbia Southern Inc. (“CSI”). CSI conducted active uranium exploration drilling on the property starting in March 1956. Records of CSI’s exploration work are unavailable, however, both CSI and the U.S. Atomic Energy Commission estimated underground mineable uranium mineralization. The only known details of the estimation method include a 0.15% eU3O8 cut-off grade, a minimum mining thickness of three feet, and widely spaced drilling on a nominal 200-foot exploration grid. Union Carbide acquired the Palangana property in 1958 and initiated underground mine development. Development work was quickly abandoned due to heavy concentrations of H2S gas and Union Carbide dropped the property. Union Carbide reacquired Palangana in 1967 after recognizing that it would be amenable to exploitation by the emerging ISR mining technologies. During the 1960s and 1970s, Union Carbide drilled over 1,000 exploration and development holes and installed over 3,000 injection-extraction holes in a 31-acre lease block.
Union Carbide attempted an ISR operation from 1977 through 1979 using a push/pull injection/recovery system. Ammonia was used as the lixiviate that later caused some environmental issues with groundwater. About 340,000 pounds of U3O8 were produced from portions of a 31-acre wellfield area. The extraction pounds indicate a 32% to 34% recovery rate. The push/pull injection/recovery system was later proven to be less productive than well configurations or patterns of injection wells around a recovery well. Further, the wellfield was developed without any apparent regard to the geology of the deposit including disequilibrium. The Union Carbide ISR work was basically conducted at a research level in contrast to the current level of knowledge. The historic extraction area lies on the western side of the dome.
In 1981 Chevron Corporation acquired the Union Carbide leases and conducted their own resource evaluation. After the price of uranium dropped to under $10 per pound, General Atomics acquired the property and dismantled the processing plant in a property-wide restoration effort. Upon formal approval of the clean up by the Texas Natural Resources Conservation Commission and the United States Nuclear Regulatory Commission, the property was returned to the landowners in the late 1990’s. In 2005, Everest Exploration Inc. acquired the Palangana property and later joint ventured with Energy Metals Corp. (“Energy Metals”) through the formation of STMV. An independent consultant, Blackstone (2005), estimated inferred resources in an area now referred to as the Dome trend proximal to the dome on the west side north of the prior Union Carbide leach field. In 2006 and 2007 Energy Metals drilled approximately 200 additional confirmation and delineation holes. The PAA-1 and PAA-2 areas were found during this drilling program. In 2008 Energy Metals was acquired by Uranium One. During 2008 and 2009 the remaining holes on this project were drilled by Uranium One. During this time the five exploration trends to the east of the dome were identified and partially delineated. In December 2009 we acquired 100% ownership of STMV.
Geological Setting
South Texas geology is characterized by an arcuate belt of Tertiary fluvial clastic units deposited along the passive North American plate. These units strike parallel to the Gulf Coast between the Mexican border and Louisiana within an area known as the Mississippi Embayment. The uranium-bearing sedimentary units are primarily of fluvial origin and were deposited by southeasterly flowing streams and rivers. Uranium deposits are contained within fault-controlled roll-fronts in the lower Pliocene-to-Miocene age Goliad Formation on the flank of the Palangana salt dome. The uranium mineralization in the Goliad Formation at Palangana occurs at a depth of approximately 220 to 600 feet below the surface.
Geological Model
Uranium mineralization in the South Texas Uranium Belt occurs as sandstone-hosted roll-front deposits. The deposits are strata-bound, elongate, and often, but not necessarily, occur in the classic “C” or truncated “C” roll configuration. They can be associated with an oxidation front or can be found in a re-reduced condition where an overprint of later reduction from hydrogen sulfide or other hydrocarbon reductant has seeped along faults and fractures. The uranium bearing sandstone units can themselves be separated into several horizons by discontinuous mudstone units, and separate roll-fronts and sub-rolls can occur in the stacked sandstone sequences.
The generally accepted origin of uranium mineralization in the Goliad Formation is from leaching of intraformational tuffaceous material or erosion of older uranium-bearing strata. The leached uranium was carried by oxygenated groundwater in a hexavalent state and deposited where a suitable reductant was encountered. The oxidation/reduction (redox) fronts are often continuous for miles, although minable grade uranium mineralization is not nearly as continuous. The discontinuous nature of uranium mineralization is often characterized as “beads on a string” and is due to sinuous vertical and lateral fluvial facies changes in the permeable sandstone host horizons, coupled with ground water movements and the presence or absence of reducing material.
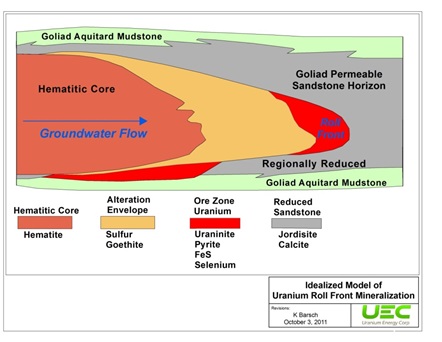
Figure 2: Schematic view of a typical uranium roll-front configuration.
The red area is the uranium mineralization deposited at the interface between the oxidized (up-gradient) sand shown in yellow and the reduced (down-gradient) sand shown in gray. The up-gradient sand has been altered by oxidizing groundwater that carried the uranium that was deposited in the roll-front at the oxidation/reduction (redox) interface. The uranium mineralization is hydrologically confined by an upper and lower confining layer of shale or mudstone. At wellfields, extraction (pumping) wells have been completed near the center of the roll-front and are fed lixiviate (leach solutions) by injection wells on each side of the front.
Mineralized Zones and Historical Drilling Results
As stated previously, mineralization does not occur in all of the Goliad sands nor does it persist in the same sand intervals across the dome area. On the west half of the dome near what is referred to as the Dome trend, Union Carbide developed the “C” sand zone. The NW Garcia and SE Garcia trends to the east of the dome also reside in the “C” sand zone. Also, to the east of the dome, the PAA-2 deposit, as well as the PAA-3 deposit, Jemison Fence and Jemison East trends all occur in the “E” sand, while the PAA-1 deposit occurs in the “G” sand. Within these mineralized horizons smaller roll-fronts are evident that can be mapped as discrete bodies. Some of these bodies contain economic mineralization while others do not. The mineralized horizons occur as stacked intervals often separated by claystones. Generally, they overlap one another but there are differences making a concurrent, multiple-horizon recovery scenario not uniformly effective.
The table below summarizes the historical drilling results at the Palangana Mine prior to its acquisition by our Company on December 18, 2009.
|
Trend |
Total # DHs |
Max. Depth (feet) |
Avg. Depth (feet) |
#of Mineralized Intervals |
Interval Thickness Range (feet) |
Interval Thickness Avg. (feet) |
|
PAA-1 |
518 |
660 |
565 |
389 |
0.5 – 13.5 |
5.24 |
|
PAA-2 |
239 |
600 |
337.5 |
186 |
0.5 – 13.5 |
5.79 |
|
PAA-3 |
69 |
520 |
417 |
49 |
2.0 – 18.5 |
5.9 |
|
Jemison East |
53 |
560 |
434 |
17 |
1.0 – 11.0 |
4.4 |
|
NE Garcia |
186 |
600 |
344 |
158 |
0.5 – 20.0 |
4.6 |
|
SW Garcia |
84 |
600 |
367 |
45 |
0.5 – 11.0 |
4.6 |
|
Dome |
231 |
600 |
346 |
239 |
0.5 – 12.5 |
4.1 |
Update to July 31, 2020
Since commencing uranium extraction at the Palangana Mine in November 2010 to July 31, 2020, the Hobson Processing Facility has processed 578,000 pounds of uranium concentrates extracted directly from the Palangana Mine utilizing ISR methods. A summary by PAA is provided below:
|
● |
PAA-1 commenced uranium extraction in November 2010 and remains fully-permitted. With 69 monitor wells already in place prior to our acquisition of the Palangana Mine, we drilled a total of 201 holes for well control facilities and wellfields including injection and extraction wells and infill drilling efforts. During Fiscal 2020, Fiscal 2019 and Fiscal 2018, no additional infill drilling took place; |
|
● |
PAA-2 commenced uranium extraction in March 2012 and remains fully-permitted. With 43 monitor wells already in place prior to our acquisition of the Palangana Mine, we drilled a total of 63 holes for well control facilities and wellfields including injection and extraction wells and infill drilling efforts. During Fiscal 2020, Fiscal 2019 and Fiscal 2018, no additional infill drilling took place; |
|
● |
PAA-3 commenced uranium extraction in December 2012 and remains fully-permitted. We drilled a total of 345 holes for mineral trend exploration and delineation, monitor wells, well control facilities and wellfields including injection and extraction wells and infill drilling efforts. During Fiscal 2020, Fiscal 2019 and Fiscal 2018, no additional infill drilling took place; |
|
● |
PAA-4 permitting was completed and approved in November 2014, including the approval of the aquifer exemption in March 2015. The Mine Area Permit boundary was expanded to 8,722 acres from 6,200 acres to include PAA-4. Wellfield design is being finalized in preparation for installment of the first module inside PAA-4. During Fiscal 2015 we drilled five holes for a total of 214 holes for mineral trend exploration, delineation and monitor wells. All monitor wells were sampled for baseline parameters and a pumping test has been completed; and |
|
● |
PAA-5 and PAA-6 mine area expansion application was approved in November 2014. We drilled a total of 46 holes at PAA-5 and PAA-6 for mineral trend exploration and delineation and a monitor well. During Fiscal 2020, Fiscal 2019, Fiscal 2018, no additional drilling took place. |
During Fiscal 2020, Fiscal 2019 and Fiscal 2018, we reduced operations at the Palangana Mine to capture residual uranium only. As a result, no material amount of U3O8 was processed at the Hobson Processing Facility.
In September 2013 we implemented a strategic plan to align our operations to a weak uranium market in a challenging post-Fukushima environment. This strategy has included the deferral of major pre-extraction expenditures and remaining in a state of operational readiness in anticipation of a recovery in uranium prices. As a consequence, U3O8 pounds extracted from the Palangana Mine and processed at the Hobson Processing Facility decreased significantly during Fiscal 2015 compared to prior years, and there have been no material amount of uranium extracted from the Palangana Mine from Fiscal 2017 to Fiscal 2020.
During Fiscal 2015 the Hobson Processing Facility processed finished goods representing 18,000 pounds of U3O8 (Fiscal 2014: 43,000 pounds; Fiscal 2013: 194,000 pounds; and Fiscal 2012: 198,000 pounds) extracted solely from the Palangana Mine. Based on our estimate of mineralized materials in PAA 1, 2 and 3, over which an average mining grade of 0.135% has been established, cumulative recovery since the commencement of uranium extraction in November 2010 to July 31, 2020 was 44% (July 31, 2015: 44%; July 31, 2014: 43%; July 31, 2013: 40%; and July 31, 2012: 31%).
The following table summarizes the drill holes completed by the Company from December 18, 2009, the date of our acquisition of STMV, to July 31, 2020:
|
Trend |
Total # DHs |
Max. Depth (feet) |
Avg. Depth (feet) |
|
PAA-1 |
201 |
610 |
541 |
|
PAA-2 |
63 |
370 |
305 |
|
PAA-3 |
345 |
620 |
396 |
|
PAA-4 |
214 |
640 |
436 |
|
PAA-5 |
40 |
520 |
370 |
|
SW Garcia |
6 |
620 |
568 |
|
Dome |
56 |
500 |
355 |
We have not established proven or probable reserves, as defined by the SEC under Industry Guide 7, through the completion of a “final” or “bankable” feasibility study for the Palangana Mine. Furthermore, we have no plans to establish proven or probable reserves for any of our uranium projects for which we plan on utilizing ISR mining, such as the Palangana Mine. Since we commenced extracting mineralized materials at the Palangana Mine without having established proven and probable reserves, any mineralized materials established or extracted from the Palangana Mine should not in any way be associated with having established or produced from proven or probable reserves.
Burke Hollow Project, Bee County, Texas
Property Description and Location
Our Burke Hollow Project is comprised of two leases covering 19,335 acres located in Texas along the eastern, down-dip side end of the South Texas Uranium Belt. These leases allow for the mining of uranium by ISR methods while utilizing the land surface (with variable conditions) as needed, for mining wells and aboveground facilities for fluid processing and uranium extraction during the mining and groundwater restoration phases of the project. The Burke Hollow Project area is about 18 miles southeast of the town of Beeville, is located on the western side of US 77 and is located northeast of US 181 which links with US 59 in Beeville.
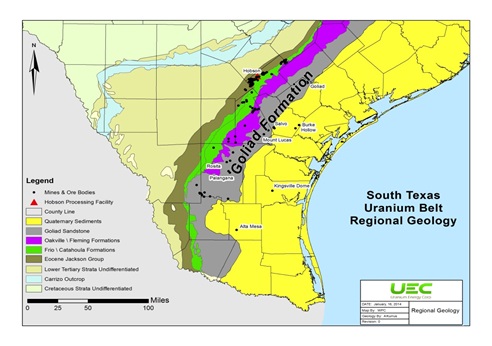
Virtually all mining in Texas is on private lands with leases negotiated between mining companies and each individual land/mineral owner. The Burke Hollow Project consists of two leases, one lease dated February 21, 2012, comprised of 17,510 acres, with Thomson-Barrow Corporation as mineral owner and Burke Hollow Corporation as surface owner, and the other dated December 15, 2012, comprised of 1,825 acres, with a separate owner. The leases are paid-up leases for a primary term of five years and allow for an extension term of an additional five years and so long thereafter as uranium or other leased substances are being produced. The leases have various stipulated fees for land surface alterations, such as per well or exploration hole fees (damages). The primary lease stipulation is the royalty payments as a percentage of production. Because the leases are negotiated with private land and mineral owners and none of the property is located on government land, some details of the lease information and terms are considered confidential.
There are no known environmental liabilities associated with the Burke Hollow Project. We currently have an exploration permit for work in Bee County from the Texas Railroad Commission (“TRC”).
Prior to any mining activity at the Burke Hollow Project, we would be required to obtain a RML, a large area UIC Mine permit and a PAA permit for each wellfield developed for mining within the Mine Permit area. In addition, a waste disposal well would, if needed, would require a separate UIC Mine permit. These permits would be issued by Texas regulatory agencies.
The TRC requires exploration companies to obtain exploration permits before conducting drilling in any area. The permits include standards for the abandonment and remediation of test bore holes. Potential future environmental liability as a result of the mining must be addressed by the permit holder jointly with the permit granting agency. Most permits now have bonding requirements for ensuring that the restoration of groundwater, the land surface and any ancillary facility structures or equipment is properly completed. If the Burke Hollow Project reaches economic viability in the future, we would need to complete a number of required environmental baseline studies such as cultural resources (including archaeology), socioeconomic impact and soils mapping. Flora and fauna studies will need to be conducted as will background radiation surveys.
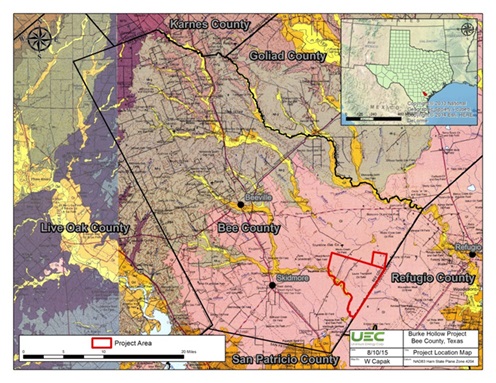
Accessibility, Climate, Local Resources, Infrastructure and Physiography
The Burke Hollow Project is situated in the interior portion of the Gulf Coastal Plain physiographic province. The area is characterized by rolling topography with parallel to sub-parallel ridges and valleys. There is about 47 feet of relief at the site with ground surface elevations ranging from a low of 92 feet to a high of 139 feet above mean sea level. The leased property for the Burke Hollow Project is used mostly for petroleum production, cattle ranching and game management. Access by vehicular traffic is provided from Hwy. 77 to the property.
The property is in a rural setting in southeastern Bee County. The nearest population centers are Skidmore, approximately 11 miles west, Refugio about 15 miles east, and Beeville, approximately 18 miles northwest. While Skidmore and Refugio are relatively small towns, they provide basic needs for food and lodging and some supplies. Beeville is a much larger city and provides a well-developed infrastructure that has resulted from being a regional center to support oil and gas exploration and production. The Burke Hollow Project site area has good accessibility for light to heavy equipment. There is an excellent network of county, state and federal highways that serve the region and the moderate topography with dominantly sandy, well-drained soils provide good construction conditions for building gravel site roads necessary for site access. Water supply in the project area is from private water wells, mostly tapping sands of the upper Goliad Formation. Water needs for potential future pre-extraction activities would be from the same sources.
Bee County has a climate characterized by long, hot summers and cool to warm winters. The moderate temperatures and precipitation result in excellent conditions for developing an ISR mine. The average annual precipitation is about 32 inches with the months from November to March normally the driest and May through October typically having more precipitation due partly to more intense tropical storms. From June through September the normal high temperatures are routinely above 90 degrees Fahrenheit, while the months from December through February are the coolest with average low temperatures below 50 degrees Fahrenheit. Periods of freezing temperatures are generally quite brief and infrequent. Tropical weather from the Gulf of Mexico can occur during the hurricane season and may affect the site area with heavy rain storms. The infrequent freezing weather and abnormally heavy rainfalls are the primary conditions that could cause temporary shutdowns at an operating ISR mine.
The necessary rights for constructing the needed surface processing facilities are in-place on selected lease agreements. Sufficient electric power is believed to be available in the area, however new lines may be needed to bring additional service to a plant site and well fields. Within a 20-mile radius of the planned Burke Hollow facility there is sufficient population to supply the necessary number of suitable mining personnel.
History
The earliest historic uranium exploration at the Burke Hollow Project was the drilling of five exploration holes completed on the Welder lease by Nufuels (Mobil) in 1982. Oxidation/reduction interfaces were intercepted in two of the holes and oxidized tails were logged in three of the holes. In 1993 Total Minerals conducted a short reconnaissance exploration drilling program and completed a total of 12 exploration holes of which 11 intersected anomalous gamma ray log signatures indicative of uranium mineralization. The resulting 12 log files include good quality electric logs, with each log file containing a detailed lithological report based on drill hole cuttings prepared by Total Mineral’s field geologists who were supervising and monitoring the drilling activity contemporaneously.
All of the boreholes were drilled using contracted truck-mounted drilling rigs. The holes were drilled by conventional rotary drilling methods using drilling mud fluids. All uranium exploration at the Burke Hollow Project has been conducted with vertical drill holes. Drill cuttings were typically collected from the drilling fluid returns circulating up the annulus of the borehole. These samples were generally taken at five foot intervals and laid out on the ground in consecutive rows of twenty by the drill crew for review and description by a geologist. Upon completion, the holes were logged for gamma ray, self-potential, and resistance by contract logging companies. Century Geophysical was the logging company utilized by both Nufuels and Total Minerals, and Century Geophysical provided primarily digital data. A tool recording down-hole deviation was also utilized for each of the holes drilled.
This description of previous exploration work undertaken at the Burke Hollow Project is based primarily on gamma ray and electric logs along with several small maps and cross-sections constructed by Total Minerals.
The historic data package obtained by us for a portion of the current Burke Hollow Project area provided the above described information. Based on the very limited number of drill holes, no meaningful resource or reserve determination was made by either Nufuels or Total Minerals. The actual drilling and geophysical logging results, however, have been determined to be properly conducted to current industry standards and usable by our exploration staff in their geologic investigation.
The only historic work relating to uranium exploration or mining is the early exploration work done by Nufuels in 1982 and by Total Minerals in 1993 as described above. There has been no known ownership of the Burke Hollow property by a mining company and no prior ownership or changes in ownership for the property are known by our Company or are relevant to the project.
Geological Setting
Regional Geology
The Burke Hollow Project area is situated within the Texas Gulf Coastal Plain physiographic province that is geologically characterized by sedimentary deposits that typically dip and thicken toward the Gulf of Mexico from the northwest source areas. Additionally, the regional dip generally increases with distance in the down dip direction as the overall thickness of sediments increase. The sedimentary units are dominantly continental clastic deposits with some underlying near shore and shallow marine facies. The uranium-bearing units of South Texas are virtually all sands and sandstones in Tertiary formations ranging in age from Eocene (oldest) to Lower Pliocene (youngest). At Burke Hollow, deposits are hosted by the Goliad Formation of Lower Pliocene to Miocene age.
The Project area, located about 18 miles southeast of Beeville, which is the county seat of Bee County, is situated in the major northeast-southwest trending Goliad Formation of fluvial origin. The Geologic Atlas of Texas, Beeville-Bay City Sheet (Texas Bureau of Economic Geology, Revised 1987), indicates that a thin layer of Pleistocene-aged Lissie Formation overlies the Miocene Goliad Formation. The map below shows the surface geology at the Burke Hollow Project.
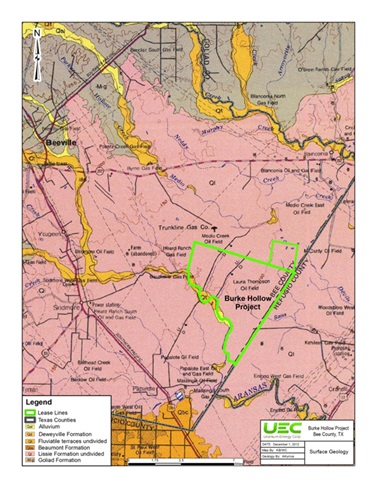
The Goliad Formation was originally classified as Pliocene in age, but the formation has been reclassified as early Pliocene to middle Miocene after research revealed the presence of indigenous Miocene-aged mega-fossils occurring in upper Goliad sands. The lower Goliad fluvial sands are correlative with down-dip strata containing benthic foraminifera, indicative of a Miocene age (Baskin and Hulbert, 2008, GCAGS Transactions, v. 58, p. 93-101). The Geology of Texas map published by The Bureau of Economic Geology in 1992 classifies the Goliad as Miocene.
Local and Property Geology
The uranium-bearing sands of the Goliad Formation at the project site occur beneath a thin layer of Lissie Formation sand, silt, clay, and gravel, which covers most of the project area with a total thickness of approximately 35 feet on the western side to approximately 70 feet thickness on the downdip eastern side of the project. The Goliad Formation underlies the Lissie and is present at depths ranging from 35 feet to approximately 1,050 feet in depth on the eastern side of the property. We have determined that uranium mineralization discovered to date occurs within at least four individual sand units in the Upper Goliad at depths generally ranging from 160 feet to 500 feet, and within two deeper sand units in the Lower Goliad located between 900 feet to 950 feet in depth.
The Goliad sand is one of the principal water-bearing formations in Bee County capable of yielding moderate to large quantities of fresh to slightly saline water in the south half of Bee County, which includes the project area.
The hydrogeological characteristics of the water-bearing Goliad sands at the Burke Hollow Project have not yet been determined, but required hydrogeological tests will determine the hydraulic character of the sands and the confining beds separating the individual sand zones. Information regarding the water-bearing characteristics of the Goliad sands from aquifer tests of Beeville and Refugio City supply wells (O.C. Dale, et al., 1957) reported an average coefficient of permeability of about 100 gallons per day per square foot. This would be the equivalent coefficient of transmissivity of approximately 2,500 gallons per day per foot for a 25-foot thick sand. It is likely that the uranium-bearing mineralized sand zones at the Burke Hollow Project will have similar hydraulic characteristics.
There are at least two northeast-southwest trending faults at the Burke Hollow Project that are likely related to the formation of the uranium mineralization. These faults are shown at a depth of approximately 3,500 feet below ground surface based on petroleum industry maps and extend upward into the Goliad Formation. The northwesterly fault is a typical Gulf Coast normal fault, downthrown toward the coast, while the southeastern fault is an antithetic fault downthrown to the northwest, forming a graben structure. The presence of these faults is likely related to the increased mineralization at the site. The faulting has probably served as a conduit for reducing waters/gases migrating from deeper horizons as well as altering the groundwater flow system in the uranium-bearing sands.
Mineralization
The Burke Hollow Project uranium-bearing units occur as multiple roll-front type deposits in vertically stacked sands and sandstones. Groundwater flowing from northwest to southeast in the Goliad sands likely contained low concentrations of dissolved uranium resulting from oxidizing conditions and the relatively short distance from the recharge area. The geochemical conditions in the sands near the project changed from oxidizing to reducing due to an influx of reductants. Hydrogen sulfide and/or methane dissolved in groundwater are likely sources for creating a reduction-oxidation boundary in the area with consequent precipitation and concentration of uranium mineralization.
Specific identification of the uranium minerals has not yet been determined at the Burke Hollow Project. The very fine uranium minerals found coating quartz grains and within the interstices in most South Texas sand and sandstone roll-front deposits has generally been found to be dominantly uraninite and, to a lesser extent, coffinite. No uraninite has been identified on the Burke Hollow Project and the presence of uraninite on other properties does not mean that such mineralization will be found at the Burke Hollow Project. Detailed petrographic examination of disseminated uranium mineralization within sands/sandstones is generally not suitable for identification of the specific uranium minerals. Laboratory analysis such as x-ray diffraction may be used to identify the minerals, however, the specific mineral species typically found in reduced sands are generally similar in South Texas ISR projects and leaching characteristics are also similar. Based on the experience of the ISR mines throughout South Texas, the use of gamma-ray logging with a calibrated logging probe has become the standard method to determine the thickness and estimated grade of uranium bearing minerals.
At the project site the Goliad Formation is located near the surface underlying the Lissie Formation, and extends to depths exceeding 1,050 feet on the eastern side of the property. Uranium mineralization discovered to date occurs in multiple sand/sandstone units that are all below the saturated zone. These are the Goliad Lower A sand, the Goliad Upper B sand, the Goliad Lower B sand and the Goliad D sand. The sands are fluvial-deltaic in origin, and thicken and thin across the project site. Each zone is hydrologically separated by clay or silty clay beds. The uranium deposits discovered to date range from several feet to over 30 feet in thickness. The C-shaped configuration is typically convex in a down-dip direction with tails trailing on the up-dip side.
Update to July 31, 2020
During Fiscal 2020, a total of 26 exploration holes and 21 cased monitor wells totaling 21,069 feet were drilled at the Burke Hollow Project to depths ranging from a minimum of 400 feet to a maximum 500 feet, with an average depth of 448 feet. Cumulative to July 31, 2020, a total of 729 exploration holes and 107 monitor wells totaling 386,034 feet have been drilled to depths ranging from a minimum of 160 feet to a maximum of 1,100 feet, with an average depth of 459 feet.
As of July 31, 2020, a total of 30 regional baseline monitor wells have been installed in order to establish baseline water quality in both the Goliad Lower A and Goliad Lower B sands. Additionally, a total of 72 cased monitor wells were installed in the area which will constitute PAA-1 at Burke Hollow. With respect to permitting, a pre-operational groundwater characterization sampling program from the drilling of the regional baseline monitor wells was completed in February 2014. A drainage study of the proposed license boundary was completed in January 2013 and encompasses the first three production areas. Archeology, socioeconomic and ecology studies for the project were all completed by December 2013. Two Class I disposal well applications were submitted and final permits were issued by the TCEQ in July 2015. The final Mine Area Permit was issued by the TCEQ in December 2016 and an Aquifer Exemption was approved by the EPA in March 2017. The final RML was issued by TCEQ in February 2019.
An earlier Technical Report dated February 27, 2013 for the Burke Hollow Project was prepared in accordance with the provisions of NI 43-101 by Thomas A. Carothers, P.G., a consulting geologist, and filed by us on SEDAR. An Updated Technical Report, dated October 6, 2014, was prepared in accordance with the provisions of NI 43-101 by Andrew W. Kurrus III, P. G., with Clyde L. Yancey, P.G., serving as the Qualified Person under NI 41-101.
Goliad Project, Goliad County, Texas
Property Description and Location
The Goliad Project is comprised of nine leases covering 995-acres located in Texas near the northeast end of the extensive South Texas Uranium Trend. The Goliad Project consists of multiple leases that would allow the mining of uranium by ISR methods while utilizing the land surface (with variable conditions), as needed, for mining wells and aboveground facilities for fluid processing and ore capture during the mining and groundwater restoration phases of the Project. The Goliad Project area is about 14 miles north of the town of Goliad and is located on the east side of US route 77A/183, a primary highway that intersects with US 59 in Goliad and IH-10 to the north. The approximate center of the Project area is 28° 52’ 7” N latitude, 97° 20’ 36” W longitude. Site drilling roads are mostly gravel based and allow reasonable weather access for trucks and cars. A location map for the Goliad Project is shown below:
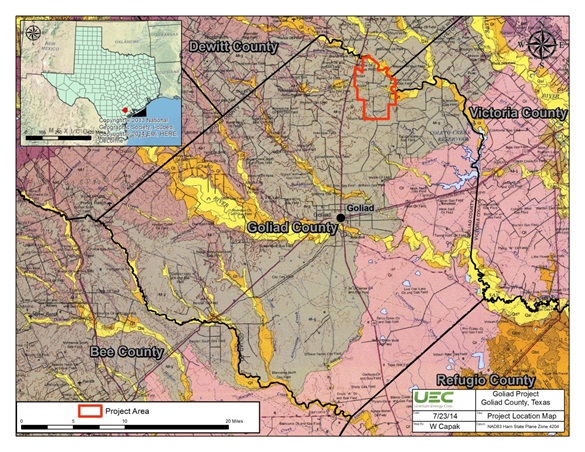
Virtually all mining in Texas is on private lands with leases negotiated with each individual landowner/mineral owner. Moore Energy Corporation (“Moore Energy”) obtained leases for exploration work in the project area in the early 1980s and completed an extensive drilling program resulting in a historic uranium mineral estimate in 1985. We obtained mining leases from individuals and by assignment from a private entity in 2006.
At July 31, 2017, we held nine leases ranging in size from 42-acres to 253-acres, for a total of 995-acres. The majority of the leases have starting dates in 2005 or 2006 with an initial term of five years and a five-year renewal option. The various lease fees and royalty conditions are negotiated with individual lessors and terms may vary from lease to lease. We have amended the majority of the leases to extend the time period for an additional five years past the five-year renewal period.
No historic uranium mining is known to have occurred on any of the Goliad Project lease properties and only state permitted uranium exploration drilling has taken place. There are believed to be no existing environmental liabilities at the property leases. Prior to any mining activity at the Goliad Project, we are required to obtain a RML, a large area Underground Injection Control Mine Permit and a PAA Permit for each wellfield developed for mining within the Mine Permit area. In addition, a waste disposal well will, if needed, require a separate UIC Mine permit. These permits will be issued by Texas regulatory agencies. The current drilling and abandonment of uranium exploration holes on any of the leases is permitted by the TRC. Potential future environmental liability as a result of the mining must be addressed by the permit holder jointly with the permit granting agency. Most permits now have bonding requirements for ensuring that the restoration of groundwater, the land surface and any ancillary facility structures or equipment is properly completed.
Accessibility, Climate, Local Resources, Infrastructure and Physiography
The Goliad Project area is situated in the interior portion of the Gulf Coastal Plain physiographic province. The area is characterized by rolling topography with parallel to sub-parallel ridges and valleys. There is about 130 feet of relief at the site with ground surface elevations ranging from a low of 150 feet to a high of 280 feet above mean sea level. The leased property for the Goliad Project is used mostly for livestock grazing pasture and woodland. The overall property area is shown as having a Post Oak Woods, Forest and Grassland Mosaic vegetation/cover type.
The site property is accessed from combined route US 77A/183 that trends north-south to the west of the property. Highway FM 1961 intersects with 77A-183 at the crossroad town of Weser. Highway FM 1961 to the east of the intersection trends along the south side of the property. Access from either of these roads into the property is via vehicular traffic on private gravel roads.
The property is in a rural setting at the north end of Goliad County. The nearest population centers are Goliad (14 miles south), Cuero (18 miles north) and Victoria (about 30 miles east). While Goliad and Cuero are relatively small towns, they provide basic needs for food and lodging and some supplies. Victoria is a much larger city and provides a well-developed infrastructure that has resulted from being a regional center to support oil and gas exploration and production. The Goliad Project site area generally has very good accessibility for light to heavy equipment. There is an excellent network of county, state and federal highways that serve the region and the moderate topography, with dominantly sandy, well-drained soils, provides good construction conditions for building gravel site roads necessary for site access.
The climate in Goliad County is mild with hot summers and cool to warm winters. The moderate temperatures and precipitation result in excellent conditions for developing an ISR mine. Periods of freezing temperatures are generally very brief and infrequent. Tropical weather from the Gulf of Mexico can occur during the hurricane season and may affect the site area with heavy rainfall. The periodic freezing weather and abnormally heavy rainfall are the primary conditions that can cause temporary shutdowns. Otherwise there is not a regular non-operating season.
The necessary rights for constructing needed surface processing facilities are in-place on selected lease agreements. Sufficient electric power is believed to be available in the area; however, new lines may be needed to bring additional service to the plant site and wellfields. We believe that within a 30-mile radius of the planned Goliad Project facility there is sufficient population to supply the necessary number of suitable mining personnel.
History
Ownership History of the Property
There has been a long history of oil and gas exploration and production in the area and oil and gas is still a primary part of the economy for the relatively lightly populated county. In the period from October 1979 to June 1980, as a part of a large oil, gas and other minerals lease holding (approximately 55,000 acres), Coastal Uranium utilized the opportunity to drill several widely spaced exploration holes in the region. There were reported to be eight holes drilled at or near the Goliad Project area.
In the early 1980s Moore Energy obtained access to review some of the Coastal Uranium wide-spaced drilling exploration data. The review resulted in Moore Energy obtaining several leases from Coastal Uranium, including several of the current Goliad Project leases. During the period from March 1983 through August 1984, Moore Energy conducted an exploration program in the Goliad Project area. No further drilling was done at the Goliad Project area until we obtained the leases through assignment from a private entity and from individual mineral owners.
Exploration and Pre-extraction Work Undertaken
This description of previous exploration and pre-extraction work undertaken at the Goliad Project is based primarily on electric logs and maps produced by Moore Energy during the period 1983 to 1984. Moore Energy completed 479 borings on various leases. Eight widespread exploration borings were completed by Coastal Uranium in 1980. We obtained leases through an assignment from a private entity in 2006 and from individual mineral owners thereafter and began confirmation drilling in May 2006.
In December 2010, the TCEQ approved the mine permit and the production area authorization for PAA-1 and granted the request for the designation of an Exempt Aquifer for us. In December 2011, a RML was issued by the TCEQ. All other state-level permits and authorizations have been received including a Class III Injection Well Permit (Mine Permit), two Class I Injection Well Permits (disposal well permits), a PAA for its first production area, a Permit by Rule (air permit exemption) and an Aquifer Exemption for which we received concurrence from the regional EPA.
A Technical Report, dated March 7, 2008 for the Goliad Project, prepared in accordance with the provisions of NI 43-101, was completed by Thomas A. Carothers, P.G., a consulting geologist, and filed by us on SEDAR.
Geological Setting
Regional Geology
The Goliad Project area is situated in the Texas Gulf Coastal Plain physiographic province that is geologically characterized by sedimentary deposits that typically dip and thicken toward the Gulf of Mexico from the northwest source areas. Additionally, the regional dip generally increases with distance in the down dip direction as the overall thickness of sediments increase. The sedimentary units are dominantly continental clastic deposits with some near shore and shallow marine facies. The uranium-bearing units are virtually all sands and sandstones in Tertiary formations ranging in age from Eocene (oldest) to Upper Miocene (youngest).
Local and Property Geology
The surface of the property is all within the outcrop area of the Goliad Formation (Figure 4-3). The mineralized units are sands and sandstone within the Goliad Formation and are designated by us as the A through D sands from younger (upper) to older (lower), respectively. The sand units are generally fine to medium grained sands with silt and varying amounts of secondary calcite. The sand units vary in color depending upon the degree of oxidation-reduction and could be from light brown-tan to greys. The sand units are generally separated from each other by silty clay or clayey silts that serve as confining units between the sand units.
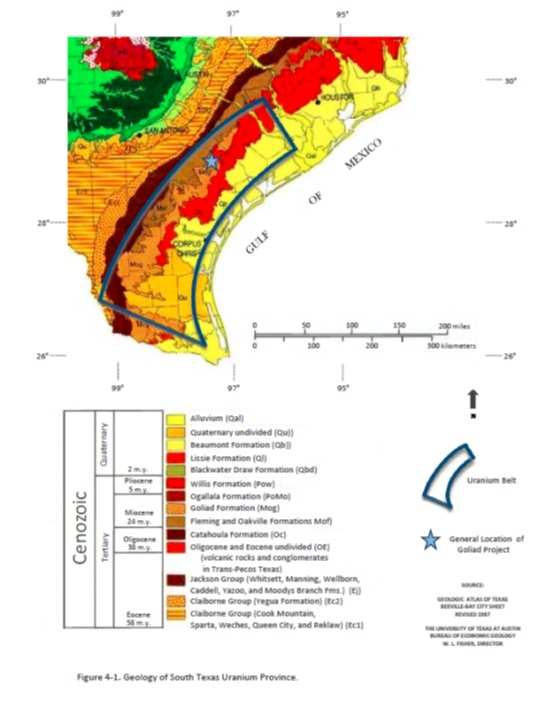
The Goliad Formation at the project site occurs from the surface to a depth of about 500 feet. Depending upon the land surface elevation, groundwater occurs in the sands of the formation below depths of about 30 to 60 feet. The four sand/sandstone zones (A-D) designated as containing uranium mineralization at the site are all considered to be a part of the Gulf Coast Aquifer on a regional basis. At the project area, however, each zone is a hydrogeologic unit with similar but variable characteristics. The A Zone is the uppermost unit and based on resistance logs groundwater in this unit may be unconfined over portions of the site. The three deeper zones are confined units with confining clays and silts above and below the water-bearing unit.
Groundwater from sands of the Goliad Formation is used for water supplies over much of the northern portion of Goliad County. Water quality in the Goliad Formation is variable and wells typically can yield small to moderate amounts of water. Data indicates an approximate average hydraulic conductivity of the water-bearing zones of the Goliad Formation in Goliad County is 100 gallons per day per square foot. Based on this value, a 20-foot sand unit would have an approximate transmissivity of 2,000 gallons per day. With sufficient available drawdown properly completed ISR wells could have average yields in the range of 25 to 50 gallons per minute.
The site area structures include two faults that intersect and offset the mineralized units. These faults are normal, with one downthrown toward the coast and one downthrown toward the northwest. The fault throws range from about 40 to 80 feet.
Project Type
The Goliad Project is characteristic of other known Goliad sand/sandstone deposits in South Texas. The mineralization occurs within fluvial sands and silts as roll-front deposits that are typically a “C” or cutoff “C” shape. The roll-fronts are generally associated with an extended oxidation-reduction boundary or front.
The other Goliad projects in the region include the Palangana Mine, the Kingsville Dome mine southeast of Kingsville, the Rosita mine west of Alice, the Mesteña Alta Mesa mine in Brooks County and the former Mt. Lucas mine at Lake Corpus Christi. These mines are all located south of the Goliad Project from about 60 to 160 miles. The average tons and uranium grade information for these mines is not known, but all these ISR projects mining Goliad Formation sand units have been very successful with the following characteristics in common: excellent leaching characteristics rate and favorable hydraulic conductivity of host sands.
At the Goliad Project there are four stacked mineralized sand horizons (A-D) that are separated vertically by zones of finer sand, silt and clay. Deposition and concentration of uranium in the Goliad Formation likely resulted due to a combination of leaching of uranium from volcanic tuff or ash deposits within the Goliad Formation or erosion of uranium-bearing materials from older Oakville deposits. The leaching process occurred near the outcrop area where recharge of oxidizing groundwater increased the solubility of uranium minerals in the interstices and coating sand grains in the sediments. Subsequent downgradient migration of the soluble uranium within the oxygenated groundwater continued until the geochemical conditions became reducing and uranium minerals were deposited in roll-front or tabular bodies due to varying stratigraphic or structural conditions.
There are at least two northeast-southwest trending faults at the Goliad property that are likely related to the formation of the Goliad Project mineralization. The northwesterly fault is a typical Gulf Coast normal fault, downthrown toward the coast, while the southeastern fault is downthrown to the northwest, forming a graben structure. Both faults are normal faults. Throw on the northwest fault is about 75 feet and the southeast fault has about 50 feet of throw. The presence of these faults is likely related to the increased mineralization at the site. The faulting has probably served as a conduit for reducing waters/gases to migrate from deeper horizons as well as altering the groundwater flow system in the uranium-bearing sands.
Mineralization
The Goliad Project uranium-bearing units occur as multiple roll-front type structures in vertically stacked sands and sandstones. Groundwater flowing from northwest to southeast in the Goliad sands likely contained low concentrations of dissolved uranium resulting from oxidizing conditions and the relatively short distance from the recharge area. The geochemical conditions in the sands near our property changed from oxidizing to reducing due to an influx of reductants. Hydrogen sulfide and/or methane dissolved in groundwater are likely sources of creating a reduction-oxidation boundary in the area with consequent precipitation and concentration of uranium mineralization.
Specific identification of the uranium minerals has not been determined at the Goliad Project. The very fine uranium minerals found coating quartz grains and within the interstices in most South Texas sand and sandstone roll-front deposits has generally been found to be dominantly uraninite. No uraninite has been identified on the Goliad Project and the presence of uraninite on other properties does not mean that such mineralization will be found on the Goliad Project. Detailed petrographic examination of disseminated uranium mineralization within sands/sandstones is generally not suitable for identification of the specific uranium minerals. Laboratory equipment such as x-ray diffraction units may be used to identify the minerals, however, the specific mineral species typically found in reduced sands are generally similar in South Texas ISR projects and leaching characteristics are also similar. Based on the experience of the ISR mines throughout south Texas, the use of gamma-ray logging with a calibrated logging probe has become the standard method to determine the thickness and estimated grade of uranium bearing minerals.
At the Goliad Project site the Goliad Formation is exposed at the surface and extends to depths exceeding 500 feet. Uranium mineralization occurs in four sand/sandstone units that are all below the saturated zone. The zones are designated A to D from the top to the bottom of the sequence. The sands are fluvial-deltaic in origin, and thicken and thin across the Project site. Each zone is hydrologically separated by 10 to 50 feet or more of clay or silty clay. The uranium deposits are tabular in nature and can range from about one foot to over 45 feet in thickness. The “C” shaped configuration is typically convex in a downdip direction with leading edge tails on the upper end. Most of the exploration and delineation holes with elevated gamma ray log anomalies are situated within a southwest-northeast trending graben and most of the gamma ray anomaly holes are situated along the northernmost of the two faults comprising the graben. This northernmost fault is downthrown to the southeast, which is typical for the majority of faults along the Texas coastal area.
Leach Amenability
Mineral processing or metallurgical testing was not reported as being conducted on any of the samples drilled or recovered during the Moore Energy exploration in the mid-1980s. We submitted selected core samples from our core hole # 30892-111C to Energy Laboratories, Inc. in Casper, Wyoming, in January 2007. These samples from the Goliad Project were sent to the laboratory for leach amenability studies intended to demonstrate that uranium mineralization at the property was capable of being leached using conventional in situ leach chemistry. The tests do not approximate other in-situ variables (permeability, porosity, and pressure) but provide an indication of a sample’s reaction rate and the potential chemical recovery.
Split sections of core were placed in laboratory containers and a lixiviate solution with 2.0 grams per liter HCO3 (NaHCO3) and either 0.50 or 0.25 g/L of H2O2 (hydrogen peroxide) was added to each test container. The containers were then rotated at 30 rpm for 16 hours. The lixiviate was then extracted from each test container and analyzed for uranium, molybdenum, sodium, sulfate, alkalinity (bicarbonate, carbonate), pH and conductance. A clean charge of lixiviate was added and the container rotated another 16 hours. Each sample rotation and lixiviate charge cycle was representative of five pore volumes with chemical analyses after each cycle. The cycle was repeated for a total of six cycles or the equivalent of 30 pore volumes.
The four core samples subjected to the leach amenability tests were determined to contain from 0.04% to 0.08% cU3O8 before testing. Leach tests conducted on the core samples from the A-Zone indicate leach efficiencies of 60% to 80% U3O8 extraction while the tails analyses indicate efficiencies of 87% to 89%. The differences between the two calculations involve the loss of solid clay-based materials during multiple filtrations. Based on post leach solids analysis, the core intervals were leachable to a very favorable 86% to 89%. After tests the tails were reanalyzed for uranium concentration to determine the recovery, which ranged on the four samples using two methods from 60% to 89%.
Laboratory amenability testing of the cores samples indicated that the uranium (dissolved elemental U) recoveries ranged from 86.4% to 88.9% in the four tests. These results show that the mineralized intervals at the Goliad Project are very amenable to ISR mining even when exposed to only one-half of the oxidant concentration normally used in the leach amenability test. Based on the ISR mining of the Catahoula and Oakville uranium deposits, as well as discussions with other Goliad deposit mining personnel, the geologically younger deposits in Texas (Goliad formation) have typically been the most amenable to in-situ leaching. The uranium recovery is generally more complete (% recovery) and occurs in a shorter time period. Both of these factors are important for ISR pre-extraction economics.
Based on the amenability test results, the size of the mineralization at the Goliad Project, the geologic setting and the current and projected future demand and price of uranium, the most feasible and cost effective mining method for the Goliad property uranium is by ISR. This method is most suitable for the size and grade of the deposits in sands that are below the water table and situated at depths that would be prohibitive for open pit or underground mining.
The amenability testing described above was conducted on core recovered from four depth intervals from one boring. While this was a limited sampling for this property, the samples are believed to be generally representative of the characteristics of the mineralized intervals and the determined recovery ranges for these intervals is considered to be reliable. Two of the four samples tested contained approximately 0.08% cU3O8 and two contained lower grades of uranium (~0.04% cU3O8). Energy Laboratories, Inc. in Casper, Wyoming, conducted the laboratory testing for this project. The laboratory has been in business since 1952, is fully certified, but not ISO certified. Certifications include the EPA, the NRC and the following U.S. states: Arizona, California, Colorado, Florida, Indiana, Nevada, Oregon, South Dakota, Texas, Utah and Washington.
Goliad Project Developments
The following are the material developments respecting the Goliad Project:
|
● |
in May 2010, the Waste Disposal Well Permit was issued by the TCEQ; |
|
● |
in April 2011, the Mine Area Permit was issued by the TCEQ; |
|
● |
in April 2011, the PAA-1 Permit was issued by the TCEQ; |
|
● |
in December 2011, the RML was issued by the TCEQ; |
|
● |
in December 2012, EPA concurrence was received for an Aquifer Exemption permit (“AE”) which was the last and final permit needed to begin uranium extraction; |
|
● |
in June 2014, the EPA reaffirmed its earlier decision to uphold the granting of our existing AE, with the exception of a northwestern portion containing less than 10% of the uranium resource which was withdrawn, but not denied, from the AE area until additional information is provided in the normal course of mine development; |
|
● |
during Fiscal 2014, 34 delineation holes totaling 9,819 feet were drilled at the Goliad Project to depths ranging from a minimum of 160 feet to a maximum of 480 feet, with an average depth of 289 feet. During Fiscal 2015, no further drilling activities were conducted. At July 31, 2015, approximately 992 confirmation-delineation holes totaling 348,434 feet have been drilled by us to confirm and expand the mineralization base at the Goliad Project; |
|
● |
construction of a three-phase electrical power system for the entire project and a large caliche site pad for the main plant complex and disposal well have been completed; and |
|
● |
processing equipment for the construction of the satellite facility and wellfield, including long-lead items such as ion exchange vessels, have been received. |
On or about March 9, 2011, the TCEQ granted our Company’s applications for a Class III Injection Well Permit, PAA and AE for the Goliad Project. On or about December 4, 2012, the EPA concurred with the TCEQ issuance of the AE permit. With the receipt of this concurrence, the final authorization required for uranium extraction, the Goliad Project achieved fully-permitted status. On or about May 24, 2011, a group of petitioners, inclusive of Goliad County, appealed the TCEQ action to the 250th District Court in Travis County, Texas. A motion filed by us to intervene in this matter was granted. The petitioners’ appeal lay dormant until on or about June 14, 2013, when the petitioners filed their initial brief in support of their position. On or about January 18, 2013, a different group of petitioners, exclusive of Goliad County, filed a petition for review with the Court of Appeals for the Fifth Circuit in the United States (the “Fifth Circuit”) to appeal the EPA’s decision. On or about March 5, 2013, a motion filed by us to intervene in this matter was granted. The parties attempted to resolve both appeals and, to facilitate discussions and to avoid further legal costs, the parties jointly agreed, through mediation which was initially conducted through the Fifth Circuit on or about August 8, 2013, to abate the proceedings in the State District Court. On or about August 21, 2013, the State District Court agreed to abate the proceedings. The EPA subsequently filed a motion to remand without vacatur with the Fifth Circuit wherein the EPA’s stated purpose was to elicit additional public input and further explain its rationale for the approval. In requesting the remand without vacatur, which would allow the AE to remain in place during the review period, the EPA denied the existence of legal error and stated that it was unaware of any additional information that would merit reversal of the AE. We and the TCEQ filed a request to the Fifth Circuit for the motion to remand without vacatur, if granted, to be limited to a 60-day review period. On December 9, 2013, by way of a procedural order from a three-judge panel of the Fifth Circuit, the Court granted the remand without vacatur and initially limited the review period to 60 days. In March of 2014, at the EPA’s request, the Fifth Circuit extended the EPA’s time period for review and additionally, during that same period, we conducted a joint groundwater survey of the site, the result of which reaffirmed our previously filed groundwater direction studies. On or about June 17, 2014, the EPA reaffirmed its earlier decision to uphold the granting of our existing AE, with the exception of a northwestern portion containing less than 10% of the uranium resource which was withdrawn, but not denied, from the AE area until additional information is provided in the normal course of mine development. On or about September 9, 2014, the petitioners filed a status report with the State District Court which included a request to remove the stay agreed to in August 2013 and to set a briefing schedule (the “Status Report”). In that Status Report, the petitioners also stated that they had decided not to pursue their appeal at the Fifth Circuit. We continue to believe that the pending appeal is without merit and we are continuing forward as planned towards uranium extraction at its fully-permitted Goliad Project.
Mineral Exploration Projects
We hold mineral rights in the U.S. States of Arizona, Colorado, New Mexico, Texas and Wyoming, in Canada and in the Republic of Paraguay by way of federal, state and provincial mining claims and private mineral leases and mineral concessions.
We plan to conduct exploration programs on these mineral exploration properties with the objective of determining the existence of economic concentrations of uranium. We have not established proven or probable reserves, as defined by the SEC under Industry Guide 7, through the completion of a “final” or “bankable” feasibility study for any of the uranium projects discussed below. Furthermore, we have no plans to establish proven or probable reserves for any of our uranium projects for which we plan on utilizing ISR mining.
Arizona
All of our Arizona claims and state leases were previously the subject of exploration drilling for the search of uranium by companies such as Union 76 Oil, Urangesellschaft, Wyoming Minerals, Noranda, Inc., Uranerz Energy Corp. (“Uranerz”), Homestake Mining Co., Occidental Minerals and Oklahoma Public Services. Claims staked directly by us have been in areas known for uranium occurrences as shown in the Arizona State publication “Occurrences of Uranium in Miscellaneous Sedimentary Formations, Diatremes and Pipes and Veins”.
Anderson Project
Property Location and Description
The Anderson Project is an 8,268-acre property located in Yavapai County, west-central Arizona, approximately 75 miles northwest of Phoenix and 43 miles northwest of Wickenburg (latitude 34°18’29” N and longitude 113°16’32” W, datum WGS84). The general area is situated along the northeast margin of the Date Creek Basin. The Anderson Project is located on the south side of the Santa Maria River approximately 13 miles west of State Highway 93. The Anderson Project occupies part or all of Sections 1 and 3, 9 through 16, 21 through 27, and 34 through 36 of Township 11 North, Range 10 West and portions of Sections 18, 19, and 30 of Township 11 North Range 9 West of the Gila and Salt River Base Meridian.
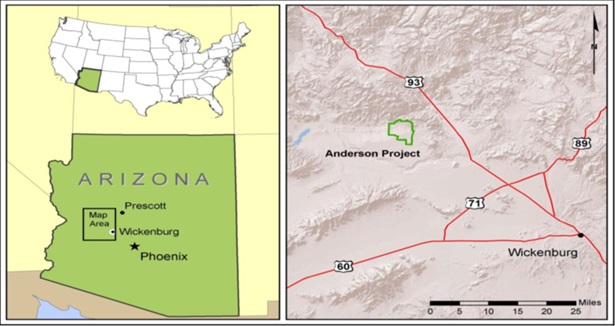
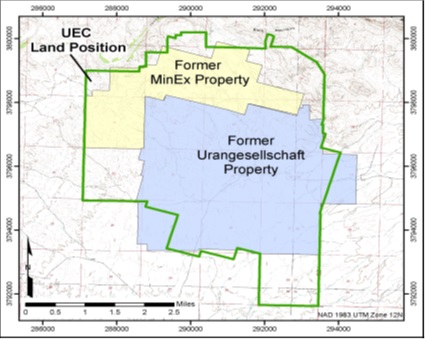
Accessibility, Climate, Local Resources, Infrastructure and Physiography
The Anderson Project is accessed by paved, all-weather gravel and dirt roads. The property is accessed via the Alamo Lake turnoff, located approximately 21 miles northwest of Wickenburg on Arizona State Highway 93 (Joshua Tree Parkway), then driving 0.25 miles north of mile marker 179, and then following the Alamo Road for 5.8 miles to the Pipeline Ranch Road turnoff. The road passes through the Pipeline Ranch, located in the bottom of Date Creek Wash and continues for approximately 6.3 miles to FR 7581. The property boundary is located 1.4 miles north on FR 7581. There are alternate dirt roads, including a 15-mile primitive road from Highway 93 over Aso Pass (2,900-foot elevation).
The Anderson Project is located in the northeast portion of the Date Creek Basin. The basin consists of low undulating terrain, centrally dissected by Date Creek Wash. The site lies along the south bank of the Santa Maria River which runs along the northern edge of the basin. Elevations above sea level are between 1,700 feet and 2,400 feet. Maximum local topographic relief at the site is approximately 700 feet.
Vegetation on the property is typical of the Sonoran Desert of central Arizona and consists predominately of Joshua trees, palo verde bushes, saguaro, cholla, ocotillo, creosote bushes and desert grasses. Fauna includes jackrabbits, rattlesnakes, roadrunners, desert tortoise, various lizards and less common mule deer, wild burros and mules.
The alluvial valley of the Santa Maria River varies substantially in width and depth to bedrock. The volume of alluvium, and particularly the depth of the material, influences the proportion of surface flow to underflow in the river valley. The groundwater in the alluvium consists of underflow that is forced toward the surface as the depth of the alluvium decreases.
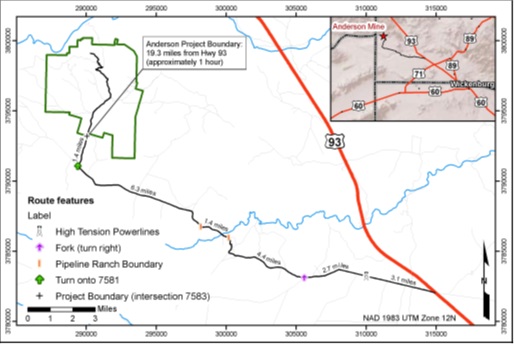
The climate is arid, with hot summers and mild winters. Annual rainfall averages 10 to 12 inches with rain showers from January through March and during summer thunderstorms. Snowfall is rare. On average temperatures range between a low of 31°F during winter months and a high of 104°F during summer months. Temperature extremes of 10°F in winter and 120°F in summer have been recorded. The climate is favorable for year-round mining operations and requires no special operational or infrastructure provisions that relate to weather.
Various water wells exist on and near the Anderson Project that can support large-scale mining operations. There is plenty of usable land space to locate processing plants, heap leach pads, tailings storage areas, waste disposal areas and other infrastructure development associated with large-scale mining. The Anderson Project includes most of a 195-acre area designated by the BLM as “disturbed” resulting from surface mining in the 1950s. It may be possible to expedite the permitting process for future metallurgical exploration and mining activities, including waste disposal within the disturbed area.
The Anderson Project area is undeveloped with the exception of various access and drill roads and various water wells previously constructed. No utilities exist on or adjacent to the area. A transmission power line runs northwest-southeast along Highway 93, approximately eight miles to the east, however, direct access to the power line may be obstructed by the Arrastra Mountain Wilderness and Tres Alamos Wilderness located between the power line and the Anderson Project. The construction of a power line would require routing along one of the existing road corridors, a distance of 16.2 miles to the project boundary.
The nearest town is Congress (population 1,700) located 32 road miles to the east. The nearest major housing, supply center and rail terminal is in Wickenburg (population 6,363) located approximately 43 miles from the Anderson Project by road. Phoenix (population 1.45 million) is approximately 100 miles to the southeast by road and is the nearest major industrial and commercial airline terminal. Kingman (population 24,000) is located approximately 110 miles to the northwest by road. Our surface rights encompass 15.4 square miles which is sufficient for the surface structures associated with any proposed mining operation.
History
In January 1955, T.R. Anderson of Sacramento, California, detected anomalous radioactivity in the vicinity of the Anderson Project using an airborne scintillometer. After a ground check revealed uranium oxide in outcrop, numerous claims were staked. The “Anderson Mine”, as the operation was known at the time, was drilled and mined by Mr. Anderson. Work between 1955 and 1959 resulted in 10,758 tons that averaged 0.15% U3O8 and 33,230 pounds U3O8 were shipped to Tuba City, Arizona, for custom milling. In 1959, production stopped when the Atomic Energy Commission ended the purchasing program.
During 1967 and 1968, Getty Oil Company (“Getty”) secured an option on claims in the northern portion of the Anderson Project. Some drilling and downhole gamma logging was conducted during the option period, but this failed to locate a sizeable uranium deposit. In 1968, Getty dropped their option.
In 1974 the increasing price of uranium created a renewed interest in the vicinity of the Anderson Project. Following a field check and an evaluation of the 1968 Getty drill data, MinEx optioned the northern portion of the current Anderson Project.
In 1975 MinEx purchased the northern portion of the current Anderson Project after a 53-hole, 5,800 m (19,000 feet) drilling program on 250 m centers confirmed a much greater uranium resource potential than had been interpreted from the 1968 Getty gamma log data. Further exploration work, consisting of a 180-hole, 22,555 m (74,000 feet) drill and core program on 120 m centers was conducted from November 1975 through February 1976 to further delineate the uranium resources. By 1980 MinEx had completed a total of 1,054 holes by rotary and core drilling.
In 1977 the Palmerita Ranch, located 11 km west of the deposit along the Santa Maria River, was acquired by MinEx to provide a water source for the operations in the event that closer sources proved inadequate. Based on favorable economics, indicated in a preliminary feasibility study completed by Morrison-Knudsen Company, Inc. in December 1977, a detailed final feasibility study was undertaken early in 1978 to evaluate the MinEx holdings on the northern portion of the current Anderson Project.
In 1973 Urangesellschaft expressed an interest in the former Anderson property. Urangesellschaft located a claim block, the “Date Creek Project”, on the down-dip extension of the mineralization immediately to the south of MinEx’s claims. In 1973 to 1982 subsequent drilling programs delineated mineralization from a total of 352 drill holes with 122,744 m (402,773 feet) of rotary and core drilling. The following table summarizes the phases of the historical exploration.
Exploration History at the Anderson Property (Arsenau, 2011)
|
Company |
Period |
Exploration Activities |
|
Mining Group Led by Mr. T. R. Anderson |
1955−1959 |
Aerial scintillometer surveying, ground prospecting, and outcrop mining |
|
Getty Oil Company |
1967−1968 |
Limited exploration drilling |
|
Urangesellschaft USA, Inc. |
1973−1982 |
Exploration drilling: 352 total holes with 319 rotary holes and 33 core holes over a 610-ha area |
|
MinEx |
1974−1980 |
Exploration drilling: 970 rotary holes and 84 core holes over a 425-ha area |
|
Concentric Energy Corp. |
2006 |
Confirmation drilling: 24 RC holes and one RC core hole |
Geologic Setting
Regional Geology
The Anderson Project is located along the northeast margin of the Date Creek Basin of the Basin and Range Province of the western United States. The Date Creek Basin is one of hundreds of Paleogene basins throughout western Arizona, southeastern California, Nevada and western Utah. Paleogene lacustrine and fluvial sediments and Quaternary gravels have filled these basins to depths of several thousand meters. The approximate location of the Basin boundaries is shown in the figure below.
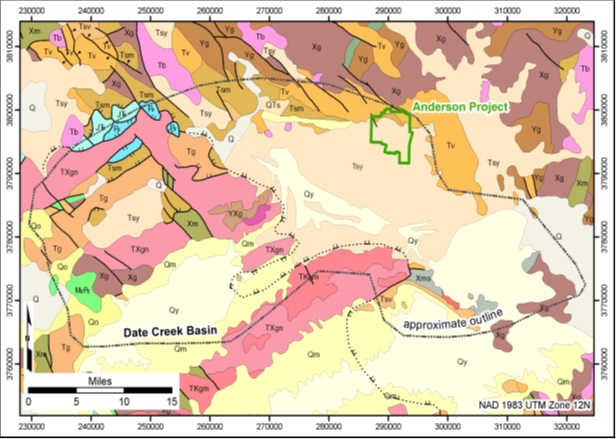
The Basin is surrounded by dissected mountain ranges containing Precambrian metamorphic rocks and granites. Surrounding mountain ranges include the Black Mountains to the north and northeast and the Rawhide, Buckskin and McCracken Mountains to the west. To the south and southeast the Basin is bordered by a low drainage divide imposed by the Harcuvar and the Black Mountains. Margins of the Basin are filled with early Paleogene volcanic flows and volcaniclastic sediments. The Basin itself is filled with Oligocene to Miocene lacustrine and deltaic sediments covered by a thick mantle of Quaternary valley fill.
Local and Property Geology
Three major faults cross the Anderson Project: the East Boundary Fault System; Fault 1878; and the West Boundary Fault System. Faults trend predominantly N30ºW to N55ºW and dip steeply (approximately 80º) to the southwest. Another set of faults trending more westerly (N65ºW) are present in the south-central portion of the Anderson Project. A fault set trending northeast-southwest has been speculated by Urangesellschaft and others, but has not been observed in the field. Many of the northwesterly surface water drainage tributaries are developed partially along fault traces.
Minor faults and shear zones occur throughout the Anderson Project. These probably represent fractures with slight offset of strata during differential compaction of the underlying sediments or local adjustment to major faulting.
The largest fold in the area is a broad, gentle, northwest-trending syncline in the southeastern quarter of Section 9, T11N, R10W. Dips reach a maximum of 13º except where modified by shearing. Many smaller folds with amplitudes of several feet are present in the lacustrine strata.
Fault displacements range from a few centimetres to more than 100 m. Fault movement is generally of normal displacement resulting in stair-stepped fault blocks. Local faults also have a tendency to hinge. Minor faulting across the mineralized area is often difficult to discern from variations in sedimentary dips. The lacustrine sediments dip south to southwesterly from 2º to 5º, to a maximum of 15º. Much of this dip is attributed to recurrent faulting during deposition.
Nine stratigraphic units were identified on the Anderson Project, listed from oldest to youngest, as follows:
|
● |
Crystalline Intrusive Rocks: coarse-grained to pegmatitic Precambrian granite; |
|
● |
Felsic to Intermediate Volcanic: flows, breccias, tuffs and minor intrusive; |
|
● |
Felsic to Intermediate Volcaniclastic: ash flows, tuffaceous beds and arkosic sandstone; |
|
● |
Andesitic Volcanic: porphyritic andesitic flows with a paleosurface and locally reddish-brown paleosols; |
|
● |
Lacustrine Sedimentary rocks: micaceous siltstones and mudstone, calcareous siltstones and silty limestone, thin beds of carbonaceous siltstone and lignitic material and host of uranium mineralization, averaging about 60 m to 100 m thick; |
|
● |
Lower Sandstone Conglomerate: arkosic sandstones and conglomerate, averaging about 60 m to 100 m thick; |
|
● |
Basaltic Flows and Dikes: amygdular basalt, averaging about 20 m thick; |
|
● |
Upper Conglomerate: cobble and boulder conglomerate, partly indurate and locally calcite cemented, averaging about 0 m to 60 m thick; and |
|
● |
Quaternary Alluvium: unconsolidated sand and gravel, caliche formed where calcite-cemented. |
Uranium mineralization at the Anderson Project occurs exclusively in the sequence of Miocene-age lacustrine lakebed sediments. The lacustrine sediments unconformably overlie the andesitic volcanic unit over most of the Anderson Project. However, to the east of the Anderson Project they overlie the felsic to intermediate volcanic unit.
Evidence suggests that deposition of the lacustrine sediments occurred in a restricted basin less than five km wide by 10 km to 12 km long on the northern edge of an old Paleogene lake. Moving southward, these sediments inter-tongue with siltstones and sandstones. The lakebed sediments represent time-transgressive facies deposited within a narrow, probably shallow, basinal feature. This type of depositional environment exhibits complex relationships between individual facies, lensing out, vertical and horizontal gradation, and interfingering.
The lake sediments include green siltstones and mudstones, white calcareous siltstones, and silty limestone or calcareous tuffaceous material. Much of this material is silicified to varying extents and was derived in part from volcanic ashes and tuffs common throughout the lakebeds. Also present in the lacustrine sequence are zones of carbonaceous siltstone and lignitic material. Along the boundary between the former MinEx and Urangesellschaft properties, drill holes encounter the basal arkosic sandstone. To the south and southwest, lakebeds interfinger with and eventually are replaced by a thick, medium to coarse-grained, arkosic sandstone unit.
Mineralization
Uranium mineralization in outcrops and the pit floor at the old Anderson mine was reported by the US Bureau of Mines in Salt Lake City as tyuyamunite (Ca(UO2)2(VO4)2•5-8H2O). Carnotite (K(UO2)2(VO4)2•3H2O), and a rarer silicate mineral, weeksite (K2(UO2)2(Si2O5)3•4H2O), were also reported in outcrop samples. Carnotite mineralization occurs as fine coatings and coarse fibrous fillings along fractures and bedding planes and has been noted in shallow drill holes and surface exposures.
The uranium mineralization found at depth on the former Urangesellschaft property was reported by Hazen Research, Inc. (“Hazen Research”) to be poorly crystallized, very fine-grained, amorphous uranium with silica. This could be in the form of either coffinite (U(SiO4)1-x(OH)4x) or uraninite (UO2) in a primary or unoxidized state (Hertzke, 1997). Mineralogical studies performed by Hazen Research (1978a, 1978b, 1978c and 1979) on Urangesellschaft core found that mineralization was associated, for the most part, with organic-rich fractions of the samples. Specifically, the uraniferous material occurs as stringers, irregular masses and disseminations in carbonaceous veinlets with uranium up to 54% as measured by microprobe analysis. X-ray diffraction identified the mineral as coffinite. It is possible that an amorphous, ill-defined uranium silicate with a variable U:Si ratio is precipitated and, under favorable conditions, develops into an identifiable crystalline form (coffinite).
Of special note is the detection of high-grade, low-reflecting uraniferous material occurring with carbonaceous material in the siltstone. Similar assemblages in unoxidized mineralization have also been reported for the former MinEx property.
Urangesellschaft distinguished seven mineralized zones, identified as Horizons A, B, C, D, E, F and G, with the youngest (uppermost) being Horizon A and the oldest (deepest) being Horizon G. The majority of uranium occurs in Horizons A, B and C within the property. A conglomeratic sandstone unit interbeds with these units, but does not contain uranium mineralization; it is referred to as the Barren Sandstone Unit and it lies between Horizon C and Horizon D. Consequently, Horizons A through C have been called the Upper Lakebed Sequence and Horizons D through G have been called the Lower Lakebed Sequence.
Grades of mineralization range from 0.025% U3O8 to normal highs of 0.3% to 0.5% U3O8 with intercepts on occasion of 1.0% to 2.0% U3O8. Secondary enrichment of the syngenetic mineralization is observed along faults and at outcrops.
Exploration
A Light Detection and Ranging (“LiDAR”) survey was performed over the entire project area by Cooper Aerial Surveys Co. (“Cooper Aerial”) on July 9, 2011, between 13:07 UTC and 15:14 UTC (6:07 A.M. and 8:14 A.M., MST). Aerial imagery was collected at the same time. Data was processed using one of two base stations to obtain positional accuracies of between three cm and 10 cm. 24 ground control points showed a root mean square error of 6.7 cm between predicted and measured elevations. Cooper Aerial provided us with a one-meter pixel digital elevation model (DEM) and a 0.61 m contour shape-file derived from the LiDAR data. Cooper Aerial also corrected the ortho imagery with a 0.15 m pixel size. Coordinates were converted from WGS84 to NAD 1983 UTM Zone 12N in meters, and elevation was reported in NAVD 1988 international feet. The conversion caused no distortion in elevations used in the resource model.
We have not performed any drilling to date on the Anderson Project.
A Technical Report, dated June 19, 2012, for the Anderson Project, prepared in accordance with NI 43-101, was completed by Bruce Davis and Robert Simm, consulting geologists, and filed by us on SEDAR.
A PEA, dated July 6, 2014 for the Anderson Project, prepared in accordance with NI 43-101, was completed by Douglas Beahm, PE, PG, and Terence McNulty, PE, and filed by us on SEDAR.
Workman Creek Project
The Workman Creek Project is a 4,036-acre property located in Gila County, Arizona.
The Workman Creek Project consists of seven claim blocks, totaling 198 unpatented mining claims located within Gila County, in the central portion of the State of Arizona. We entered into a property acquisition agreement with Cooper Minerals Inc. on November 7, 2011 for the mineral claims which constitute the Workman Creek Project.
The Workman Creek Project is located in the Sierra Ancha region, approximately 50 kilometres north of Globe, within Gila County, Arizona. Some of the claim blocks can be accessed easily via highway 288, while other claim blocks are only accessible with the use of all-terrain-vehicles. The Sierra Ancha region is host to 18 historic uranium mines which were in operation between 1953 and 1960. During that period, over 122,000 pounds of U3O8 concentrate was produced with an average grade of 0.20% U3O8.
The Workman Creek Project and surrounding area of the Sierra Ancha region are underlain by igneous and sedimentary rocks of Precambrian age. The sedimentary rocks are nearly flat-lying except for minor undulations near regional-scale monoclines. The Dripping Spring Quartzite is the host rock for uranium mineralization throughout the Sierra Ancha region. Uranium mineralization in the Dripping Spring Quartzite consists of low-grade disseminations and concentrations in fine-grained strata and along bedding planes, and higher-grade layers and veinlets.
Wyoming Minerals Corporation developed the most prominent pre-1960 uranium mines into what they referred to as the “Dripping Springs Project”. In 1980, Wyoming Minerals Corporation contracted Dravo Engineers and Constructors to conduct a feasibility study of the Workman Creek deposits. This study of the “Dripping Springs Project” is within the Workman Creek Project. Shortly after the feasibility study was finished, the uranium market saw a prolonged depression.
A Technical Report, dated July 7, 2012 for the Workman Creek Project, prepared in accordance with NI 43-101, was completed by Neil G. McCallum, P.G., and Gary H. Giroux, P.E., a consulting geologist and engineer, respectively, and filed by us on SEDAR.
The following table provides information relating to our mineral rights located in Arizona:
|
Property |
Number of Claims |
Gross Acres |
|
Los Cuatros |
1 lease |
640 |
| Anderson | 386 claims & 1 lease | 8,268 |
| Workman Creek | 198 claims | 4,036 |
Colorado
Claims and leases acquired by us in Colorado have historical production tonnages and grades published in the Colorado Geological Survey, Bulletin 40 “Radioactive Mineral Occurrences of Colorado”. Also, our geological staff has evaluated a portion of the claims currently owned by us.
Slick Rock Project
Pursuant to a Uranium Mining Lease dated May 23, 2012, we acquired from UR-Energy LLC a mining lease for uranium on our Slick Rock Project located in San Miguel and Montrose Counties, Colorado.
Since January 2011 we staked a total of 129 claims in the Slick Rock district of the Uravan Mineral Belt. In June 2011 we acquired 103 claims from Spider Rock Mining also in the Slick Rock District for a one-time payment of $500,000. As a result, we now hold a total of 315 contiguous claims in the Slick Rock District. Certain claims of the Slick Rock Project are subject to a 1.0% or 3.0% net smelter royalty, the latter requiring an annual advance royalty payment of $30,000 which began in November 2017.
The Slick Rock Project is located in San Miguel County, Colorado approximately 24 miles north of the town of Dove Creek. The Slick Rock Project occupies all or parts of sections 15, 16, 19, 20, 21, 22, 23, 24, 25, 26, 27, 28, 29, 30, 32, 33 and 34 in T44N R18W, NM Principal Meridian, and parts of sections 3, 4 and 5 of T43N R18W, NM Principal Meridian. The Slick Rock Project consists of 315 contiguous mineral lode claims and covers approximately 5,230 acres (8.2 square miles). The Slick Rock Project is bordered to the west by the Department of Energy's (“DOE”) Uranium lease tracts C-SR-13 and C-SR-13A, to the southwest by DOE Uranium lease tract C-SR-14(1), and to the north and northeast by the Sunday / Carnation / Topaz / Saint Jude mine complex, formerly owned by Energy Fuels.
The Slick Rock Project produced uranium and vanadium from 1957 to 1983 via the Burro Mines. The historic production totals of the Burro Mine are as follows:
|
Production Years |
U3O8 Produced (in Pounds) |
V2O5 Produced (in Pounds) |
|
1957 to 1971 |
1,992,898 |
12,149,659 |
|
1971 to 1983 |
243,825 |
1,791,798 |
|
Total |
2,236,723 |
13,941,457 |
All uranium/vanadium production came from the Upper Rim Sand of the Salt Wash Member of the Jurassic Morrison Formation.
Within the Slick Rock Project area, the Salt Wash Member is approximately 275 to 400 feet thick. The Fluvial sediments of the Salt Wash were deposited by north to northeast flowing paleostreams. In the project area, these streams were deflected eastward by the paleotopographic high caused by the northwest/southeast trending Gypsum Valley anticline. This allowed for thick accumulations of Salt Wash sediments along the southwestern flank of the anticline and across the project area. The Salt Wash is composed of white to grey, light-buff and rusty-red, fine to medium-grained, cross-bedded, lenticular sandstone interbedded with red, green, or light-gray shale and mudstone. The Salt Wash contains three major sandstone ledges, ranging from 20 to 150 feet in thickness and separated by clay and shale layers. The uppermost thick, continuous sandstone lens is commonly the most highly mineralized of the sequence. The largest Salt Wash uranium deposits are near the edges of thick sandstone where a transition to sandy mudstone takes place, and in the scours or on the flanks of paleostream channels. Mineralized pods average in the range of 3000 tons to as much as 100,000 tons taken from a single cluster of deposits. Locally, deposits attain a thickness of 30 feet, but two to nine foot thicknesses are most common. Minerals are carnotite, tyuamunite, and brightly colored vanadates, vanadium hydromica or clay. Unoxidized mineralization is commonly black, consisting or uraninite, coffinite, montroseite and vanadium hydromica or clay.
A Technical Report, dated February 21, 2013, for the Slick Rock Project, prepared in accordance with NI 43-101, was completed by Bruce Davis and Robert Simm, consulting geologists, and filed by us on SEDAR.
A PEA dated April 8, 2014 for the Slick Rock Project, prepared in accordance with NI 43-101, was completed by Douglas Beahm, PE, PG, and filed by us on SEDAR.
The following table provides information relating to our mineral rights located in Colorado:
|
Property |
Number of Claims |
Gross Acres |
|
Slick Rock |
315 claims |
5,333 |
|
Long Park |
20 claims |
400 |
New Mexico
In December 2014, we staked 51 claims over the historic Dalton Pass project in the Crownpoint uranium district. Historic drilling at Dalton Pass by Pathfinder Mines indicates that the uranium mineralization occurs as both primary tabular and roll-front deposits. Mineralization is hosted by the upper Westwater Canyon Member of the Morrison Formation, a sequence of stacked sands separated by discontinuous shale breaks, at depths ranging from 1,900 feet to 2,100 feet.
The following table provides information relating to our mineral rights located in New Mexico:
|
Property |
Number of Claims |
Gross Acres |
|
West Ambrosia Lake |
6 mineral deeds |
3,844 |
| C de Baca | 30 claims | 600 |
| Dalton Pass | 51 claims | 1,020 |
Texas
At July 31, 2020, we currently own various exploration projects located in the South Texas Uranium Belt. The location and acquisition of these leases are based on historical information contained within our extensive database, as well as current, ongoing geologic analyses by our exploration staff.
Salvo Project
Our Salvo Project is a 1,340-acre property located in Bee County, Texas.
A Phase I exploration drill program was completed in April 2011 with a total of 105 holes drilled. Phase II drilling began at the Salvo Project in October 2011 with two drilling rigs targeting Lower Goliad P and Q sand objectives. A total of 122 exploration and delineation holes for a total of 70,760 feet were drilled during Phase II which was concluded in May 2012. 29 holes (23%) met or exceeded a grade-thickness (“GT”) cutoff of 0.3 GT.
Interpretation of our exploration and delineation drilling, along with historic data from 1982 to 1984 exploration drilling by Mobil and URI, revealed the existence of two ore-bearing redox boundaries within the area, which has the potential to become PAA-1. A significant under-explored extension to this area which exhibits strong mineralization remains open-ended. Future plans would include further exploration/delineation drilling in this area in order to fully identify the extent of the mineralized zones in proposed PAA-1. Historic and recent Company drilling results are being reviewed for future exploration/delineation activities in the Salvo Project in order to fully identify the extent of the mineralized zones.
A Technical Report, dated July 16, 2010, for the Salvo Project, prepared in accordance with NI 43-101, was completed by Thomas A. Carothers, P.G., a consulting geologist, and filed by us on SEDAR. A further Technical Report, dated March 31, 2011, for the Salvo Project, prepared in accordance with NI 43-101, was completed by Thomas A. Carothers, P.G., a consulting geologist, and also filed by us on SEDAR.
Longhorn Project
Our Longhorn Project is located in Live Oak County, Texas, which historically has produced uranium by both open pit and ISR methods. The property lies within the historic US Steel Clay West production area where uranium was previously mined utilizing ISR methods along the historic George West district trend. We have an extensive database of information regarding the area including drill maps and over 500 gamma logs. The project lies on trend between two former U.S. Steel production areas, the Boots/Brown and the Pawlik. At least five separate roll-fronts are believed to exist across the project area. Uranium grades within these Oakville deposits ranged from 0.10% to in excess of 0.20% U3O8 according to U.S. Steel reports and historic well logs obtained by us. Well-developed Oakville sands in this area exhibit higher than average uranium grades for South Texas, as shown on many historic gamma ray logs, of which we have at least 500+ pertaining to the project from various databases. These higher than average reported uranium grades were later proven by excellent recoveries in the U.S. Steel ISR production areas.
The property is located approximately 65 miles northwest of Corpus Christi and 55 miles southwest of Hobson. It is comprised of 39 lease agreements covering 651 acres, granting us the exclusive right to explore, develop and mine for uranium. We anticipate that any uranium identified at the Longhorn Project will be extracted using ISR mining and processed at Hobson.
The following table provides information relating to our main mineral rights located in the South Texas Uranium Belt, excluding our Palangana Mine and Goliad and Burke Hollow Projects:
|
Property |
Number of Claims or Leases Held |
Gross Acres |
|
Salvo |
2 leases |
1,340 |
|
Longhorn |
39 leases |
651 |
Wyoming
We acquired the Reno Creek Project on August 9, 2017 and the North Reno Creek Project on May 1, 2018.
Reno Creek Project
Our Reno Creek project is located in the Powder River Basin of northeast Wyoming, one of the most prolific uranium producing regions in the U.S. and the home of five producing ISR operations: Cameco’s Smith Ranch/Highland; Cameco’s North Butte satellite; Uranium One’s Willow Creek; Energy Fuels, Inc.’s (“EFR”) Nichols Ranch; and Strata’s Lance project. The project is 13 miles from the nearest town, Wright, Wyoming, with a population of 1,800.
The project consists of 18,763 gross acres of properties including a 40-acre, Company-owned central processing plant (the “CPP”) site, and five major resource units, all within ten miles of the proposed CPP.
Uranium was originally discovered within the project area by several 1960s/1970s mining companies, including Rocky Mountain Energy, Cleveland Cliffs, American Nuclear and TVA, Pathfinder Mines and others. Most of the leases and claims that held the resources were dropped in the late 1990s and early 2000s. In the mid-2000s Strathmore re-staked mining claims and took leases on most of the current project. Strathmore in 2010 sold them to AUC LLC (“AUC”), which was acquired by us in 2017 and is our wholly-owned subsidiary and the operator of the project.
Uranium deposits at the Reno Creek Project lie within a geologically favorable fairway characterized by porous and permeable fluvial sandstones of the Eocene Wasatch Formation. The sandstone aquifers are overlain and underlain by barren sequences of shales and occasional thin coals. A complex series of stacked roll-fronts occur along oxidation/reduction boundaries forming prospective trends that extend for over 40 miles through the greater project area. The deposits occur at shallow depths between 200 to 400 feet in a sparsely populated area with gentle terrain, providing excellent logistics and access.
While much of the trend has been very well explored by AUC and past operators, we believe that excellent upside for further discoveries exists. Company databases include more than 10,000 uranium drill holes and over a 1,000 Coal Bed Methane logs to guide future exploration.
Geologists have mapped 10 to 20 miles of roll-fronts on the holdings that are undrilled or under-drilled, providing numerous high-quality exploration targets to expand current resources. During 2012 and 2013, AUC drilled 800 holes along one such trend, adding approximately two million pounds to the resource base.
AUC conducted permitting and licensing activities and received final permits from the Wyoming Department of Environmental Quality (“WDEQ”) and the EPA in 2015 and from the NRC in 2017. The WDEQ issued its Permit to Mine in July 2015, and also referred its recommended approval of the AE to EPA, which approved it in October 2015. In 2016, WDEQ’s Air Quality Division approved the Air Quality Permit and re-issued the Air Quality Permit in October 2019.
The NRC issued its Draft Environmental Impact Statement in July 2016, and the final in December of 2016. In its release the NRC noted that that “only small environmental impacts would result from the construction, operation, aquifer restoration and decommissioning of the proposed in-situ recovery facility. Small impacts are defined as those that would be undetectable or so minor that they would not noticeably alter any important attribute of the environmental resource in question”. The NRC then issued the License for the project in February 2017 covering 6,057 acres and approximately 13.74 million pounds of U3O8. Subsequently, the NRC approved of the transfer of control to us on July 31, 2017. Additionally, the State of Wyoming became an NRC Agreement state in September 2018 and, therefore, the Reno Creek Project is now permitted and licensed by the WDEQ.
The permits and license provide for a full central processing plant on 40 acres owned by us, which lies approximately a quarter mile from two all-weather highways and high voltage power lines, and less than three miles from natural gas lines. The project is licensed to produce up to two million pounds of U3O8 per year, and may also treat by tolling either lixiviant or resin produced by others, or alternate feed material. Included in the current license are the two largest resource units, North Reno Creek and Southwest Reno Creek. The outlying resource units will be added for extraction by amending the current License.
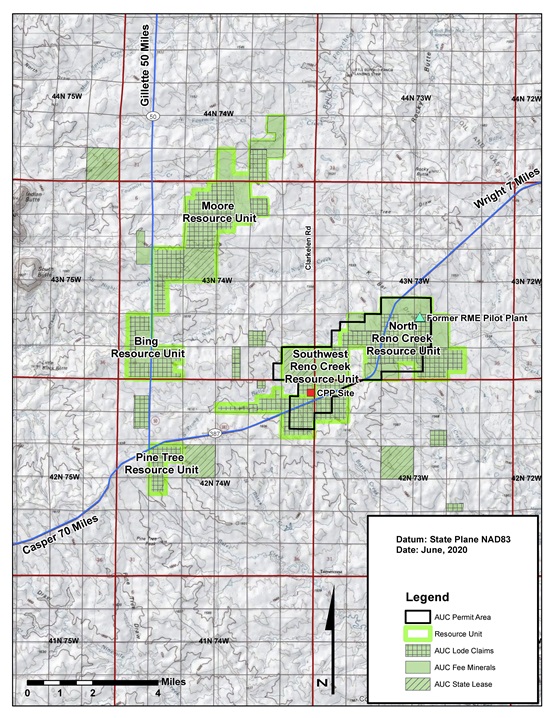
The North Reno Creek Project is situated within and adjacent to our existing permit boundary at the Reno Creek Project, in the Powder River Basin, Campbell County, Wyoming, approximately 80 miles northeast of Casper, Wyoming. We are currently working on a significant revision to the Permit to Mine to incorporate the North Reno Creek Project into the Permit. This permitting action will allow us to mine the resources acquired as part of the transaction.
Substantial historical exploration, development and project permitting have been performed on the North Reno Creek property. Beginning in the late 1960s and continuing into the mid-1980s, Rocky Mountain Energy (“RME”), a wholly owned subsidiary of the Union Pacific Railroad, drilled more than 800 exploration drill holes on the North Reno Creek property. In the late 1970s and early 1980s RME successfully operated and restored and reclaimed a uranium ISR pilot plant. Subsequently, RME nearly completed permitting and licensing for a commercial scale ISR facility.
In 1992 the project approximately covering the area of our current Reno Creek and North Reno Creek Project was acquired by EFR from RME. Over the next decade EFR and its successor, International Uranium Corporation (now Denison Mines), continued to advance the project toward full permitting and licensing. Subsequently, Rio Algom and Power Resources held the project until dropping all of their interests in 2003. Between 2006 and 2008 Uranerz acquired mineral and surface land interests covering approximately 1,280 acres of fee mineral leases and federal mining claims comprising the North Reno Creek Project. In June 2015, EFR acquired Uranerz, whose development assets included the North Reno Creek Project.
Geologic characteristics of the North Reno Creek Project are similar to the permitted Reno Creek resource areas since the sandstone units are adjacent and contiguous. The uranium deposits within each of these areas occur in medium to coarse-grained sand facies in the lower portion of the Eocene-age Wasatch Formation. The uranium mineralization occurs as interstitial fillings between and coatings on the sand grains along roll-front trends formed within the host sandstone aquifers.
We engaged Behre Dolbear & Company (USA), Inc. (“Behre Dolbear”) to review and provide a revised Technical Report at the Reno Creek Project integrating the resources present within the North Reno Creek Project acquired on May 1, 2018. A Technical Report, dated December 31, 2018, for the Reno Creek Project, prepared in accordance with NI 43-101, was completed by Behre Dolbear and filed by us on SEDAR.
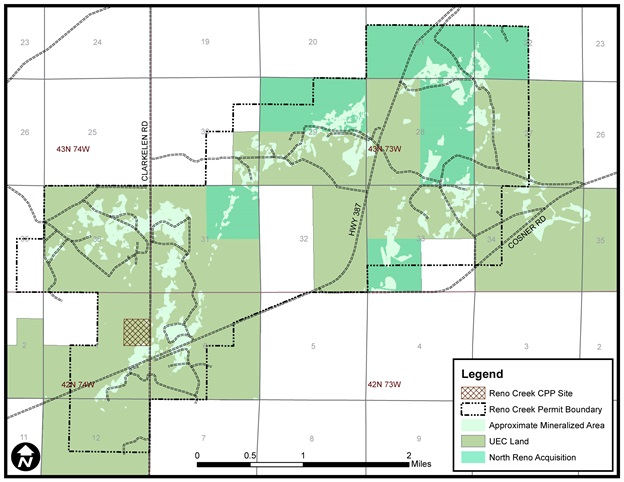
Canada
Diabase Project
Our Diabase Project is at the exploration stage, with exploration focused on testing the Cable Bay fault corridor, interpreted to represent a suture zone between the Archean Mudjatik and Talston domains within the Trans-Hudson orogeny. Historical work started in the late 1970s, with the first major programs completed by the Saskatchewan Mineral Development Corporation in 1979 and the last major program completed by Nuinsco Resources Inc. (“Nuinsco”) in 2011. There is a total of 67 exploration diamond drill holes on the property. Anomalous uranium values have been intersected on the property, primarily associated with an area intruded by a late diabase dyke, highlighted by drill holes ND0801 (707 ppm Upartial over 0.25 m) and ND0807 (426 ppm Upartial over 0.40 m).
The Diabase Project is located on the southern rim of the Athabasca Basin uranium province in Saskatchewan, Canada, approximately 75 km to the west of Cameco’s Key Lake uranium mill. The project is comprised of 10 mineral claims covering 54,236 acres. Subject to section 19 of The Crown Minerals Act of Saskatchewan, a claim grants to the holder the exclusive right to explore for any Crown minerals that are subject to these regulations within the claim lands. If an economic deposit is discovered, the ore would be extracted by underground methods and would likely be shipped to the Key Lake mill for custom milling.
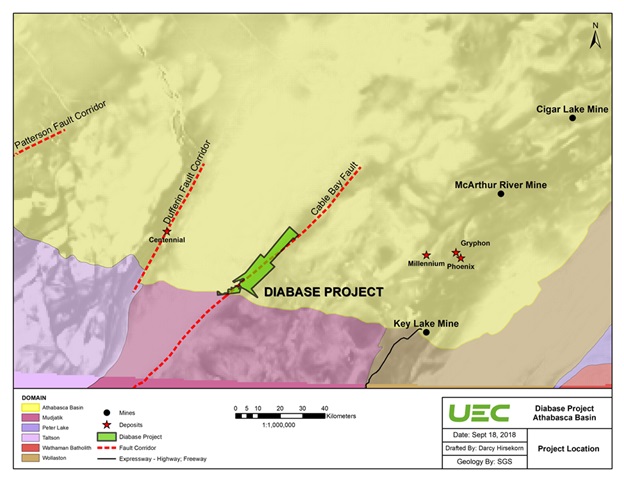
Paraguay
We hold interests in two uranium projects located in the Republic of Paraguay. The following map shows the location of both projects, Oviedo and Yuty.
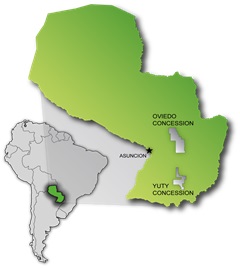
Oviedo Project
Property Description and Location
Our Oviedo Project is located in southern Paraguay, approximately 95 miles east of Asuncion, the capital of Paraguay. The Oviedo Project consists of a large exploration mining permit covering a total area of 223,749 acres. The property can be classified as an early to intermediate stage exploration project. Several areas have undergone drilling in the past by The Anschutz Company (“Anschutz”) of Denver, Colorado (early 1980s), and recently by Crescent Resources (“Crescent”) in 2007. Access to the project is by paved roads from Asuncion to the City of Coronel Oviedo and other populated areas. There is good access into the interior of the concession mainly by unpaved secondary roads. The terrain is rolling hills with areas of forest, small farms, and some large cattle ranches.
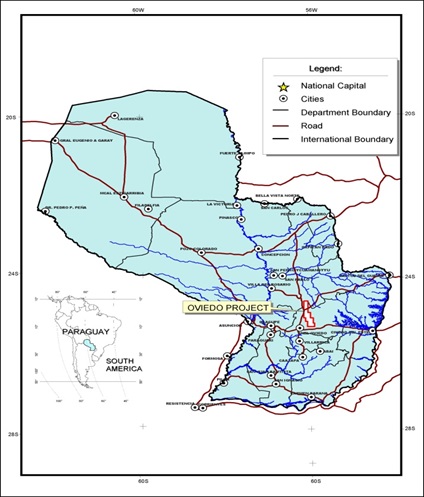
Prior Exploration
The Oviedo Project located in central Paraguay was subject to reconnaissance uranium exploration between 1976 and 1983 by Anschutz and by Crescent between 2006 and 2008. Most of the uranium occurrences in this environment are “roll-front” type deposits similar to those currently being produced by low-cost ISR methods in Texas, the western United States, Central Asia and Australia. The work by Anschutz and Crescent was centered on a large belt of Permo-Carboniferous age continental sandstones that represent the western flank of the Paraná Basin. According to the Geological Survey of Brazil or CPRM, these same sandstones within the Brazilian section of the Paraná Basin contain numerous uranium occurrences including the Figueira Mine.
From 2006 to 2008 the Oviedo Project was optioned to Crescent Resources. During this period a total of 24 holes were drilled and logged in the southern portion, offsetting mineralized holes drilled by Anschutz.
A Technical Report, dated October 15, 2012, for the Oviedo Project, prepared in accordance with NI 43-101, was completed by Douglas L. Beahm, P.E., P.G, a consulting geologist/engineer, and filed by us on SEDAR, and the Technical Report reported that 14 of the 24 holes had a GT product (in feet) equal to or greater than 0.30 GT. GT values equal to and above 0.30 are typically considered producible under ISR production methodology. The known uranium mineralization on the Oviedo Project intersected by the past drilling is at depths between 450 and 750 feet. Crescent Resources dropped the option on the Oviedo Project in 2008.
Aquifer Test
During 2010, and prior to the acquisition of the Oviedo Project, we conducted a 24-hour aquifer test in the area of the resource trend identified by the combined Anschutz-Crescent drilling programs. The test was designed to assess aquifer properties of the lower massive sand, a uranium-bearing sandstone within the San Miguel Formation. The focus of the test was to determine if the aquifer could sustain extraction rates typical of ISR mining of uranium. Results of the test indicate that the uranium-bearing unit has aquifer characteristics that would support operational rates for ISR mining. The aquifer properties determined from the hydrologic test fall within the range of values determined at other uranium ISR projects located in Wyoming, Texas and Nebraska.
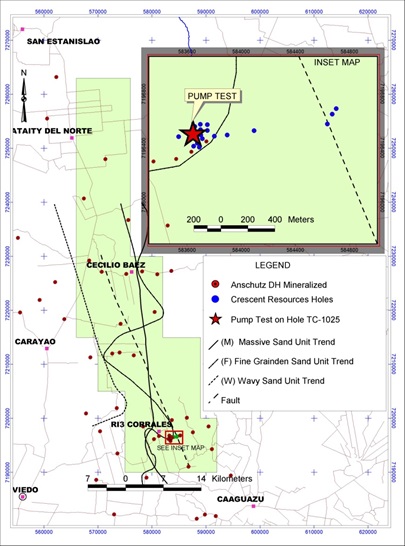
During Fiscal 2012, we completed a 10,000-meter drilling program at the project. A total of 35 holes were drilled, averaging 950 feet in depth. The holes were drilled on east to west lines across known geologic structures believed to be integral in controlling uranium occurrence. The holes were drilled on wide spacings, approximately one to 1.5 miles apart (see map above). Historic and recent drilling results are being reviewed for future exploration/delineation drilling at the Oviedo Project. A radon extraction survey is being completed along the western basin margins, following up on historic airborne radiometric anomalies and outcrop sampling results that indicate a potential for shallow uranium mineralization.
Yuty Project
Property Description and Location
Our Yuty Project covers 289,680 acres and is located approximately 125 miles east and southeast of Asunción, the capital of Paraguay. It is located within the Paraná Basin, which is host to a number of known uranium deposits, including Figueira and Amorinópolis in Brazil. Preliminary studies indicate amenability to extraction by ISR, which is the same process currently used by our Company at its Texas operations. Cue spent over CAD$16 million developing Yuty since 2006.
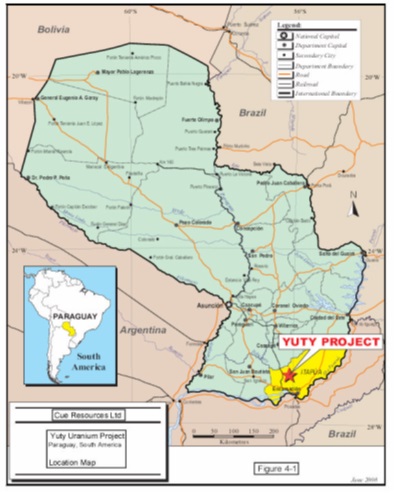
History
Exploration for uranium in southeastern Paraguay was started in 1976 by Anschutz, after a Concession Agreement between the Government of Paraguay and Anschutz in December 1975. This agreement allowed Anschutz to explore for all minerals, excluding oil, gas and construction materials. The initial uranium exploration by Anschutz in 1976 covered an exclusive exploration concession of 162,700 square kilometers, virtually the whole eastern half of Paraguay. This was followed by a program of diamond drilling and rotary drilling over selected target areas. In total, some 75,000 meters of drilling were completed from 1976 to1983. Data is available for a total of 257 drill holes in the San Antonio area. Anschutz carried out exploration on behalf of a joint venture with Korea Electric Power Corporation and Taiwan Power Company. Anschutz intersected uranium mineralization in drill holes ranging from 0.115% U3O8 over 10.2 meters to 0.351% U3O8 over 0.3 meters in sandstones and siltstones. Work was suspended in 1983 due to the decline in the price of uranium, and no further work was done at that time.
During the exploration programs by Anschutz, airborne radiometric surveys, regional geological mapping and geochemical sampling were the main exploration tools for uranium exploration in the southeastern part of Paraguay. This was followed-up by core and rotary drilling in two phases. The initial phase was to drill wide-spaced reconnaissance diamond drill holes along fences spaced approximately ten miles apart. The objective of this initial phase was to obtain stratigraphic information across an inferred host trend. The second phase was to drill rotary holes, spaced approximately 1,000 feet apart, within and between the fences of reconnaissance holes, to establish and outline target areas. All drill holes were logged and probed by gamma, neutron and resistivity surveys.
Exploration work by Anschutz outlined several large target areas including what is now the Yuty Project. These include the San Antonio, San Miguel, Typychaty and Yarati-í targets near and around the village of Yuty, approximately 125 miles southeast of Asunción.
Geologic Setting and Mineralization
The Yuty Project area is situated within the western part of the Paraná Basin in Southeastern Paraguay, which also hosts the Figueira uranium deposit in Brazil. The area is underlain by Upper Permian-Carboniferous (“UPC”) continental sedimentary rocks. The exploration methodology applied during past programs has been to determine the favorable host rocks of the UPC sequence and to explore favorable areas of the host sandstone.
Continental sedimentary units of the Independencia Formation (of the UPC) are known to have high potential for uranium exploration in eastern Paraguay. The source of the uranium is thought to be the Lower Permian-Carboniferous Coronel Oviedo Formation, which is correlated with the Itataré Formation underlying the Rio Benito Formation in Brazil. Occasional diabase sills and dikes intrude the sedimentary rocks, such as at the San Antonio area near the village of Yuty. Outcrops are rare, mostly along road cuts, and mapping is done by drilling.
The rocks of the Yuty area are very gently east dipping and undeformed. Occasional northwest and northeast trending normal faults cut the sedimentary units. Exploration work to date suggests that the uranium mineralization within the San Miguel Formation is stratabound and possibly syngenetic or diagenetic in origin. Recent interpretation of exploration data suggests that areas of limonite and hematite alteration within the grey-green, fine-grained sandstones in the San Antonio area have characteristics similar to the alteration assemblages present at roll-front type uranium deposits of the Powder River basin in the United States.
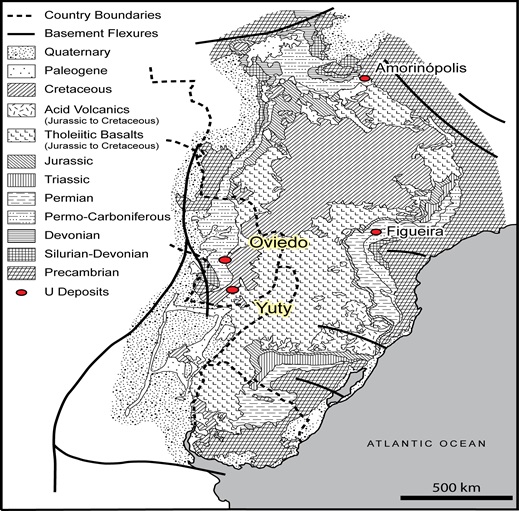
Geologic Setting of the Yuty Project
Recent Exploration
In late July 2006, Cue signed an agreement with the shareholders of Transandes Paraguay S.A. to option the Yuty property, followed by a formal earn-in agreement signed on November 6, 2007, and started a systematic uranium exploration program. This included a compilation of all previous exploration data, including lithologic and radiometric logs, stored at the MOPC in Asunción. The most recent drilling completed in the San Antonio area was in November and December 2010, at which time 33 holes were completed for a total of 11,500 feet. Of these holes, five were not successfully completed. Of the 28 holes that reached the target, ten had intersections greater than a GT (grade x thickness) of 0.10m% eU3O8, and an additional 13 had intersections exceeding a GT of 0.03m% eU3O8.
Drilling and Sampling
Approximately 240,000 feet of drilling (core as well as rotary) were completed by Anschutz in previous campaigns on the Yuty property.
The procedures used during the diamond and rotary drilling programs were drafted by Anschutz technical personnel. Healex reviewed all of the drill logs at the MOPC in Asunción and was of the opinion that the lithologic logging procedures are comparable to industry standards. Detailed information on sampling methods and approach during the Anschutz drilling campaigns is not available. Nevertheless, previous technical reports (Scott Wilson (2008) and Healex (2009)) have concluded that sampling procedures were comparable to industry standards of that time. Mr. Beahm (2011 technical report) concurs with this determination. From 2007 to 2010, Cue completed over 100,000 feet of drilling at the San Antonio target area in 256 drill holes. Most of the holes were collared with a rotary drilling rig, surface casing was then installed, and the holes were drilled to completion depth with a diamond rig. To date, diamond drilling totals approximately 52,800 feet and rotary drilling approximately 50,000 feet. For diamond drill holes, HQ-size core was retrieved and the drilling contractor was Empire Drilling S.A. of Quito, Ecuador. For rotary drilling, the contractor was 9 de Junio S.A. (Primo) of Asunción, Paraguay.
Exploration Potential
Except for the San Antonio area, the Yuty Project is at an early-to intermediate stage of exploration. A number of areas of anomalous concentrations of uranium occur in UPC sedimentary rocks within the property area. Past work was focused on developing roll-front type targets. Preliminary interpretation of the drill results in the San Antonio area suggests that the basal sandstone unit (San Miguel Formation) is a favorable host for uranium mineralization. These results also suggest that the diabase sill overlying the San Miguel Formation may have acted as a trap for diagenetic fluids and provided a horizontal conduit for the circulation of the diagenetic fluids and emplacement of uranium mineralization near the margin of a topographic high (gentle hill) below the diabase sill.
Historic and recent drilling results are being reviewed by our Company for future exploration/delineation drilling at the Yuty Project.
A Technical Report, dated August 24, 2011, for the Yuty Project, prepared in accordance with NI 43-101, was completed by Douglas Beahm, P.G., P.E., Bill Northrup and Andre Deiss, consulting geologists, and filed by us on SEDAR.
In April 2015 the Yuty Project received a signed resolution from the MOPC, the national agency that regulates mining in Paraguay, advancing the project from the Exploration Phase into the Exploitation Phase. The Yuty Project is only the third mining project to achieve the Exploitation Phase since the current Paraguayan mining law was promulgated in 2007.
When the MOPC grants a mineral concession to an operator the project initially enters the Exploration Phase for a maximum of six years, during which period a company must advance and demonstrate a viable project. The Exploration Phase is followed by the Exploitation Phase for a maximum of 20 years renewable every five years indefinitely, during which period the environmental licensing process may begin, a key milestone required before starting production, as well as allowing for reductions in land and various investment costs. The Exploitation Phase is followed by the Production Phase which lasts for an indefinite period.
Alto Paraná Titanium Project
We acquired our Alto Paraná Titanium Project from CIC Resources Inc. (“CIC”) on July 7, 2017.
Property Description and Location
The Alto Paraná Titanium Project is a titanium project located in Eastern Paraguay in the Alto Paraná province approximately 100 km north of Ciudad del Este and consists of 174,200 acres. The Alto Paraná Project resource is atypically high in titanium values when compared to most beach sand deposits. High iron laterite hosts heavy minerals containing high iron and titanium values as ilmenite, titanomagnetite and magnetite.
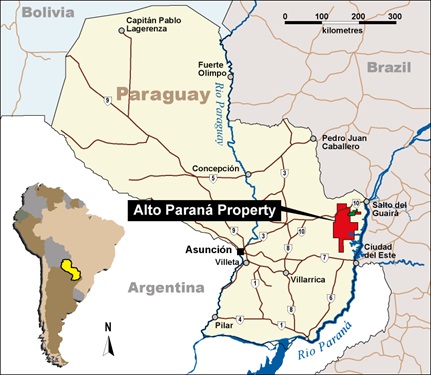
History
Exploration work on the property was initiated by CIC in 2009 with a program of widespread hand-dug pits consisting of channel samples at approximately one-meter vertical intervals within the laterite. The initial phase of pitting and sampling was followed up by more closely spaced deep pitting and shallow (one m) auger drilling in 2010 and 2011. In total, 4,432 samples from deep pits and 2,992 one-meter auger samples have been collected and analyzed. The purpose of the exploration work was to evaluate the original CIC hectares to determine the area of best grade and thickness. Based on these extensive sampling efforts, we now control this generally higher-grade/thickness area as previously noted.
CIC also conducted extensive process development work with the objective of a viable process flow sheet for beneficiation of the heavy minerals from the laterite. This work carried out by Mineral Advisory Group, and included design, construction and operation of a 1.5 tonne per hour pilot plant in Paraguay. During operations the plant underwent continual process improvements and eventually produced 108 tonnes of concentrate over a three-month period. In January 2012 the concentrate was shipped to MINTEK in South Africa for smelting in a MINTEK pilot plant.
Geologic Setting and Mineralization
Mineralization on the property consists of laterite containing ilmenite, titanomagnetite and magnetite derived from Early Cretaceous tholeitic basalts of the Paraná Basin and associated gabbro intrusions. The basalts and gabbros have been weathered to laterite to an average depth of approximately seven metres over a very extensive area. Kaolinite is the dominant mineral, representing 60% to 75% of the mineral assemblage. Ilmenite, magnetite and titanomagnetite are present in the laterite as discrete minerals ranging in particle size from <40 µm to 350 µm with average particle sizes in the 135 µm to 165 µm range. The grade of titanium in the laterite ranges up to approximately 11% but is typically in the 5% to 9% range.
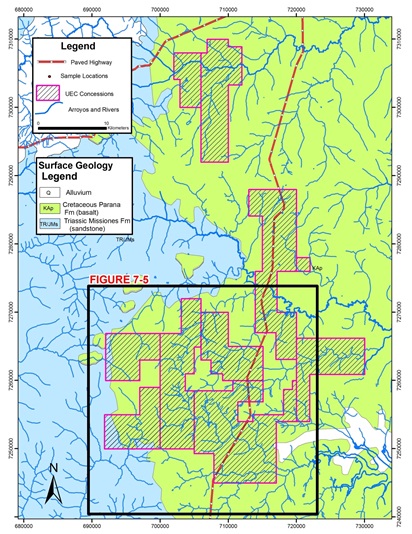
Summary
The Alto Paraná Titanium Project appears to be homogeneous and much higher grade than existing mineral sands deposits. Further work on particle size distribution of the ilmenite/titanomagnetite fractions and variable laterite bulk density as a function of depth will help better define the Alto Paraná Titanium Project.
On September 12, 2017, we filed a NI 43-101 Technical Report for the Alto Paraná Project authored by Martin C. Kuhn, PhD, PE and David M. Brown, P. Geo., and filed it on SEDAR.
The Company has had communications and filings with the MOPC, whereby the MOPC is taking the position that certain concessions forming part of the Company’s Yuty Project and Alto Paraná Project are not eligible for extension as to exploration or continuation to exploitation in their current stages. While we remain fully committed to our development path forward in Paraguay, we have filed certain applications and appeals in Paraguay to reverse the MOPC’s position in order to protect the Company’s continuing rights in those concessions.
Other Properties
As of July 31, 2020, we owned 32 acres of real estate located in Goliad County, Texas, 22 acres of real estate in Karnes County, Texas, 40 acres of real estate in Campbell Country, Wyoming, and 76.6 acres of real estate located in the Republic of Paraguay.
As of July 31, 2020, we have entered into office rental and service agreements as follows:
|
● |
an office lease at $9,510 per month for the Corpus Christi administration office located at 500 N. Shoreline Blvd., Suite 800N, Corpus Christi, Texas, 78471. The lease expires on July 31, 2021; |
|
● |
an office lease at $5,483 per month for the Vancouver administration office at 1030 West Georgia Street, Suite 1830, Vancouver, British Columbia, Canada, V6E 2Y3. The lease expires on March 31, 2021; and |
|
● |
an office lease at $1,500 per month for the Wyoming office at 409 West Birch Street, Glenrock, Wyoming, 82637. The lease expires on April 30, 2021. |
Our Databases
We have acquired historical exploration data that will assist in the direction of proposed exploration program on lands held in our current property portfolio. This prior exploration data consists of management information and work product derived from various reports, drill hole assay results, drill hole logs, studies, maps, radioactive rock samples, exploratory drill logs, state organization reports, consultants, geological study and other exploratory information.
The following provides information relating to our databases:
Tronox Worldwide
Effective February 20, 2008, we acquired from Tronox Worldwide LLC certain assets, consisting of certain maps, data, exploration results and other information pertaining to lands within the U.S. (excluding New Mexico and Wyoming), Canada and Australia, and specifically including the former uranium exploration projects by Kerr McGee Corporation. The Tronox database contains records on some of our properties located in Arizona, the Colorado Plateau and Texas. We have exclusive ownership of this database.
Jebsen
Our Jebsen database covers territory in Wyoming and New Mexico, including some of our existing properties. The database belonged to a pioneering uranium developer and represents work conducted from the 1950s through to the present.
This database adds over 500 drill holes and over 500,000 feet of drilling data results to our existing library of data. Other than logs, the data set consists of volumes of maps, lithographic logs, geologic reports, and feasibility studies, and many other essential tools for uranium exploration and pre-extraction.
Our geologists have linked contents of the database to some of our existing properties, specifically pertaining to our projects in the Shirley Basin and Powder River Basin of Wyoming, and in the Grants Uranium District of New Mexico. We have exclusive ownership of this database.
Halterman
Our Halterman database consists of exploratory and pre-extraction work compiled during the 1970s and 1980s, including extensive data on significant prospects and projects in the following known uranium districts in the States of Colorado, New Mexico and Utah, including in the Grants, San Juan Basin, Chama Basin, Moab, Lisbon Valley, Dove Creek, Slick Rock and Uravan districts.
This database includes drilling and logging data from over 200,000 feet of uranium exploration and pre-extraction drilling, resource evaluations and calculations, drill-hole locations and grade thickness maps, competitor activity maps as well as several dozen geological and project evaluation reports covering uranium projects in New Mexico, Colorado, Utah, Texas and California. We have exclusive ownership of this database.
Brenniman
Our Brenniman database includes drilling and logging data from over two million feet of uranium exploration and pre-extraction drilling, resource calculation reports and various other geological reports, drill hole location maps and other mapping. This database includes approximately 142 drill hole gamma and E-logs. The data was originally compiled from 1972 to 1981 by various exploration companies, and covers over 100 uranium prospects in 15 southern U.S. states. This library will be used by our technical personnel to determine locations of where drill-indicated uranium may exist. We have exclusive ownership of this database.
Kirkwood
We acquired a database of uranium exploration results covering an area of approximately 13,000 acres within the uranium zone known as the Poison Spider area, in central Wyoming. The area covered includes property already held by us, as well as by other publicly-traded uranium exploration companies. The database was compiled by William Kirkwood of North American Mining and Minerals Company, a significant participant in the uranium, coal, gold and oil and gas industries in the western United States since the 1960s. The data acquired was generated from exploration originally conducted by companies such as Homestake Mining, Kennecott Corp, Rampart Exploration and Kirkwood Oil and Gas, largely between 1969 and 1982. The database consists of drill hole assay logs for 470 holes, including 75,200 feet of drilling, 22,000 feet of gamma logs, drill hole location maps, cross sections, geological maps, geological reports, and other assay data and will be used to locate possible mineralized zones in the Poison Spider area in central Wyoming. We have exclusive ownership of this database.
Odell
We acquired the rights to a database containing over 50 years of uranium exploration data for the State of Wyoming. This database consists of 315,000 feet of drill logs, over 400 maps, copies of all US geological survey uranium publications dating back to 1954 and geological reports on uranium ore bodies throughout Wyoming. The database will be used to locate possible mineralized zones. The database is made available to us by Robert Odell, the compiler and publisher of the Rocky Mountain Uranium Minerals Scout since 1974. We do not own or have exclusive rights to this database.
Moore
We acquired a database of U.S. uranium exploration results from Moore Energy, a private Oklahoma-based uranium exploration company.
The Moore Energy U.S. uranium database consists of over 30 years of uranium exploration information in the States of Texas, New Mexico and Wyoming, originally conducted during the 1970s to the 1990s. It includes results of over 10,000 drill holes, plus primary maps and geological reports. It covers approximately one million acres of prospective uranium claims in the South Texas Uranium Belt, New Mexico, and Powder River Basin, Wyoming, as well as zones in Texas, and will be used to locate possible mineralized zones.
The database also provides us with exploration data about our Goliad Project, including 250,000 feet of drill logs and further delineates zones of potential uranium mineralization. It also contains drilling results from properties that are being developed by other uranium exploration companies, and also widespread regional data from throughout the South Texas uranium trend. We have exclusive ownership of this database.
Uranium Resources Inc.
We acquired the full database of historic drill results for our Salvo Project located in Bee County, Texas. The database consists of 425 gamma ray/resistivity and lithology logs, PGT logs and drill plan maps. We have exclusive ownership of this database.
South Texas Goliad Project
Our South Texas Goliad database includes raw and interpreted data compiled by Total Minerals (“TOMIN”) and others from the mid1980s to 1993. The database is an evaluation of the uranium potential within the Goliad Formation from south of Houston to the Mexican border.
Through TOMIN’s purchase of the Holiday-El Mesquite project, located in Duval County, Texas, in 1990, TOMIN acquired the Mobil uranium exploration database. Starting with this data, and earlier data purchased from Tenneco Uranium, TOMIN also acquired regional oil and gas logs (included in the database), water well driller logs and other regional information to begin their study of the Goliad Formation along the South Texas Uranium Belt.
As a result of the study TOMIN identified 62 targets and drilled 22 holes by project end in 1993. Of the 22 drilled, 19 were disproved and the remaining three await further drilling to assess trends. Another 40 targets remain to be drill-evaluated.
In summary, the database contains:
|
● |
4,894 South Texas uranium logs - 2.8 million feet of drilling; |
|
● |
13,882 South Texas oil and gas logs - 41.6 million feet; |
|
● |
752 maps/sections across South Texas; and |
|
● |
103 documents, reports and analyses documenting the study. |
Item 3. Legal Proceedings
As of the date of this Annual Report, other than as disclosed below, there are no material pending legal proceedings, other than ordinary routine litigation incidental to our business, to which our Company or any of our subsidiaries is a party or of which any of their property is subject, and no director, officer, affiliate or record or beneficial owner of more than 5% of our common stock, or any associate or any such director, officer, affiliate or security holder, is: (i) a party adverse to us or any of our subsidiaries in any legal proceeding; or (ii) has an adverse interest to us or any of our subsidiaries in any legal proceeding. Other than as disclosed below, management is not aware of any other material legal proceedings pending or that have been threatened against us or our properties.
On or about March 9, 2011, the TCEQ granted our Company’s applications for a Class III Injection Well Permit, PAA and AE for our Goliad Project. On or about December 4, 2012, the EPA concurred with the TCEQ issuance of the AE permit. With the receipt of this concurrence, the final authorization required for uranium extraction, our Goliad Project achieved fully-permitted status. On or about May 24, 2011, a group of petitioners, inclusive of Goliad County, appealed the TCEQ action to the 250th District Court in Travis County, Texas. A motion filed by our Company to intervene in this matter was granted. The petitioners’ appeal lay dormant until on or about June 14, 2013, when the petitioners filed their initial brief in support of their position. On or about January 18, 2013, a different group of petitioners, exclusive of Goliad County, filed a petition for review with the Court of Appeals for the Fifth Circuit to appeal the EPA’s decision. On or about March 5, 2013, a motion filed by our Company to intervene in this matter was granted. The parties attempted to resolve both appeals, to facilitate discussions and avoid further legal costs. The parties jointly agreed, through mediation initially conducted through the Fifth Circuit on or about August 8, 2013, to abate the proceedings in the State District Court. On or about August 21, 2013, the State District Court agreed to abate the proceedings. The EPA subsequently filed a motion to remand without vacatur with the Fifth Circuit wherein the EPA’s stated purpose was to elicit additional public input and further explain its rationale for the approval. In requesting the remand without vacatur, which would allow the AE to remain in place during the review period, the EPA denied the existence of legal error and stated that it was unaware of any additional information that would merit reversal of the AE. We and the TCEQ filed a request to the Fifth Circuit for the motion to remand without vacatur, and if granted, to be limited to a 60-day review period. On December 9, 2013, by way of a procedural order from a three-judge panel of the Fifth Circuit, the Court granted the remand without vacatur and initially limited the review period to 60 days. In March of 2014, at the EPA’s request, the Fifth Circuit extended the EPA’s time period for review and additionally, during that same period, our Company conducted a joint groundwater survey of the site, the result of which reaffirmed our previously filed groundwater direction studies. On or about June 17, 2014, the EPA reaffirmed its earlier decision to uphold the granting of our existing AE, with the exception of a northwestern portion containing less than 10% of the uranium resource which was withdrawn, but not denied, from the AE area until additional information is provided in the normal course of mine development. On or about September 9, 2014, the petitioners filed a status report with the State District Court which included a request to remove the stay agreed to in August 2013 and to set a briefing schedule. In that Status Report the petitioners also stated that they had decided not to pursue their appeal at the Fifth Circuit. We continue to believe that the pending appeal is without merit and is continuing as planned towards uranium extraction at its fully-permitted Goliad Project.
The Company has had communications and filings with the MOPC, the mining regulator in Paraguay, whereby the MOPC is taking the position that certain concessions forming part of the Company’s Yuty and Alto Parana Projects are not eligible for extension as to exploration or continuation to exploitation in their current stages. While we remain fully committed to our development path forward in Paraguay, we have filed certain applications and appeals in Paraguay to reverse the MOPC’s position in order to protect the Company’s continuing rights in those concessions.
Item 4. Mine Safety Disclosures
Pursuant to Section 1503(a) of the Dodd-Frank Wall Street Reform and Consumer Protection Act of 2010, issuers that are operators, or that have a subsidiary that is an operator, of a coal or other mine in the United States, and that is subject to regulation by the Federal Mine Safety and Health Administration under the Mine Safety and Health Act of 1977 (the “Mine Safety Act”), are required to disclose in their periodic reports filed with the SEC information regarding specified health and safety violations, orders and citations, related assessments and legal actions, and mining-related fatalities. During the fiscal year ended July 31, 2020, our Company’s Palangana Mine was not subject to regulation by the Federal Mine Safety and Health Administration under the Mine Safety Act.
PART II
Item 5. Market for Registrant’s Common Equity, Related Stockholder Matters and Issuer Purchases of Equity Securities
Shares of our common stock commenced trading on the OTC Bulletin Board under the symbol “URME” on December 5, 2005. On September 28, 2007, shares of our common stock commenced trading on the NYSE American (formerly known as the American Stock Exchange, the NYSE Amex Equities Exchange and the NYSE MKT) under the symbol “UEC”. The market for our common stock is limited and can be volatile. The following table sets forth the high and low trading prices relating to our common stock on the NYSE American on a quarterly basis for the periods indicated:
|
NYSE American |
||
|
Quarter Ended |
High |
Low |
|
July 2020 |
$1.01 |
$0.96 |
|
April 2020 |
$1.18 |
$1.10 |
|
January 2020 |
$0.85 |
$0.79 |
|
October 2019 |
$1.01 |
$0.95 |
|
July 2019 |
$1.02 |
$0.96 |
|
April 2019 |
$1.42 |
$1.37 |
|
January 2019 |
$1.33 |
$1.28 |
|
October 2018 |
$1.34 |
$1.30 |
|
July 2018 |
$1.80 |
$1.48 |
|
April 2018 |
$1.74 |
$1.22 |
|
January 2018 |
$2.00 |
$0.96 |
|
October 2017 |
$1.64 |
$1.05 |
The last reported closing price for our shares on the NYSE American on October 27, 2020 was $0.9151 per share. As of October 27, 2020, we had 216 registered shareholders.
Dividend Policy
No dividends have been declared or paid on our common stock. We have incurred recurring losses and do not currently intend to pay any cash dividends in the foreseeable future.
Securities Authorized For Issuance Under Compensation Plans
At July 31, 2020, we had one equity compensation plan, our 2020 Stock Incentive Plan (the “2020 Plan”). The table below sets forth information relating to our equity compensation plan at our fiscal year end July 31, 2020:
|
Plan Category |
Number of Securities to be Issued Upon Exercise of Outstanding Options, Warrants and Rights(1) |
Weighted Average Exercise Price Options, Warrants and Rights(2) |
Number of Securities Remaining Available for Future Issuance Under Equity Compensation Plans (excluding column (a)) |
|
Equity Compensation Plans Approved by Security Holders (2020 Stock Incentive Plan)(3) |
17,887,251 |
$1.13 |
7,644,073 |
|
Equity Compensation Plans Not Approved by Security Holders |
Nil |
N/A |
Nil |
|
Total |
17,887,251 |
$1.13 |
7,644,073 |
Notes:
|
(1) |
This figure represents: (i) 15,514,750 outstanding stock options having a weighted average exercise price of $1.13 and a weighted average remaining term of 5.64 years; (ii) 1,615,000 shares of our common stock underlying RSUs; and (iii) 757,501 shares of our common stock underlying PRSUs. Shares of our common stock underlying PRSUs are included assuming maximum payout, but may be paid out at lesser amounts, or not at all, depending on the achievement of performance criteria. |
|
(2) |
This price applies only to the stock options included in column (a) and is not applicable to the RSUs or PRSUs included in column (a). |
|
(3) |
Under our 2020 Stock Incentive Plan, stock-based awards are granted from a pool of available shares, with: (i) every share issuable pursuant to the exercise of a stock option or SAR counting as one share of our common stock; and (ii) every share underlying restricted stock, a RSU, a PRSU or other right or benefit under our 2020 Stock Incentive Plan counting as two shares of our common stock. |
Securities Authorized For Issuance Under Compensation Plans
2020 Stock Incentive Plan
On June 5, 2020, our Board of Directors authorized and approved the adoption of the Company’s 2020 Plan, under which an aggregate of 27,620,197 of our shares may be issued, subject to adjustment as described in the 2020 Plan, and which, at that time, consisted of: (i) 11,778,500 shares issuable pursuant to stock options previously granted that were outstanding under our 2019 Stock Incentive Plan (the “2019 Plan”); (ii) 9,861,687 shares remaining available for issuance under the 2019 Plan; and (iii) 6,000,000 additional shares that may be issued pursuant to awards that may be granted under the 2020 Plan (collectively the “Stock Incentive Plan”). On July 30, 2020, our shareholders approved the adoption of our 2020 Plan. The 2020 Plan supersedes and replaces our prior equity compensation plan, being the 2019 Plan, such that no further shares are issuable under the 2019 Plan.
The purpose of the 2020 Plan is to enhance our long-term stockholder value by offering opportunities to our directors, officers, employees and eligible consultants to acquire and maintain stock ownership in order to give these persons the opportunity to participate in our growth and success, and to encourage them to remain in our service.
The 2020 Plan is to be administered by our Compensation Committee (therein our “Administrator”) which shall determine, among other things: (i) the persons to be granted awards under the 2020 Plan (each an “Award” to an “Eligible Participant”); (ii) the number of shares or amount of other Awards to be granted; and (iii) the terms and conditions of the Awards granted. We may issue shares, options, stock appreciation rights, restricted stock units, performance restricted stock units, deferred stock units and dividend equivalent rights, among others, under the 2020 Plan.
An Award may not be exercised after the termination date of the Award and may be exercised following the termination of an Eligible Participant’s continuous service only to the extent provided by the Administrator under the 2020 Plan. If the Administrator under the 2020 Plan permits an Eligible Participant to exercise an Award following the termination of continuous service for a specified period, the Award terminates to the extent not exercised on the last day of the specified period or the last day of the original term of the Award, whichever occurs first. In the event an Eligible Participant’s service has been terminated for “cause”, he or she shall immediately forfeit all rights to any of the Awards outstanding.
The foregoing summary of the 2020 Plan is not complete and is qualified in its entirety by reference to the 2020 Plan, a copy of which has been filed electronically with the SEC, which is available under the Company’s filings at www.sec.gov.
As of October 27, 2020, there were stock options outstanding under our 2020 Plan exercisable for an aggregate of 14,171,250 shares of our common stock.
Common Stock Purchase Warrants
As of October 27, 2020, there were common stock purchase warrants issued and outstanding exercisable for an aggregate of 14,555,314 shares of our common stock.
Recent Issuances of Unregistered Securities
All of our issuances of unregistered securities during our fiscal year ended July 31, 2020 were previously disclosed in our Quarterly Reports on Form 10-Q for our first, second and third quarters of our fiscal year ended July 31, 2020 and in our current reports on Form 8-K as filed periodically with the SEC. During our fourth quarter ended July 31, 2020, we issued the following securities that were not registered under the Securities Act:
|
● |
on May 4, 2020, we issued an aggregate of 26,403 shares of common stock to a consultant in consideration for services under a consulting agreement at a deemed issuance price of $0.909 per share. We relied on exemptions from registration under the Securities Act provided by Regulation S with respect to the issuance of these shares; |
|
● |
on May 7, 2020, we issued an aggregate of 4,054 shares of common stock to a consultant in consideration for services under a consulting agreement at a deemed issuance price of $1.11 per share. We relied on exemptions from registration under the Securities Act provided by Regulation S with respect to the issuance of these shares; and. |
|
● |
on July 13, 2020, we issued an aggregate of 8,108 shares of common stock to a consultant in consideration for services under a consulting agreement at a deemed issuance price of $1.11 per share. We relied on exemptions from registration under the Securities Act provided by Regulation S with respect to the issuance of these shares. |
Comparative Stock Performance
The graph below compares the cumulative total stockholder return on our common stock assuming an investment of $100 and the reinvestment of all dividends, if any, for the years ended July 31, 2016, through to July 31, 2020, with: (i) the cumulative total return on the shares of common stock of a current peer group index comprised of Denison Mines Corp., UR-Energy Inc., Adams Resources & Energy, Inc., Hallador Energy Company, Abraxas Petroleum Corporation, Fission Uranium Corp., Evolution Petroleum Corporation, NexGen Energy Ltd., Polymet Mining Corp., Isramco Inc., Comstock Resources, Inc., Silvercorp Metals Inc., Energy Fuels Inc., Laramie Resources Ltd. and UEX Corporation (collectively, the “Current Peer Group”); (ii) the cumulative total return on the shares of common stock of a previous peer group index comprised of Denison Mines Corp., UR-Energy Inc., Adams Resources & Energy, Inc., Hallador Energy Company, Abraxas Petroleum Corporation, Fission Uranium Corp. , Approach Resources, Inc., Evolution Petroleum Corporation, NexGen Energy Ltd., Polymet Mining Corp., Isramco Inc., Comstock Resources, Inc., Silvercorp Metals Inc., Energy Fuels Inc., Laramie Resources Ltd. and UEX Corporation (collectively, the “Previous Peer Group”); and (iii) the cumulative return on the Russell 3000 Index. The change in peer group was made to address changes in the external market and to better reflect our Company’s business.
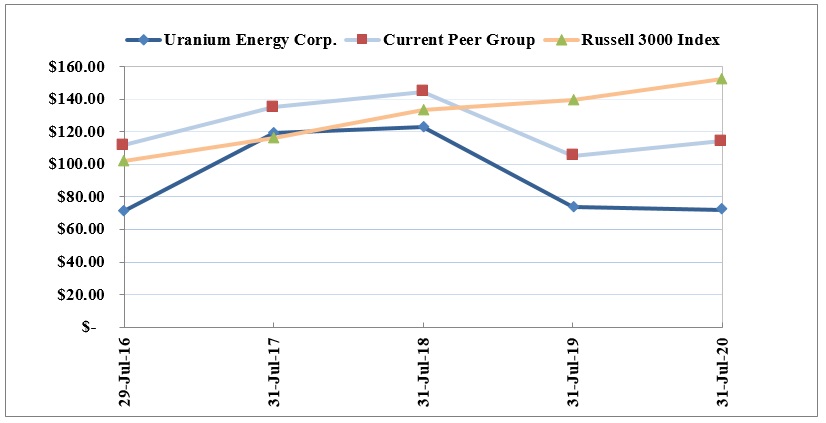
Item 6. Selected Financial Data
The following tables provide selected financial data for each of the past five fiscal years, and should be read in conjunction with, and are qualified in their entirety by reference to Item 7. Management’s Discussion and Analysis of Financial Condition and Results of Operations herein and our consolidated financial statements and related notes for Fiscal 2020, as presented under Item 8. Financial Statements and Supplementary Data herein. These historical results are not necessarily indicative of the results to be expected for any future period.
Consolidated Balance Sheets
|
July 31, 2020 |
July 31, 2019 |
July 31, 2018 |
July 31, 2017 |
July 31, 2016 |
||||||||||||||||
|
Cash and cash equivalents |
$ | 5,147,703 | $ | 6,058,186 | $ | 6,926,523 | $ | 12,575,973 | $ | 7,142,571 | ||||||||||
|
Term deposits |
- | 11,831,671 | - | 10,000,000 | - | |||||||||||||||
|
Working capital (deficit) |
4,552,477 | 16,638,565 | (3,974,842 | ) | 21,143,775 | 6,178,194 | ||||||||||||||
|
Total assets |
91,389,617 | 101,040,242 | 89,611,309 | 72,177,234 | 56,176,311 | |||||||||||||||
|
Total liabilities |
26,972,999 | 26,812,974 | 26,435,749 | 26,041,829 | 25,726,433 | |||||||||||||||
|
Stockholders' equity |
64,416,618 | 74,227,268 | 63,175,560 | 46,135,405 | 30,449,878 | |||||||||||||||
Consolidated Statements of Operations
|
Year Ended July 31, |
||||||||||||||||||||
|
2020 |
2019 |
2018 |
2017 |
2016 |
||||||||||||||||
|
Costs and expenses |
$ | 14,334,523 | $ | 14,977,013 | $ | 16,313,981 | $ | 15,218,433 | $ | 14,331,743 | ||||||||||
|
Net loss for the year |
(14,610,516 | ) | (17,152,789 | ) | (17,826,634 | ) | (17,971,056 | ) | (17,329,872 | ) | ||||||||||
|
Net loss per share, basic and diluted |
(0.08 | ) | (0.10 | ) | (0.11 | ) | (0.14 | ) | (0.16 | ) | ||||||||||
Item 7. Management’s Discussion and Analysis of Financial Condition and Results of Operations
The following management’s discussion and analysis of the Company’s financial condition and results of operations contain forward-looking statements that involve risks, uncertainties and assumptions including, among others, statements regarding our capital needs, business plans and expectations. In evaluating these statements, you should consider various factors, including the risks, uncertainties and assumptions set forth in reports and other documents we have filed with or furnished to the SEC and, including, without limitation, this Form 10-K filing for the fiscal year ended July 31, 2020, including the consolidated financial statements and related notes contained herein. These factors, or any one of them, may cause our actual results or actions in the future to differ materially from any forward-looking statement made in this document. Refer to “Cautionary Note Regarding Forward-looking Statements” and Item 1A. Risk Factors herein.
Introduction
The following discussion summarizes the results of operations for each of our fiscal years ended July 31, 2020, 2019, and 2018 (“Fiscal 2020”, “Fiscal 2019” and “Fiscal 2018”) and our financial condition as at July 31, 2020 and 2019, with a particular emphasis on Fiscal 2020, our most recently completed fiscal year.
Business
We operate in a single reportable segment and, since 2004, as more fully described under “General Business” of Item 1. Business herein, we have been primarily engaged in uranium mining and related activities, including exploration, pre-extraction, extraction and processing, on uranium projects located in the United States, Canada and Paraguay.
We utilize ISR mining for our uranium projects where possible which we believe, when compared to conventional open pit or underground mining, requires lower capital and operating expenditures with a shorter lead time to extraction and a reduced impact on the environment. We have one uranium mine located in the State of Texas, our Palangana Mine, which utilizes ISR mining and commenced extraction of U3O8, or yellowcake, in November 2010. We have one uranium processing facility located in the State of Texas, our Hobson Processing Facility, which processes material from the Palangana Mine into drums of U3O8, our only sales product and source of revenue, for shipping to a third-party storage and sales facility. At July 31, 2020, we had no uranium supply or off-take agreements in place.
Our fully-licensed and 100% owned Hobson Processing Facility forms the basis for our regional operating strategy in the State of Texas, specifically the South Texas Uranium Belt where we utilize ISR mining. We utilize a “hub-and-spoke” strategy whereby the Hobson Processing Facility, which has a physical capacity to process uranium-loaded resins up to a total of two million pounds of U3O8 annually and is licensed to process up to one million pounds of U3O8 annually, acts as the central processing site (the “hub”) for our Palangana Mine, and future satellite uranium mining activities, such as our Burke Hollow and Goliad Projects, located within the South Texas Uranium Belt (the “spokes”).
We also hold certain mineral rights in various stages in the States of Arizona, Colorado, New Mexico, Wyoming and Texas, and in Canada and in the Republic of Paraguay, many of which are located in historically successful mining areas and have been the subject of past exploration and pre-extraction activities by other mining companies. We do not expect, however, to utilize ISR mining for all of our mineral rights in which case we would expect to rely on conventional open pit and/or underground mining techniques.
Our operating and strategic framework is based on expanding our uranium extraction activities, which includes advancing certain uranium projects with established mineralized materials towards uranium extraction, and establishing additional mineralized materials on our existing uranium projects or through acquisition of additional uranium projects.
Key Issues
Since commencing uranium extraction at the Palangana Mine in November 2010, we have been focused primarily on expanding our South Texas uranium mining activities and establishing additional uranium mines through exploration and pre-extraction activities and direct acquisitions in both the U.S. and Paraguay, all of which require us to manage numerous challenges, risks and uncertainties inherent in our business and operations as more fully described in Item 1A. Risk Factors herein.
Our operations are capital intensive, and we will require significant additional financing to continue with our exploration and pre-extraction activities and acquire additional uranium projects. Historically, we have been reliant primarily on equity financings from the sale of our common stock and, for Fiscal 2014 and Fiscal 2013, on debt financing, in order to fund our operations. We have also relied on cash flows generated from our mining activities during Fiscal 2015, Fiscal 2013 and Fiscal 2012, however, we have yet to achieve profitability or develop positive cash flow from operations. Our reliance on equity and debt financings is expected to continue for the foreseeable future, and their availability whenever such additional financing is required will be dependent on many factors beyond our control including, but not limited to, the market price of uranium, the continuing public support of nuclear power as a viable source of electricity generation, the volatility in the global financial markets affecting our stock price and the status of the worldwide economy, any one of which may cause significant challenges in our ability to access additional financing, including access to the equity and credit markets. We may also be required to seek other forms of financing, such as asset divestitures or joint venture arrangements, to continue advancing our uranium projects which would depend entirely on finding a suitable third party willing to enter into such an arrangement, typically involving an assignment of a percentage interest in the mineral project. However, there is no assurance that we will be successful in securing any form of additional financing when required and on terms favorable to us. Our inability to obtain additional financing would have a negative impact on our operations, including delays, curtailment or abandonment of any one or all of our uranium projects.
We have not established proven or probable reserves, as defined by the SEC under Industry Guide 7, through the completion of a “final” or “bankable” feasibility study for any of our mineral projects. We have established the existence of mineralized materials for certain uranium projects, including our Palangana Mine. Since we commenced uranium extraction at the Palangana Mine without having established proven or probable reserves, there may be greater inherent uncertainty as to whether or not any mineralized material can be economically extracted as originally planned and anticipated. The Palangana Mine has been our sole source to generate sales revenues from the sales of U3O8 during Fiscal 2015, Fiscal 2013 and Fiscal 2012, with no sales revenues generated during other years. The economic viability of our mining activities, including the expected duration and profitability of the Palangana Mine and of any future satellite ISR mines, such as our Burke Hollow and Goliad Projects, located within the South Texas Uranium Belt, has many risks and uncertainties. These include, but are not limited to: (i) a significant, prolonged decrease in the market price of uranium; (ii) difficulty in marketing and/or selling uranium concentrates; (iii) significantly higher than expected capital costs to construct the mine and/or processing plant; (iv) significantly higher than expected extraction costs; (v) significantly lower than expected uranium extraction; (vi) significant delays, reductions or stoppages of uranium extraction activities; and (vii) the introduction of significantly more stringent regulatory laws and regulations. Our mining activities may change as a result of any one or more of these risks and uncertainties and there is no assurance that any ore body that we extract mineralized materials from will result in achieving and maintaining profitability and developing positive cash flow.
In response to COVID-19 pandemic, we have taken proactive steps to lower our operating expenses and to adjust our timing on capital expenditures. For the protection of our employees, we have arranged for our teams at our Vancouver, Corpus Christi and Paraguay offices to work remotely. In addition, previous plans to resume last year’s successful drilling program at our Burke Hollow Project has been postponed along with the associated capital outlays until market conditions normalize. In the meantime, we continue to operate our Palangana Mine at a reduced pace to capture residual uranium only and continue to advance our ISR projects with engineering and geologic evaluations that support the Company’s extraction readiness strategy.
At July 31, 2020, we had no uranium supply or off-take agreements in place. Future sales of U3O8 are therefore expected to generally occur through the uranium spot market, with any fluctuations in the market price continuing to have a direct impact on our revenues and cash flows.
The table below provides the high/low/average/close for the uranium spot price for each of our last five fiscal years as obtained from UxC Broker Average Price:
|
Fiscal Year Ended |
High |
Low |
Average |
Close |
||||||||||||
|
July 31, 2020 |
34.19 | 23.88 | 27.66 | 32.35 | ||||||||||||
|
July 31, 2019 |
29.28 | 23.94 | 26.95 | 25.41 | ||||||||||||
|
July 31, 2018 |
26.44 | 19.87 | 22.09 | 25.81 | ||||||||||||
|
July 31, 2017 |
26.69 | 17.80 | 22.33 | 20.11 | ||||||||||||
|
July 31, 2016 |
38.13 | 25.00 | 32.39 | 26.13 | ||||||||||||
Historically, the uranium spot price has been difficult to predict and subject to significant volatility and will continue to be affected by numerous factors beyond our control.
Results of Operations
For Fiscal 2020, Fiscal 2019 and Fiscal 2018, we recorded a net loss of $14,610,516 ($0.08 per share), $17,152,789 ($0.10 per share) and $17,826,634, ($0.11 per share), respectively. Loss from operations during Fiscal 2020, Fiscal 2019 and Fiscal 2018 totaled $14,334,523, $14,977,013 and $16,313,981, respectively. No revenue from U3O8 sales was generated during Fiscal 2020, Fiscal 2019 and Fiscal 2018.
During the second half of Fiscal 2020, in response to the significant financial market uncertainty as a result of the COVID-19 pandemic, we implemented corporate-wide cost-cutting and cash saving measures including deferral of capital expenditures to reduce cash outlays. In the meantime, we continued with our strategic plan for reduced operations at the Palangana Mine to capture residual pounds of U3O8 only.
While we remain in a state of operational readiness, uranium extraction expenditures incurred for PAA-1, 2 and 3 at the Palangana Mine directly related to regulatory/mine permit compliance, lease maintenance obligations and maintaining a minimum labor force will be charged to the consolidated statement of operations. As a result, no uranium concentrate was extracted at the Palangana Mine and processed at the Hobson Processing Facility during Fiscal 2020 and Fiscal 2019. At July 31, 2020, the total value of inventories was $211,662 (July 31, 2019: $211,662).
Costs and Expenses
During Fiscal 2020, costs and expenses totaled $14,334,523, (Fiscal 2019: $14,977,013; Fiscal 2018: $16,313,981), primarily comprised of mineral property expenditures of $4,582,403 (Fiscal 2019: $4,487,537; Fiscal 2018: $4,552,151), general and administrative expenses of $9,441,898 (Fiscal 2019: $10,142,035; Fiscal 2018: $11,407,206) and depreciation, amortization and accretion of $310,222 (Fiscal 2019: $347,441; Fiscal 2018: $354,624).
Mineral Property Expenditures
During Fiscal 2020, mineral property expenditures comprised of expenditures relating to permitting, property maintenance, exploration and pre-extraction activities and all other non-extraction related activities on our mineral projects. The following table provides mineral property expenditures on a project basis during the past three fiscal years:
|
Year Ended July 31, |
||||||||||||
|
2020 |
2019 |
2018 |
||||||||||
|
Mineral Property Expenditures |
||||||||||||
|
Palangana Mine |
$ | 1,342,927 | $ | 1,027,139 | $ | 1,047,635 | ||||||
|
Goliad Project |
190,278 | 96,789 | 105,264 | |||||||||
|
Burke Hollow Project |
1,130,467 | 1,616,601 | 675,605 | |||||||||
|
Longhorn Project |
17,023 | 45,848 | 14,401 | |||||||||
|
Salvo Project |
28,318 | 35,923 | 36,056 | |||||||||
|
Anderson Project |
71,170 | 81,414 | 68,167 | |||||||||
|
Workman Creek Project |
32,700 | 30,709 | 31,300 | |||||||||
|
Slick Rock Project |
52,521 | 53,843 | 52,218 | |||||||||
|
Reno Creek Project |
596,551 | 655,807 | 1,278,959 | |||||||||
|
Yuty Project |
65,679 | 102,882 | 425,298 | |||||||||
|
Oviedo Project |
350,211 | 288,324 | 119,082 | |||||||||
|
Alto Paraná Titanium Project |
230,350 | 168,956 | 175,768 | |||||||||
|
Other Mineral Property Expenditures |
474,208 | 557,497 | 522,398 | |||||||||
|
Revaluation of Asset Retirement Obligations |
- | (274,195 | ) | - | ||||||||
| $ | 4,582,403 | $ | 4,487,537 | $ | 4,552,151 | |||||||
During Fiscal 2019, the asset retirement obligations (“ARO”) of our Palangana Mine were revised due to changes in the estimated timing of restoration and reclamation of the Palangana Mine, resulting in the corresponding mineral rights and properties being reduced by $258,114, and a credit amount of revaluation of ARO totaling $274,195 being recorded against the mineral property expenditures for the Palangana Mine. No ARO revision was recorded for the Palangana Mine for Fiscal 2020 and Fiscal 2018.
In Fiscal 2020 mineral property expenditures included costs directly related to maintaining operational readiness and permit compliance at the Palangana Mine and Hobson Processing Facility totaled $1,130,028 (Fiscal 2019: $1,215,657; Fiscal 2018: $1,326,809).
The following provides a discussion on significant mineral property expenditures for certain of our projects:
|
● |
Palangana Mine |
During Fiscal 2020, mineral property expenditures at the Palangana Mine totaled $1,342,927 (Fiscal 2019: $1,027,139; Fiscal 2018: $1,047,635), which were comprised of maintenance of operational readiness and permit compliance of $772,515 (Fiscal 2019: $754,046; Fiscal 2018: $888,898), permitting and property maintenance of $553,531 (Fiscal 2019: $271,187; Fiscal 2018: $151,612) and exploration and development costs of $16,881 (Fiscal 2019: $1,906; Fiscal 2018: $7,125).
|
● |
Goliad Project |
During Fiscal 2020, mineral property expenditures at the Goliad Project totaled $190,278 (Fiscal 2019: $96,789; Fiscal 2018: $105,264), which were comprised of permitting and property maintenance costs of $117,204 (Fiscal 2019: $23,974; Fiscal 2018: $29,935), exploration expenditures of $7,108 (Fiscal 2019: $7,115; Fiscal 2018: $9,770) and plant and wellfield development costs of $65,966 (Fiscal 2019: $65,700; Fiscal 2018: $65,559).
|
● |
Burke Hollow Project |
During Fiscal 2020, we completed a drilling campaign initiated in Fiscal 2019 and drilled 26 exploration holes and 21 monitor wells totaling 21,069 feet at the Burke Hollow Project. Since the commencement of the 2019 drilling campaign in March 2019, a total of 57 exploration and delineation holes and 76 monitor wells have been completed. During Fiscal 2019, we advanced our permitting activities and received the final RML from TCEQ.
During Fiscal 2020, mineral property expenditures at the Burke Hollow Project totaled $1,130,467 (Fiscal 2019: $1,616,601; Fiscal 2018: $675,605), which were comprised of permitting and property maintenance costs of $384,885 (Fiscal 2019: $400,686; Fiscal 2018: $197,641), exploration costs of $214,246 (Fiscal 2019: $524,618; Fiscal 2018: $477,964), primarily for exploration and delineation drilling activities, and wellfield development and monitor well installation costs of $531,336 (Fiscal 2019: $691,297; Fiscal 2018: $Nil).
|
● |
Reno Creek Project |
During Fiscal 2020, mineral property expenditures at the Reno Creek Project totaled $596,551 (Fiscal 2019: $655,807; Fiscal 2018: $795,130), which were comprised of property maintenance costs of $484,228 (Fiscal 2019: $513,220; Fiscal 2018: $284,537) and permitting and exploration costs of $112,323 (Fiscal 2019: $142,587; Fiscal 2018: $510,593). During Fiscal 2018, in connection with the completion of the acquisition of the Reno Creek Project, we paid reimbursable expenses totaling $483,829 for property maintenance costs incurred at the Reno Creek Project prior to the closing of this acquisition, which were also included in the mineral property expenditures for Fiscal 2018.
|
● |
Yuty Project |
During Fiscal 2020, mineral property expenditures at the Yuty Project totaled $65,679 (Fiscal 2019: $102,882; Fiscal 2018: $425,298), which were comprised of permitting and property maintenance costs of $7,927 (Fiscal 2019: $Nil; Fiscal 2018: $225,044) and exploration expenditures of $57,752 (Fiscal 2019: $102,882; Fiscal 2018: $200,254).
|
● |
Oviedo Project |
During Fiscal 2020, mineral property expenditures at the Oviedo Project totaled $350,211 (Fiscal 2019: $288,324; Fiscal 2018: $119,082), which were comprised of property maintenance costs of $78,223 (Fiscal 2019: $105,641; Fiscal 2018: $Nil) and exploration expenditures of $271,988 (Fiscal 2019: $182,683; Fiscal 2018: $119,082) primarily for an exploration drilling program.
|
● |
Alto Paraná Titanium Project |
During Fiscal 2020, we completed a drilling program with total costs of $230,350 to prepare for a PEA where we drilled 49 holes totaling 500 feet at our Alto Parana Project. During Fiscal 2019 and Fiscal 2018, mineral property expenditures at the Alto Paraná Titanium Project totaled $168,956 and $175,768, respectively, which included property maintenance costs of $45,466 and $29,521 and exploration costs of $123,490 and $146,247, respectively.
During Fiscal 2020, we continued to maintain our projects in good standing, and the costs incurred on other projects of our Company were mainly for property maintenance costs.
General and Administrative
During Fiscal 2020, general and administrative expenses totaled $9,441,898, which decreased by $700,137 compared to $10,142,035 in Fiscal 2019, and which decreased by $1,265,171 compared to $11,407,206 during Fiscal 2018.
The following summary provides a discussion of the major expense categories, including analyses of factors that caused significant variances from year-to-year:
|
● |
during Fiscal 2020, salaries, wages and management fees totaled $1,710,947, which decreased by $937,617 compared to $2,648,564 during Fiscal 2019. During Fiscal 2020, in response to the financial market uncertainty due to the COVID-19 pandemic, we implemented corporate-wide pay reductions and increased share compensation in lieu of cash for the Company’s employees, officers and directors. During Fiscal 2019, salaries, wages and management fees totaled $2,648,564, which decreased by $232,324 compared to $2,880,888 during Fiscal 2018, due primarily from severance payments to certain employees during Fiscal 2018; |
|
● |
during Fiscal 2020, office, filing and listing, insurance, corporate development, investor relations and travel expenses totaled $3,284,806, which decreased by $133,907 compared to $3,418,713 during Fiscal 2019, primarily due to reduced corporate development, investor relations and travel activities, offset by an increase in insurance and filing and listing fee expenses. During Fiscal 2019, filing and listing fees, insurance, corporate development, investor relations and travel expenses totaled $3,418,713, which decreased by $164,211 compared to $3,582,924 during Fiscal 2018, due primarily from decreased consulting fees and office and administration expenses; |
|
● |
during Fiscal 2020, professional fees totaled $952,927, which decreased by $173,790 compared to $1,126,717 during Fiscal 2019, and which decreased by $312,619 compared to $1,439,336 during Fiscal 2018, primarily as a result of the dismissal of certain legal claims. Professional fees are comprised primarily of legal services related to transactional activities, regulatory compliance and ongoing legal claims, in addition to audit and taxation services; and |
|
● |
during Fiscal 2020, stock-based compensation expense totaled $3,493,218, which increased by $545,177 compared to $2,948,041 during Fiscal 2019, and which decreased by $556,017 compared to $3,504,058 during Fiscal 2018. During the second half of Fiscal 2020, in response to the financial market uncertainty as a result of the COVID-19 pandemic, we implemented corporate-wide cost-cutting and cash saving measures where we expanded the scope of equity-based payments to compensate certain directors, officers, employees and consultants in order to reduce cash outlays.
Stock-based compensation includes the fair value of stock options granted to optionees and the fair value of shares of the Company issued to directors, officers, employees and consultants of the Company under the Stock Incentive Plan. In the past few years we have been utilizing equity-based payments to directors, officers, employees and consultants as part of our continuing efforts to reduce cash outlays. The stock-based compensation varied from year to year primarily as a result of changes in the amount of compensation shares and stock option expenses which are amortized on an accelerating basis, resulting in more expenses being recorded at the beginning of the vesting period than at the end. |
Depreciation, Amortization and Accretion
During Fiscal 2020, depreciation, amortization and accretion totaled $310,222, which was consistent compared to $347,441 and $354,624 during Fiscal 2019 and Fiscal 2018, respectively.
Depreciation, amortization and accretion includes depreciation and amortization of long-term assets acquired in the normal course of operations and accretion of asset retirement obligations.
Other Income and Expenses
Interest and Finance Costs
During Fiscal 2020, interest and finance costs totaled $3,460,970 (Fiscal 2019: $3,249,881; Fiscal 2018: $2,952,202), comprised primarily of interest on long-term debt of $1,626,667 (Fiscal 2019: $1,622,222; Fiscal 2018: $1,622,222), amortization of debt discount of $1,669,514 (Fiscal 2019: $1,464,989; Fiscal 2018: $1,180,139) and surety bond premium of $130,262 (Fiscal 2019: $134,117; Fiscal 2018: $118,944). The increase in interest and finance costs year over year were primarily a result of an increase in amortization of debt discount due to the higher effective interest rate after the third amendment to our Credit Facility in December 2019.
Income or Loss from Equity-Accounted Investment
During Fiscal 2020, we recorded income of $2,967,583 from our investment in Uranium Royalty Corp (“URC”). As a consequence of the initial public offering and other private placements URC completed during Fiscal 2020, our ownership interest in URC decreased to 19.5% at July 31, 2020 from 32.6% at July 31, 2019, which resulted in a dilution gain of $3,056,656 being recorded. During Fiscal 2020, we recorded a loss pick up of $89,073 representing our share of URC’s loss.
During Fiscal 2019, we completed a royalty purchase agreement (the "Royalty Purchase Agreement") with URC, in connection with the purchase by URC from our Company of 1% net smelter return royalties, for uranium only, on each of our Slick Rock, Workman Creek and Anderson Projects. On December 4, 2018, we closed the Royalty Purchase Agreement and received 12,000,000 shares of URC with a fair value of $9,077,842. As a result, we own 14,000,000 shares representing a 32.6% interest in URC as at July 31, 2019 (July 31, 2018: 11.3%). Refer to Note 3: Mineral Rights and Properties and Note 6: Equity-Accounted Investment, to the Consolidated Financial Statements.
During Fiscal 2019, we recorded a loss of $1,103,356, which was comprised of our share of URC’s loss totaling $1,858,901, offset by a gain on ownership interest dilution totaling $755,545. During Fiscal 2018, we recorded income from our investment in URC totaling $423,657, which was comprised of our share of income of $29,001 and a gain on ownership interest dilution of $394,656.
Gain or Loss on Disposition of Assets
During Fiscal 2020 and Fiscal 2019, we recorded a gain of $2,343 and $1,595,513, respectively, on disposition of assets, whereas we recorded a loss of $1,696 on disposition of assets during Fiscal 2018. During Fiscal 2019, we recorded a gain of $1,578,864 on disposition of assets from the sale of royalty interests to URC. Refer to Note 3: Mineral Rights and Properties to the Consolidated Financial Statements herein.
Liquidity and Capital Resources
|
July 31, 2020 |
July 31, 2019 |
|||||||
|
Cash and cash equivalents |
$ | 5,147,703 | $ | 6,058,186 | ||||
|
Term deposits |
- | 11,831,671 | ||||||
|
Current assets |
6,589,879 | 19,709,933 | ||||||
|
Current liabilities |
2,037,402 | 3,071,368 | ||||||
|
Working capital |
4,552,477 | 16,638,565 | ||||||
At July 31, 2020, we had cash and cash equivalents of $5,147,703 and working capital of $4,522,477. During Fiscal 2020, we received a loan of $277,250 under the Paycheck Protection Program (the “PPP Loan” and the “PPP Loan”) in the U.S. and $29,842 under the Canadian Emergency Business Account Program (the “CEBA Program” and the “CEBA Loan”). Subsequent to July 31, 2020, we completed our September 2020 Offering of 12,500,000 units at a price of $1.20 per unit for gross proceeds of $15,000,000, which substantially increased our cash and cash equivalent and improved our working capital position. As a consequence, our existing cash resources as at July 31, 2020 and cash received from the September 2020 Offering are expected to provide sufficient funds to carry out our planned operations for the next 12 months from the date that this Annual Report is issued.
Although our planned principal operations commenced in Fiscal 2012, from which significant revenues from U3O8 sales have been realized, our revenues generated from U3O8 sales have been inconsistent and we have yet to achieve profitability. We have a history of operating losses resulting in an accumulated deficit balance since inception. In Fiscal 2020, we recorded net losses totaling $14,610,516 (Fiscal 2019: $17,152,789; Fiscal 2018: $17,826,634) and we had an accumulated deficit balance of $276,811,300 at July 31, 2020. During Fiscal 2020, net cash used in operating activities totaled $12,870,711 (Fiscal 2019: $12,573,468; Fiscal 2018: 12,511,289). Furthermore, we do not expect to achieve and maintain profitability or develop positive cash flow from our operations in the near term.
Historically, we have been reliant primarily on equity financings from the sale of our common stock and on debt financing in order to fund our operations. As detailed in the preceding paragraph, we have also relied to a limited extent on cash flows generated from our mining activities during Fiscal 2015, Fiscal 2013 and Fiscal 2012, however, we have yet to achieve profitability or develop positive cash flow from operations, and we do not expect to achieve profitability or develop positive cash flow from operations in the near term. Our reliance on equity and debt financings is expected to continue for the foreseeable future, and their availability whenever such additional financing is required will be dependent on many factors beyond our control and including, but not limited to, the market price of uranium, the continuing public support of nuclear power as a viable source of electricity generation, the volatility in the global financial markets affecting our stock price and the status of the worldwide economy, any one of which may cause significant challenges in our ability to access additional financing, including access to the equity and credit markets. We may also be required to seek other forms of financing, such as asset divestitures or joint venture arrangements to continue advancing our uranium projects which would depend entirely on finding a suitable third party willing to enter into such an arrangement, typically involving an assignment of a percentage interest in the mineral project. However, there is no assurance that we will be successful in securing any form of additional financing when required and on terms favorable to us.
Our operations are capital intensive and future capital expenditures are expected to be substantial. We will require significant additional financing to fund our operations, including continuing with our exploration and pre-extraction activities and acquiring additional uranium projects. In the absence of such additional financing, we would not be able to fund our operations, including continuing with our exploration and pre-extraction activities, which may result in delays, curtailment or abandonment of any one or all of our uranium projects.
For the fiscal year ending July 31, 2021 (“Fiscal 2021”), we estimate that a total of up to $2.4 million will be incurred on our mineral projects for permitting, exploration and pre-extraction activities. We hold mineral rights in the States of Arizona, Colorado, New Mexico, Texas and Wyoming, in Canada and in the Republic of Paraguay with annual land-related payments totaling $1.6 million to maintain these rights in good standing.
Our anticipated operations including exploration and pre-extraction activities, however, will be dependent on and may change as a result of our financial position, the market price of uranium and other considerations, and such change may include accelerating the pace or broadening the scope of reducing our operations as originally announced in September 2013. Our ability to secure adequate funding for these activities will be impacted by our operating performance, other uses of cash, the market price of uranium, the market price of our common stock and other factors which may be beyond our control. Specific examples of such factors include, but are not limited to:
|
● |
if the market price of uranium weakens; |
|
● |
if the weakness in the market price of our common stock weakens; |
|
● |
if we default on making scheduled payments of principal, interest and fees and complying with the restrictive covenants as required under our Credit Facility resulting in accelerated repayment of our indebtedness and/or enforcement by the Lenders against certain key assets securing our indebtedness; |
|
● |
if the COVID-19 pandemic worsens or continues over an extended period and causes further financial market uncertainty; and |
|
● |
if a nuclear incident, such as the event that occurred at Fukushima in March 2011 were to occur, continuing public support of nuclear power as a viable source of electricity generation may be adversely affected, which may result in significant and adverse effects on both the nuclear and uranium industries. |
Our continuation as a going concern beyond 12 months from the date this Annual Report is filed will be dependent upon our ability to obtain adequate additional financing, as our operations are capital intensive and future capital expenditures are expected to be substantial.
Our long-term success, including the recoverability of the carrying values of our assets and our ability to acquire additional uranium projects and continue with exploration and pre-extraction activities and mining activities on our existing uranium projects, will depend ultimately on our ability to achieve and maintain profitability and positive cash flow from our operations by establishing ore bodies that contain commercially recoverable uranium and to develop these into profitable mining activities.
Equity Financings
We filed a Form S-3 shelf registration statement under the Securities Act which was declared effective on March 10, 2017 (the “2017 Shelf”), providing for the public offer and sale of certain securities of our Company from time to time, at our discretion, of up to an aggregate offering amount of $100 million.
On October 3, 2018, we completed our October 2018 offering of 12,613,049 units at a price of $1.60 per unit for gross proceeds of $20,180,878 and each unit was comprised of one share of the Company and one-half of one share purchase warrant (the “October 208 Offering”). Each whole warrant entitles its holder to acquire one share at an exercise price of $2.05 per share, exercisable immediately upon issuance and expiring 30 months from the date of issuance.
On April 9, 2019, we entered into an At The Market Offering Agreement (the “Offering Agreement”) with H.C. Wainwright & Co., LLC (as the “Lead Manager”) and the co-managers set forth on the signature page of the Offering Agreement (each, a “Co-Manager” and, collectively, with the Lead Manager, the “Managers”); under which the Company may sell shares of its common stock having an aggregate offering price of up to $37.9 million through the Managers (collectively, the “ATM”). In connection with the ATM, on April 9, 2019, we filed a prospectus supplement to the 2017 Shelf providing for the public offer and sale of the Company’s shares having an aggregate offering price of up to $37.9 million through one or more at-the-market offerings pursuant to the ATM.
On February 21, 2020, we filed a Form S-3 shelf registration statement under the Securities Act which was declared effective by the SEC on March 3, 2020 (the “2020 Shelf”) providing for the public offer and sale of certain securities of the Company from time to time, at our discretion, up to an aggregate offering amount of $100 million. As a result of the 2020 Shelf, our 2017 Shelf was then deemed terminated and, as consequence, our then ATM terminated unless renewed under the 2020 Shelf.
On March 19, 2020, we entered into an Amending Agreement to the Offering Agreement with the Managers under which the Company may, from time to time, sell shares of its common stock having an aggregate offering price of up to $30 million through the Managers under its ATM through the 2020 Shelf. At July 31, 2020, no public offer or sale of the Company’s shares was completed under the ATM.
As at July 31, 2020, $30 million of the 2020 Shelf was utilized pursuant to the Amending Agreement to the Offering Agreement with the Managers under which the Company may sell shares of its common stock having an aggregate offering price of up to $30 million; and therefore, as at July 31, 2020 there was $70 million available under the 2020 Shelf.
Subsequent to July 31, 2020, on September 23, 2020, we completed our September 2020 Offering of 12,500,000 units at a price of $1.20 per unit for gross proceeds of $15,000,000. Each unit was comprised of one share of the Company and one-half of one share purchase warrant, and each whole warrant entitles its holder to acquire one share at an exercise price of $1.80 per share exercisable immediately upon issuance and expiring 24 months from the date of issuance. In connection with the September 2020 Offering, we also issued compensation share purchase warrants to agents as part of share issuance costs to purchase 583,333 shares of our Company exercisable at an exercise price of $1.80 per share and expiring 24 months from the date of issuance.
Credit Facility
On December 5, 2018, we entered into the Third Amended and Restated Credit Agreement with our Lenders, whereby we and the Lenders agreed to certain further amendments to our Credit Facility, under which initial funding of $10,000,000 was received by the Company upon closing of the Credit Facility on July 30, 2013, and additional funding of $10,000,000 was received by the Company upon closing of the amended Credit Facility on March 13, 2014.
Key terms of the Third Amended and Restated Credit Agreement are summarized as follows:
|
● |
the extension of the maturity date from January 1, 2020 to January 31, 2022; |
|
● |
the deferral of the prior monthly principal payments until the new maturity date of January 31, 2022; |
|
● |
the issuance of 1,180,328 shares on signing in Fiscal 2019 representing third extension fee shares equal to 7% of the principal balance outstanding or $1,400,000; and |
|
● |
the payment of anniversary fees to the Lenders on each of November 30, 2019, 2020 and 2021, of 7%, 6.5% and 6%, respectively, of the principal balance then outstanding, if any, payable at the option of the Company in cash or shares of the Company with a price per share calculated at a 10% discount to the five trading-day volume-weighted average price of the Company’s shares immediately prior to the applicable date. |
The Credit Facility is non-revolving with an amended term from inception of 8.5 years maturing on January 31, 2022, subject to an interest rate of 8% per annum, compounded and payable on a monthly basis.
The Third Credit Amended and Restated Agreement supersedes, in their entirety, the Company’s prior Second Amended and Restated Credit Agreement, dated and effective February 9, 2016, the Amended and Restated Credit Agreement, dated and effective March 13, 2014, and the Credit Agreement dated and effective July 30, 2013, with our Lenders.
During Fiscal 2020, and pursuant to the terms of the Third Amended and Restated Credit Agreement, we issued an aggregate of 1,743,462 shares to our Lenders, with a fair value of $1,400,000, representing 7% of the $20,000,000 principal balance outstanding, as payment of anniversary fees to our Lenders.
During Fiscal 2018, and pursuant to the terms of the Second Amended and Restated Credit Agreement, we issued an aggregate of 641,574 shares with a fair value of $900,000, representing 4.5% of the $20,000,000 principal balance outstanding, as payment of anniversary fees to the Lenders.
Refer to “Long-Term Debt Obligations” under Material Commitments and to Note 9: Long-Term Debt to the Consolidated Financial Statements herein.
Government Loans
In April 2020, our Canadian subsidiary received a loan of $29,842 (CAD$40,000) under the CEBA Program, which provides financial relief for Canadian small businesses during the COVID-19 pandemic. The CEBA Loan has an initial term date on December 31, 2022 (the “Initial Term Date”) and may be extended to December 31, 2025. The CEBA Loan is non-revolving, with an interest rate being 0% per annum prior to the Initial Term Date and 5% per annum thereafter during any extended term.
On April 28, 2020, we entered into a business loan agreement with Kleberg Bank, N.A., under the Paycheck Protection Program administered by the Small Business Administration, which is a part of the Coronavirus Aid, Relief, and Economic Security Act enacted by the U.S. Congress in response to the COVID-19 pandemic. The total loan amount we qualified for was $277,250, which was received on May 5, 2020.
Under the PPP Program the repayment of PPP Loan, including interest, will be forgiven based on payroll, payroll-related and other allowable costs incurred in the eight-week period following the funding of the loan pursuant to the following requirements:
| ● |
that not less than 60% of the loan proceeds be applied to eligible payroll costs; |
| ● |
that the remaining 40% of the loan proceeds be applied to any additional payroll costs above 60%, rent payments on leases dated before February 15, 2020 and/or utility payments under any services agreements dated before February 15, 2020; and |
| ● |
to maintain employee compensation levels (subject to specific program requirements). |
The PPP Program provides for an initial six-month deferral of payments, which is subsequently deferred by another 10 months. The PPP Loan has a two-year maturity ending on April 28, 2022 with an interest rate of 1% per annum. We have submitted application of forgiveness for the PPP Loan and the application is still in process at the date of the Annual Report.
Operating Activities
During Fiscal 2020, net cash used in operating activities totaled $12,870,711 (Fiscal 2019: $12,573,468; Fiscal 2018: $12,511,289), primarily for maintaining production readiness, mineral property expenditures and general and administrative expenses.
Financing Activities
During Fiscal 2020, net cash provided by financing activities totaled $307,092, consisting of $277,250 from the PPP Loan and $29,842 from the CEBA Loan. During Fiscal 2019, we completed our October 2018 Offering of 12,613,049 units at a price of $1.60 per unit and received net proceeds of $18,969,211. In addition, we received net proceeds of $4,822,357 from the exercise of share purchase warrants and $72,363 from the exercise of stock options. During Fiscal 2018, we received net proceeds of $604,209 from the exercise of share purchase warrants and stock options.
Investing Activities
During Fiscal 2020, net cash provided by the investing activities totaled $11,670,960, primarily from cash received from the redemption of term deposits totaling $11,831,671, offset by cash used in the investment in mineral rights and properties of $80,000 and cash used in the purchase of property, plant and equipment of $83,838. During Fiscal 2019, net cash used by investing activities totaled $12,107,371, primarily for cash used for investments in term deposits totaling $29,858,126, cash used in the investment in mineral rights and properties totaling $155,000, and cash used in the purchase of equipment totaling $137,287, offset by cash received from redemption of term deposits totaling $18,026,455. During Fiscal 2018, cash provided by investing activities totaled $6,341,501, primarily from cash received from the redemption of term deposits totaling $31,771,253, cash and restricted cash received from a mineral property acquisition of $289,038, offset by cash used for investments in term deposits totaling $21,771,253, cash used in the acquisition of mineral rights and properties totaling $3,588,759, and cash used in other non-current assets totaling $346,474.
Stock Options and Warrants
At July 31, 2020, the Company had 15,514,750 stock options outstanding at a weighted-average exercise price of $1.13 per share and 7,721,981 share purchase warrants outstanding at a weighted-average exercise price of $2.03 per share. At July 31, 2020, outstanding stock options and share purchase warrants represented a total 23,236,731 shares issuable for gross proceeds of approximately $33.2 million should these stock options and share purchase warrants be exercised in full. At July 31, 2020, outstanding in-the-money stock options and share purchase warrants represented a total 7,869,500 shares exercisable for gross proceeds of approximately $7.2 million should these in-the-money stock options and warrants be exercised in full. The exercise of these stock options and share purchase warrants is at the discretion of the respective holders and, accordingly, there is no assurance that any of these stock options or share purchase warrants will be exercised in the future.
Plan of Operations
For Fiscal 2021, uranium extraction at PAA-1, 2 and 3 of our Palangana Mine is expected to continue being operated at a reduced pace, including the deferral of major pre-extraction expenditures and to remain in a state of operational readiness in anticipation of a recovery in uranium prices. Due to the COVID-19 pandemic, previous plans to resume last year’s successful drilling program at our Burke Hollow Project has been postponed along with the associated capital outlays until market conditions normalize.
Material Commitments
Long-term Debt Obligations
The Credit Facility described above requires scheduled payments of principal, interest and fees and includes restrictive covenants that, among other things, limit our ability to sell the assets securing our indebtedness or to incur additional indebtedness other than permitted indebtedness. Our ability to make these scheduled payments will be dependent on, and may change as a result of, our financial condition and operating performance. If we become unable to make these scheduled payments or if we do not comply with any one or more of these covenants, we could be in default which, if not addressed or waived, could require accelerated repayment of our indebtedness. Furthermore, such default could result in the enforcement by our Lenders against the Company’s assets securing our indebtedness. These are key assets on which our business is substantially dependent and as such, the enforcement against any one or all of these assets would have a material adverse effect on our operations and financial condition.
As at July 31, 2020, we complied with all of the covenants under the Credit Facility, and we expect to continue complying with all scheduled payments and covenants during Fiscal 2021.
As at July 31, 2020, significant payment obligations of the Company over next five years and beyond are as follows:
|
Payment Due by Period |
||||||||||||||||||||
|
Contractual Obligations |
Total |
Less Than 1 Year |
1-3 Years |
3-5 Years |
More Than 5 Years |
|||||||||||||||
|
Long-Term Debt Obligations - Principal |
$ | 20,000,000 | $ | - | $ | 20,000,000 | $ | - | $ | - | ||||||||||
|
Long-Term Debt Obligations - Interests and Fees |
4,940,000 | 2,922,222 | 2,017,778 | - | - | |||||||||||||||
|
Asset Retirement Obligations |
8,221,018 | - | - | - | 8,221,018 | |||||||||||||||
|
Operating Lease Obligations |
808,793 | 228,648 | 240,145 | 40,000 | 300,000 | |||||||||||||||
|
Total |
$ | 33,969,811 | $ | 3,150,870 | $ | 22,257,923 | $ | 40,000 | $ | 8,521,018 | ||||||||||
At July 31, 2020, we were renting or leasing office premises in Texas and Wyoming, U.S., Vancouver, British Columbia, Canada, and Paraguay for total monthly payments of $18,000. Office lease agreements for the U.S. and Canada expire between March 2021 and August 2021.
Commitments for Management Services
At July 31, 2020, we were committed to paying our key executives a total of $703,000 per year for management services.
Off-Balance Sheet Arrangements
We do not have any off-balance sheet arrangements that have or are reasonably likely to have a current or future material effect on our financial condition, changes in financial condition, revenues or expenses, results of operations, liquidity, capital expenditures or capital resources.
Critical Accounting Policies
For a complete summary of all of our significant accounting policies, refer to Note 2: Summary of Significant Accounting Policies of the Notes to the Consolidated Financial Statements as presented under Item 8. Financial Statements and Supplementary Data herein.
The preparation of financial statements in conformity with U.S. GAAP requires management to make estimates and assumptions that affect the reported amount of assets and liabilities and disclosure of contingent assets and liabilities at the date of the financial statements and the reported revenues and expenses during the reported periods. Significant areas requiring management’s estimates and assumptions include valuation and measurement of impairment losses on mineral rights and properties, valuation of stock-based compensation, and valuation of asset retirement obligations. Other areas requiring estimates include allocations of expenditures to inventories, depletion and amortization of mineral rights and properties and depreciation of property, plant and equipment. Actual results could differ significantly from those estimates and assumptions. The following summary provides a description of our critical accounting policies.
Mineral Rights and Exploration Stage
Acquisition costs of mineral rights are initially capitalized as incurred while exploration and pre-extraction expenditures are expensed as incurred until such time proven or probable reserves, as defined by the SEC under Industry Guide 7, are established for that project.
We have established the existence of mineralized materials for certain uranium projects, including our Palangana Mine. However, we have not established proven or probable reserves for any of our uranium projects, including the Palangana Mine. Furthermore, we have no plans to establish proven or probable reserves for any of our uranium projects for which we plan on utilizing ISR mining, such as the Palangana Mine. As a result, and despite the fact that we commenced extraction of mineralized materials at the Palangana Mine in November 2010, we remain in the Exploration Stage as defined under Industry Guide 7, and will continue to remain in the Exploration Stage until such time proven or probable reserves have been established.
Companies in the Production Stage, as defined by the SEC under Industry Guide 7, having established proven and probable reserves and exited the Exploration Stage, typically capitalize expenditures relating to ongoing development activities, with corresponding depletion calculated over proven and probable reserves using the units-of-production method and allocated to future reporting periods to inventory and, as that inventory is sold, to cost of goods sold. Since we are in the Exploration Stage, it has resulted in our reporting of larger losses than if we had been in the Production Stage due to the expensing, instead of capitalization, of expenditures relating to ongoing mill and mine development activities. Additionally, there would be no corresponding amortization allocated to our future reporting periods since those costs would have been expensed previously, resulting in both lower inventory costs and cost of goods sold and results of operations with higher gross profits and lower losses than if we had been in the Production Stage. Any capitalized costs, such as expenditures relating to the acquisition of mineral rights, are depleted over the estimated extraction life using the straight-line method. As a result, our consolidated financial statements may not be directly comparable to the financial statements of companies in the Production Stage.
Impairment of Long-lived Assets
Long-lived assets are reviewed for impairment whenever events or changes in circumstances indicate the carrying amount of an asset may not be recoverable. Circumstances which could trigger a review include, but are not limited to: significant decreases in the market price of the asset; significant adverse changes in the business climate or legal factors; accumulation of costs significantly in excess of the amount originally expected for the acquisition or construction of the asset; current period cash flow or operating losses combined with a history of losses or a forecast of continuing losses associated with the use of the asset; and current expectation that the asset will more likely than not be sold or disposed of significantly before the end of its estimated useful life. Recoverability of these assets is measured by comparing the carrying value to the future undiscounted cash flows expected to be generated by the assets. When the carrying value of an asset exceeds the related undiscounted cash flows, an impairment loss is recorded by writing down the carrying value of the related asset to its estimated fair value, which is determined using discounted future cash flows or other measures of fair value.
Restoration and Remediation Costs (Asset Retirement Obligations)
Various federal and state mining laws and regulations require our Company to reclaim the surface areas and restore underground water quality to the pre-existing quality or class of use after the completion of mining. We recognize the present value of the future restoration and remediation costs as an asset retirement obligation in the period in which we incur an obligation associated with the retirement of tangible long-lived assets that result from the acquisition, construction, development and/or normal use of the assets.
Asset retirement obligations (AROs) consist of estimated final well closure, plant and equipment decommissioning and removal and environmental remediation costs to be incurred by our Company in the future. The asset retirement obligation is estimated based on the current costs escalated at an inflation rate and discounted at a credit adjusted risk-free rate. The asset retirement obligations are capitalized as part of the costs of the underlying assets and amortized over its remaining useful life. The asset retirement obligations are accreted to an undiscounted value until they are settled. The accretion expenses are charged to earnings and the actual retirement costs are recorded against the asset retirement obligations when incurred. Any difference between the recorded asset retirement obligations and the actual retirement costs incurred will be recorded as a gain or loss in the period of settlement.
Stock-based Compensation
We measure stock-based awards at fair value on the date of the grant and expense the awards in our Consolidated Statements of Operations and Comprehensive Loss over the requisite service period of employees or consultants. The fair value of stock options is determined using the Black-Scholes valuation model. The fair value of restricted stock units (“RSUs”) is determined using the share price of the Company at the date of grant. The fair value of performance based restricted stock units (“PRSUs”) is determined using a Monte Carlo simulation model. Stock-based compensation expense related to stock option awards is recognized over the requisite service period on an accelerating basis. Forfeitures are accounted for as they occur.
Accounting Developments
Effective August 1, 2019, we adopted ASC 2016-02, “Leases”, together with subsequent amendments. The new standard requires a lessee to recognize on the balance sheet a liability to make lease payments (the lease liability) and right-of-use (“ROU”) asset representing the right to the underlying asset for the lease term.
Refer to Note 2: Summary of Significant Accounting Policies of the Notes to our Consolidated Financial Statements herein. We do not anticipate that any other recently adopted or recently issued accounting pronouncements will have a material effect on our consolidated financial statements.
Subsequent Event
Subsequent to July 31, 2020, we completed our September 2020 Offering of 12,500,000 units at a price of $1.20 per unit for gross proceeds of $15,000,000. The net proceeds of the September 2020 Offering will be used to fund exploration and development expenditures at the Company’s projects and for general corporate and working capital purposes.
Item 7A. Quantitative and Qualitative Disclosures About Market Risk
Our exposure to market risks includes, but is not limited to, equity price risk, uranium price risk, foreign currency risk, country risk and interest rate risk.
Equity Price Risk
We are subject to market risk related to the market price of our common stock which trades on the NYSE American. Historically, we have relied upon equity financings from the sale of our common stock to fund our operations. Movements in the price of our common stock have been volatile in the past and may continue to be volatile in the future. As a result, there is risk that we may not be able to complete an equity financing at an acceptable price when required.
Uranium Price Risk
We are subject to market risk related to the market price of uranium. At July 31, 2020, we had no uranium supply or off-take agreements in place. Since future sales of uranium concentrates are expected to generally occur through the uranium spot market, fluctuations in the market price of uranium would have a direct impact on our revenues, results of operations and cash flows. We do not use derivative financial instruments for speculative trading purposes, nor do we hedge our uranium price exposure to manage our uranium price risk.
Foreign Currency Risk
We are subject to market risk related to foreign currency exchange rate fluctuations. Our functional currency is the United States dollar, however, a portion of our business is transacted in other currencies including the Canadian dollar and the Paraguayan Guarani. To date, these fluctuations have not had a material impact on our results of operations. We do not use derivative financial instruments for speculative trading purposes, nor do we hedge our foreign currency exposure to manage our foreign currency fluctuation risk.
Country Risk
We are subject to market risk related to our operations in foreign jurisdictions. We hold two significant uranium projects and one significant titanium project in Paraguay. Operations in foreign jurisdictions outside of the U.S. and Canada, especially in developing countries, may be subject to additional risks as they may have different political, regulatory, taxation, economic and cultural environments that may adversely affect the value or continued viability of our rights.
Interest Rate Risk
Our term debt has fixed interest rates and we have no significant exposure to interest rate fluctuation risk.
Item 8. Financial Statements and Supplementary Data
Financial Statements
The consolidated financial statements and related information as listed below for the fiscal year ended July 31, 2020, are included in this Annual Report beginning on page F-1:
|
● |
Reports of Independent Registered Public Accounting Firms; |
|
● |
Consolidated Balance Sheets; |
|
● |
Consolidated Statements of Operations and Comprehensive Loss; |
|
● |
Consolidated Statements of Cash Flows; |
|
● |
Consolidated Statements of Stockholders’ Equity; and |
|
● |
Notes to the Consolidated Financial Statements. |
Supplementary Financial Information
The selected unaudited financial data for each of the quarters for our two most recent fiscal years are presented below:
|
For the Quarters Ended |
||||||||||||||||
|
July 31, 2020 |
April 30, 2020 |
January 31, 2020 |
October 31, 2020 |
|||||||||||||
|
Net loss |
$ | (4,405,634 | ) | $ | (3,273,644 | ) | $ | (1,888,661 | ) | $ | (5,042,577 | ) | ||||
|
Total comprehensive loss |
(4,009,649 | ) | (3,752,792 | ) | (1,928,309 | ) | (5,052,471 | ) | ||||||||
|
Basic and diluted loss per share |
(0.02 | ) | (0.02 | ) | (0.01 | ) | (0.03 | ) | ||||||||
|
Total assets |
91,389,617 | 93,647,447 | 96,514,311 | 96,696,496 | ||||||||||||
|
For the Quarters Ended |
||||||||||||||||
|
July 31, 2019 |
April 30, 2019 |
January 31, 2019 |
October 31, 2018 |
|||||||||||||
|
Net loss |
$ | (6,334,132 | ) | $ | (5,017,557 | ) | $ | (2,349,674 | ) | $ | (3,451,426 | ) | ||||
|
Total comprehensive loss |
(6,199,949 | ) | (5,177,511 | ) | (2,311,442 | ) | (3,451,426 | ) | ||||||||
|
Basic and diluted loss per share |
(0.04 | ) | (0.03 | ) | (0.01 | ) | (0.02 | ) | ||||||||
|
Total assets |
101,040,242 | 105,055,912 | 106,958,178 | 108,046,108 | ||||||||||||
Item 9. Changes in and Disagreements with Accountants on Accounting and Financial Disclosure
None.
Item 9A. Controls and Procedures
Evaluation of Disclosure Controls and Procedures
Our management, with the participation of our Principal Executive Officer and Principal Financial Officer, has evaluated the effectiveness of our internal controls over financial reporting (“ICFR”) and disclosure controls and procedures (“DC&P”) (as such terms are defined in Rules 13a-15(e) and 15d-15(e) under the Exchange Act), as of the end of the period covered by this Annual Report. ICFR is a framework designed to provide reasonable assurance regarding the reliability of financial reporting and the preparation of financial statements for external purposes in accordance with U.S. GAAP. Management has used the Internal Control – Integrated Framework issued by the Committee of Sponsoring Organizations of the Treadway Commission in 2013 (‘‘COSO’’) in order to assess the effectiveness of the Company’s ICFR. Based on such evaluation, our Principal Executive Officer and Principal Financial Officer have concluded that, as of the end of the period covered by this Annual Report, our ICFR was effective.
It should be noted that any system of controls is based in part upon certain assumptions designed to obtain reasonable (and not absolute) assurance as to its effectiveness, and there can be no assurance that any design will succeed in achieving its stated goals.
Management’s Report on Internal Control Over Financial Reporting
Management of the Company is responsible for establishing and maintaining adequate ICFR and DC&P as required by the Sarbanes-Oxley Act (“SOX”) Section 404(a). Due to its inherent limitations, ICFR may not prevent or detect misstatements on a timely basis. Also, projections of any evaluation of the effectiveness of ICFR to future periods is subject to the risk that the controls may become inadequate because of changes in conditions, or that the degree of compliance with the policies or procedures may deteriorate.
In our assessment of the effectiveness of our Company’s internal control over financial reporting as at July 31, 2019, material weaknesses were identified in assessing the complexity of the valuation and accounting of a significant non-routine transaction, in a control surrounding information technology general control (“ITGC”), and in our Risk Assessment and Control Activity components of the COSO Framework related to the aggregation of open control deficiencies across our financial reporting process. In particular, the design and documentation of controls around: (i) testing the Company’s Code of Business Conduct and Ethics; (ii) the adoption of new accounting standards; and (iii) accounting for our equity-accounted investment were insufficient. A material weakness is a deficiency, or combination of deficiencies, in internal control over financial reporting such that there is a reasonable possibility that a material misstatement of the Company’s annual or interim financial statements could not be prevented or detected on a timely basis.
During Fiscal 2020, in response to the material weakness relating the significant non-routine transaction, we redesigned the control procedures surrounding significant non-routine transactions and implemented the control procedures in an identified significant non-routine transaction, where we followed proper procedures to identify the complexity of this transaction and engaged an external consultant with expertise in that area. The controls relating to significant non-routine transaction were tested and management has concluded that, through this testing, the identified material weakness relating to significant non-routine transaction has been remediated and that these controls are operating effectively as of July 31, 2020.
During Fiscal 2020, in response to the material weakness relating to ITGC, we reassigned and restricted certain access rights of a senior financial person to our accounting system in order to ensure sufficient segregation of duties. The controls relating to ITGC were tested, and management has concluded that, through this testing, the identified material weakness relating to internal controls over ITGC has been remediated and that these controls are operating effectively as of July 31, 2020.
During Fiscal 2020, in response to the material weakness in our Risk Assessment and Control Activity components of the COSO Framework, we designed and implemented a new control for the review of the Company’s Code of Business Conduct and Ethics whereby a staff was designated to review the responses from the Code of Conduct survey and when an exception is identified, proper actions to address the exception are taken. In addition, we have designed, documented and implemented formal control procedures around accounting for the equity-accounted investment. Furthermore, we redesigned and implemented new control procedures for adoption of new accounting standards. The controls relating to Risk Assessment and Control Activity components of the COSO Framework were tested, and management has concluded that, through this testing, the identified material weakness relating to Risk Assessment and Control Activity components of the COSO Framework has been remediated and that these controls are operating effectively as of July 31, 2020.
As of July 31, 2020, management assessed the effectiveness of the Company’s internal control over financial reporting based on the criteria set forth in Internal Control - Integrated Framework (2013) issued by the Committee of Sponsoring Organizations of the Treadway Commission. Based on that evaluation, the Company’s management concluded that, as of July 31, 2020, the Company’s internal controls over financial reporting were effective.
Changes in Internal Controls
Except for the remediation procedures implemented by the Company as described above, there have been no other changes in our internal controls over financial reporting (as defined in Rules 13a-15(f) and 15d-15(f) under the Exchange Act) that occurred during the fourth fiscal quarter for the fiscal year ended July 31, 2020, that have materially affected, or are reasonably likely to materially affect, our internal controls over financial reporting.
Item 9B. Other Information
Not applicable.
Part iii
Item 10. Directors, Executive Officers and Corporate Governance
Our directors and executive officers and their respective ages as of October 27, 2020 are as follows:
|
Name |
Age |
Position with the Company |
|
Amir Adnani |
42 |
President, Chief Executive Officer, Principal Executive Officer and a director |
|
Spencer Abraham |
68 |
Chairman and a director |
|
David Kong |
74 |
Lead independent director |
|
Vincent Della Volpe |
78 |
A director |
|
Ganpat Mani |
73 |
A director |
|
Gloria Ballesta |
45 |
A director |
|
Pat Obara |
64 |
Secretary, Treasurer, Chief Financial Officer and Principal Accounting Officer |
|
Scott Melbye |
58 |
Executive Vice President |
The following describes the business experience of each of our directors, including other directorships held in reporting companies.
Amir Adnani. Amir Adnani is a founder of the Company and has served as our President, Chief Executive Officer and a director since January 2005. Under his leadership, we have moved from concept to initial extraction in the United States in five years and we have developed a pipeline of low-cost, near-term production projects.
Mr. Adnani has been invited to speak at prominent industry conferences organized by the International Atomic Energy Agency, World Nuclear Fuel Market and the Milken Institute. He is a frequent contributor to the business media, including The Wall Street Journal, Bloomberg, CNBC and Fox Business News.
Fortune magazine distinguished Mr. Adnani on their “40 Under 40, Ones to Watch” list of North American executives. He was selected as one of “Mining’s Future Leaders” by Mining Journal, a UK-based global industry publication. He was a nominee for Ernst & Young’s “Entrepreneur of the Year” distinction.
Mr. Adnani is the founder and Chairman of GoldMining Inc., a publicly-listed gold acquisition and development company and is the Chairman of Uranium Royalty Corp., a publicly-listed uranium royalty company. Mr. Adnani holds a Bachelor of Science degree from the University of British Columbia and is a director of the university’s Alumni Association.
Spencer Abraham. Spencer Abraham has served as Chairman (non-executive) of our Board of Directors since March 2017. Mr. Abraham served as Executive Chairman from October 2015 to March 2017 and as the Chairman of our Advisory Board from December 2012 to October 2015. Mr. Abraham is the Chairman and Chief Executive Officer of The Abraham Group LLC, an international strategic consulting firm based in Washington, D.C. President George W. Bush selected Mr. Abraham as the tenth Secretary of Energy of the United States in 2001. During his tenure at the Energy Department from 2001 to 2005, Mr. Abraham developed policies and regulations to ensure the nation’s energy security, was responsible for the U.S. Strategic Petroleum Reserve, oversaw domestic oil and gas development policy and nuclear energy policy, developed relationships with international governments, including members of the Organization of the Petroleum Exporting Countries, and led the landmark nuclear nonproliferation HEU program between the United States and Russia. Mr. Abraham served as a United States Senator for the State of Michigan from 1995 to 2001. At a time when the Trump Administration and Congress are considering significant issues pertaining to the U.S. uranium mining sector, Mr. Abraham’s expertise in the public policy arena is especially valuable and he is very actively involved in working with the Company to address these matters.
Mr. Abraham has served as a director of Two Harbors Investment Corp. (NYSE: TWO) since May 2014, as a director of PBF Energy Inc. (NYSE: PBF) since October 2012 and as a director of NRG Energy, Inc. (NYSE: NRG) since December 2012. Mr. Abraham served as a director of GenOn Energy, Inc. from January to December 2012, when it was acquired by NRG Energy, Inc. Previously, Mr. Abraham served as a director of Occidental Petroleum Corporation (NYSE: OXY) from 2005 to May 2020, as the non-executive Chairman of the Board of Directors of AREVA Inc., the North American subsidiary of AREVA, and on the boards of several other public and private companies.
Mr. Abraham holds a Juris Doctor degree from Harvard Law School and is an alumnus of Michigan State University.
David Kong. David Kong has served on our Board of Directors since January 2011 and serves as our lead independent director. Mr. Kong serves as a director of New Pacific Metals Corp., a public company listed on the Toronto Stock Exchange (the “TSX”) since November 2010, as a director of Silvercorp Metals Inc., a public company listed on the TSX and the NYSE American since November 2011, and as a director of GoldMining Inc., a public company listed on the TSX and NYSE American since October 2010.
Previously, Mr. Kong served as a director of New Era Minerals Inc., a public company listed on the TSX Venture Exchange (the “TSX-V”) from June 2014 to April 2016.
Mr. Kong holds a Bachelor in Business Administration and earned his Chartered Accountant designation (CPA, CA) in British Columbia, Canada, in 1978. Mr. Kong was a partner at Ellis Foster, Chartered Accountants from 1981 to 2004, before merging with Ernst & Young LLP, Chartered Professional Accountants, in 2005, where he was a partner until 2010. Mr. Kong is a certified director (ICD.D) of the Institute of Corporate Directors.
Vincent Della Volpe. Vincent Della Volpe has served on our Board of Directors since July 2007. Mr. Della Volpe has served as a professional money manager for over 35 years, including as a senior portfolio manager of pension funds for Honeywell Corporation and senior vice president of the YMCA Retirement fund in New York. Throughout his career, Mr. Della Volpe has particularly focused on the management of energy and utility equity portfolios, and he also has experience managing venture capital investments. Mr. Della Volpe holds a Bachelor of Arts in Accounting and an MBA in finance, both from Seton Hall University.
Ganpat Mani. Ganpat Mani has served on our Board of Directors since June 2014 and as a director of Uranium Participation Corporation since July 2014. From 2009 to 2013, Mr. Mani was President and Chief Executive Officer of ConverDyn, a partnership between affiliates of Honeywell International Inc. and General Atomics, which specializes in the nuclear fuel conversion trade. During this time, he also served as a director of the Nuclear Energy Institute and was a member of the U.S. Civil Nuclear Trade Advisory Committee. Mr. Mani is a highly-experienced negotiator of contracts with major private and state-owned corporations in Asia, Europe and the U.S. Notably, Mr. Mani negotiated the agreement for the return of uranium feed from the Metropolis conversion facility under the Megatons to Megawatts program between the U.S. and Russia. He also met with government and industry organizations as part of the U.S. Department of Commerce’s multiple nuclear trade missions to India.
From 1994 to 2007, Mr. Mani held several senior marketing positions with ConverDyn, including having served as Senior Vice President. At ConverDyn he was responsible for relations with major nuclear utilities in Asia, Europe and the U.S. and with enrichment companies in Europe and the U.S. Mr. Mani has prepared position papers and draft legislative language for, and represented ConverDyn in, meetings with the United States Departments of Commerce, Energy and State and with industry trade organizations. From 1973 to 1994, Mr. Mani worked at Honeywell International Inc. (formerly Allied-Signal Inc.) where his career spanned a variety of functional areas and product lines.
Mr. Mani holds an MBA from Rutgers University and a Bachelor of Technology Degree in Metallurgical Engineering from Loughborough University, United Kingdom.
Gloria Ballesta. Gloria Ballesta has served on our Board of Directors since July 2018. Ms. Ballesta is the Chief Executive Officer of Content Mode SAS, a contact center based in Colombia, since January 2016, and serves as a director of GoldMining Inc., a public company listed on the TSX and NYSE American since August 2010. Ms. Ballesta has experience managing administrative and compliance procedures for spin-offs, take-overs and financings of various public companies. Ms. Ballesta holds an LLB (Hons.) from the CEU Cardenal Herrera University in Spain and a Master's degree in Marketing and Business Management from ESIC School of Business in Spain.
The following describes the business experience of each of the non-director executive officers of the Company:
Pat Obara. Pat Obara has served as our Secretary, Treasurer and Chief Financial Officer since October 2015, and served as our Chief Financial Officer from August 2006 to January 2011 and as our Vice President Administration from January 2011 to October 2015. Mr. Obara currently serves as the Chief Financial Officer and Secretary of GoldMining Inc., a public company listed on the TSX and NYSE American, and served as a director of GoldMining Inc. from September 2009 to May 2018. Mr. Obara holds a degree in Building Technology, Land and Construction Economics from the British Columbia Institute of Technology.
Scott Melbye. Mr. Melbye has served as our Executive Vice President since September 2014. Mr. Melbye is a 36-year veteran of the nuclear energy industry having held key leadership positions in major global uranium mining companies and various industry organizations. He has passionately promoted the growth and competitiveness of the nuclear fuel cycle in supporting nuclear power as a clean, affordable and reliable source of energy to meet the world’s ever-expanding needs.
As our Executive Vice President, Mr. Melbye is responsible for the uranium marketing and sales function and is a key contributor towards the achievement of the Company’s strategic growth objectives. Mr. Melbye currently serves as the Chief Executive Officer, President and a director of Uranium Royalty Corp., a public company listed on the TSX-V. From 2014 to 2018, Mr. Melbye served as the Vice President, Commercial at Uranium Participation Corporation, managing a publicly traded fund which allows investors to speculate on physical uranium holdings. Concurrently at that time, Mr. Melbye served as an Advisor to the Chairman of Kazatomprom, the world’s leading uranium producer in Kazakhstan, guiding their business transformation process as it related to marketing and sales strategy. Through June 2014, Mr. Melbye was Executive Vice President, Marketing for Uranium One, responsible for global sales activities, where he expanded the company’s forward book, particularly in the emerging markets of the United Arab Emirates and China. He also supported the global investor-relations efforts of the CEO during the time that Uranium One was publicly traded on the TSX. Uranium One is among the world’s top four uranium producers from its mines in Kazakhstan and the United States, and is the wholly-owned mining subsidiary of the Russian nuclear energy company Rosatom.
Prior to this, Mr. Melbye spent 22 years with the Cameco Group of companies, both in the Saskatoon head office and with their U.S. subsidiaries. He most recently served as President of Cameco Inc., the subsidiary responsible for managing that company’s world-wide uranium marketing and trading activities (annual sales exceeding 30 million pounds U3O8 through established relationships with most global nuclear utilities). Mr. Melbye’s previous experience includes uranium brokerage and trading at Nukem Inc. in New York, and nuclear fuel procurement at the Palo Verde Nuclear Generating Station in Arizona.
Mr. Melbye is a frequent speaker at nuclear industry conferences and has participated in numerous high-level, United States and Canadian trade missions to markets such as China, India, United Arab Emirates and Mexico. In 1999, Mr. Melbye provided expert testimony in support of Kazakhstan before the International Trade Commission in Washington, D.C., which lifted trade restrictions on Kazakh uranium in the United States. He is a past Chair of the Board of Governors of the World Nuclear Fuel Market and former President of the Uranium Producers of America (“UPA”). The UPA is the domestic uranium mining industry organization which promotes rational regulatory policy and responsible disposition of United States Department of Energy inventories, a topic in which Mr. Melbye testified before the House Oversight Committee in 2015. Mr. Melbye has been active in grassroots Republican politics, having worked on two United States Senate races and serving on a statewide leadership team for Bush/Cheney ’04. Mr. Melbye received a Bachelor of Science in Business Administration with degree specialization in International Business from Arizona State University in 1984.
Term of Office
All of our directors hold office until the next annual general meeting of the shareholders or until their successors are elected and qualified. Our officers are appointed by our Board of Directors and hold office until their successors are appointed and qualified.
Significant Employees
There are no significant employees other than our executive officers.
Family Relationships
There is no family relationship between any of our executive officers or directors.
Audit Committee
Our Board of Directors has established an Audit Committee that operates under a written charter approved by the Board of Directors. Our Audit Committee has been structured to comply with Rule 10A-3 under the Exchange Act. Our Audit Committee is comprised of David Kong, Vincent Della Volpe and Gloria Ballesta, all of whom meet the audit committee member independence standards of the NYSE American. Mr. Kong is the Chairman of the Audit Committee. Our Board of Directors has determined that Mr. Kong satisfies the criteria for an audit committee financial expert under Item 407(d)(5) of Regulation S-K of the rules of the SEC.
Involvement in Certain Legal Proceedings
Except as disclosed in this Annual Report, during the past ten years none of the following events have occurred with respect to any of our directors or executive officers:
|
1. |
a petition under the federal bankruptcy laws or any state insolvency law was filed by or against, or a receiver, fiscal agent or similar officer was appointed by a court for the business or property of such person, or any partnership in which he was a general partner at or within two years before the time of such filing, or any corporation or business association of which he was an executive officer at or within two years before the time of such filing; |
|
2. |
such person was convicted in a criminal proceeding or is a named subject of a pending criminal proceeding (excluding traffic violations and other minor offenses); |
|
3. |
such person was the subject of any order, judgment, or decree, not subsequently reversed, suspended or vacated, of any court of competent jurisdiction, permanently or temporarily enjoining him from, or otherwise limiting, the following activities: |
|
i) |
acting as a futures commission merchant, introducing broker, commodity trading advisor, commodity pool operator, floor broker, leverage transaction merchant, any other person regulated by the Commodity Futures Trading Commission, or an associated person of any of the foregoing, or as an investment adviser, underwriter, broker or dealer in securities, or as an affiliated person, director or employee of any investment company, bank, savings and loan association or insurance company, or engaging in or continuing any conduct or practice in connection with such activity; |
|
ii) |
engaging in any type of business practice; or |
|
iii) |
engaging in any activity in connection with the purchase or sale of any security or commodity or in connection with any violation of federal or state securities laws or federal commodities laws; |
|
4. |
such person was the subject of any order, judgment or decree, not subsequently reversed, suspended or vacated, of any federal or state authority barring, suspending or otherwise limiting for more than 60 days the right of such person to engage in any activity described in paragraph (3)(i) above, or to be associated with persons engaged in any such activity; |
|
5. |
such person was found by a court of competent jurisdiction in a civil action or by the SEC to have violated any federal or state securities law, and the judgment in such civil action or finding by the SEC has not been subsequently reversed, suspended, or vacated; |
|
6. |
such person was found by a court of competent jurisdiction in a civil action or by the Commodity Futures Trading Commission to have violated any federal commodities law, and the judgment in such civil action or finding by the Commodity Futures Trading Commission has not been subsequently reversed, suspended or vacated; |
|
7. |
such person was the subject of, or a party to, any federal or state judicial or administrative order, judgment, decree, or finding, not subsequently reversed, suspended or vacated, relating to an alleged violation of: |
|
i) |
any federal or state securities or commodities law or regulation; or |
|
ii) |
any law or regulation respecting financial institutions or insurance companies including, but not limited to, a temporary or permanent injunction, order of disgorgement or restitution, civil money penalty or temporary or permanent cease-and-desist order, or removal or prohibition order; or |
|
iii) |
any law or regulation prohibiting mail or wire fraud or fraud in connection with any business entity; or |
|
8. |
such person was the subject of, or a party to, any sanction or order, not subsequently reversed, suspended or vacated, of any self-regulatory organization (as defined in Section 3(a)(26) of the Exchange Act), any registered entity (as defined in Section 1(a)(29) of the Commodity Exchange Act), or any equivalent exchange, association, entity or organization that has disciplinary authority over its members or persons associated with a member. |
Code of Business Conduct and Ethics
We have adopted a Code of Business Conduct and Ethics (the “Code”) that applies to all directors and officers. The Code describes the legal, ethical and regulatory standards that must be followed by the directors and officers of the Company and sets forth high standards of business conduct applicable to each director and officer. As adopted, the Code sets forth written standards that are designed to deter wrongdoing and to promote, among other things:
|
● |
honest and ethical conduct, including the ethical handling of actual or apparent conflicts of interest between personal and professional relationships; |
|
● |
compliance with applicable governmental laws, rules and regulations; |
|
● |
the prompt internal reporting of violations of the Code to the appropriate person or persons identified in the Code; and |
|
● |
accountability for adherence to the Code. |
A copy of our Code can be viewed on our website at: http://www.uraniumenergy.com.
Corporate Governance and Nominating Committee
Our Board of Directors has established a Corporate Governance and Nominating Committee that operates under a written charter approved by the Board of Directors. The Corporate Governance and Nominating Committee is comprised of Vincent Della Volpe, David Kong and Ganpat Mani. Mr. Della Volpe is the Chairman of the Corporate Governance and Nominating Committee. All of the members of the Corporate Governance and Nominating Committee qualify as independent directors under the listing standards of the NYSE American.
The Corporate Governance and Nominating Committee is responsible for developing an appropriate approach to corporate governance issues and compliance with governance rules. The Corporate Governance and Nominating Committee is also mandated to plan for the succession of our Company, including recommending director candidates, review of board procedures, size and organization and monitoring of senior management with respect to governance issues.
The Corporate Governance and Nominating Committee identifies individuals believed to be qualified to become board members and recommends individuals to fill vacancies. There are no minimum qualifications for consideration for nomination to be a director of the Company. The Corporate Governance and Nominating Committee assesses all nominees using generally the same criteria. In nominating candidates, the Corporate Governance and Nominating Committee takes into consideration such factors as it deems appropriate, including skills, knowledge, experience and personal character, as well as the needs of the Company.
Board Diversity
Our Board of Directors has adopted a written Diversity Policy (the “Diversity Policy”) that sets out the Company’s approach to diversity, including gender, on the Board of Directors and among the executive officers of the Company. The Corporate Governance and Nominating Committee and the Board of Directors aim to attract and maintain directors and an executive team that have an appropriate mix of diversity, skill and expertise.
Pursuant to the Diversity Policy, all Board of Directors and executive officer appointments will be based on merit, and the skill and contribution that the candidate is expected to bring to the Board of Directors and the executive team, with due consideration given to the benefits of diversity. Pursuant to the Diversity Policy, when considering the composition of, and individuals to nominate or hire to, the Board of Directors and the executive team, the Corporate Governance and Nominating Committee and the Board of Directors, as applicable, shall consider diversity from a number of aspects including, but not limited to, gender, age, ethnicity and cultural diversity. In addition, when assessing and identifying potential new members to join the Board of Directors or the executive team, the Corporate Governance and Nominating Committee and the Board of Directors, as applicable, considers the current level of diversity on the Board of Directors and the executive team.
The Corporate Governance and Nominating Committee and the Board of Directors are responsible for developing measurable objectives to implement the Diversity Policy and to measure its effectiveness. The Corporate Governance and Nominating Committee meets annually, or otherwise as applicable, to consider whether to set targets based on diversity for the appointment of individuals to the Board of Directors or the executive team, recognizing that, notwithstanding any targets set in any given year, the selection of diverse candidates will depend on the pool of available candidates with the necessary skills, knowledge and experience.
As at the date of this Annual Report, four of our six directors are diverse based on ethnicity and our Company has one female director. There are no female members of the executive team. The Board of Directors believes that diversity will increase the effectiveness of the Board of Directors and the long-term performance of the Company.
The Corporate Governance and Nominating Committee has performed a review of the experience, qualifications, attributes and skills of our Company’s current directors and believes that our Company’s current directors possess a variety of complementary skills and characteristics, including the following:
|
● |
personal characteristics, including leadership, character, integrity, accountability, sound business judgment and personal reputation; |
|
● |
successful business or professional experience; |
|
● |
various areas of expertise or experience, including financial, strategic and general management; |
|
● |
willingness and ability to commit the necessary time to fully discharge the responsibilities of a director in connection with the affairs of the Company; |
|
● |
a demonstrated commitment to the success of the Company; and |
|
● |
diverse perspectives, qualifications and knowledge. |
The Corporate Governance and Nominating Committee considers nominees recommended by stockholders if such recommendations are made in writing to the Corporate Governance and Nominating Committee and evaluates nominees for election in the same manner whether the nominee has been recommended by a stockholder or otherwise.
Compliance with Section 16(a) of the Exchange Act
Section 16(a) of the Exchange Act requires our directors and officers, and the persons who beneficially own more than 10% of our common stock, to file reports of ownership and changes in ownership with the SEC. Copies of all filed reports are required to be furnished to us pursuant to Rule 16a-3 promulgated under the Exchange Act. Based solely on the reports received by us and on the representations of the reporting persons, we believe that all such reports were timely filed during Fiscal 2020 within two business days as required by the SEC.
Item 11. Executive Compensation
Compensation Discussion and Analysis
Oversight of Executive Compensation Program
Our Board of Directors has established a Compensation Committee that operates under a written Charter approved by the Board of Directors. The Compensation Committee is comprised of Vincent Della Volpe, David Kong and Gloria Ballesta. Mr. Della Volpe is the Chairman of the Compensation Committee. All of the members of the Compensation Committee meet the compensation committee independence standards of the NYSE American. The Board of Directors has determined that none of the Compensation Committee members have any material business relationships with the Company. The independence of the Compensation Committee members is re-assessed regularly by the Company.
The Compensation Committee of our Board of Directors is responsible for establishing and administering the Company’s executive and director compensation.
The responsibilities of the Compensation Committee, as stated in its Charter, include the following:
|
● |
review and approve the Company’s compensation guidelines and structure; |
|
● |
review and approve on an annual basis the corporate goals and objectives with respect to compensation for the Chief Executive Officer; |
|
● |
review and approve on an annual basis the evaluation process and compensation structure for the Company’s other officers, including base compensation, bonus, incentive and equity compensation; and |
|
● |
periodically review and make recommendations to the Board of Directors regarding the compensation of non-management directors. |
The Compensation Committee is responsible for developing the executive compensation philosophy and reviewing and recommending to the Board of Directors for approval, all compensation policies and compensation programs for the executive team.
Since May 2012, consistent with good governance practices, the Compensation Committee retains on an annual basis an independent compensation advisor to provide advice on the structure and levels of compensation for our executive officers and directors and to undertake a comprehensive review of our incentive plans. In Fiscal 2020, the Compensation Committee retained Global Governance Advisors (“GGA”) to provide independent compensation advice to the Compensation Committee and to the Board of Directors. GGA is an internationally recognized, independent advisory firm that provides counsel to boards of directors on matters relating to executive compensation and governance. GGA is retained to continually review the compensation levels for the Company’s executive officers and directors and short and long-term incentive plans, and to evaluate and make recommendations on the Company’s overall executive and director compensation philosophy, objectives and approach.
GGA’s services in Fiscal 2020 included:
|
● |
compensation philosophy validation; |
|
● |
peer group review; |
|
● |
executive compensation review and recommendations for our Chief Executive Officer, Chief Financial Officer and Executive Vice President; |
|
● |
non-management director compensation review; and |
|
● |
review of compensation discussion and analysis in the Company’s proxy statement. |
Fees paid for GGA’s services for our last two fiscal years were $20,650 and $21,067 for Fiscal 2019 and Fiscal 2020, respectively.
The Compensation Committee reviews all fees and the terms of consulting services provided by GGA.
Overview of Executive Compensation Program
In Fiscal 2020, with the recommendations put forth by GGA (the “GGA Recommendations”), the Compensation Committee maintained the following general principles in determining its executive and non-management director total compensation plans.
The Company recognizes that people are our primary asset and our principal source of competitive advantage. In order to recruit, motivate and retain the most qualified individuals as senior executive officers, the Company strives to maintain an executive compensation program that is competitive in the mining industry, which is a competitive, global labor market.
The Compensation Committee’s compensation objective is designed to attract and retain the best available talent while efficiently utilizing available resources. The Compensation Committee compensates executive management primarily through base compensation and equity compensation designed to be competitive with comparable companies, and to align management’s compensation with the long-term interests of shareholders. In determining executive management’s compensation, the Compensation Committee also takes into consideration the financial condition of the Company and discussions with the executive in each instance.
In order to accomplish our goals and to ensure that the Company’s executive compensation program is consistent with its direction and business strategy, the compensation program for our senior executive officers is based on the following objectives:
|
● |
to attract, motivate, retain and reward a knowledgeable and driven management team and to encourage them to attain and exceed performance expectations within a calculated risk framework; and |
|
● |
to reward each executive based on individual and corporate performance and to incentivize such executives to drive the organization’s current growth and sustainability objectives. |
The following key principles guide the Company’s overall compensation philosophy:
|
● |
compensation is designed to align executives to the critical business issues facing the Company; |
|
● |
compensation should be fair and reasonable to shareholders and be set with reference to the local market and similar positions of comparable companies; |
|
● |
a substantial portion of total compensation is at-risk and linked to individual efforts, as well as divisional and corporate performance. This ensures the link between executive pay and business performance; |
|
● |
an appropriate portion of total compensation should be equity-based, aligning the interests of executives with shareholders; and |
|
● |
compensation should be transparent to the Board of Directors, executives and shareholders. |
Benchmarking Compensation and Peer Groups
In Fiscal 2020 the Compensation Committee commissioned a peer group review from GGA as part of a competitive compensation market update review of executive and director compensation in order to stay abreast of changes in the external market and to ensure that the Company continued to benchmark executive compensation with appropriate market comparators. In addition to the external market trends, the Compensation Committee considered the complexity of the Company and the range of size of several of the appropriate comparable companies and, with the GGA Recommendations provided to them, established a revised peer group (the “Peer Group”) to better reflect the Company’s current business. The Peer Group remained relatively consistent with prior years and included companies operating in the oil, gas and consumable fuels sector, primarily in North America, of similar size and having a market capitalization generally below $400 million, ranging between 0.25 times and four times the Company’s. Total assets and revenue were also considered as part of the peer selection process. The Company’s market capitalization was positioned around the median at the time of GGA’s Recommendations. The Peer Group was used by the Compensation Committee to establish the compensation levels for the Company’s executives and its Board of Directors.
In Fiscal 2020, with GGA’s Recommendations, our compensation philosophy aimed to align both our executive and Board of Director compensation around the median of the Peer Group.
|
Peer Group |
|||
|
Abraxas Petroleum Corporation |
Energy Fuels Inc. |
Laramide Resources Ltd. |
UEX Corporation |
|
Adams Resources & Energy, Inc. |
Evolution Petroleum Corporation |
NexGen Energy Ltd. |
UR-Energy Inc. |
|
Comstock Resources, Inc. |
Fission Uranium Corp. |
PolyMet Mining Corp. |
|
|
Denison Mines Corp. |
Hallador Energy Company |
Silvercorp Metals Inc. |
|
Compensation Elements and Rationale
There are three basic components to the Company’s executive compensation program: base compensation, short-term incentive awards; and long-term incentive equity compensation.
Base Compensation
Base compensation is the foundation of the compensation program and is intended to compensate competitively relative to comparable companies within our industry and the marketplace where we compete for talent. Base compensation is a fixed component of the compensation program and is used as the base to determine elements of incentive compensation and benefits.
Effective from May 1, 2016, and again effective on April 1, 2020, the base compensation paid to our executive officers was reduced on a non-accrued basis as more particularly described under “Executive Services Agreements” herein. Effective on October 1, 2020, the base compensation was reinstated to the levels in effect prior to April 1, 2020.
Short-Term Incentive Awards
The short-term incentive plan (the “STIP”) is a variable component of compensation and has the objective of motivating the executive officers to achieve pre-determined objectives over a one-year period and to provide a means to reward the achievement of corporate milestones and fulfillment of the annual business plan. In Fiscal 2020 the Compensation Committee did not award any short-term incentive compensation which it considered appropriate due to challenging market conditions and the COVID-19 pandemic.
Long-Term Incentive (Equity)
The Company’s long-term incentive program provides for, among other awards, the granting of stock options, performance stock options (“PSOs”), RSUs and PRSUs to executive officers to both motivate executive performance and retention, as well as to align executive officer performance to shareholder value creation. In awarding long-term incentives, the Company compares its long-term incentive program to that of comparable companies within our industry and evaluates such factors as the number of shares available for awards under the Company’s 2020 Plan and the number of awards outstanding relative to the number of shares outstanding.
Each long-term incentive grant is based on the level of the position held and overall market competitiveness. The Compensation Committee takes into consideration previous grants when it considers new grants of stock options, PSOs, RSUs and PRSUs. The Compensation Committee administers the granting of equity awards in accordance with the 2020 Plan.
In Fiscal 2019 the Compensation Committee considered the advice of GGA and the recommendations issued by leading independent proxy advisors and determined that it would implement a performance based long-term incentive award structure based on best market practice to more closely align pay with future performance.
In Fiscal 2019 long-term equity incentive plan awards were awarded to the executive officers in the form of PRSUs. The PRSUs vest over 36 months but will not settle until the end of the 36-month period and are contingent on the level of performance achieved. The PRSUs are measured based on the Company’s total stockholder return relative to the Global X Uranium ETF (“relative TSR”). The PRSUs are evaluated using relative TSR over three annual periods and one 36-month period. Each of the four measurement periods is weighted 25%. Contingent on the level of performance achieved over each measurement period, the number of PRSUs that may vest at the end of each annual period and at the end of the 36-month period ranges from 0% to 200% of the PRSU target number of weighted units. The following table summarizes the PRSU vesting schedule.
|
Measurement Period |
Weight |
Performance Criteria |
Company TSR vs. ETF TSR |
Weighted Performance Multiplier |
|
Year 1 |
25% |
Annual Relative Total |
Greater than -500 bps |
0% |
| Stockholder Return against |
-500 bps |
12.5% |
||
| Global X Uranium ETF |
0 bps |
25% |
||
|
+500 bps |
50% |
|||
|
Year 2 |
25% |
Annual Relative Total |
Greater than -500 bps |
0% |
| Stockholder Return against |
-500 bps |
12.5% |
||
| Global X Uranium ETF |
0 bps |
25% |
||
|
+500 bps |
50% |
|||
|
Year 3 |
25% |
Annual Relative Total |
Greater than -500 bps |
0% |
| Stockholder Return against |
-500 bps |
12.5% |
||
| Global X Uranium ETF |
0 bps |
25% |
||
|
+500 bps |
50% |
|||
|
Year 1 to Year 3 |
25% |
Three Year Relative Total |
Greater than -500 bps |
0% |
| Stockholder Return against |
-500 bps |
12.5% |
||
| Global X Uranium ETF |
0 bps |
25% |
||
|
+500 bps |
50% |
In Fiscal 2020 the Compensation Committee reviewed the market prevalence of long-term equity incentive plans within the Company’s Peer Group. The Compensation Committee determined that stock options, PSOs and RSUs were the most appropriate form of long-term equity incentive to grant in Fiscal 2020 due to market practice.
In Fiscal 2020 long-term equity incentive plan awards were awarded to the executive officers in the form of stock options, PSOs and RSUs, as more particularly described in the “Grants of Plan Based Awards” table below. The stock options vest over 24 months and the RSUs and PSOs vest over 36 months.
In Fiscal 2020 the Compensation Committee recommended modifications to the Company’s long-term incentive plan and, on June 5, 2020, our Board of Directors adopted the Company’s 2020 Plan. On July 30, 2020, our shareholders ratified the 2020 Plan.
The following table summarizes the pay mix for the executive officers and illustrates the percentage of fixed versus at-risk pay for Fiscal 2020:
|
|
|
Base |
|
Base |
|
Cash |
|
Stock |
|
Stock |
|
At-Risk |
|
Compensation |
Compensation |
Bonus |
Awards(2) |
Options |
Pay |
|||||||
|
Name and Principal Position |
|
Cash |
|
Stock Awards (1) |
|
(STIP) |
|
(LTIP) |
|
(LTIP) |
|
(LTIP) |
|
Amir Adnani |
23% |
0% |
- |
48% |
29% |
77% |
||||||
|
President and Chief Executive Officer |
||||||||||||
|
Pat Obara |
18% |
3% |
- |
45% |
34% |
79% |
||||||
|
Secretary, Treasurer and Chief Financial Officer |
||||||||||||
|
Scott Melbye |
35% |
6% |
- |
30% |
29% |
59% |
||||||
|
Executive Vice President |
|
|
|
|
|
|
|
|
|
|
|
|
Notes:
|
(1) |
These amounts represent stock issued in lieu of cash compensation in order to reduce cash outlays. |
|
(2) |
These amounts represent RSUs. |
Other Non-Cash Compensation
The Company provides standard health benefits to its executives, including medical, dental and disability insurance.
The Company’s other non-cash compensation is intended to provide a similar level of benefits as those provided by comparable companies within our industry.
Review of Executive Officer Performance
On an annual basis, our Compensation Committee reviews the overall compensation package for our executive officers and evaluates executive officer performance relative to corporate goals. The Compensation Committee has the opportunity to meet with the executive officers at various times throughout the year, which assists the Compensation Committee in forming its own assessment of each individual’s performance. The executive officers are not present during voting or deliberations of the Compensation Committee relating to executive compensation.
In Fiscal 2020 the following milestones were attained by the Company as a result of the success of the executives meeting corporate goals:
|
● |
we completed a drilling campaign to prepare for development of the first production area where we drilled 57 exploration/delineation holes and completed 76 monitor wells totaling 54,724 feet at our Burke Hollow Project. We enlarged our first production area with the discovery of additional mineralization in new and existing trends; |
|
● |
we completed a drilling campaign to prepare for a PEA where we drilled 49 holes at our Alto Parana Project. Our Alto Parana Project is one of the world’s highest-grade and largest ferro-titanium deposits. Samples are currently being prepared for shipment to analytical laboratories in Canada and Peru. We will seek to monetize the asset while maintaining our focus and priority on our core uranium business; |
|
● |
URC listed on the TSX-V on December 16, 2019. We own 14 million shares of URC, which represents a 19.5% interest in URC. As of the closing of trading on July 31, 2020, our shareholding in URC was valued at CAD$16.2 million. URC is focused on gaining exposure to uranium prices by making strategic investments in uranium interests, including royalties, streams, debt and equity investments in uranium companies, as well as through holdings of physical uranium; |
|
● |
we maintained our strategic focus on acquiring and developing U.S. in-situ recovery projects that are an environmentally friendly and lower cost alternative to conventional mining and now control the largest U.S. resource base of fully permitted in-situ recovery projects in Texas and Wyoming. We are ideally positioned to supply potential U.S. government purchases for a national uranium reserve as well as longer-term utility demand; |
|
● |
we maintained a perfect safety record with no lost-time accidents and no reportable medical aids during the year. In response to the COVID-19 pandemic, we arranged for our teams at our Vancouver, Corpus Christi and Paraguay offices to work remotely. Maintenance protocols at our Hobson Processing Facility and at our Palangana ISR Mine remained unchanged. Our Hobson Processing Facility and our Palangana Mine remain on standby for future extraction. We postponed plans to resume drilling at our Burke Hollow Project; and |
|
● |
the Company’s shares were retained on the Russell 3000 and related growth and value style indexes. |
Subsequent to Fiscal 2020, we completed our September 2020 Offering of 12,500,000 units at a price of $1.20 per unit for gross proceeds of $15,000,000.
Executive Compensation
Amir Adnani, President and Chief Executive Officer
During Fiscal 2020, Amir Adnani, through an executive services agreement with Amir Adnani Corp. (“Adnani Corp.”), a private company over which Mr. Adnani exercises control, was retained to provide certain services to the Company, and his direct and indirect compensation as an executive officer of the Company is disclosed below in the “Summary Compensation Table”. The Company’s compensation policy for Mr. Adnani is based on comparisons of other companies’ remunerations made to their Presidents and Chief Executive Officers and the value of Mr. Adnani’s expertise to the Company.
As shown in the “Director Compensation” table below, Mr. Adnani does not receive additional compensation in connection with his service as a director of the Company.
Scott Melbye, Executive Vice President
Scott Melbye is retained according to an executive services agreement with our Company, and his compensation for serving as an executive officer of the Company is disclosed below in the “Summary Compensation Table”. The Company’s compensation policy for Mr. Melbye is based on comparisons of other companies’ remunerations made to their Executive Vice Presidents and the value of Mr. Melbye’s expertise to the Company.
Pat Obara, Secretary, Treasurer and Chief Financial Officer
The Company appointed Pat Obara as Secretary, Treasurer and Chief Financial Officer of the Company effective October 29, 2015, as ratified on June 6, 2016. Mr. Obara served as our Chief Financial Officer from August 2006 to January 2011 and as our Vice President Administration from January 2011 to October 2015. Mr. Obara is retained according to a consulting services agreement with our Company, and his compensation for serving as an executive officer of the Company is disclosed below in the “Summary Compensation Table”. The Company’s compensation policy for Mr. Obara is based on comparisons of other companies’ remunerations made to their Chief Financial Officers and the value of Mr. Obara’s expertise to the Company.
Retirement, Resignation or Termination Plans
Officers with contracts for services have notice requirements which permit pay in lieu of notice.
Each of the Company’s executive services arrangements with Messrs. Melbye and Obara and Adnani Corp. contemplates the case of termination due to various provisions whereby the named executive officers will receive termination payments, as described below under the heading “Executive Services Agreements”.
Compensation and Risk
We do not believe that our compensation policies and practices are reasonably likely to have a material adverse effect on us. We have taken steps to ensure our executive compensation program does not incentivize risk outside the Company’s risk appetite. Some of the key ways that we currently manage compensation risk are as follows:
|
● |
appointed a Compensation Committee which is composed entirely of independent directors to oversee the executive compensation program; |
|
● |
retained an independent compensation advisor, GGA, to provide advice on the structure and levels of compensation for our executive officers and directors; |
|
● |
our short-term incentive plan is measured based on business objectives and has a cap on the total amount of payment any position may receive equivalent to 200% of an executive’s base compensation in applicable years when short-term incentive awards are awarded; |
|
● |
the use of performance based long-term incentive compensation to encourage a focus on long-term corporate performance; |
|
● |
disclosure of executive compensation to stakeholders; |
|
● |
established a clawback policy applicable to all cash and equity incentive compensation; and |
|
● |
adoption of say-on-pay. |
Clawback Policy
We adopted a Clawback Policy as an additional safeguard to mitigate compensation risks (the “Clawback Policy”). The Clawback Policy applies to all cash and equity incentive compensation and provides that the Board of Directors may seek reimbursement for compensation awarded to an executive in situations where: (i) payment was predicated upon achieving certain financial results that were subsequently the subject of a substantial restatement of the Company’s financial statements filed with any securities regulatory authority; (ii) the executive engaged in gross negligence, intentional misconduct or fraud that caused, or partially caused, the need for a restatement; or (iii) the incentive compensation would have been lower had the financial results been properly reported. Our Clawback Policy is available on the Company’s website at http://www.uraniumenergy.com.
Anti-Hedging and Anti-Pledging Policy
We adopted an Anti-Hedging and Anti-Pledging Policy (the “Anti-Hedging and Anti-Pledging Policy”). The Anti-Hedging and Anti-Pledging Policy provides that, unless otherwise previously approved by our Corporate Governance and Nominating Committee, no director, officer or employee of the Company or its subsidiaries or, to the extent practicable, any other person (or their associates) in a special relationship (within the meaning of applicable securities laws) with the Company, may, at any time: (i) purchase financial instruments, including prepaid variable forward contracts, instruments for the short sale or purchase or sale of call or put options, equity swaps, collars, or units of exchangeable funds that are based on fluctuations of the Company’s debt or equity instruments and that are designed to or that may reasonably be expected to have the effect of hedging or offsetting a decrease in the market value of any securities of the Company; or (ii) purchase Company securities on a margin or otherwise pledge Company securities as collateral for a loan. Any violation of our Anti-Hedging and Anti-Pledging Policy will be regarded as a serious offence. Our Anti-Hedging and Anti-Pledging Policy is available on the Company’s website at http://www.uraniumenergy.com.
Stock Ownership Guidelines
We adopted Stock Ownership Guidelines for executive officers to further align the interests of our executive officers and stockholders (the “Stock Ownership Guidelines”). The Stock Ownership Guidelines provide that each executive officer should attain a specified level of ownership of shares of the Company’s common stock equal to a multiple of their base compensation within five years of the executive officer’s first election to his role:
|
Role |
Requirement (multiple of base compensation) |
|
President and Chief Executive Officer |
3x |
|
Chief Financial Officer |
1x |
|
Executive Vice President |
1x |
As of the date of this Annual Report, Mr. Adnani’s ownership exceeds seven times his current base compensation.
Among our executive officers, ownership exceeds, on average, two times their current base compensation. Our Stock Ownership Guidelines are available on the Company’s website at http://www.uraniumenergy.com.
Consideration of Most Recent Shareholder Advisory Vote on Executive Compensation
As required by Section 14A of the Exchange Act, at our 2020 annual meeting of stockholders our stockholders voted, in an advisory manner, on a proposal to approve our named executive officer compensation. This was our most recent stockholder advisory vote to approve named executive officer compensation. The proposal was approved by our stockholders, receiving 89% of the vote of the stockholders present in person or represented by proxy and voting at the meeting. We considered this vote to be a ratification of our current executive compensation policies and decisions and, therefore, did not make any significant changes to our executive compensation policies and decisions based on the vote.
Compensation Committee Interlocks and Insider Participation
No person who served as a member of our Compensation Committee during Fiscal 2020 was a current or former officer or employee of our Company or engaged in certain transactions with our Company required to be disclosed by regulations of the SEC. Additionally, during Fiscal 2020, there were no Compensation Committee “interlocks”, which generally means that no executive officer of our Company served: (i) as a member of the compensation committee (or other board committee performing equivalent functions or, in the absence of any such committee, the entire board of directors) of another entity which had an executive officer serving as a member of our Company’s Compensation Committee; (ii) as a director of another entity which had an executive officer serving as a member of our Company’s Compensation Committee; or (iii) as a member of the compensation committee (or other board committee performing equivalent functions or, in the absence of any such committee, the entire board of directors) of another entity which had an executive officer serving as a director of our Company.
Compensation Committee Report
The Compensation Committee has reviewed and discussed the foregoing compensation discussion and analysis with Company management. Based on that review and those discussions, the Compensation Committee recommended to the Board of Directors that the compensation discussion and analysis be included in this Annual Report. This report is provided by the independent directors Vincent Della Volpe, David Kong and Gloria Ballesta, who comprise our Compensation Committee:
Summary Compensation Table
The following table sets forth the compensation paid to our Chief Executive Officer, Chief Financial Officer and those executive officers that earned in excess of $100,000 during the fiscal years ended July 31, 2020, 2019 and 2018 (each a “Named Executive Officer”):
|
Name and Principal Position |
Year |
Salary (1) |
Bonus |
Stock Awards (2) |
Option Awards (3) |
Non-Equity Incentive Plan Compensation |
Non-Qualified Deferred Compensation Earnings |
All Other Compensation |
Total |
||||||||||||||||||||||||
|
Amir Adnani |
2020 |
$ | 341,496 | $ | - | $ | 728,000 |
(4) |
$ | 419,169 | $ | - | $ | - | $ | - | $ | 1,488,665 | |||||||||||||||
|
President and Chief Executive Officer |
2019 |
396,576 | 450,000 | 627,630 | 290,455 | - | - | - | 1,764,661 | ||||||||||||||||||||||||
|
2018 |
396,576 | 340,000 | 336,600 | 273,600 | - | - | - | 1,346,776 | |||||||||||||||||||||||||
|
Pat Obara (7) |
2020 |
87,767 | - | 228,766 |
(5) |
160,175 | 476,708 | ||||||||||||||||||||||||||
|
Secretary, Treasurer |
2019 |
95,354 | 66,000 | 231,515 | 105,620 | - | - | - | 498,489 | ||||||||||||||||||||||||
|
and Chief Financial Officer |
2018 |
103,213 | 50,000 | 99,436 | 68,400 | - | - | - | 321,049 | ||||||||||||||||||||||||
|
Scott Melbye |
2020 |
176,669 | - | 185,434 |
(6) |
149,859 | - | - | - | 511,962 | |||||||||||||||||||||||
|
Executive Vice President |
2019 |
185,009 | 60,000 | 140,180 | 66,013 | - | - | - | 451,202 | ||||||||||||||||||||||||
|
2018 |
188,512 | 50,000 | 61,307 | 51,300 | - | - | - | 351,119 | |||||||||||||||||||||||||
Notes:
|
(1) |
These amounts represent fees paid by us to the Named Executive Officers during the year pursuant to various executive services agreements, between us and the Named Executive Officers, which are more particularly described below. |
|
(2) |
For Fiscal 2020, these amounts represent the aggregate grant date fair value of RSUs and, for Messrs. Obara and Melbye, the fair value of shares at the date of issuance. For Fiscal 2019, these amounts represent the aggregate grant date fair value of RSUs and PRSUs, and for Messrs. Obara and Melbye, the fair value of shares at the date of issuance. For Fiscal 2018, these amounts represent the fair value of shares at the date of issuance. For Fiscal 2020, the grant date fair value of each RSU is $0.91 per share based on the most recent closing price of our common stock as of the grant date of July 16, 2020. For Fiscal 2019, the grant date fair value of each RSU is $0.9421 per share based on the most recent closing price of our common stock as of the grant date of July 30, 2019, and the grant date fair value of each PRSU is $1.15 per unit, which incorporates the potential to vest, depending on the performance, from 0% to 200% of the number of PRSUs. The fair value of each PRSU was calculated using a Monte Carlo simulation model. The following assumptions were used to value the PRSUs granted: expected risk free interest rate: 1.99% to 2.20%; expected volatility: 56.74% to 61.75%; expected dividend yield: 0%; expected life in years: 3.0; and correlation: 57.10%. |
|
(3) |
For Fiscal 2020, these amounts represent the aggregate grant date fair value of stock options and PSOs which was estimated using the Black-Scholes option pricing model. The following assumptions were used to value the stock options granted July 16, 2020: exercise price: $0.91; expected risk free interest rate: 0.280%; expected annual volatility: 60.004%; expected life in years: 5.0; expected annual dividend yield: $Nil; and Black-Scholes value: $0.456. The following assumptions were used to value the PSOs granted July 16, 2020: exercise price: $1.10; expected risk free interest rate: 0.280%; expected annual volatility: 60.004%; expected life in years: 5.0; expected annual dividend yield: $Nil; and Black-Scholes value: $0.413. For Fiscal 2018 and 2019, these amounts represent the aggregate grant date fair value of stock options which was estimated using the Black-Scholes option pricing model. |
|
(4) |
This amount represents the grant date fair value of the RSUs granted to Mr. Adnani on July 16, 2020. |
|
(5) |
These amounts include: (i) $14,916 for stock awards issued in lieu of cash compensation in order to reduce cash outlays; and (ii) $213,850 for RSUs granted to Mr. Obara on July 16, 2020. |
|
(6) |
These amounts include: (i) $30,734 for stock awards issued in lieu of cash compensation in order to reduce cash outlays; and (ii) $154,700 for RSUs granted to Mr. Melbye on July 16, 2020. |
|
(7) |
Mr. Obara was appointed as Secretary, Treasurer and Chief Financial Officer effective October 29, 2015. The Company pays Mr. Obara in Canadian currency. For the purpose of reporting the base compensation paid to Mr. Obara, the compensation was converted from Canadian currency to U.S. currency at the Bank of Canada noon buying rate for the years ended July 31. |
Grants of Plan Based Awards
We granted awards to the Named Executive Officers in Fiscal 2020, as follows:
|
Award |
Grant |
Estimated Future Payouts Under |
All Other Stock |
All Other Option Awards: Number of |
Exercise Price of Option |
Grant Date Fair Value of Stock and |
||||||||||||||||||||||||
|
Name |
Type(1) |
Date |
Threshold |
Target |
Maximum |
or Units |
Options |
Awards |
Option Awards |
|||||||||||||||||||||
|
Amir Adnani |
Option |
July 16, 2020 |
N/A | N/A | N/A | - | 150,000 | $ | 0.91 | $ | 68,414 |
(2) |
||||||||||||||||||
|
President and Chief Executive Officer |
PSO |
July 16, 2020 |
N/A | N/A | N/A | - | 850,000 | $ | 1.10 | 350,755 |
(3) |
|||||||||||||||||||
|
RSU |
July 16, 2020 |
N/A | N/A | N/A | 800,000 | N/A | N/A | 728,000 |
(4) |
|||||||||||||||||||||
|
Pat Obara |
Option |
July 16, 2020 |
N/A | N/A | N/A | - | 125,000 | $ | 0.91 | 57,012 |
(2) |
|||||||||||||||||||
|
Secretary, Treasurer and Chief |
PSO |
July 16, 2020 |
N/A | N/A | N/A | - | 250,000 | $ | 1.10 | 103,163 |
(3) |
|||||||||||||||||||
|
Financial Officer |
RSU |
July 16, 2020 |
N/A | N/A | N/A | 235,000 | N/A | N/A | 213,850 |
(4) |
||||||||||||||||||||
|
Scott Melbye |
Option |
July 16, 2020 |
N/A | N/A | N/A | - | 125,000 | $ | 0.91 | 57,012 |
(2) |
|||||||||||||||||||
|
Executive Vice President |
PSO |
July 16, 2020 |
N/A | N/A | N/A | - | 225,000 | $ | 1.10 | 92,847 |
(3) |
|||||||||||||||||||
|
RSU |
July 16, 2020 |
N/A | N/A | N/A | 170,000 | N/A | N/A | 154,700 |
(4) |
|||||||||||||||||||||
Notes:
|
(1) |
Option – refers to stock options granted under our 2020 Plan. |
PSO – refers to performance stock options granted under our 2020 Plan.
RSU – refers to restricted stock units granted under our 2020 Plan.
|
(2) |
These amounts represent the grant date fair value of the stock options which was estimated using the Black-Scholes option pricing model. The following assumptions were used to value the stock options granted July 16, 2020: exercise price: $0.91; expected risk free interest rate: 0.280%; expected annual volatility: 60.004%; expected life in years: 5.0; expected annual dividend yield: $Nil; and Black-Scholes value: $0.456 |
|
(3) |
These amounts represent the grant date fair value of the PSOs which was estimated using the Black-Scholes option pricing model. The following assumptions were used to value the PSOs granted July 16, 2020: exercise price: $1.10; expected risk free interest rate: 0.280%; expected annual volatility: 60.004%; expected life in years: 5.0; expected annual dividend yield: $Nil; and Black-Scholes value: $0.413. |
|
(4) |
The grant date fair value of each RSU is $0.91 per share based on the most recent closing price of our common stock as of the grant date of July 16, 2020. |
Outstanding Equity Awards
The following table sets forth information as at Fiscal 2020, relating to equity awards that have been granted to the Named Executive Officers:
|
Option Awards |
Stock Awards |
||||||||||||||||||
| Name |
Award |
Grant |
Number of Securities Underlying Unexercised Options Exercisable |
Number of Securities Underlying Unexercised Options Unexercisable |
Option Exercise |
Option Expiration Date |
Number of Shares or Units of Stock That Have Not Vested |
Market Value of Shares or Units of Stock That Have Not Vested |
Equity Incentive Plan Awards: Number of Unearned Shares or Units of Stock That Have Not Vested |
Equity Incentive Plan Awards: Market or Payout Value of Unearned Shares or Units of Stock That Have Not Vested |
|||||||||
|
Amir Adnani |
Option |
July 28, 2015 |
300,000 | - | 0.93 |
July 28, 2021 |
- | - | - | - | |||||||||
|
Option |
August 22, 2016 |
165,000 | - | 1.28 |
August 22, 2022 |
- | - | - | - | ||||||||||
|
Option |
July 25, 2018 |
400,000 | - | 1.53 |
July 25, 2023 |
- | - | - | - | ||||||||||
|
Option |
July 30, 2019 |
275,000 | 275,000 | 0.9421 |
July 30, 2029 |
- | - | - | - | ||||||||||
|
Option |
July 16, 2020 |
- | 150,000 | 0.91 |
July 16, 2030 |
- | - | - | - | ||||||||||
|
PSO |
July 16, 2020 |
- | 850,000 | 1.10 |
July 16, 2030 |
- | - | - | - | ||||||||||
|
RSU |
July 30, 2019 |
- | - | - | 200,000 | 194,000 | - | - | |||||||||||
|
RSU |
July 16, 2020 |
- | - | - | 800,000 | 776,000 | - | - | |||||||||||
|
PRSU |
July 30, 2019 |
- | - | - | - | - | 225,000 | 258,750 | |||||||||||
|
Pat Obara |
Option |
July 28, 2015 |
88,000 | - | 0.93 |
July 28, 2021 |
- | - | - | - | |||||||||
|
Option |
August 22, 2016 |
80,000 | - | 1.28 |
August 22, 2022 |
- | - | - | - | ||||||||||
|
Option |
July 25, 2018 |
100,000 | - | 1.53 |
July 25, 2023 |
- | - | - | - | ||||||||||
|
Option |
July 30, 2019 |
100,000 | 100,000 | 0.9421 |
July 30, 2029 |
- | - | - | - | ||||||||||
|
Option |
July 16, 2020 |
- | 125,000 | 0.91 |
July 16, 2030 |
- | - | - | - | ||||||||||
|
PSO |
July 16, 2020 |
- | 250,000 | 1.10 |
July 16, 2030 |
- | - | - | - | ||||||||||
|
RSU |
July 30, 2019 |
- | - | - | 66,667 | 64,667 | - | - | |||||||||||
|
RSU |
July 16, 2020 |
- | - | - | 235,000 | 227,950 | - | - | |||||||||||
|
PRSU |
July 30, 2019 |
- | - | - | - | - | 75,000 | 86,250 | |||||||||||
|
Scott Melbye |
Option |
January 12, 2016 |
300,000 | - | 0.98 |
January 12, 2021 |
- | - | - | - | |||||||||
|
Option |
August 2, 2016 |
60,000 | - | 0.93 |
August 2, 2021 |
- | - | - | - | ||||||||||
|
Option |
August 22, 2017 |
65,000 | - | 1.28 |
August 22, 2022 |
- | - | - | - | ||||||||||
|
Option |
July 25, 2018 |
75,000 | - | 1.53 |
July 25, 2023 |
- | - | - | - | ||||||||||
|
Option |
July 30, 2019 |
62,500 | 62,500 | 0.9421 |
July 30, 2029 |
- | - | - | - | ||||||||||
|
Option |
July 16, 2020 |
- | 125,000 | 0.91 |
July 16, 2030 |
- | - | - | - | ||||||||||
|
PSO |
July 16, 2020 |
- | 225,000 | 1.10 |
July 16, 2030 |
- | - | - | - | ||||||||||
|
RSU |
July 30, 2019 |
- | - | - | 30,000 | 29,100 | - | - | |||||||||||
|
RSU |
July 16, 2020 |
- | - | - | 170,000 | 164,900 | - | - | |||||||||||
|
PRSU |
July 30, 2019 |
- | - | - | - | - | 33,750 | 38,813 | |||||||||||
Notes:
|
(1) |
Option – refers to stock options granted under our 2020 Plan. PSO – refers to performance stock options granted under our 2020 Plan. RSU – refers to restricted stock units granted under our 2020 Plan. PRSU – refers to performance based restricted stock units granted under our 2020 Plan. |
|
(2) |
RSUs granted July 30, 2019 vest in substantially equal installments on each of July 30, 2020, 2021 and 2022. RSUs granted July 16, 2020 vest one-half on July 16, 2021 and one-half in substantially equal installments on each of July 16, 2021, 2022 and 2023. |
|
(3) |
The value shown is based on the closing price of our common stock of $0.97 on July 31, 2020. |
|
(4) |
Represents unearned shares under PRSUs granted on July 30, 2019. The PRSUs accrue one-quarter on each of July 30, 2020, 2021 and 2022 depending on one-year relative TSR performance and one-quarter on July 30, 2022 depending on three-year relative TSR performance. 90,001 PRSUs and their underlying shares were earned in Fiscal 2020: that being Amir Adnani for 60,675; Pat Obara for 20,225; and Scott Melbye for 9,101 PRSUs. The vested PRSUs accrue annually and settle after 36 months. |
|
(5) |
The grant date fair value of each PRSU is $1.15 per share, which incorporates the potential to vest, depending on performance, from 0% to 200% of the number of PRSU units. The fair value of each PRSU was calculated using a Monte Carlo simulation model. The following assumptions were used to value the PRSUs granted: expected risk free interest rate: 1.99% to 2.20%; expected volatility: 56.74% to 61.75%; expected dividend yield: 0%; expected life in years: 3.0; and correlation: 57.10%. |
Option Exercises and Stock Vested
The following table sets forth the value realized on stock options exercised and stock awards vested for the Named Executive Officers for Fiscal 2020:
|
|
Option Awards |
|
Stock Awards |
||
|
Name |
Number of Shares Acquired on Exercise |
Value Realized on Exercise ($) |
|
Number of Shares Acquired on Vesting |
Value Realized on Vesting (1) ($) |
|
Amir Adnani, President and Chief Executive Officer |
Nil |
N/A |
100,000 |
101,000 |
|
|
Pat Obara, Secretary, Treasurer and Chief Financial Officer |
Nil |
N/A |
33,333 |
33,666 |
|
|
Scott Melbye, Executive Vice President |
Nil |
N/A |
|
15,000 |
15,150 |
Note:
|
(1) |
This amount represents the number of RSUs vested multiplied by the closing price of our common stock as of the vesting date, and is calculated before payment of any applicable withholding taxes. |
No Pension Benefits
The Company does not maintain any plan that provides for payments or other benefits to its executive officers at, following or in connection with their retirement and including, without limitation, any tax-qualified defined benefit plans or supplemental executive retirement plans.
No Nonqualified Deferred Compensation
The Company does not maintain any defined contribution or other plan that provides for the deferral of compensation on a basis that is not tax-qualified.
Director Compensation
Directors receive cash and equity compensation for their annual service. The value and form of equity awards granted to each director is based on the experience of the director, time spent on Company matters and the compensation paid to directors of other companies in the industry. In Fiscal 2020 stock options awarded to the directors vest over 24 months. RSUs granted to Mr. Abraham, the Chairman of the Company, vest over 36 months. Restricted stock awards were granted as a bonus to Messrs. Kong, Mani and Della Volpe and Ms. Ballesta, the independent directors of the Company. Stock awards were issued in lieu of cash compensation in order to reduce cash outlays.
The following table sets forth information relating to compensation paid to our directors for Fiscal 2020:
|
Name (1) |
Fees Earned |
Stock |
Option |
Non-Equity |
Non-Qualified |
All Other Compensation |
Total |
|||||||||||||||
|
Spencer Abraham |
$ | 89,250 | $ | 122,500 |
(4) |
$ | 91,219 | $ | - | $ | - | $ | - | $ | 302,969 | |||||||
|
David Kong |
11,050 | 37,234 |
(5) |
34,207 | - | - | - | 82,491 | ||||||||||||||
|
Ganpat Mani |
11,900 | 37,350 |
(5) |
34,207 | - | - | - | 83,457 | ||||||||||||||
|
Gloria Ballesta |
8,840 | 36,133 |
(5) |
34,207 | - | - | - | 79,180 | ||||||||||||||
|
Vincent Della Volpe |
11,900 | 37,350 |
(5) |
34,207 | - | - | - | 83,457 | ||||||||||||||
Notes:
|
(1) |
Information for Mr. Adnani is disclosed above in the “Summary Compensation Table” and is not reported in the “Director Compensation” table of this Annual Report. |
|
(2) |
These amounts represent the fair value of the shares at the date of issuance. |
|
(3) |
These amounts represent the grant date fair value of the stock options which was estimated using the Black-Scholes option pricing model. The following assumptions were used to value the stock options granted July 16, 2020: exercise price: $0.91; expected risk free interest rate: 0.280%; expected annual volatility: 60.004%; expected life in years: 5.0; expected annual dividend yield: $Nil; and Black-Scholes value: $0.456. |
|
(4) |
These amounts include: (i) stock issued in lieu of cash compensation in order to reduce cash outlays; and (ii) RSUs granted to Mr. Abraham on July 16, 2020. The RSUs granted July 16, 2020 vest one-half on July 16, 2021 and one-half in substantially equal installments on each of July 16, 2021, 2022 and 2023. |
|
(5) |
These amounts include (i) stock issued in lieu of cash compensation in order to reduce cash outlays; and (ii) stock awards granted as a bonus on July 16, 2020. |
As at July 31, 2020 our directors held stock options to acquire an aggregate of 4,990,000 shares of our common stock as follows: Spencer Abraham: 1,520,000 stock options; Amir Adnani: 2,415,000 stock options including PSOs; Vincent Della Volpe: 265,000 stock options; David Kong: 275,000 stock options; Ganpat Mani: 250,000 stock options; and Gloria Ballesta: 265,000 stock options.
Spencer Abraham has served as Chairman (non-executive) of our Board of Directors since March 2, 2017. Mr. Abraham served as Executive Chairman from October 14, 2015 to March 2, 2017, and as Chairman of our Advisory Board from December 2012 to October 2015. Mr. Abraham is retained according to an appointment letter with our Company and is to be compensated at a rate of $10,833 per month, paid in monthly installments, and $20,000 per year, paid in quarterly installments, for his services as a director of the Company. Effective from May 1, 2016, and again effective on April 1, 2020, the fees payable to Mr. Abraham were reduced on a non-accrued basis as more particularly described under “Director Services Agreement” herein. Effective on October 1, 2020, the fees payable were reinstated to the levels in effect prior to April 1, 2020.
Amir Adnani serves as the Company’s Chief Executive Officer, President and a director. Within his capacity as President and Chief Executive Officer, and through an executive services agreement with a private company, Adnani Corp., controlled by Mr. Adnani, he provides various consulting services to the Company. Mr. Adnani does not receive additional compensation in connection with his service as a director of the Company. Mr. Adnani’s direct and indirect compensation as an executive officer of the Company is disclosed above in the “Summary Compensation Table”.
In Fiscal 2020 David Kong, Vincent Della Volpe, Ganpat Mani and Gloria Ballesta served as independent directors of the Company. Mr. Kong serves as the Company’s lead independent director and as Chairman of the Company’s Audit Committee. Mr. Della Volpe serves as Chairman of each of the Company’s Compensation Committee and Corporate Governance and Nominating Committee.
The Company’s independent directors are retained on a yearly basis for their services and are paid quarterly based on annual retainer fees, which are as follows: David Kong (CA$25,000 per year); Vincent Della Volpe ($20,000 per year); Ganpat Mani ($20,000 per year); and Gloria Ballesta (CA$20,000 per year).
Effective from May 1, 2016 retainer fees paid to our independent directors were reduced on a non-accrued basis as follows: David Kong (CA$22,500 per year); Vincent Della Volpe ($18,000 per year); Ganpat Mani ($18,000 per year); and Gloria Ballesta (CA$18,000 per year), of which a portion of fees were paid in shares of common stock of our Company.
Effective from April 1, 2020, due to the COVID-19 pandemic, retainer fees paid to our independent directors were reduced on a non-accrued basis as follows: David Kong (CA$14,625 per year); Vincent Della Volpe ($11,700 per year); Ganpat Mani ($11,700 per year); and Gloria Ballesta (CA$11,700 per year). Effective on October 1, 2020, the retainer fees payable were reinstated to the levels in effect prior to April 1, 2020.
The amounts listed above are all-inclusive retainer fees and there are no additional committee and/or chairmanship fees or meeting attendance fees.
In addition to such retainers, directors may, from time to time, receive bonus payments or equity compensation, which is granted on a discretionary basis. The amount of any bonus payments or the value and form of equity compensation is based on the experience of the director, time spent on Company matters and a comparison of the compensation paid to directors of other companies in the industry.
Standard retainer amounts paid to directors, as well as any bonus payments and equity compensation, are determined by the Company’s Compensation Committee and ratified by the Board of Directors.
Pay Ratio
As required by the Dodd-Frank Wall Street Reform and Consumer Protection Act, and Item 402(u) of Regulation S-K, we are providing the following information about the relationship of the annual total compensation of our employees and the annual total compensation of Amir Adnani, our President and Chief Executive Officer (“CEO”; and the “CEO Pay Ratio”). For Fiscal 2020, our last completed fiscal year:
|
● |
the median of the annual total compensation of all employees of our Company (other than our CEO) was $66,835; and |
|
● |
the annual total compensation of our CEO, as reported in the Summary Compensation Table included elsewhere in this Annual Report, was $1,488,665. |
Based on this information, for Fiscal 2020 the ratio of the annual total compensation of our CEO to the median of the annual total compensation of all employees was approximately 22 to 1.
We believe our CEO Pay Ratio for Fiscal 2020 demonstrates our pay-for-performance philosophy. Our compensation program consists of both fixed and variable components and is designed to motivate all employees to produce superior short and long-term corporate performance. The ratio of our CEO’s base compensation to the base compensation of our median employee was approximately 22 to 1 because the fixed portion of our CEO’s compensation was positioned near the 50th percentile of his position per the review conducted by GGA. Given our CEO’s level of responsibility, experience and potential, the Compensation Committee awards him a mix of compensation with a higher variable component (i.e., annual company bonus, stock options, PSOs, RSUs and PRSUs) that is based upon individual performance. As a result, a substantial percentage of our CEO’s total compensation is at risk every year, providing our CEO with greater incentive to increase shareholder value and improve corporate performance over the long term.
To identify the median of the annual total compensation of all our employees, we took the following steps:
|
● |
we selected July 31, 2020 as the date upon which we would identify the median employee to allow sufficient time to identify the median employee given the global scope of our operations; |
|
● |
we determined that, as of July 31, 2020, our employee population consisted of approximately 46 individuals working for us and our consolidated subsidiaries, with approximately 52% of these individuals located in the United States, 20% in Canada and 28% in Paraguay. This population consisted of our full-time, part-time and temporary employees. We do not have seasonal employees; |
|
● |
to identify the median employee from our employee population, we examined the annual base compensation and annual bonus target for Fiscal 2020 for all full-time, part-time and temporary employees employed by us and our consolidated subsidiaries at the start of business on July 31, 2020. We believe that these pay elements are appropriate because it was impractical to gather actual data from multiple payroll systems utilized to pay our worldwide workforce, and the actual achievement of the variable portion of compensation can vary widely from year to year; |
|
● |
we annualized compensation for any permanent employees that were only employed for part of Fiscal 2020; |
|
● |
no adjustments were made for cost-of-living differences; |
|
● |
an average exchange rate for U.S. dollar for Fiscal 2020 was applied to compensation reported in a foreign currency; and |
|
● |
all employees except for our CEO were ranked from lowest to highest with the median determined from this list. |
Once we identified our median employee, we combined all of the elements of such employee’s compensation for Fiscal 2020 in accordance with the requirements of Item 402(c)(2)(x) of Regulation S-K, resulting in annual total compensation of $66,835. With respect to the annual total compensation of our CEO, we used the amount reported in the “Total” column of our “Summary Compensation Table” included in this Annual Report.
The CEO Pay Ratio reported above is a reasonable estimate calculated in a manner consistent with SEC rules, based on our internal records and the methodology described above. The SEC rules for identifying the median compensated employee allow companies to adopt a variety of methodologies, to apply certain exclusions and to make reasonable estimates and assumptions that reflect their employee populations and compensation practices. Accordingly, the pay ratio reported by other companies may not be comparable to the pay ratio reported above, as other companies have different employee populations and compensation practices and may use different methodologies, exclusions, estimates and assumptions in calculating their own pay ratios.
Executive Services Agreements
Adnani Executive Services Agreement
On July 23, 2009, our Board of Directors approved the entering into of an executive services agreement with Adnani Corp., Mr. Adnani’s services corporation, as amended by certain letter agreements, dated for reference effective as at July 1, 2010 and February 1, 2012, respectively, with a term expiring on July 23, 2012 (the “2009 Adnani Agreement”). The 2009 Adnani Agreement was subject to automatic renewal and remained in effect until June 30, 2013. On July 24, 2013, our Board of Directors approved the entering into of a further amended and restated executive services agreement with Adnani Corp. with an initial term commencing retroactively on July 1, 2013 and expiring on July 1, 2016, as amended by a letter agreement dated August 1, 2015 (collectively the “Adnani Agreement”).
The Adnani Agreement is subject to automatic renewal on a three-month to three-month term renewal basis unless either the Company or Adnani Corp. provides written notice not to renew the Adnani Agreement no later than 90 days prior to the end of the then current or renewal term.
Pursuant to the terms and provisions of the Adnani Agreement: (i) through Adnani Corp., Mr. Adnani provides various consulting services to the Company which are in addition to his duties and responsibilities as our President and Chief Executive Officer; and (ii) we shall pay to Adnani Corp. a monthly fee of $34,000. In consultation with the Compensation Committee and Board of Directors, effective from May 1, 2016, the monthly fee payable to Adnani Corp. was reduced on a non-accrued basis, from its original and stated amount to $30,600, of which a portion was paid in shares of common stock in lieu of cash at the discretion of the Compensation Committee to alter from time to time. Effective from April 1, 2020, due to the COVID-19 pandemic, the monthly fee payable to Adnani Corp. was reduced on a non-accrued basis from its original and stated amount to $16,830. Effective on October 1, 2020, the monthly fee payable was reinstated to the level in effect prior to April 1, 2020.
If the Company elects to not renew the Adnani Agreement, and provided that Adnani Corp. is in compliance with the relevant terms and conditions of the Adnani Agreement, the Company shall be obligated to provide a termination package to Adnani Corp. as follows: (i) a cash payment equating to an aggregate of four months of the then monthly fee for each full year, and any portion thereof, of the initial term effective from July 23, 2009 and any renewal period during which the Adnani Agreement was in force and effect and during which Adnani Corp. rendered services thereunder, together with a cash payment equating to Adnani Corp.’s average annual bonus during the most recent two years, payable by the Company to Adnani Corp. within 14 calendar days of the effective termination date; (ii) any expense payment reimbursements which would then be due and owing by the Company to Adnani Corp. to the effective termination date, payable within 14 calendar days of the effective termination date (the “Adnani Outstanding Expense Reimbursements”); (iii) subject to applicable provisions of the Adnani Agreement and the Company’s Stock Incentive Plan, all of Mr. Adnani’s then issued and outstanding stock-based equity awards in and to the Company as at the effective termination date shall immediately vest, if not otherwise vested, and shall continue to be exercisable for a period of two years from the effective termination date (the “Adnani Options Extension”); and (iv) confirmation that all of Adnani Corp.’s and Mr. Adnani’s then benefits coverage would be extended to Mr. Adnani for a period ending two years from the effective termination date (the “Adnani Benefits Extension”).
If the Company elects to terminate the Adnani Agreement without just cause (as defined therein), or if Adnani Corp. terminates the Adnani Agreement for just cause, and provided that Adnani Corp. is in compliance with the relevant terms and conditions of the Adnani Agreement, the Company shall be obligated to provide a termination package to Adnani Corp. as follows: (i) a cash payment equating to an aggregate of 24 months of the then monthly fee, together with a cash payment equating to two times the sum of Adnani Corp.’s average annual bonus during the most recent two years, payable by the Company to Adnani Corp. within 14 calendar days of the effective termination date; (ii) all Adnani Outstanding Expense Reimbursements; (iii) subject to applicable provisions of the Adnani Agreement, the Adnani Options Extension; and (iv) the Adnani Benefits Extension.
If Adnani Corp. elects to terminate the Adnani Agreement for good reason (as defined therein) and including, without limitation, a material diminution of Mr. Adnani’s duties, a failure of the Company to deliver a written agreement to be entered into with any successor, assignee or transferee of the Company to assume and agree to perform the Adnani Agreement, a failure of the Company to pay remuneration or any other breach by the Company of a material provision of the Adnani Agreement, and provided that Adnani Corp. is in compliance with the relevant terms and conditions of the Adnani Agreement, the Company shall be obligated to provide a termination package to Adnani Corp. as follows: (i) a cash payment equating to an aggregate of 18 months of the then monthly fee, together with a cash payment equating to one and one-half times the sum of Adnani Corp.’s average annual bonus during the most recent two years, payable by the Company to Adnani Corp. over a period of 12 months from the effective termination date; (ii) all Adnani Outstanding Expense Reimbursements; (iii) subject to applicable provisions of the Adnani Agreement, the Adnani Options Extension; and (iv) the Adnani Benefits Extension.
If Adnani Corp. elects to terminate the Adnani Agreement, except for just cause, or if the Company terminates the Adnani Agreement for just cause, Adnani Corp. is not entitled to a termination package of any kind.
The Adnani Agreement will be deemed terminated on the 30th calendar day following the death or disability of Mr. Adnani, in which case the Company shall be obligated to provide a termination package to Adnani Corp. or Mr. Adnani’s estate as follows, provided that Adnani Corp. is or was in compliance with the relevant terms and conditions of the Adnani Agreement: (i) a cash payment equating to an aggregate of 12 months of the then monthly fee, together with a cash payment equating to Adnani Corp’s average annual bonus during the most recent two years, payable by the Company to Adnani Corp. or Mr. Adnani’s estate within 14 calendar days of the effective termination date; (ii) all Adnani Outstanding Expense Reimbursements; and (iii) subject to applicable provisions of the Adnani Agreement, the Adnani Options Extension.
Melbye Executive Employment Agreement
On December 15, 2014, our Board of Directors approved the entering into of an executive services agreement with Scott Melbye, as amended by a letter agreement, dated for reference effective as at May 1, 2016, with an initial term commencing retroactively on September 1, 2014 and expiring on February 28, 2017 (collectively, the “Melbye Agreement”).
The Melbye Agreement is subject to automatic renewal on a one-month to one-month term renewal basis unless either the Company or Mr. Melbye provides written notice not to renew the Melbye Agreement no later than 30 calendar days prior to the end of the then current or renewal term.
Pursuant to the terms and provisions of the Melbye Agreement: (i) Mr. Melbye shall provide duties to us commensurate with his position as our Executive Vice President; and (ii) we shall pay to Mr. Melbye a monthly fee of $20,833. In consultation with the Compensation Committee and Board of Directors, effective from May 1, 2016, the monthly fee payable to Mr. Melbye was reduced on a non-accrued basis, from its original and stated amount to $18,750. Effective from June 1, 2016, a portion of monthly fees were paid in shares of common stock in lieu of cash at the discretion of the Company management to alter from time to time. Effective from April 1, 2020, due to the COVID-19 pandemic, the monthly fee payable to Mr. Melbye was reduced on a non-accrued basis from its original and stated amount to $12,187.50. Effective on October 1, 2020, the monthly fee payable was reinstated to the level in effect prior to April 1, 2020.
If the Company elects to not renew the Melbye Agreement, and provided that Mr. Melbye is in compliance with the relevant terms and conditions of the same, the Company shall be obligated to provide a severance package to Mr. Melbye as follows: (i) a cash payment equating to any outstanding fees and bonuses which would then be due and owing by the Company to Mr. Melbye to the effective termination date, payable within 14 calendar days of the effective termination date (the “Melbye Outstanding Fees and Bonuses”); (ii) any expense payment reimbursements which would then be due and owing by the Company to Mr. Melbye to the effective termination date, payable within 14 calendar days of the effective termination date (the “Melbye Outstanding Expense Reimbursements”); (iii) any pro rata and unused vacation pay which would then be due and owing by the Company to Mr. Melbye to the effective termination date, payable within 14 calendar days of the effective termination date (the “Melbye Outstanding Vacation Pay”); (iv) subject to applicable provisions of the Melbye Agreement and the Company’s Stock Incentive Plan, all of Mr. Melbye’s then issued and outstanding stock-based equity awards in and to the Company as at the effective termination date shall immediately vest, if not otherwise vested, and shall continue to be exercisable for a period of 90 calendar days from the effective termination date (the “Melbye Options Extension”); and (v) confirmation that all of Mr. Melbye’s then benefits coverage would be extended to Mr. Melbye for a period ending 90 calendar days from the effective termination date (the “Melbye Benefits Extension”).
If the Company elects to terminate the Melbye Agreement without just cause (as defined therein), or if Mr. Melbye terminates the Melbye Agreement for just cause, and provided that Mr. Melbye is in compliance with the relevant terms and conditions of the same, the Company shall be obligated to provide a severance package to Mr. Melbye as follows: (i) all Melbye Outstanding Fees and Bonuses, together with a cash payment equating to any additional fees which Mr. Melbye would have been entitled to receive until the end of the applicable initial term or renewal period; (ii) all Melbye Outstanding Expense Reimbursements; (iii) all Melbye Outstanding Vacation Pay; (iv) the Melbye Options Extension; and (v) the Melbye Benefits Extension.
If Mr. Melbye elects to terminate the Melbye Agreement, except for just cause, and provided that Mr. Melbye is in compliance with the relevant terms and conditions of the Melbye Agreement, the Company shall be obligated to provide a severance package to Mr. Melbye as follows: (i) all Melbye Outstanding Fees and Bonuses; (ii) all Melbye Outstanding Expense Reimbursements; (iii) all Melbye Outstanding Vacation Pay; and (iv) subject to applicable provisions of the Melbye Agreement, all of Mr. Melbye’s then issued and outstanding stock-based equity awards in and to the Company that have vested as at the effective termination date shall continue to be exercisable for a period of 90 calendar days from the effective termination date.
If the Company elects to terminate the Melbye Agreement for just cause, the Company shall be obligated to provide a severance package to Mr. Melbye as follows: (i) a cash payment equating to any outstanding fees which would then be due and owing by the Company to Mr. Melbye to the effective termination date, payable within 14 calendar days of the effective termination date; (ii) all Melbye Outstanding Expense Reimbursements; and (iii) all Melbye Outstanding Vacation Pay.
The Melbye Agreement will be deemed terminated on the 30th calendar day following the death or disability of Mr. Melbye, in which case the Company shall be obligated to provide a severance package to Mr. Melbye or Mr. Melbye’s estate as follows, provided that Mr. Melbye is or was in compliance with the relevant terms and conditions of the Melbye Agreement: (i) all Melbye Outstanding Fees and Bonuses; (ii) all Melbye Outstanding Expense Reimbursements; (iii) all Melbye Outstanding Vacation Pay; and (iv) subject to applicable provisions of the Melbye Agreement, all of Mr. Melbye’s then issued and outstanding stock-based equity awards in and to the Company that have vested as at the effective termination date shall continue to be exercisable for a period of one year from the effective termination date.
Obara Consulting Services Agreement
On August 15, 2007, our Board of Directors approved the entering into of a consulting services agreement with Obara Builders Ltd. (“Obara Ltd.”), Mr. Obara’s services corporation, as amended by a letter agreement, dated for reference effective as at October 14, 2015 (collectively, the “Obara Agreement”). The Obara Agreement is subject to automatic renewal on a three-month to three-month basis unless the Company provides written notice not to renew the Obara Agreement no later than 90 days prior to the end of the then current or renewal term.
Pursuant to the terms and provisions of the Obara Agreement: (i) Pat Obara provides various services to the Company which are in addition to his duties and responsibilities as our Secretary, Treasurer and Chief Financial Officer of the Company; and (ii) we shall pay to Mr. Obara a monthly fee of CA$13,750. In consultation with the Compensation Committee and Board of Directors, effective from May 1, 2016, the monthly fee payable to Mr. Obara was reduced on a non-accrued basis, from its original and stated amount to CA$12,375, of which a portion was paid in shares of common stock in lieu of cash at the discretion of the Compensation Committee to alter from time to time. Effective from April 1, 2020, due to the COVID-19 pandemic, the monthly fee payable to Mr. Obara was reduced on a non-accrued basis from its original and stated amount to CA$8,043.75. Effective on October 1, 2020, the monthly fee payable was reinstated to the level in effect prior to April 1, 2020.
If the Company elects to not renew the Obara Agreement or any party elects to terminate the Obara Agreement, Mr. Obara’s obligation to provide the services to the Company will continue only until the effective termination date and the Company shall be obligated to provide to Mr. Obara: (i) any fees which would then be due and owing by the Company to Mr. Obara to the effective termination date; (ii) any expense payment reimbursements which would then be due and owing by the Company to Mr. Obara to the effective termination date (the “Obara Outstanding Expense Reimbursements”); (iii) any pro rata and unused vacation pay which would then be due and owing by the Company to Mr. Obara to the effective termination date (the “Obara Outstanding Vacation Pay”); (iv) subject to applicable provisions of the Obara Agreement and the Company’s Stock Incentive Plan, the vested portion of all Mr. Obara’s then issued and outstanding stock-based equity awards in and to the Company as at the effective termination date shall continue to be exercisable for a period of 90 calendar days following the effective termination date (the “Obara Options”); and (v) confirmation that all of Mr. Obara’s then benefits coverage would be covered until the effective termination date (the “Obara Benefits”).
The Obara Agreement will be deemed terminated on the 30th calendar day following the death or disability of Mr. Obara, in which case the Company shall be obligated to provide to Mr. Obara: (i) any fees which would then be due and owing by the Company to Mr. Obara to the effective termination date; (ii) Obara Outstanding Expense Reimbursements; (iii) the Obara Outstanding Vacation Pay; (iv) the Obara Options; and (v) the Obara Benefits.
Obara Ltd. was dissolved in Fiscal 2016 and, as a result the Obara Agreement was terminated. However, the Company’s and Mr. Obara’s ongoing obligations remain as contemplated and set forth in the Obara Agreement.
Director Services Agreement
Abraham Appointment Letter
On October 14, 2015, our Board of Directors approved the entering into of an appointment letter with Spencer Abraham dated for reference effective as at October 1, 2015 (the “Abraham Agreement”).
Pursuant to the Abraham Agreement: (i) Mr. Abraham was appointed as Chairman of our Board of Directors and shall provide duties to us commensurate with his position; (ii) we shall pay to Mr. Abraham a monthly fee of $10,833; and (iii) we shall pay to Mr. Abraham an annual fee of $20,000 in connection with his tenure as a director of our Company.
In consultation with the Compensation Committee and Board of Directors, effective from May 1, 2016: (i) the monthly fee payable to Mr. Abraham was reduced on a non-accrued basis, from its original and stated amount to $9,750, of which a portion was paid in shares of common stock in lieu of cash; and (ii) the annual fee payable to Mr. Abraham was reduced on a non-accrued basis, from its original and stated amount to $18,000, of which a portion was paid in shares of common stock in lieu of cash at the discretion of the Company management to alter from time to time. Effective from April 1, 2020, due to the COVID-19 pandemic: (i) the monthly fee payable to Mr. Abraham was reduced on a non-accrued basis from its original and stated amount to $6,337.50; and (ii) the annual fee payable to Mr. Abraham was reduced on a non-accrued basis, from its original and stated amount to $11,700. Effective on October 1, 2020, the fees payable were reinstated to the levels in effect prior to April 1, 2020.
Item 12. Security Ownership of Certain Beneficial Owners and Management and Related Stockholder Matters
The following table sets forth information regarding the beneficial ownership of our common stock as of October 27, 2020, by:
|
● |
each person who is known by us to beneficially own more than 5% of our shares of common stock; and |
|
● |
each executive officer, each director and all of our directors and executive officers as a group. |
The number of shares beneficially owned and the related percentages are based on 197,376,792 shares of common stock outstanding as of October 27, 2020.
For the purposes of the information provided below, shares that may be issued upon the exercise or conversion of stock options, warrants and other rights to acquire shares of our common stock that are exercisable or convertible within 60 days following October 27, 2020, are deemed to be outstanding and beneficially owned by the holder for the purpose of computing the number of shares and percentage ownership of that holder, but are not deemed to be outstanding for the purpose of computing the percentage ownership of any other person.
|
Name and Address of Beneficial Owner (1) |
Amount and Nature of |
Percentage of |
|
Directors and Executive Officers: |
|
|
|
Amir Adnani |
3,955,571 (2) |
2.0% |
|
Spencer Abraham |
479,587 (3) |
* |
|
Vincent Della Volpe |
398,677 (4) |
* |
|
David Kong |
328,333 (5) |
* |
|
Ganpat Mani |
310,633 (6) |
* |
|
Gloria Ballesta |
241,538 (7) |
* |
|
Pat Obara |
791,586 (8) |
* |
|
Scott Melbye 500 North Shoreline Boulevard, Suite 800N Corpus Christi, Texas, U.S.A., 78401 |
901,238 (9) |
* |
|
All directors and executive officers as a group |
7,407,163 (10) |
3.7% |
|
Major Shareholder: |
||
|
BlackRock, Inc. |
12,281,857 (11) |
6.2% |
Notes:
|
* |
Less than one percent. |
|
(1) |
Under Rule 13d-3 of the Exchange Act, a beneficial owner of a security includes any person who, directly or indirectly, through any contract, arrangement, understanding, relationship or otherwise, has or shares: (i) voting power, which includes the power to vote, or to direct the voting of such security; and (ii) investment power, which includes the power to dispose or direct the disposition of the security. Certain shares of common stock may be deemed to be beneficially owned by more than one person (if, for example, persons share the power to vote or the power to dispose of the shares). In addition, shares of common stock are deemed to be beneficially owned by a person if the person has the right to acquire the shares (for example, upon exercise of an option) within 60 days of the date as of which the information is provided. In computing the percentage ownership of any person, the amount of shares of common stock outstanding is deemed to include the amount of shares beneficially owned by such person (and only such person) by reason of these acquisition rights. As a result, the percentage of outstanding shares of common stock of any person as shown in this table does not necessarily reflect the person’s actual ownership or voting power with respect to the number of shares of common stock actually outstanding as of the date hereof. As of October 27, 2020, there were 197,376,792 shares of common stock of the Company issued and outstanding. |
|
(2) |
This figure represents (i) 2,733,146 shares of common stock, (ii) 3,000 shares of common stock held of record by Mr. Adnani’s wife, (iii) stock options to purchase 1,158,750 shares of our common stock, which have vested or will vest within 60 days of the date hereof, and (iv) performance based restricted stock units to receive 60,675 shares of our common stock on settlement, which have vested. |
|
(3) |
This figure represents (i) 184,587 shares of common stock and (ii) stock options to purchase 295,000 shares of our common stock, which have vested or will vest within 60 days of the date hereof. |
|
(4) |
This figure represents (i) 224,302 shares of common stock and (ii) stock options to purchase 174,375 shares of our common stock, which have vested or will vest within 60 days of the date hereof. |
|
(5) |
This figure represents (i) 136,958 shares of common stock, (ii) 7,000 shares of common stock held of record by Mr. Kong’s wife and (iii) stock options to purchase 184,375 shares of our common stock, which have vested or will vest within 60 days of the date hereof. |
|
(6) |
This figure represents (i) 151,258 shares of common stock and (ii) stock options to purchase 159,375 shares of our common stock, which have vested or will vest within 60 days of the date hereof. |
|
(7) |
This figure represents (i) 77,163 shares of common stock and (ii) stock options to purchase 164,375 shares of our common stock, which have vested or will vest within 60 days of the date hereof. |
|
(8) |
This figure represents (i) 387,736 shares of common stock, (ii) stock options to purchase 383,625 shares of our common stock, which have vested or will vest within 60 days of the date hereof and (iii) performance based restricted stock units to receive 20,225 shares of our common stock on settlement, which have vested. |
|
(9) |
This figure represents (i) 314,012 shares of common stock, (ii) stock options to purchase 578,125 shares of our common stock, which have vested or will vest within 60 days of the date hereof and (iii) performance based restricted stock units to receive 9,101 shares of our common stock on settlement, which have vested. |
|
(10) |
This figure represents (i) 4,219,162 shares of common stock, (ii) stock options to purchase 3,098,000 shares of our common stock, which have vested or will vest within 60 days of the date hereof and (iii) performance based restricted stock units to receive 90,001 shares of our common stock on settlement, which have vested. |
|
(11) |
This information is based on a Form 13F filed with the SEC by BlackRock Inc. on August 14, 2020. |
Changes in Control
We have no knowledge of any arrangements, including any pledge by any person of our securities, the operation of which may, at a subsequent date, result in a change in our control.
Item 13. Certain Relationships and Related Transactions, and Director Independence
Related Party Transactions
Except as described in this Annual Report, the Company was not involved in any transactions during Fiscal 2020, and is not involved in any currently proposed transaction, in which the Company was or is to be a participant and the amount involved exceeds $120,000 in which a related person had or will have a direct or indirect material interest.
During Fiscal 2020, we incurred $98,150 (Fiscal 2019: $149,692 and Fiscal 2018: $148,081) in general and administrative expenses due to Blender Media Inc. (“Blender”), a company controlled by Arash Adnani, a direct family member of our President and Chief Executive Officer, for various services including information technology, corporate branding, media, website design, maintenance and hosting, provided to our Company.
During Fiscal 2018, we issued 104,706 shares with a fair value of $141,678 as settlement of the equivalent amounts owed to Blender.
At July 31, 2020, amounts owed to Blender totaled $31,334 (July 31, 2019: $68,680). These amounts are unsecured, non-interest bearing and due on demand.
Our Audit Committee is charged with reviewing and approving all related party transactions and reviewing and making recommendations to the Board of Directors, or approving any contracts or other transactions with any of our current or former executive officers. The Charter of the Audit Committee sets forth the Company’s written policy for the review of related party transactions.
Director Independence
The Board of Directors has determined that Vincent Della Volpe, David Kong, Ganpat Mani and Gloria Ballesta each qualify as independent directors under the listing standards of the NYSE American.
Item 14. Principal Accounting Fees and Services
Ernst & Young LLP served as our independent registered public accounting firm for Fiscal 2019 and from August 2019 to April 2020 and audited our financial statements for the fiscal year ended July 31,2019.
PricewaterhouseCoopers LLP serves as our independent registered public accounting firm from May 2020 and audited our financial statements for the fiscal year ended July 31, 2020. Aggregate fees for professional services rendered to us by our auditors for our last two years are set forth below:
|
Year Ended July 31, 2020 |
Year Ended July 31, 2019 |
|||||||
|
Audit Fees |
$ | 297,707 | $ | 357,995 | ||||
|
Audit Related Fees |
- | - | ||||||
|
Tax Fees |
52,680 | 72,277 | ||||||
|
Total |
$ | 350,387 | $ | 430,272 | ||||
Audit Fees. Audit fees consist of aggregate fees for professional services in connection with the audit of our annual financial statements, quarterly reviews of our financial statements included in our quarterly reports and services in connection with statutory and regulatory filings.
Audit-Related Fees. Audit-related fees consist of aggregate fees for assurance and related services related to the audit or review of our financial statements that are not reported under “Audit Fees” above.
Tax Fees. Tax fees consist of aggregate fees for professional services for tax compliance, tax advice and tax planning, primarily, fees related to tax preparation services.
Pre-Approval of Services by the Independent Auditor
The Audit Committee is responsible for the pre-approval of audit and permitted non-audit services to be performed by the Company’s independent auditor. The Audit Committee will, on an annual basis, consider and, if appropriate, approve the provision of audit and non-audit services by the Company’s independent auditor. Thereafter, the Audit Committee will, as necessary, consider and, if appropriate, approve the provision of additional audit and non-audit services by the Company’s independent auditor which are not encompassed by the Audit Committee’s annual pre-approval and are not prohibited by law. The Audit Committee has delegated to the Chair of the Audit Committee the authority to pre-approve, on a case-by-case basis, non-audit services to be performed by the Company’s independent auditor. The Audit Committee has approved all audit and permitted non-audit services performed by its independent auditor, PricewaterhouseCoopers LLP, and its former independent auditor, Ernst & Young LLP for Fiscal 2020.
Part iv
Item 15. Exhibits, Financial Statement Schedules
The following exhibits are filed with this Annual Report on Form 10-K:
|
Exhibit Number |
Description of Exhibit | |
|
2.1 |
||
|
2.2 |
||
|
2.3 |
||
|
2.4 |
||
|
2.5 |
||
|
3.1 |
||
|
3.1.1 |
||
|
3.2 |
||
|
4.1 |
||
|
4.2 |
||
|
10.1 |
Letter Agreement between La Merced del Pueblo de Cebolleta and Neutron Energy, Inc. (3) |
|
|
10.2 |
||
|
10.3 |
||
|
10.4 |
Consulting Services Agreement between Uranium Energy Corp. and Obara Builders Ltd. (4) |
|
|
10.5 |
Agreement to Purchase Assets between the Uranium Energy Corp. and Melvin O. Stairs, Jr. (5) |
|
|
10.6 |
||
|
10.7 |
Variation Agreement between Uran Limited and the Company dated May 28, 2009 (7) |
|
|
10.8 |
||
|
10.9 |
||
|
10.10 |
||
|
10.11 |
||
|
10.12 |
||
|
10.13 |
||
|
10.14 |
||
|
10.15 |
||
|
10.16 |
||
|
10.17 |
||
|
10.18 |
||
|
10.19 |
||
|
10.20 |
||
|
10.21 |
||
|
10.22 |
||
|
10.23 |
||
|
10.24 |
||
|
10.25 |
||
|
10.26 |
||
|
10.27 |
||
|
10.28 |
||
|
10.29 |
||
|
10.30 |
||
|
10.31 |
||
|
10.32 |
||
|
10.33 |
||
|
10.34 |
||
|
10.35 |
||
|
10.36 |
||
|
10.37 |
||
|
10.38 |
Form of Securities Purchase Agreement, dated as of October 17, 2013 (23) |
|
|
10.39 |
||
|
10.40 |
||
|
10.41 |
||
|
10.42 |
||
|
10.43 |
||
|
10.44 |
||
|
10.45 |
||
|
10.46 |
Amended and Restated Credit Agreement dated March 13, 2014 (29) |
|
|
10.47 |
||
|
10.48 |
||
|
10.49 |
||
|
10.50 |
||
|
10.51 |
||
|
10.52 |
||
|
10.53 |
||
|
10.54 |
||
|
10.55 |
Appointment Letter dated October 1, 2015 with Spencer Abraham * |
|
|
10.56 |
Second Amended and Restated Credit Agreement dated February 9, 2016 (36) |
|
|
10.57 |
||
|
10.58 |
||
|
10.59 |
||
|
10.60 |
||
|
10.61 |
||
|
10.62 |
||
|
10.63 |
||
|
10.64 |
||
|
10.65 |
||
|
10.66 |
||
|
10.67 |
||
|
10.68 |
||
|
10.69 |
||
|
10.70 |
Third Amended and Restated Credit Agreement dated December 5, 2018 (51) |
|
|
10.71 |
||
|
10.72 |
||
|
10.73 |
||
|
10.74 |
||
|
10.75 |
||
|
10.76 |
||
|
21.1 |
||
| 23.1 | Consent of Independent Auditors, PricewaterhouseCoopers LLP * | |
|
23.2 |
||
|
31.1 |
||
|
31.2 |
||
|
32.1 |
||
|
101.1NS
101.SCH
101.CAL
101.DEF
101.LAB
101.PRE |
XBRL Instance Document
XBRL Taxonomy Extension Schema Document
XBRL Taxonomy Extension Calculation Linkbase Document
XBRL Taxonomy Extension Definitions Linkbase Document
XBRL Taxonomy Extension Label Linkbase Document
XBRL Taxonomy Extension Presentation Linkbase Document |
|
Notes:
|
* |
Filed herewith. |
|
(1) |
Incorporated by reference to our Registration Statement on Form SB-2 filed with the SEC on August 4, 2005. |
|
(2) |
Incorporated by reference to our Current Report on Form 8-K filed with the SEC on February 9, 2006. |
|
(3) |
Incorporated by reference to our Current Report on Form 8-K filed with the SEC on May 4, 2007. |
|
(4) |
Incorporated by reference to our Current Report on Form 8-K filed with the SEC on October 9, 2007. |
|
(5) |
Incorporated by reference to our Current Report on Form 8-K filed with the SEC on November 6, 2007. |
|
(6) |
Incorporated by reference to our Current Report on Form 8-K filed with the SEC on January 16, 2009. |
|
(7) |
Incorporated by reference to our Current Report on Form 8-K filed with the SEC on June 2, 2009. |
|
(8) |
Incorporated by reference to our Current Report on Form 8-K filed with the SEC on June 9, 2009. |
|
(9) |
Incorporated by reference to our Current Report on Form 8-K filed with the SEC on July 27, 2009. |
|
(10) |
Incorporated by reference to our Registration Statement on Form S-8 filed with the SEC on October 1, 2009. |
|
(11) |
Incorporated by reference to our Annual Report on Form 10-K/A filed with the SEC on April 21, 2010. |
|
(12) |
Incorporated by reference to our Current Report on Form 8-K filed with the SEC on February 23, 2010. |
|
(13) |
Incorporated by reference to our Registration Statement on Form S-8 filed with the SEC on February 7, 2011. |
|
(14) |
Incorporated by reference to our Current Report on Form 8-K filed with the SEC on January 10, 2011. |
|
(15) |
Incorporated by reference to our Current Report on Form 8-K filed with the SEC on May 11, 2011. |
|
(16) |
Incorporated by reference to our Current Report on Form 8-K filed with the SEC on May 17, 2011. |
|
(17) |
Incorporated by reference to our Current Report on Form 8-K filed with the SEC on July 11, 2011. |
|
(18) |
Incorporated by reference to our Current Report on Form 8-K filed with the SEC on October 31, 2011. |
|
(19) |
Incorporated by reference to our Current Report on Form 8-K filed with the SEC on November 8, 2011. |
|
(20) |
Incorporated by reference to our Current Report on Form 8-K filed with the SEC on March 5, 2012. |
|
(21) |
Incorporated by reference to our Current Report on Form 8-K filed with the SEC on August 5, 2013. |
|
(22) |
Incorporated by reference to our Current Report on Form 8-K filed with the SEC on October 2, 2013. |
|
(23) |
Incorporated by reference to our Current Report on Form 8-K filed with the SEC on October 23, 2013. |
|
(24) |
Incorporated by reference to our Registration Statement on Form S-3 filed with the SEC on November 19, 2013. |
|
(25) |
Incorporated by reference to our Registration Statement on Form S-8 filed with the SEC on November 21, 2013. |
|
(26) |
Incorporated by reference to our Current Report on Form 8-K/A filed with the SEC on December 6, 2013. |
|
(27) |
Incorporated by reference to our Registration Statement on Form S-3 filed with the SEC on December 27, 2013. |
|
(28) |
Incorporated by reference to our Current Report on Form 8-K filed with the SEC on December 31, 2013. |
|
(29) |
Incorporated by reference to our Current Report on Form 8-K filed with the SEC on March 19, 2014. |
|
(30) |
Incorporated by reference to our Annual Report on Form 10-K filed with the SEC on October 14, 2014. |
(31) Incorporated by reference to our Registration Statement on Form S-8 filed with the SEC on January 9, 2015.
|
(32) |
Incorporated by reference to our Quarterly Report on Form 10-Q filed with the SEC on March 12, 2015. |
|
(33) |
Incorporated by reference to our Schedule 14A Definitive Proxy Statement filed with the SEC on June 19, 2015. |
|
(34) |
Incorporated by reference to our Current Report on Form 8-K filed with the SEC on June 25, 2015. |
|
(35) |
Incorporated by reference to our Quarterly Report on Form 10-Q filed with the SEC on December 8, 2015. |
|
(36) |
Incorporated by reference to our Current Report on Form 8-K filed with the SEC on February 16, 2016 |
|
(37) |
Incorporated by reference to our Current Report on Form 8-K filed with the SEC on March 10, 2016. |
|
(38) |
Incorporated by reference to our Current Report on Form 8-K filed with the SEC on March 10, 2016. |
|
(39) |
Incorporated by reference to our Registration Statement on Form S-8 filed with the SEC on September 2, 2016. |
|
(40) |
Incorporated by reference to our Registration Statement on Form S-3 filed with the SEC on January 5, 2017. |
|
(41) |
Incorporated by reference to our Current Report on Form 8-K filed with the SEC on January 17, 2017. |
|
(42) |
Incorporated by reference to our Current Report on Form 8-K filed with the SEC on March 9, 2017. |
|
(43) |
Incorporated by reference to our Quarterly Report on Form 10-Q filed with the SEC on June 9, 2017. |
|
(44) |
Incorporated by reference to our Current Report on Form 8-K filed with the SEC on August 11, 2017. |
|
(45) |
Incorporated by reference to our Registration Statement on Form S-3 filed with the SEC on September 8, 2017. |
|
(46) |
Incorporated by reference to our Annual Report on Form 10-K filed with the SEC on October 16, 2017. |
|
(47) |
Incorporated by reference to our Current Report on Form 8-K filed with the SEC on November 6, 2017. |
|
(48) |
Incorporated by reference to our Annual Report on Form 10-K filed with the SEC on October 15, 2018. |
|
(49) |
Incorporated by reference to our Registration Statement on Form S-8 filed with the SEC on August 27, 2018. |
|
(50) |
Incorporated by reference to our Current Report on Form 8-K filed with the SEC on October 1, 2018. |
|
(51) |
Incorporated by reference to our Current Report on Form 8-K filed with the SEC on December 7, 2018. |
|
(52) |
Incorporated by reference to our Current Report on Form 8-K filed with the SEC on March 18, 2019. |
|
(53) |
Incorporated by reference to our Current Report on Form 8-K filed with the SEC on April 9, 2019. |
|
(54) |
Incorporated by reference to our Registration Statement on Form S-8 filed with the SEC on September 12, 2019. |
|
(55) |
Incorporated by reference to our Current Report on Form 8-K filed with the SEC on March 19, 2020. |
|
(56) |
Incorporated by reference to our Current Report on Form 8-K filed with the SEC on September 21, 2020. |
_________
URANIUM ENERGY CORP.
CONSOLIDATED FINANCIAL STATEMENTS
JULY 31, 2020
Reports of Independent Registered Public Accounting Firms
Consolidated Balance Sheets
Consolidated Statements of Operations and Comprehensive Loss
Consolidated Statements of Cash Flows
Consolidated Statements of Stockholders’ Equity
Notes to the Consolidated Financial Statements

Report of Independent Registered Public Accounting Firm
To the Shareholders and Board of Directors of Uranium Energy Corp.
Opinion on the Financial Statements
We have audited the accompanying consolidated balance sheet of Uranium Energy Corp. and its subsidiaries (together, the Company) as of July 31, 2020 and the related consolidated statements of operations and comprehensive loss, cash flows and stockholders' equity for the year then ended, including the related notes (collectively referred to as the consolidated financial statements). In our opinion, the consolidated financial statements present fairly, in all material respects, the financial position of the Company as of July 31, 2020 and the results of its operations and its cash flows for the year then ended in conformity with accounting principles generally accepted in the United States of America.
Basis for Opinion
These consolidated financial statements are the responsibility of the Company’s management. Our responsibility is to express an opinion on the Company’s consolidated financial statements based on our audit. We are a public accounting firm registered with the Public Company Accounting Oversight Board (United States) (PCAOB) and are required to be independent with respect to the Company in accordance with the U.S. federal securities laws and the applicable rules and regulations of the Securities and Exchange Commission and the PCAOB.
We conducted our audit of these consolidated financial statements in accordance with the standards of the PCAOB. Those standards require that we plan and perform the audit to obtain reasonable assurance about whether the consolidated financial statements are free of material misstatement, whether due to error or fraud.
Our audit included performing procedures to assess the risks of material misstatement of the consolidated financial statements, whether due to error or fraud, and performing procedures that respond to those risks. Such procedures included examining, on a test basis, evidence regarding the amounts and disclosures in the consolidated financial statements. Our audit also included evaluating the accounting principles used and significant estimates made by management, as well as evaluating the overall presentation of the consolidated financial statements. We believe that our audit provides a reasonable basis for our opinion.
/s/ PricewaterhouseCoopers LLP
Chartered Professional Accountants
|
Vancouver, Canada October 28, 2020 |
We have served as the Company's auditor since 2020.
PricewaterhouseCoopers LLP
PricewaterhouseCoopers Place, 250 Howe Street, Suite 1400, Vancouver, British Columbia, Canada V6C 3S7
T: +1 604 806 7000, F: +1 604 806 7806
“PwC” refers to PricewaterhouseCoopers LLP, an Ontario limited liability partnership.
Report of Independent Registered Public Accounting Firm
To the Shareholders and the Board of Directors of Uranium Energy Corp.
Opinion on the Financial Statements
We have audited the accompanying consolidated balance sheet of Uranium Energy Corp. (the Company) as of July 31, 2019, the related consolidated statements of operations and comprehensive loss, cash flows and stockholders' equity for each of the two years in the period ended July 31, 2019, and the related notes (collectively referred to as the “consolidated financial statements”). In our opinion, the consolidated financial statements present fairly, in all material respects, the financial position of the Company at July 31, 2019, and the results of its operations and its cash flows for each of the two years in the period ended July 31, 2019, in conformity with U.S. generally accepted accounting principles.
Basis for Opinion
These consolidated financial statements are the responsibility of the Company's management. Our responsibility is to express an opinion on the Company’s consolidated financial statements based on our audits. We are a public accounting firm registered with the PCAOB and are required to be independent with respect to the Company in accordance with the U.S. federal securities laws and the applicable rules and regulations of the Securities and Exchange Commission and the PCAOB.
We conducted our audits in accordance with the standards of the PCAOB. Those standards require that we plan and perform the audit to obtain reasonable assurance about whether the financial statements are free of material misstatement, whether due to error or fraud. Our audits included performing procedures to assess the risks of material misstatement of the financial statements, whether due to error or fraud, and performing procedures that respond to those risks. Such procedures included examining, on a test basis, evidence regarding the amounts and disclosures in the financial statements. Our audits also included evaluating the accounting principles used and significant estimates made by management, as well as evaluating the overall presentation of the consolidated financial statements. We believe that our audits provide a reasonable basis for our opinion.
/s/ Ernst & Young LLP
Chartered Professional Accountants
We served as the Company's auditor from 2007 to 2020.
Vancouver, Canada
October 14, 2019
|
URANIUM ENERGY CORP. |
|
CONSOLIDATED BALANCE SHEETS |
|
|
|
Note(s) |
July 31, 2020 |
July 31, 2019 |
|||||||||
|
CURRENT ASSETS |
|||||||||||
|
Cash and cash equivalents |
5 | $ | 5,147,703 | $ | 6,058,186 | ||||||
|
Term deposits |
- | 11,831,671 | |||||||||
|
Inventories |
211,662 | 211,662 | |||||||||
|
Prepaid expenses and deposits |
1,111,152 | 1,343,458 | |||||||||
|
Other current assets |
119,362 | 264,956 | |||||||||
|
TOTAL CURRENT ASSETS |
6,589,879 | 19,709,933 | |||||||||
|
MINERAL RIGHTS AND PROPERTIES |
3 | 63,655,503 | 63,536,895 | ||||||||
|
PROPERTY, PLANT AND EQUIPMENT |
4 | 7,019,817 | 7,042,359 | ||||||||
|
RESTRICTED CASH |
5 | 1,839,216 | 1,821,392 | ||||||||
|
EQUITY-ACCOUNTED INVESTMENT |
6 | 11,515,327 | 8,680,449 | ||||||||
|
OTHER NON-CURRENT ASSETS |
7 | 769,875 | 249,214 | ||||||||
|
TOTAL ASSETS |
$ | 91,389,617 | $ | 101,040,242 | |||||||
|
CURRENT LIABILITIES |
|||||||||||
|
Accounts payable and accrued liabilities |
$ | 1,858,499 | $ | 3,002,688 | |||||||
|
Other current liabilities |
12 | 147,569 | - | ||||||||
|
Due to a related party |
8 | 31,334 | 68,680 | ||||||||
|
TOTAL CURRENT LIABILITIES |
2,037,402 | 3,071,368 | |||||||||
|
LONG-TERM DEBT |
9 | 19,869,477 | 19,599,963 | ||||||||
|
GOVERNMENT LOAN PAYABLE |
10 | 307,092 | - | ||||||||
|
ASSET RETIREMENT OBLIGATIONS |
11 | 3,734,314 | 3,541,082 | ||||||||
|
OTHER NON-CURRENT LIABILITIES |
12 | 479,714 | 50,010 | ||||||||
|
DEFERRED TAX LIABILITIES |
15 | 545,000 | 550,551 | ||||||||
|
TOTAL LIABILITIES |
26,972,999 | 26,812,974 | |||||||||
|
STOCKHOLDERS' EQUITY |
|||||||||||
|
Capital stock |
|||||||||||
|
Common stock $0.001 par value: 750,000,000 shares authorized, 184,635,870 shares issued and outstanding (July 31, 2019 - 180,896,431) |
13 | 184,636 | 180,896 | ||||||||
|
Additional paid-in capital |
341,059,972 | 336,047,595 | |||||||||
|
Share issuance obligation |
13 | 103,554 | 187,100 | ||||||||
|
Accumulated deficit |
(276,811,300 | ) | (262,200,784 | ) | |||||||
|
Accumulated other comprehensive (loss) income |
(120,244 | ) | 12,461 | ||||||||
|
TOTAL EQUITY |
64,416,618 | 74,227,268 | |||||||||
|
TOTAL LIABILITIES AND EQUITY |
$ | 91,389,617 | $ | 101,040,242 | |||||||
|
SUBSEQUENT EVENT |
1,13 | ||||||||||
The accompanying notes are an integral part of these consolidated financial statements
|
URANIUM ENERGY CORP. |
|
CONSOLIDATED STATEMENTS OF OPERATIONS AND COMPREHENSIVE LOSS |
|
|
|
Year Ended July 31, |
|||||||||||||||
|
Note(s) |
2020 |
2019 |
2018 |
||||||||||||
|
COSTS AND EXPENSES |
|||||||||||||||
|
Mineral property expenditures |
3 | $ | 4,582,403 | $ | 4,487,537 | 4,552,151 | |||||||||
|
General and administrative |
8,13 | 9,441,898 | 10,142,035 | 11,407,206 | |||||||||||
|
Depreciation, amortization and accretion |
3,4,11 | 310,222 | 347,441 | 354,624 | |||||||||||
|
LOSS FROM OPERATIONS |
(14,334,523 | ) | (14,977,013 | ) | (16,313,981 | ) | |||||||||
|
OTHER INCOME (EXPENSES) |
|||||||||||||||
|
Interest income |
181,520 | 433,031 | 227,534 | ||||||||||||
|
Interest expenses and finance costs |
9 | (3,460,970 | ) | (3,249,881 | ) | (2,952,202 | ) | ||||||||
|
Income (loss) from equity-accounted investment |
6 | 2,967,583 | (1,103,356 | ) | 423,657 | ||||||||||
|
Other income |
27,980 | 134,545 | 82,543 | ||||||||||||
|
Gain (loss) on disposition of assets |
3 | 2,343 | 1,595,513 | (1,696 | ) | ||||||||||
|
OTHER EXPENSES |
(281,544 | ) | (2,190,148 | ) | (2,220,164 | ) | |||||||||
|
LOSS BEFORE INCOME TAXES |
(14,616,067 | ) | (17,167,161 | ) | (18,534,145 | ) | |||||||||
|
DEFERRED TAX BENEFITS |
15 | 5,551 | 14,372 | 707,511 | |||||||||||
|
NET LOSS FOR THE YEAR |
(14,610,516 | ) | (17,152,789 | ) | (17,826,634 | ) | |||||||||
|
OTHER COMPREHENSIVE (LOSS) INCOME, NET OF INCOME TAXES |
6 | (132,705 | ) | 12,461 | 118,343 | ||||||||||
|
TOTAL COMPREHENSIVE LOSS FOR THE YEAR |
$ | (14,743,221 | ) | $ | (17,140,328 | ) | $ | (17,708,291 | ) | ||||||
|
NET LOSS PER SHARE, BASIC AND DILUTED |
14 | $ | (0.08 | ) | $ | (0.10 | ) | $ | (0.11 | ) | |||||
|
WEIGHTED AVERAGE NUMBER OF SHARES OUTSTANDING, BASIC AND DILUTED |
183,041,766 | 175,844,624 | 157,123,025 | ||||||||||||
The accompanying notes are an integral part of these consolidated financial statements
|
URANIUM ENERGY CORP. |
|
CONSOLIDATED STATEMENTS OF CASH FLOWS |
|
|
|
Year Ended July 31, |
|||||||||||||||
|
Note(s) |
2020 |
2019 |
2018 |
||||||||||||
|
NET CASH PROVIDED BY (USED IN): |
|||||||||||||||
|
OPERATING ACTIVITIES |
|||||||||||||||
|
Net loss for the period |
$ | (14,610,516 | ) | $ | (17,152,789 | ) | $ | (17,826,634 | ) | ||||||
|
Adjustments to reconcile net loss to cash flows in operating activities |
|||||||||||||||
|
Stock-based compensation |
13 | 3,493,218 | 2,948,041 | 3,504,058 | |||||||||||
|
Depreciation, amortization and accretion |
3,4,11 | 310,222 | 347,441 | 354,624 | |||||||||||
|
Amortization of long-term debt discount |
9 | 1,669,514 | 1,464,989 | 1,180,139 | |||||||||||
|
Re-valuation of asset retirement obligations |
- | (274,195 | ) | - | |||||||||||
|
(Gain) loss on disposition of assets |
(2,343 | ) | (1,595,513 | ) | 1,696 | ||||||||||
|
(Income) loss from equity-accounted investment |
6 | (2,967,583 | ) | 1,103,356 | (423,657 | ) | |||||||||
|
Deferred tax benefits |
(5,551 | ) | (14,372 | ) | (707,511 | ) | |||||||||
|
Realized loss on available-for-sale securities |
- | 799 | - | ||||||||||||
|
Reimbursable Expenses for Reno Creek acquisition |
- | - | 483,829 | ||||||||||||
|
Changes in operating assets and liabilities |
|||||||||||||||
|
Prepaid expenses and deposits |
453,949 | (62,225 | ) | 302,258 | |||||||||||
|
Other current assets |
145,594 | (86,395 | ) | (61,416 | ) | ||||||||||
|
Accounts payable and accrued liabilities |
(1,243,838 | ) | 679,522 | 681,286 | |||||||||||
|
Due to a related party |
8 | (37,346 | ) | 67,873 | 39 | ||||||||||
|
Other liabilities |
(76,031 | ) | - | - | |||||||||||
|
NET CASH USED IN OPERATING ACTIVITIES |
(12,870,711 | ) | (12,573,468 | ) | (12,511,289 | ) | |||||||||
|
FINANCING ACTIVITIES |
|||||||||||||||
|
Proceeds from share issuance, net of issuance costs |
- | 23,843,995 | 604,209 | ||||||||||||
|
Proceeds from government loans |
10 | 307,092 | - | - | |||||||||||
|
NET CASH PROVIDED BY FINANCING ACTIVITIES |
307,092 | 23,843,995 | 604,209 | ||||||||||||
|
INVESTING ACTIVITIES |
|||||||||||||||
|
Net cash and restricted cash received from a mineral property acquisition |
- | - | 289,038 | ||||||||||||
|
Investment in mineral rights and properties |
(80,000 | ) | (155,000 | ) | (3,588,759 | ) | |||||||||
|
Purchase of property, plant and equipment |
(83,838 | ) | (137,287 | ) | (12,304 | ) | |||||||||
|
Increase in other non-current assets |
- | - | (346,474 | ) | |||||||||||
|
Investment in term deposits |
- | (29,858,126 | ) | (21,771,253 | ) | ||||||||||
|
Proceeds from redemption of term deposits |
11,831,671 | 18,026,455 | 31,771,253 | ||||||||||||
|
Proceeds from disposition of assets |
3,127 | 16,587 | - | ||||||||||||
|
NET CASH PROVIDED BY (USED IN) INVESTING ACTIVITIES |
11,670,960 | (12,107,371 | ) | 6,341,501 | |||||||||||
|
NET CHANGE IN CASH, CASH EQUIVALENTS AND RESTRICTED CASH |
(892,659 | ) | (836,844 | ) | (5,565,579 | ) | |||||||||
|
CASH, CASH EQUIVALENTS AND RESTRICTED CASH, BEGINNING OF PERIOD |
7,879,578 | 8,716,422 | 14,282,001 | ||||||||||||
|
CASH, CASH EQUIVALENTS AND RESTRICTED CASH, END OF PERIOD |
5 | $ | 6,986,919 | $ | 7,879,578 | $ | 8,716,422 | ||||||||
|
SUPPLEMENTAL CASH FLOW INFORMATION |
18 | ||||||||||||||
The accompanying notes are an integral part of these consolidated financial statements
|
URANIUM ENERGY CORP. |
|
CONSOLIDATED STATEMENTS OF STOCKHOLDERS' EQUITY |
|
|
|
Common Stock |
Additional Paid-in |
Share Issuance |
Accumulated |
Accumulated Other Comprehensive |
Stockholders' |
|||||||||||||||||||||||
|
Shares |
Amount |
Capital |
Obligation |
Deficit |
Income (Loss) |
Equity |
||||||||||||||||||||||
|
Balance, July 31, 2017 |
139,815,124 | $ | 139,815 | $ | 272,697,152 | $ | 638,142 | $ | (227,325,002 | ) | $ | (14,702 | ) | $ | 46,135,405 | |||||||||||||
|
Common stock |
||||||||||||||||||||||||||||
|
Issued upon exercise of stock options |
1,094,589 | 1,095 | 528,955 | - | - | - | 530,050 | |||||||||||||||||||||
|
Issued upon exercise of warrants |
61,799 | 62 | 74,097 | - | - | - | 74,159 | |||||||||||||||||||||
|
Issued for credit facility |
641,574 | 641 | 899,359 | - | - | - | 900,000 | |||||||||||||||||||||
|
Issued in connection with mineral property acquisitions |
17,061,592 | 17,062 | 23,754,561 | - | - | - | 23,771,623 | |||||||||||||||||||||
|
Issued for advance royalty payment |
46,134 | 46 | 61,774 | - | - | - | 61,820 | |||||||||||||||||||||
|
Issued for settlement of liabilities |
565,499 | 566 | 845,258 | - | - | - | 845,824 | |||||||||||||||||||||
|
Stock-based compensation |
||||||||||||||||||||||||||||
|
Common stock issued for consulting services |
225,168 | 225 | 349,609 | - | - | - | 349,834 | |||||||||||||||||||||
|
Common stock issued under Stock Incentive Plan |
1,664,285 | 1,664 | 2,348,057 | (638,142 | ) | - | - | 1,711,579 | ||||||||||||||||||||
|
Amortization of stock-based compensation |
- | - | 1,414,629 | - | - | - | 1,414,629 | |||||||||||||||||||||
|
Warrants |
||||||||||||||||||||||||||||
|
Issued in connection with mineral property acquisition |
- | - | 5,088,928 | - | - | - | 5,088,928 | |||||||||||||||||||||
|
Net loss for the year |
- | - | - | - | (17,826,634 | ) | - | (17,826,634 | ) | |||||||||||||||||||
|
Other comprehensive income |
- | - | - | - | - | 118,343 | 118,343 | |||||||||||||||||||||
|
Balance, July 31, 2018 |
161,175,764 | 161,176 | 308,062,379 | - | (245,151,636 | ) | 103,641 | 63,175,560 | ||||||||||||||||||||
|
Common stock |
||||||||||||||||||||||||||||
|
Issued for equity financing, net of issuance costs |
12,613,049 | 12,613 | 15,978,348 | - | - | - | 15,990,961 | |||||||||||||||||||||
|
Issued upon exercise of stock options |
125,879 | 126 | 72,237 | - | - | - | 72,363 | |||||||||||||||||||||
|
Issued upon exercise of warrants |
3,999,881 | 4,000 | 4,818,357 | - | - | - | 4,822,357 | |||||||||||||||||||||
|
Issued in exchange of warrants pursuant to Securities Exchange Agreement |
750,000 | 750 | 976,814 | - | - | - | 977,564 | |||||||||||||||||||||
|
Issued for credit facility |
1,180,328 | 1,180 | 1,398,820 | - | - | - | 1,400,000 | |||||||||||||||||||||
|
Stock-based compensation |
||||||||||||||||||||||||||||
|
Common stock issued for consulting services |
165,404 | 163 | 226,376 | - | - | - | 226,539 | |||||||||||||||||||||
|
Common stock issued under Stock Incentive Plan |
886,126 | 888 | 1,173,956 | 187,100 | - | - | 1,361,944 | |||||||||||||||||||||
|
Amortization of stock-based compensation |
- | - | 1,359,558 | - | - | - | 1,359,558 | |||||||||||||||||||||
|
Warrants |
||||||||||||||||||||||||||||
|
Issued for equity financing |
- | - | 2,978,250 | - | - | - | 2,978,250 | |||||||||||||||||||||
|
Exchanged for common stock pursuant to Securities Exchange Agreement |
- | - | (4,950,000 | ) | - | - | - | (4,950,000 | ) | |||||||||||||||||||
|
Difference from Securities Exchange Agreement |
- | - | 3,952,500 | - | - | - | 3,952,500 | |||||||||||||||||||||
|
Net loss for the year |
- | - | - | - | (17,152,789 | ) | - | (17,152,789 | ) | |||||||||||||||||||
|
Reclassification upon adoption of ASU No. 2016-01 |
- | - | - | - | 103,641 | (103,641 | ) | - | ||||||||||||||||||||
|
Other comprehensive income |
- | - | - | - | - | 12,461 | 12,461 | |||||||||||||||||||||
|
Balance, July 31, 2019 |
180,896,431 | $ | 180,896 | $ | 336,047,595 | $ | 187,100 | $ | (262,200,784 | ) | $ | 12,461 | $ | 74,227,268 | ||||||||||||||
The accompanying notes are an integral part of these consolidated financial statements
|
URANIUM ENERGY CORP. |
|
CONSOLIDATED STATEMENTS OF STOCKHOLDERS' EQUITY |
|
Common Stock |
Additional Paid- |
Share Issuance |
Accumulated |
Accumulated Other |
Stockholders' |
|||||||||||||||||||||||
|
Shares |
Amount |
in Capital |
Obligation |
Deficit |
Income (Loss) |
Equity |
||||||||||||||||||||||
|
Balance, July 31, 2019 |
180,896,431 | $ | 180,896 | $ | 336,047,595 | $ | 187,100 | $ | (262,200,784 | ) | $ | 12,461 | $ | 74,227,268 | ||||||||||||||
|
Common stock |
||||||||||||||||||||||||||||
|
Issued for credit facility |
1,743,462 | 1,743 | 1,398,257 | - | - | - | 1,400,000 | |||||||||||||||||||||
|
Issued (accrued) upon vesting of RSUs and PRSUs |
105,844 | 106 | (153,307 | ) | 103,554 | - | - | (49,647 | ) | |||||||||||||||||||
|
Stock-based compensation |
||||||||||||||||||||||||||||
|
Common stock issued for consulting services |
380,933 | 381 | 350,696 | - | - | - | 351,077 | |||||||||||||||||||||
|
Common stock issued under Stock Incentive Plan |
1,509,200 | 1,510 | 1,308,507 | (187,100 | ) | - | - | 1,122,917 | ||||||||||||||||||||
|
Amortization of stock-based compensation |
- | - | 2,085,491 | - | - | - | 2,085,491 | |||||||||||||||||||||
|
Warrants |
||||||||||||||||||||||||||||
|
Issued for consulting services |
- | - | 22,733 | - | - | - | 22,733 | |||||||||||||||||||||
|
Net loss for the year |
- | - | - | - | (14,610,516 | ) | - | (14,610,516 | ) | |||||||||||||||||||
|
Other comprehensive loss |
- | - | - | - | - | (132,705 | ) | (132,705 | ) | |||||||||||||||||||
|
Balance, July 31, 2020 |
184,635,870 | $ | 184,636 | $ | 341,059,972 | $ | 103,554 | $ | (276,811,300 | ) | $ | (120,244 | ) | $ | 64,416,618 | |||||||||||||
The accompanying notes are an integral part of these consolidated financial statements
|
URANIUM ENERGY CORP. |
|
NOTES TO THE CONSOLIDATED FINANCIAL STATEMENTS |
|
JULY 31, 2020 |
|
NOTE 1: |
NATURE OF OPERATIONS |
Uranium Energy Corp. was incorporated in the State of Nevada on May 16, 2003. Uranium Energy Corp. and its subsidiary companies and a controlled partnership (collectively, the “Company”) are engaged in uranium mining and related activities, including exploration, pre-extraction, extraction and processing of uranium and titanium concentrates, on projects located in the United States, Canada and Paraguay.
At July 31, 2020, we had a working capital of $4.6 million including cash and cash equivalents of $5.1 million. Subsequent to July 31, 2020, we completed a public offering (the “September 2020 Offering”) of 12,500,000 units at a price of $1.20 per unit for gross proceeds of $15 million, which substantially increased our cash and cash equivalent and improved our working capital position. Refer to Note 13: Capital Stock herein. As a consequence, our existing cash resources and cash received from the September 2020 Offering are expected to provide sufficient funds to carry out our planned operations for 12 months from the date that our consolidated financial statements are issued. Our continuation as a going concern for a period beyond those 12 months will be dependent upon our ability to obtain adequate additional financing, as our operations are capital intensive and future capital expenditures are expected to be substantial.
Historically, we have been reliant primarily on equity financings from the sale of our common stock and on debt financing in order to fund our operations, and this reliance is expected to continue for the foreseeable future. Our continued operations, including the recoverability of the carrying values of our assets, are dependent ultimately on our ability to achieve and maintain profitability and positive cash flow from our operations.
|
NOTE 2: |
SUMMARY OF SIGNIFICANT ACCOUNTING POLICIES |
Basis of Presentation and Principles of Consolidation
These consolidated financial statements have been prepared in accordance with United States generally accepted accounting principles (“U.S. GAAP”) and are presented in United States dollars. All inter-company transactions and balances have been eliminated upon consolidation.
Exploration Stage
We have established the existence of mineralized materials for certain uranium projects, including the Palangana Mine. We have not established proven or probable reserves, as defined by the United States Securities and Exchange Commission (the “SEC”) under Industry Guide 7, through the completion of a “final” or “bankable” feasibility study for any of our uranium projects, including the Palangana Mine. Furthermore, we have no plans to establish proven or probable reserves for any of our uranium projects for which we plan on utilizing in-situ recovery (“ISR”) mining, such as the Palangana Mine. As a result, and despite the fact that we commenced extraction of mineralized materials at the Palangana Mine in November 2010, we remain in the Exploration Stage as defined under Industry Guide 7 and will continue to remain in the Exploration Stage until such time proven or probable reserves have been established.
Since we commenced extraction of mineralized materials at the Palangana Mine without having established proven or probable reserves, any mineralized materials established or extracted from the Palangana Mine should not in any way be associated with having established or produced from proven or probable reserves.
In accordance with U.S. GAAP, expenditures relating to the acquisition of mineral rights are initially capitalized as incurred while exploration and pre-extraction expenditures are expensed as incurred until such time we exit the Exploration Stage by establishing proven or probable reserves. Expenditures relating to exploration activities, such as drill programs to establish mineralized materials, are expensed as incurred. Expenditures relating to pre-extraction activities such as the construction of mine wellfields, ion exchange facilities and disposal wells, are expensed as incurred until such time proven or probable reserves are established for that project, after which expenditures relating to mine development activities for that particular project are capitalized as incurred.
|
URANIUM ENERGY CORP. |
|
NOTES TO THE CONSOLIDATED FINANCIAL STATEMENTS |
|
JULY 31, 2020 |
Companies in the Production Stage as defined under Industry Guide 7, having established proven and probable reserves and exited the Exploration Stage, typically capitalize expenditures relating to ongoing development activities, with corresponding depletion calculated over proven and probable reserves using the units-of-production method and allocated to future reporting periods to inventory and, as that inventory is sold, to cost of goods sold. We are in the Exploration Stage which has resulted in our Company reporting larger losses than if it had been in the Production Stage due to the expensing, instead of capitalization, of expenditures relating to ongoing mill and mine development activities. Additionally, there would be no corresponding depletion allocated to future reporting periods of our Company since those costs would have been expensed previously, resulting in both lower inventory costs and cost of goods sold and results of operations with higher gross profits and lower losses than if we had been in the Production Stage. Any capitalized costs, such as expenditures relating to the acquisition of mineral rights, are depleted over the estimated extraction life using the straight-line method. As a result, our consolidated financial statements may not be directly comparable to the financial statements of companies in the Production Stage.
Use of Estimates
The preparation of financial statements in conformity with U.S. GAAP requires management to make estimates and assumptions that affect the reported amount of assets and liabilities and disclosure of contingent assets and liabilities at the date of the financial statements and the reported revenues and expenses during the reported periods. Significant areas requiring management’s estimates and assumptions include valuation and measurement of impairment losses on mineral rights and properties, valuation of stock-based compensation and asset retirement obligations. Other areas requiring estimates include allocations of expenditures to inventories, depletion and amortization of mineral rights and properties and depreciation of property, plant and equipment. Actual results could differ significantly from those estimates and assumptions.
Foreign Currency Translation
The functional currency of our Company, including its subsidiaries, is the United States dollar. Our subsidiaries, UEC Resources Ltd., UEC Resources (SK) Ltd. and Cue Resources Ltd., maintain their accounting records in their local currency, the Canadian dollar. Piedra Rica Mining S.A., Transandes Paraguay S.A., MYNM, Trier S.A. and other Paraguayan subsidiaries maintain their accounting records in their local currency, the Paraguayan Guarani. In accordance with ASC 830: Foreign Currency Matters, the financial statements of our subsidiaries are translated into United States dollars using period-end exchange rates as to monetary assets and liabilities and average exchange rates as to revenues and expenses. Non-monetary assets are translated at their historical exchange rates. Net gains and losses resulting from foreign exchange translations and foreign currency exchange gains and losses on transactions occurring in a currency other than our Company’s functional currency are included in the determination of net loss in the period.
Cash and Cash Equivalents
Cash and cash equivalents consist of cash balances and term deposits with an original maturity of three months or less.
Term Deposits
Term deposits include short-term deposits held with banks with maturities from three months to one year from the date of the initial investments. Term deposits are classified as available-for-sale investments as they represent investments of cash available for current operations. Change in fair value of the available-for-sale investments are recorded in other comprehensive income (loss).
Equity-Accounted Investments
Investments in an entity in which our ownership is greater than 20% but less than 50%, or where other facts and circumstances indicate that we have the ability to exercise significant influence over the operating and financing policies of an entity, are accounted for using the equity method in accordance with ASC 323: Investments – Equity Method and Joint Ventures. Equity-Accounted Investments are recorded initially at cost and adjusted subsequently to recognize our share of the earnings, losses or other changes in capital of the investee entity after the date of acquisition. We periodically evaluate whether declines in fair values of our equity investments below the carrying value are other-than-temporary and if so, whether an impairment loss is required.
|
URANIUM ENERGY CORP. |
|
NOTES TO THE CONSOLIDATED FINANCIAL STATEMENTS |
|
JULY 31, 2020 |
Other Non-Current Assets
Other non-current assets include future expenditures that we have paid in advance but will not receive benefits within one year. Expenses are recognized over the period the expenditures are used or the benefits from the expenditures are received. Transaction costs incurred in connection with acquisitions of long-term assets are also included in other non-current assets, which will be capitalized as acquisition costs if the transaction succeeds or will be written off if the transaction does not complete. Right-of-use (“ROU”) assets recognized in connection with recognition of lease liabilities are also included in Other Non-Current Assets.
Mineral Rights
Acquisition costs of mineral rights are initially capitalized as incurred while exploration and pre-extraction expenditures are expensed as incurred until such time proven or probable reserves, as defined by the SEC under Industry Guide 7, are established for that project.
Where proven and probable reserves have been established, in accordance with Industry Guide 7, the project’s capitalized expenditures are depleted over proven and probable reserves using the units-of-production method upon commencement of production. Where proven and probable reserves have not been established, the project’s capitalized expenditures are depleted over the estimated extraction life using the straight-line method upon commencement of extraction. We have not established proven or probable reserves for any of our projects.
Databases
Expenditures relating to mineral property databases are capitalized upon acquisition while those developed internally are expensed as incurred. Mineral property databases are amortized using the straight-line method over a five-year period during which management believes these assets will contribute to our cash flows. Databases are included in Mineral Rights and Properties in our Consolidated Balance Sheets.
Property, Plant and Equipment
Property, plant and equipment are recorded at cost and depreciated to their estimated residual values using the straight-line method over their estimated useful lives, as follows:
|
● |
Hobson processing facility: 20 years; |
|
● |
Mining and logging equipment and vehicles: 5 to 10 years; |
|
● |
Computer equipment: 3 years; |
|
● |
Furniture and fixtures: 5 years; and |
|
● |
Building: 20 years |
Impairment of Long-Lived Assets
Long-lived assets are reviewed for impairment whenever events or changes in circumstances indicate the carrying amount of an asset may not be recoverable. Circumstances which could trigger a review include, but are not limited to: significant decreases in the market price of the asset; significant adverse changes in the business climate or legal factors; accumulation of costs significantly in excess of the amount originally expected for the acquisition or construction of the asset; current period cash flow or operating losses combined with a history of losses or a forecast of continuing losses associated with the use of the asset; and current expectation that the asset will more likely than not be sold or disposed of significantly before the end of its estimated useful life. Recoverability of these assets is measured by comparing the carrying value to the future undiscounted cash flows expected to be generated by the assets. When the carrying value of an asset exceeds the related undiscounted cash flows, an impairment loss is recorded by writing down the carrying value of the related asset to its estimated fair value, which is determined using discounted future cash flows or other measures of fair value.
|
URANIUM ENERGY CORP. |
|
NOTES TO THE CONSOLIDATED FINANCIAL STATEMENTS |
|
JULY 31, 2020 |
Income Taxes
We account for income taxes under the asset and liability method which requires the recognition of deferred income tax assets and liabilities for the expected future tax consequences of temporary differences between the carrying amounts and tax bases of assets and liabilities. We provide a valuation allowance on deferred tax assets unless it is more likely than not that such assets will be realized.
Restoration and Remediation Costs (Asset Retirement Obligations)
Various federal and state mining laws and regulations require our Company to reclaim the surface areas and restore underground water quality to the pre-existing quality or class of use after the completion of mining. We recognize the present value of the future restoration and remediation costs as an asset retirement obligation in the period in which we incur an obligation associated with the retirement of tangible long-lived assets that result from the acquisition, construction, development and/or normal use of the assets.
Asset retirement obligations consist of estimated final well closure, plant and equipment decommissioning and removal and environmental remediation costs to be incurred by our Company in the future. The asset retirement obligation is estimated based on the current costs escalated at an inflation rate and discounted at a credit adjusted risk-free rate. The asset retirement obligations are capitalized as part of the costs of the underlying assets and amortized over its remaining useful life. The asset retirement obligations are accreted to an undiscounted value until they are settled. The accretion expenses are charged to earnings and the actual retirement costs are recorded against the asset retirement obligations when incurred. Any difference between the recorded asset retirement obligations and the actual retirement costs incurred will be recorded as a gain or loss in the period of settlement.
Long-Term Debt
Long-Term Debt is carried at amortized cost. Debt issuance costs, debt premiums and discounts and annual fees are included in the long-term debt balance and amortized using the effective interest rate over the contractual terms of the Long-Term Debt.
Leases
We determine if a contractual arrangement represents or contains a lease at inception. Operating leases with lease terms greater than 12 months are included in Other Non-Current Assets, Other Current Liabilities and Other Non-Current Liabilities in our Consolidated Balance Sheet. Assets under finance leases are included in Property, Plant and Equipment and the related lease liabilities in Other Current Liabilities and Other Non-Current Liabilities in our Consolidated Balance Sheets.
Operating and finance lease ROU assets and lease liabilities are recognized based on the present value of the future lease payments over the lease term at the commencement date. When the rate implicit to the lease cannot be readily determined, we utilize the incremental borrowing rate in determining the present value of the future lease payments. The incremental borrowing rate is the rate of interest our Company would have to pay to borrow on a collateralized basis over a similar term and the amount equal to the lease payments in a similar economic environment.
The operating lease expenses are recognized on a straight-line basis over the lease term and included in general and administration expenses. Short-term leases, which have an initial term of 12 months or less, are not recorded in our Consolidated Balance Sheets.
We have leases arrangements that include both lease and non-lease components. We account for each separate lease component and its associated non-lease components as a single lease component for all of our asset classes.
|
URANIUM ENERGY CORP. |
|
NOTES TO THE CONSOLIDATED FINANCIAL STATEMENTS |
|
JULY 31, 2020 |
Stock-Based Compensation
We measure stock-based awards at fair value on the date of the grant and expense the awards in our Consolidated Statements of Operations and Comprehensive Loss over the requisite service period of employees or consultants. The fair value of stock options is determined using the Black-Scholes valuation model. The fair value of restricted stock units (“RSU”s) is determined using the share price of the Company at the date of grant. The fair value of performance based restricted stock units (“PRSU”s) is determined using the Monte Carlo simulation model. Stock-based compensation expense related to stock option awards is recognized over the requisite service period on an accelerating basis. Forfeitures are accounted for as they occur.
The Company’s estimates may be impacted by certain variables including, but not limited to, stock price volatility, employee stock option exercise behaviors, additional stock option grants, the Company's performance and related tax impacts.
Earnings (Loss) Per Common Share
Basic earnings or loss per share includes no potential dilution and is computed by dividing the earnings or loss attributable to common stockholders by the weighted-average number of common shares outstanding for the period. Diluted earnings or loss per share reflect the potential dilution of securities that could share in the earnings or loss of our Company. Since our Company has reported net losses since inception, all outstanding stock options, share purchase warrants, RSUs and PRSUs were excluded from the computation of diluted loss per share as their effects would be anti-dilutive.
Recently Adopted Accounting Standards
In February 2016 the Financial Accounting Standards Board (“FASB”) issued ASC 2016-02, “Leases”, (Topic “842”), together with subsequent amendments. The new standard requires a lessee to recognize on its balance sheet a liability to make lease payments (the lease liability) and ROU asset representing the right to the underlying asset for the lease term.
Effective August 1, 2019, we adopted this new standard using the modified retrospective approach with a cumulative-effect adjustment recorded at the beginning of the period of adoption. Therefore, upon adoption, we have recognized and measured leases without revising comparative period information or disclosure. We elected the package of practical expedients permitted under the transition guidance, which applies to expired or existing leases and allows our Company not to reassess whether a contract contains a lease, the lease classification and any initial direct costs incurred.
We elected the following optional practical expedients:
| ● |
we elected the short-term lease recognition exemption whereby ROU assets and lease liabilities will not be recognized for leasing arrangements with terms less than one year; |
| ● |
we elected the land easements practical expedient whereby existing land easements are not reassessed under the new standard; |
| ● |
we elected hindsight practical expedient when determining lease term; and |
| ● |
we elected the practical expedient not to separate non-lease components from lease components. |
Based on contracts outstanding at August 1, 2019, the adoption of the new standard resulted in the recognition of operating lease ROU assets of $876,590, including $92,235 reclassified from Prepaid Expenses and Deposits and lease liabilities of $784,355. Adoption of this standard did not have a material impact to our Consolidated Statements of Operations and Comprehensive Loss and our Consolidated Statements of Cash Flows. See Note 12: Lease Liabilities herein for additional qualitative and quantitative disclosures related to leasing arrangements.
|
URANIUM ENERGY CORP. |
|
NOTES TO THE CONSOLIDATED FINANCIAL STATEMENTS |
|
JULY 31, 2020 |
|
NOTE 3: |
MINERAL RIGHTS AND PROPERTIES |
Mineral Rights
At July 31, 2020, we had mineral rights in the States of Arizona, Colorado, New Mexico, Texas and Wyoming, in Canada and in Paraguay. These mineral rights were acquired through staking and purchase, lease or option agreements and are subject to varying royalty interests, some of which are indexed to the sale price of uranium. At July 31, 2020, annual maintenance payments of approximately $1,506,000 were required to maintain these mineral rights.
The carrying value of these mineral rights and properties are as follows:
|
July 31, 2020 |
July 31, 2019 |
|||||||
|
Mineral Rights and Properties |
||||||||
|
Palangana Mine |
$ | 6,027,784 | $ | 6,027,784 | ||||
|
Goliad Project |
8,689,127 | 8,689,127 | ||||||
|
Burke Hollow Project |
1,495,750 | 1,495,750 | ||||||
|
Longhorn Project |
116,870 | 116,870 | ||||||
|
Salvo Project |
14,905 | 14,905 | ||||||
|
Anderson Project |
3,470,373 | 3,470,373 | ||||||
|
Workman Creek Project |
799,854 | 699,854 | ||||||
|
Los Cuatros Project |
257,250 | 257,250 | ||||||
|
Slick Rock Project |
30,000 | - | ||||||
|
Reno Creek Project |
31,527,870 | 31,527,870 | ||||||
|
Diabase Project |
546,938 | 546,938 | ||||||
|
Yuty Project |
11,947,144 | 11,947,144 | ||||||
|
Oviedo Project |
1,133,412 | 1,133,412 | ||||||
|
Alto Paraná Titanium Project |
1,433,030 | 1,433,030 | ||||||
|
Other Property Acquisitions |
91,080 | 91,080 | ||||||
| 67,581,387 | 67,451,387 | |||||||
|
Accumulated Depletion |
(3,929,884 | ) | (3,929,884 | ) | ||||
| 63,651,503 | 63,521,503 | |||||||
|
Databases |
2,410,038 | 2,410,038 | ||||||
|
Accumulated Amortization |
(2,410,038 | ) | (2,409,188 | ) | ||||
| - | 850 | |||||||
|
Land Use Agreements |
48,770 | 404,310 | ||||||
|
Accumulated Amortization |
(44,770 | ) | (389,768 | ) | ||||
| 4,000 | 14,542 | |||||||
| $ | 63,655,503 | $ | 63,536,895 | |||||
We have not established proven or probable reserves, as defined by the SEC under Industry Guide 7, for any of our mineral projects. We have established the existence of mineralized materials for certain uranium projects, including the Palangana Mine. Since we commenced uranium extraction at the Palangana Mine without having established proven or probable reserves, there may be greater inherent uncertainty as to whether or not any mineralized material can be economically extracted as originally planned and anticipated.
The Palangana Mine has been the Company’s sole source to generate sales revenues from uranium concentrates. The Palangana Mine generated revenues during Fiscal 2012, Fiscal 2013 and Fiscal 2015, with no sales revenues generated during any other fiscal years. The economic viability of the Company’s mining activities, including the expected duration and profitability of the Palangana Mine and of any future satellite ISR mines, such as the Burke Hollow and Goliad Projects, located within the South Texas Uranium Belt, and the Reno Creek Project in Wyoming, have many risks and uncertainties. These include, but are not limited to: (i) a significant, prolonged decrease in the market price of uranium; (ii) difficulty in marketing and/or selling uranium concentrates; (iii) significantly higher than expected capital costs to construct the mine and/or processing plant; (iv) significantly higher than expected extraction costs; (v) significantly lower than expected uranium extraction; (vi) significant delays, reductions or stoppages of uranium extraction activities; and (vii) the introduction of significantly more stringent regulatory laws and regulations. Our mining activities may change as a result of any one or more of these risks and uncertainties and there is no assurance that any ore body that we extract mineralized materials from will result in profitable mining activities.
|
URANIUM ENERGY CORP. |
|
NOTES TO THE CONSOLIDATED FINANCIAL STATEMENTS |
|
JULY 31, 2020 |
During the year ended July 31, 2019 (“Fiscal 2019”), we completed a royalty purchase agreement (the "Royalty Purchase Agreement") whereby Uranium Royalty Corp (“URC”) purchased from our Company a 1% net smelter return royalty, for uranium only, on each of our Slick Rock Project, Workman Creek Project and Anderson Project. URC is an entity investing in the uranium sector over which our Company has the ability to exercise significant influence. Refer to Note 6: Equity-Accounted Investment herein. On December 4, 2018, we closed the Royalty Purchase Agreement and received 12,000,000 common shares of URC (the “Consideration Shares”) with a fair value of $9,077,842.
The fair value of the Consideration Shares, net of transaction costs of $55,787, was allocated to the respective underlying projects based on their identified mineral resources as follows:
|
Fair value of Consideration Shares |
$ | 9,077,842 | ||
|
Transaction costs |
55,787 | |||
|
Net consideration |
$ | 9,022,055 |
|
Net consideration allocation to: |
Allocation % |
Net Consideration Allocation |
||||||
|
Anderson Project |
63 | % | $ | 5,683,895 | ||||
|
Workman Creek Project |
12 | % | 1,082,646 | |||||
|
Slick Rock Project |
25 | % | 2,255,514 | |||||
| 100 | % | $ | 9,022,055 | |||||
The net consideration allocation amounts have reduced the carrying value of the Anderson Project by $5,683,895, the Workman Creek Project by $1,082,646 and the Slick Rock Project by $676,650. The net consideration of $2,255,514 allocated to the Slick Rock Project exceeded its then carrying value of $676,650 by $1,578,864, which was recorded as a gain on disposition of asset and included in our Consolidated Statements of Operations and Comprehensive Loss for Fiscal 2019.
|
URANIUM ENERGY CORP. |
|
NOTES TO THE CONSOLIDATED FINANCIAL STATEMENTS |
|
JULY 31, 2020 |
Mineral property expenditures incurred by major projects were as follows:
|
Year Ended July 31, |
||||||||||||
|
2020 |
2019 |
2018 |
||||||||||
|
Mineral Property Expenditures |
||||||||||||
|
Palangana Mine |
$ | 1,342,927 | $ | 1,027,139 | $ | 1,047,635 | ||||||
|
Goliad Project |
190,278 | 96,789 | 105,264 | |||||||||
|
Burke Hollow Project |
1,130,467 | 1,616,601 | 675,605 | |||||||||
|
Longhorn Project |
17,023 | 45,848 | 14,401 | |||||||||
|
Salvo Project |
28,318 | 35,923 | 36,056 | |||||||||
|
Anderson Project |
71,170 | 81,414 | 68,167 | |||||||||
|
Workman Creek Project |
32,700 | 30,709 | 31,300 | |||||||||
|
Slick Rock Project |
52,521 | 53,843 | 52,218 | |||||||||
|
Reno Creek Project |
596,551 | 655,807 | 1,278,959 | |||||||||
|
Yuty Project |
65,679 | 102,882 | 425,298 | |||||||||
|
Oviedo Project |
350,211 | 288,324 | 119,082 | |||||||||
|
Alto Paraná Titanium Project |
230,350 | 168,956 | 175,768 | |||||||||
|
Other Mineral Property Expenditures |
474,208 | 557,497 | 522,398 | |||||||||
|
Revaluation of Asset Retirement Obligations |
- | (274,195 | ) | - | ||||||||
| $ | 4,582,403 | $ | 4,487,537 | $ | 4,552,151 | |||||||
United States Projects
|
● |
Palangana Mine, Texas |
We hold various mining lease and surface use agreements granting us the exclusive right to explore, develop and mine for uranium at the Palangana Mine, a 6,987 acre property located in Duval County, Texas, approximately 100 miles south of our Hobson Processing Facility. These agreements are subject to certain royalty and overriding royalty interests indexed to the sale price of uranium and generally have an initial five-year term with extension provisions.
During Fiscal 2019, the asset retirement obligations (“ARO”) for the Palangana Mine was revised due to changes in the estimated timing of restoration and reclamation at the Palangana Mine. As a result, the corresponding mineral rights and properties was reduced by $258,114 and a credit amount for re-valuation of the ARO totaling $274,195 was recognized as a result of a downward adjustment to the fully depleted underlying mineral rights and properties, which was recorded against the mineral property expenditures for the Palangana Mine. Refer to Note 11: Asset Retirement Obligations herein.
During Fiscal 2020, Fiscal 2019, and Fiscal 2018, we continued with reduced operations at the Palangana Mine to capture residual uranium only. As a result, no depletion for the Palangana Mine was recorded on our consolidated financial statements.
|
● |
Goliad Project, Texas |
We hold various mining lease and surface use agreements granting us the exclusive right to explore, develop and mine for uranium at the Goliad Project, a 995 acre property located in Goliad County, Texas. These agreements are subject to certain fixed royalty interests based on net proceeds from sales or indexed to the sales price of uranium and have an initial five-year term with extension provisions.
|
● |
Burke Hollow Project, Texas |
We hold various mining lease and surface use agreements granting us the exclusive right to explore, develop and mine for uranium at the Burke Hollow Project, a 19,335 acre property located in Bee County, Texas. These agreements are subject to fixed royalty interests based on net proceeds from sales and have an initial five-year term with extension provisions.
|
URANIUM ENERGY CORP. |
|
NOTES TO THE CONSOLIDATED FINANCIAL STATEMENTS |
|
JULY 31, 2020 |
|
● |
Longhorn Project, Texas |
We hold various mining lease and surface use agreements granting us the exclusive right to explore, develop and mine for uranium at the Longhorn Project, a 651 acre property located in Live Oak County, Texas. These agreements are subject to certain royalty interests indexed to the sale price of uranium and have an initial five-year term with extension provisions.
|
● |
Salvo Project, Texas |
We hold various mining lease and surface use agreements granting us the exclusive right to explore, develop and mine for uranium at the Salvo Project, a 1,340 acre property located in Bee County, Texas. These agreements are subject to certain royalty interests indexed to the sales price of uranium and have an initial five-year term with extension provisions.
|
● |
Anderson Project, Arizona |
We hold an undivided 100% interest in contiguous mineral lode claims and state leases at the Anderson Project, a 8,268 acre property located in Yavapai County, Arizona.
During Fiscal 2019, in connection with the closing of the Royalty Purchase Agreement with URC, and as a result of allocation of the net consideration amount to the Anderson Project, the carrying value of the Anderson Project was reduced from $9,154,268 at July 31, 2018 by $5,683,895 to a carrying value of $3,470,373 at July 31, 2019 and July 31, 2020.
|
● |
Workman Creek Project, Arizona |
We hold an undivided 100% interest in contiguous mineral lode claims in the Workman Creek Project, a 4,036 acre property located in Gila County, Arizona. The Workman Creek Project is subject to a 3.0% net smelter royalty requiring an annual advance royalty payment of $50,000 for 2016 and 2017, and $100,000 thereafter. We have an exclusive right and option to acquire 1.5% of the net smelter royalty for $1,000,000 at any time until January 21, 2024. Additionally, certain individuals hold an option to acquire a 0.5% net smelter royalty exercisable by paying the Company the sum of $333,340 at any time until January 21, 2024.
During Fiscal 2020, advance royalty payments of $100,000 (Fiscal 2019: $125,000) were capitalized as Mineral Rights and Properties and added to the carrying value of the Workman Creek Project.
During Fiscal 2019, in connection with the closing of the Royalty Purchase Agreement with URC, and as a result of allocation of the net consideration amount to the Workman Creek Project, the carrying value of the Workman Creek Project was reduced by $1,082,646.
|
● |
Los Cuatros Project, Arizona |
We hold an undivided 100% interest in a state lease in the Los Cuatros Project, a 640 acre property located in Maricopa County, Arizona.
|
● |
Slick Rock Project, Colorado |
We hold an undivided 100% interest in contiguous mineral lode claims in the Slick Rock Project, a 5,333 acre property located in San Miguel County, Colorado. Certain claims of the Slick Rock Project are subject to a 1.0% or 3.0% net smelter royalty, the latter requiring an annual advance royalty payment beginning in November 2017.
|
URANIUM ENERGY CORP. |
|
NOTES TO THE CONSOLIDATED FINANCIAL STATEMENTS |
|
JULY 31, 2020 |
During Fiscal 2020 and Fiscal 2019, advance royalty payments of $30,000 and $30,000, respectively, were capitalized as Mineral Rights and Properties on our Consolidated Balance Sheets for those fiscal years.
During Fiscal 2019, in connection with the closing of the Royalty Purchase Agreement with URC and as a result of allocation of the net consideration amount of $2,255,514 to the Slick Rock Project, the carrying value of the Slick Rock Project was reduced by $676,650, and a gain on disposition of asset of $1,578,864 was recognized and included in our Consolidated Statements of Operations and Comprehensive Loss for Fiscal 2019.
|
● |
Reno Creek Project, Wyoming |
The consolidated Reno Creek Project consists of U.S. federal mineral lode claims, state mineral leases, various private mineral leases and certain surface use agreements which grant us the exclusive right to explore, develop and mine for uranium on a 18,763 acre area in Campbell County, Wyoming. The mineral leases and surface use agreements are subject to certain royalty interests with terms ranging from five to 20 years, some of which have extension provisions.
Canadian Project
|
● |
Diabase Project, Canada |
We hold a 100% interest in the Diabase Project which covers an area of 54,236 acres in 10 claim blocks located on the southern rim of the Athabasca Basin uranium district in Saskatchewan, Canada.
Paraguay Projects
During Fiscal 2018 and Fiscal 2019, we had communications and filings with the Ministry of Public Works and Communications (“MOPC”), the mining regulator in Paraguay, whereby the former MOPC took the position that certain concessions forming part of the Company’s Yuty and Alto Parana Projects were not eligible for extension as to exploration or continuation to exploitation in their current stages. While we remain fully committed to our development path forward in Paraguay, we have filed certain applications and appeals in Paraguay to reverse the MOPC’s position in order to protect our continuing rights in those concessions.
|
● |
Yuty Project, Paraguay |
The Yuty Project is a 289,680 acre property under one exploitation concession located in Paraguay. The Yuty Project is subject to an overriding royalty of $0.21 per pound of uranium produced from the Yuty Project.
|
● |
Oviedo Project, Paraguay |
The Oviedo Project is a 223,749 acre property under one exploration permit located in Paraguay. The Oviedo Project is subject to a 1.5% gross overriding royalty over which we have an exclusive right and option at any time to acquire 0.5% for $166,667 and a right of first refusal to acquire all or any portion of the remaining 1.0%.
|
● |
Alto Paraná Titanium Project, Paraguay |
The Alto Paraná Titanium Project is a 174,200 acre property under certain titanium mineral concessions, located in the departments of Alto Parana and Canindeyú in Paraguay. The Alto Paraná Titanium Project is subject to a 1.5% net smelter returns royalty. We have the right, exercisable to July 2023, to acquire 0.5% of the net smelter royalty at a purchase price of $500,000.
|
URANIUM ENERGY CORP. |
|
NOTES TO THE CONSOLIDATED FINANCIAL STATEMENTS |
|
JULY 31, 2020 |
|
NOTE 4: |
PROPERTY, PLANT AND EQUIPMENT |
Property, plant and equipment consisted of the following:
|
July 31, 2020 |
July 31, 2019 |
|||||||||||||||||||||||
|
Cost |
Accumulated |
Net Book |
Cost |
Accumulated |
Net Book |
|||||||||||||||||||
|
Hobson Processing Facility |
$ | 6,642,835 | $ | (773,933 | ) | $ | 5,868,902 | $ | 6,642,835 | $ | (773,933 | ) | $ | 5,868,902 | ||||||||||
|
Mining Equipment |
2,393,579 | (2,342,518 | ) | 51,061 | 2,467,557 | (2,402,681 | ) | 64,876 | ||||||||||||||||
|
Logging Equipment and Vehicles |
1,924,969 | (1,736,806 | ) | 188,163 | 1,950,229 | (1,730,905 | ) | 219,324 | ||||||||||||||||
|
Computer Equipment |
550,243 | (486,467 | ) | 63,776 | 572,551 | (546,652 | ) | 25,899 | ||||||||||||||||
|
Furniture and Fixtures |
170,701 | (169,946 | ) | 755 | 170,701 | (169,379 | ) | 1,322 | ||||||||||||||||
|
Land and Buildings |
889,606 | (42,446 | ) | 847,160 | 889,606 | (27,570 | ) | 862,036 | ||||||||||||||||
| $ | 12,571,933 | $ | (5,552,116 | ) | $ | 7,019,817 | $ | 12,693,479 | $ | (5,651,120 | ) | $ | 7,042,359 | |||||||||||
Hobson Processing Facility
During Fiscal 2019, the ARO for the Hobson Processing Facility was revised due to changes in the estimated timing of decommissioning activities, which resulted in a reduction of $176,253 to the ARO asset of the Hobson Processing Facility.
During Fiscal 2020, Fiscal 2019 and Fiscal 2018, no material amount of uranium concentrate was processed at the Hobson Processing Facility due to the reduced operations at the Palangana Mine. As a result, no depreciation for the Hobson Processing Facility was recorded in our Consolidated Financial Statements for these fiscal years.
|
NOTE 5: |
RESTRICTED CASH |
Restricted cash includes cash and cash equivalents and money market funds as collateral for various bonds posted in favor of applicable state regulatory agencies in Arizona, Texas and Wyoming, for estimated reclamation costs associated with our Palangana Mine, Hobson Processing Facility, Reno Creek Project and Anderson Project. Restricted cash will be released upon completion of reclamation of a mineral property or restructuring of a surety and collateral arrangement.
|
July 31, 2020 |
July 31, 2019 |
|||||||
|
Restricted cash, beginning of period |
$ | 1,821,392 | $ | 1,789,899 | ||||
|
Interest received |
17,824 | 31,493 | ||||||
|
Restricted cash, end of period |
$ | 1,839,216 | $ | 1,821,392 | ||||
Cash, cash equivalents and restricted cash are included in the following accounts at July 31, 2020 and 2019:
|
July 31, 2020 |
July 31, 2019 |
|||||||
|
Cash and cash equivalents |
$ | 5,147,703 | $ | 6,058,186 | ||||
|
Restricted cash |
1,839,216 | 1,821,392 | ||||||
|
Total cash, cash equivalents and restricted cash |
$ | 6,986,919 | $ | 7,879,578 | ||||
|
URANIUM ENERGY CORP. |
|
NOTES TO THE CONSOLIDATED FINANCIAL STATEMENTS |
|
JULY 31, 2020 |
|
NOTE 6: |
EQUITY-ACCOUNTED INVESTMENT |
During Fiscal 2019, we closed the Royalty Purchase Agreement and received 12,000,000 Consideration Shares of URC, which increased our holdings to 14,000,000 URC shares, representing a 32.6% interest in URC at July 31, 2019. Refer to Note 3: Mineral Rights and Properties herein.
During Fiscal 2020, URC completed an initial public offering and is now listed for trading on the TSX Venture Exchange. As at July 31, 2020, the fair value of our investment in URC was approximately $12.1 million.
As at July 31, 2020, we owned a 19.5% (July 31, 2019: 32.6%; July 31, 2018: 11.3%) interest in URC. In addition, two of our officers are members of URC’s board of directors, one of which is also an officer of URC. As a consequence, our ability to exercise significant influence over URC’s operating and financing policies continued to exist at July 31, 2020.
During Fiscal 2020, Fiscal 2019 and Fiscal 2018, the changes in carrying value of the investment in URC are summarized as follows:
|
Balance, July 31, 2017 |
$ | 151,676 | ||
|
Share of income from URC |
29,001 | |||
|
Gain on ownership interest dilution |
394,656 | |||
|
Share of other comprehensive income |
118,169 | |||
|
Balance, July 31, 2018 |
693,502 | |||
|
Share consideration received from sale of royalty interests |
9,077,842 | |||
|
Share of loss from URC |
(1,858,901 | ) | ||
|
Gain on ownership interest dilution |
755,545 | |||
|
Translation gain |
12,461 | |||
|
Balance, July 31, 2019 |
8,680,449 | |||
|
Share of loss from URC |
(89,073 | ) | ||
|
Gain on ownership interest dilution |
3,056,656 | |||
|
Translation loss |
(132,705 | ) | ||
|
Balance, July 31, 2020 |
$ | 11,515,327 |
|
NOTE 7: |
OTHER NON-CURRENT ASSETS |
At July 31, 2020, other non-current assets totaled $769,875 (July 31, 2019: $249,214), which included ROU assets relating to the operating leases of $653,304 (July 31, 2019: $Nil) and the non-current portion of certain prepaid expenses of $116,571 (July 31, 2019: $249,214).
|
NOTE 8: |
DUE TO RELATED PARTIES AND RELATED PARTY TRANSACTIONS |
During Fiscal 2020, we incurred $98,150 (Fiscal 2019: $149,692 and Fiscal 2018: $148,081) in general and administrative expenses due to Blender Media Inc. (“Blender”), a company controlled by Arash Adnani, a direct family member of our President and Chief Executive Officer, for various services, including information technology, corporate branding, media, website design, maintenance and hosting, provided to our Company.
During Fiscal 2018, we issued 104,706 shares with a fair value of $141,678 as settlement of the equivalent amounts owed to Blender.
At July 31, 2020, amounts owed to Blender totaled $31,334 (July 31, 2019: $68,680). These amounts are unsecured, non-interest bearing and due on demand.
During Fiscal 2019, we closed the Royalty Purchase Agreement and received 12,000,000 Consideration Shares of URC. Refer to Note 6: Equity-accounted Investment herein.
|
URANIUM ENERGY CORP. |
|
NOTES TO THE CONSOLIDATED FINANCIAL STATEMENTS |
|
JULY 31, 2020 |
|
NOTE 9: |
LONG-TERM DEBT |
On December 5, 2018, we entered into the Third Amended and Restated Credit Agreement with each of Sprott Resource Lending Partnership, as agent, and our remaining lenders and participants (collectively, the “Lenders”), whereby we and the Lenders agreed to certain further amendments to our $20,000,000 credit facility (the “Credit Facility”).
The key terms of the Third Amended and Restated Credit Agreement are summarized as follows:
|
● |
extension of the maturity date from January 1, 2020 to January 31, 2022; |
|
● |
deferral of the prior monthly principal payments until the new maturity date of January 31, 2022; |
|
● |
issuance on signing in Fiscal 2019 of third extension fee shares equal to 7% of the principal balance outstanding or $1,400,000 paid to the Lenders by way of the issuance of 1,180,328 shares of the Company; and |
|
● |
payment of anniversary fees to the Lenders on each of November 30, 2019, 2020 and 2021, of 7%, 6.5% and 6%, respectively, of the principal balance then outstanding, if any, payable at the option of the Company in cash or shares of the Company with a price per share calculated at a 10% discount to the five trading-day volume-weighted average price of the Company’s shares immediately prior to the applicable date. |
Under the terms of the Third Amended and Restated Credit Agreement, the Credit Facility remains non-revolving with an amended term from inception of 8.5 years maturing on January 31, 2022, subject to an interest rate of 8% per annum, compounded and payable on a monthly basis. An effective interest rate of 16.67% has been calculated under the assumption that the Company will carry the full principal balance of $20,000,000 to its contractual maturity on January 31, 2022 without exercising the prepayment feature where we can repay a partial or the full amount of principal without causing any penalties. Therefore, the anniversary fee payments of $1,400,000, $1,300,000 and $1,200,000, which are calculated on the full principal balance, will become due on each of November 30, 2019, 2020 and 2021, respectively.
The Third Amended and Restated Credit Agreement supersedes, in their entirety, the Second Amended and Restated Credit Agreement, dated and effective February 9, 2016, the Amended and Restated Credit Agreement, dated and effective March 13, 2014, and the Credit Agreement, dated and effective July 30, 2013, with our Lenders.
At July 31, 2020, long-term debt consisted of the following:
|
July 31, 2020 |
July 31, 2019 |
|||||||
|
Principal amount |
$ | 20,000,000 | $ | 20,000,000 | ||||
|
Unamortized discount and accrued fees |
(130,523 | ) | (400,037 | ) | ||||
|
Long-term debt, net of unamortized discount |
$ | 19,869,477 | $ | 19,599,963 | ||||
During Fiscal 2020 and pursuant to the terms of the Third Amended and Restated Credit Agreement, we issued an aggregate of 1,743,462 shares with a fair value of $1,400,000, representing 7% of the $20,000,000 principal balance outstanding at October 31, 2019, as payment of anniversary fees to the Lenders.
During Fiscal 2018 and pursuant to the terms of the Second Amended and Restated Credit Agreement, we issued 641,574 shares with a fair value of $900,000, representing 4.5% of the $20,000,000 principal balance outstanding at January 31, 2018, as payment of anniversary fees to the Lenders.
In Fiscal 2020, the amortization of debt discount and accrued fees totaled $1,669,514 (Fiscal 2019: $1,464,989; Fiscal 2018: $1,180,139), which was recorded as interest expense and included in our Consolidated Statements of Operations and Comprehensive Loss.
The shares issued to the Lenders either as the third extension fees or the anniversary fees have been recorded as discounts on long-term debt, which are amortized using the respective effective interest rates at the time of issuance over the remaining contractual life of the long-term debt.
The aggregate yearly maturities of long-term debt based on principal amounts outstanding at July 31, 2020 are as follows:
|
Fiscal 2021 |
$ | - | ||
|
Fiscal 2022 |
20,000,000 | |||
|
Total |
$ | 20,000,000 |
|
URANIUM ENERGY CORP. |
|
NOTES TO THE CONSOLIDATED FINANCIAL STATEMENTS |
|
JULY 31, 2020 |
|
NOTE 10: |
GOVERNMENT LOAN PAYABLE |
In April 2020, our Canadian subsidiary received a loan of $29,842 (CAD$40,000) through the CEBA Program, which provides financial relief for Canadian small businesses during the COVID-19 pandemic. The CEBA Loan has an initial term date on December 31, 2022 (the “Initial Term Date”) and may be extended to December 31, 2025. The CEBA Loan is non-revolving, with an interest rate being 0% per annum prior to the Initial Term Date and 5% per annum thereafter during any extended term, which is calculated daily and paid monthly. The CEBA Loan can be repaid at any time without penalty and, if at least 75% of the CEBA Loan is paid prior to the Initial Term Date, the remaining balance of the CEBA Loan will be forgiven. We anticipate repaying the CEBA Loan prior to the Initial Term Date.
On April 28, 2020, we entered into a business loan agreement with Kleberg Bank, N.A., under the PPP Program administered by the Small Business Administration. The PPP Program is a part of the Coronavirus Aid, Relief, and Economic Security Act enacted by the U.S. Congress on March 27, 2020 in response to the COVID-19 pandemic. The total loan amount we qualified for was $277,250, which was received on May 5, 2020.
Under the PPP Program the repayment of these loans, including interest, will be forgiven based on payroll, payroll-related and other allowable costs incurred in the eight-week period following the funding of the loan pursuant to the following requirements:
| ● |
that not less than 60% of the loan proceeds be applied to eligible payroll costs; |
| ● |
that the remaining 40% of the loan proceeds be applied to any additional payroll costs above 60%, rent payments on leases dated before February 15, 2020 and/or utility payments under any services agreements dated before February 15, 2020; and |
| ● |
to maintain employee compensation levels (subject to specific program requirements). |
The PPP Program provides for an initial six-month deferral of payments, which was subsequently further deferred by another 10 months. The PPP Loan has a two-year maturity ending on April 28, 2022 with an interest rate of 1% per annum.
At July 31, 2020, both the CEBA Loan and the PPP Loan are accounted for as a loan under ASC 470: Debt, which are reported as Government Loan Payable of $307,092 (July 31, 2019: $Nil) on our Consolidated Balance Sheets. An income will be recognized in the period when the PPP Loan and the CEBA Loan are forgiven.
Subsequent to July 31, 2020, we submitted an application for the forgiveness of the PPP Loan and the application is still in process at the date of these Consolidated Financial Statements.
|
URANIUM ENERGY CORP. |
|
NOTES TO THE CONSOLIDATED FINANCIAL STATEMENTS |
|
JULY 31, 2020 |
|
NOTE 11: |
ASSET RETIREMENT OBLIGATIONS |
The Company’s asset retirement obligations (AROs) relate to future remediation and decommissioning activities at our Palangana Mine, Hobson Processing Facility and the Alto Parana Titanium Project pilot plant in Paraguay.
|
Balance, July 31, 2019 |
$ | 3,541,082 | ||
|
Accretion |
193,232 | |||
|
Balance, July 31, 2020 |
$ | 3,734,314 |
During Fiscal 2019, the ARO for the Palangana Mine and the Hobson Processing Facility was revised due to changes in the estimated timing of restoration and reclamation of the Palangana Mine and decommissioning of the Hobson Processing Facility. As a result, ARO liabilities associated with the Palangana Mine reduced by $532,309, and ARO liabilities associated with the Hobson Processing Facility reduced by $176,253. Refer to Note 3: Mineral Rights and Properties and Note 4: Property, Plant and Equipment herein.
The estimated amounts and timing of cash flows and assumptions used for the ARO estimates are as follows:
|
July 31, 2020 |
July 31, 2019 |
|||||||||||
|
Undiscounted amount of estimated cash flows |
$ | 8,221,018 | $ | 8,221,018 | ||||||||
|
Payable in years |
9 | to | 21 | 9 | to | 21 | ||||||
|
Inflation rate |
1.56% | to | 2.17% | 1.56% | to | 2.17% | ||||||
|
Discount rate |
5.50% | to | 5.96% | 5.50% | to | 5.96% | ||||||
The undiscounted amounts of estimated cash flows for the next five years and beyond are as follows:
|
Fiscal 2021 |
$ | - | ||
|
Fiscal 2022 |
- | |||
|
Fiscal 2023 |
- | |||
|
Fiscal 2024 |
- | |||
|
Fiscal 2025 |
- | |||
|
Remaining balance |
8,221,018 | |||
| $ | 8,221,018 |
|
NOTE 12: |
LEASE LIABILITIES |
The Company primarily has operating leases for corporate offices and a processing facility with a remaining term of 0.7 to 18.8 years at July 31, 2020. The lease for the processing facility has an evergreen option that can continue for so long as it is in operation. Short-term leases, which have an initial term of 12 months or less, are not recorded on our Consolidated Balance Sheets.
During Fiscal 2020 total lease expenses include the following components:
|
Year Ended |
||||
|
July 31, 2020 |
||||
|
Operating leases |
$ | 229,706 | ||
|
Short-term leases |
445,287 | |||
|
Total Lease Expenses |
$ | 674,993 | ||
As at July 31, 2020, the weighted average remaining lease term was 15.4 years and weighted average discount rate was 4.7%.
|
URANIUM ENERGY CORP. |
|
NOTES TO THE CONSOLIDATED FINANCIAL STATEMENTS |
|
JULY 31, 2020 |
During Fiscal 2020, cash paid for amounts included in the measurement of operating lease liabilities totaled $176,425.
Minimum future lease payments under operating leases with terms longer than one year are as follows:
|
Fiscal 2021 |
$ | 161,747 | ||
|
Fiscal 2022 |
220,000 | |||
|
Fiscal 2023 |
20,000 | |||
|
Fiscal 2024 |
20,000 | |||
|
Fiscal 2025 |
20,000 | |||
|
Thereafter |
300,000 | |||
|
Total lease payments |
741,747 | |||
|
Less: imputed interest |
(164,474 | ) | ||
|
Present value of lease liabilities |
$ | 577,273 | ||
|
Currrent portion of lease liabilities |
$ | 139,069 | ||
|
Non-curent portion of lease liabilities |
$ | 438,204 |
Current lease liabilities are included in Other Current Liabilities, and non-current liabilities are included in Other Non-Current Liabilities in our Consolidated Balance Sheets.
|
NOTE 13: |
CAPITAL STOCK |
Equity Financing
Subsequent to July 31, 2020, we completed the September 2020 Offering of 12,500,000 units at a price of $1.20 for gross proceeds of $15,000,000. Each unit was comprised of one share of our Company and one-half of one share purchase warrant, and each whole warrant entitles its holder to acquire one share at an exercise price of $1.80 per share, exercisable immediately upon issuance and expiring 24 months from the date of issuance. In connection with the September 2020 Offering, we also issued compensation share purchase warrants to agents as part of share issuance costs to purchase 583,333 shares of our Company exercisable at an exercise price of $1.80 per share and expiring 24 months from the date of issuance.
On October 3, 2018, we completed a public offering of 12,613,049 units at a price of $1.60 per unit for gross proceeds of $20,180,878 (the “October 2018 Offering”). Each unit was comprised of one share of the Company and one-half of one share purchase warrant and each whole warrant entitles its holder to acquire one share at an exercise price of $2.05 per share, exercisable immediately upon issuance and expiring 30 months from the date of issuance. In connection with the October 2018 Offering, we also issued compensation share purchase warrants to agents as part of share issuance costs to purchase 756,782 shares of our Company, exercisable at an exercise price of $2.05 per share and expiring 30 months from the date of issuance.
The shares were valued at the Company’s closing price of $1.54 per share at October 3, 2018. The share purchase warrants were valued using the Black-Scholes option pricing model with the following assumptions:
|
Expected Risk Free Interest Rate |
2.90 | % | ||
|
Expected Annual Volatility |
63.30 | % | ||
|
Expected Contractual Life in Years |
2.50 | |||
|
Expected Annual Dividend Yield |
0.00 | % |
|
URANIUM ENERGY CORP. |
|
NOTES TO THE CONSOLIDATED FINANCIAL STATEMENTS |
|
JULY 31, 2020 |
The net proceeds from the October 2018 Offering were allocated to the fair values of the shares and share purchase warrants as presented below:
|
Fair Value of Shares |
$ | 19,424,095 | ||
|
Fair Value of Share Purchase Warrants |
3,094,693 | |||
|
Total Fair Value Before Allocation to Net Proceeds |
$ | 22,518,788 | ||
|
Gross Proceeds |
$ | 20,180,878 | ||
|
Share Issuance Costs - Cash |
(1,211,667 | ) | ||
|
Net Cash Proceeds Received |
$ | 18,969,211 | ||
|
Relative Fair Value Allocation to: |
||||
|
Shares |
$ | 16,362,327 | ||
|
Share Purchase Warrants |
2,606,884 | |||
| $ | 18,969,211 |
Share Transactions
During Fiscal 2019, we entered into a Securities Exchange Agreement (the “Securities Exchange Agreement”) with Pacific Roads Resources Funds (“PRRF”), who we acquired the Reno Creek Project from and who collectively owned 11,000,000 outstanding warrants (“PRRF Warrants”) of the Company. Pursuant to the Securities Exchange Agreement, PRRF exchanged their collective 11,000,000 outstanding PRRF Warrants for an aggregate of 750,000 shares of the Company with a fair value of $1.33 per share. The PRRF Warrants, with an exercise price of $2.30 and expiry date of August 9, 2022, were valued at $0.45 per share using the Barrier Option Pricing Model at the date of issuance on August 9, 2017, in connection with the acquisition of the Reno Creek Project. The difference of $4,950,000 between the carrying value of the PRRF Warrants and fair value of the shares of $997,500 was recorded as additional paid in capital and had no impact on our Company’s Consolidated Statements of Operations and Comprehensive Loss.
Share Purchase Warrants
During Fiscal 2019, we received cash proceeds totaling $4,822,357 from the exercise of 3,999,881 share purchase warrants at a weighted average exercise price of $1.21 per share.
A continuity schedule of outstanding share purchase warrants as at July 31, 2020, and the changes during the periods, is as follows:
|
Number of |
Weighted Average |
|||||||
|
Balance, July 31, 2017 |
19,676,560 | $ | 1.78 | |||||
|
Issued |
11,358,728 | 2.30 | ||||||
|
Exercised |
(61,799 | ) | 1.20 | |||||
|
Expired |
(50,000 | ) | 1.95 | |||||
|
Balance, July 31, 2018 |
30,923,489 | 1.97 | ||||||
|
Issued |
7,063,253 | 2.05 | ||||||
|
Exercised |
(3,999,881 | ) | 1.21 | |||||
|
Expired |
(3,542,951 | ) | 2.13 | |||||
|
Exchanged for shares pursuant to Securities Exchange Agreement |
(11,000,000 | ) | 2.30 | |||||
|
Balance, July 31, 2019 |
19,443,910 | 1.94 | ||||||
|
Issued |
300,000 | 1.38 | ||||||
|
Expired |
(12,021,929 | ) | 1.87 | |||||
|
Balance, July 31, 2020 |
7,721,981 | $ | 2.03 | |||||
|
URANIUM ENERGY CORP. |
|
NOTES TO THE CONSOLIDATED FINANCIAL STATEMENTS |
|
JULY 31, 2020 |
A summary of share purchase warrants outstanding and exercisable as at July 31, 2020 are as follows:
|
Weighted Average |
Number of Warrants |
Weighted Average Remaining Contractual |
Expiry Date |
|||||||||
| $ | 1.25 | 150,000 | 0.40 |
December 23, 2020 |
||||||||
| 1.50 | 150,000 | 0.40 |
December 23, 2020 |
|||||||||
| 2.05 | 7,063,253 | 0.67 |
April 3, 2021 |
|||||||||
| 2.30 | 308,728 | 2.02 |
August 9, 2022 |
|||||||||
| 1.64 | 50,000 | 2.80 |
May 21, 2023 |
|||||||||
| $ | 2.03 | 7,721,981 | 0.73 | |||||||||
Stock Options
At July 31, 2020, we had one stock option plan, the 2020 Stock Incentive Plan (the “2020 Plan”), which superseded and replaced the Company’s 2019 Stock Incentive Plan (collectively the “Stock Incentive Plan”), such that no further shares are issuable under the prior plan.
During Fiscal 2020, we granted stock options under the Stock Incentive Plan to certain of our directors, officers, employees and consultants to purchase an aggregate of 4,838,900 (Fiscal 2019: 2,006,350; Fiscal 2018: 4,083,000) shares of the Company, which are subject to a 24 month vesting provision whereby, at the end of each of the first three and six months after the grant date, 12.5% of the total stock options become exercisable, and whereby at the end of each of the 12,18 and 24 months after the grant date, 25% of the total stock options become exercisable. In addition, we granted performance stock options (the “Performance Stock Options”) under the Stock Incentive Plan to certain of our directors and officers to purchase an aggregate of 1,325,000 shares of the Company. The Performance Stock Options are subject to a three year vesting provision whereby one-third of the total Performance Stock Options become exercisable at the end of each of the first, second and third year after the date of grant. The stock options including the Performance Stock Options granted in Fiscal 2020 and Fiscal 2019 have a term of 10 years, whereas the options granted during Fiscal 2018 have a term of five years.
The fair value of these stock options was estimated at the date of grant, using the Black-Scholes Option Valuation Model, with the following weighted average assumptions:
|
Year Ended July 31, |
||||||||||||
|
2020 |
2019 |
2018 |
||||||||||
|
Expected Risk Free Interest Rate |
0.40 | % | 1.86 | % | 2.24 | % | ||||||
|
Expected Volatility |
60.48 | % | 65.62 | % | 67.60 | % | ||||||
|
Expected Life in Years |
4.9 | 4.9 | 3.1 | |||||||||
|
Expected Dividend Yield |
0 | % | 0 | % | 0 | % | ||||||
|
Weighted-Average Grant Date Fair Value |
$ | 0.45 | $ | 0.53 | $ | 0.68 | ||||||
|
URANIUM ENERGY CORP. |
|
NOTES TO THE CONSOLIDATED FINANCIAL STATEMENTS |
|
JULY 31, 2020 |
A continuity schedule of outstanding stock options at July 31, 2020, and the changes during the periods, is as follows:
|
Number of Stock Options |
Weighted Average Exercise Price |
|||||||
|
Balance, July 31, 2017 |
12,260,500 | $ | 1.33 | |||||
|
Granted |
4,083,000 | 1.40 | ||||||
|
Exercised |
(1,365,625 | ) | 0.70 | |||||
|
Forfeited |
(66,250 | ) | 1.24 | |||||
|
Balance, July 31, 2018 |
14,911,625 | 1.41 | ||||||
|
Granted |
2,006,350 | 0.97 | ||||||
|
Exercised |
(259,625 | ) | 1.12 | |||||
|
Cancelled/Forfeited |
(910,000 | ) | 2.41 | |||||
|
Expired |
(10,000 | ) | 1.50 | |||||
|
Balance, July 31, 2019 |
15,738,350 | 1.30 | ||||||
|
Granted |
6,163,900 | 0.95 | ||||||
|
Cancelled/Forfeited |
(179,344 | ) | 1.02 | |||||
|
Expired |
(6,208,156 | ) | 1.39 | |||||
|
Balance, July 31, 2020 |
15,514,750 | $ | 1.13 | |||||
The table below sets forth the number of shares issued and cash received upon exercise of the stock options:
|
Year Ended July 31, |
||||||||||||
|
2020 |
2019 |
2018 |
||||||||||
|
Number of Shares Issued Upon Exercise of Options |
- | 125,879 | 1,094,589 | |||||||||
|
Number of Options Exercised on Forfeiture Basis |
- | 193,375 | 580,625 | |||||||||
|
Number of Net Shares Issued |
- | 59,629 | 309,589 | |||||||||
|
Number of Options Exercised on Cash Basis |
- | 66,250 | 785,000 | |||||||||
|
Cash Received from Exercise of Stock Options |
$ | - | $ | 72,363 | $ | 530,050 | ||||||
|
Total Intrinsic Value of Options Exercised |
$ | - | $ | 134,174 | $ | 1,049,694 | ||||||
A continuity schedule of outstanding unvested stock options at July 31, 2020, and the changes during the periods, is as follows:
|
Number of Unvested Stock Options |
Weighted Average Grant-Date Fair Value |
|||||||
|
Balance, July 31, 2017 |
765,750 | $ | 0.58 | |||||
|
Granted |
4,083,000 | 0.68 | ||||||
|
Vested |
(1,303,000 | ) | 0.65 | |||||
|
Forfeited |
(66,250 | ) | 0.62 | |||||
|
Balance, July 31, 2018 |
3,479,500 | 0.68 | ||||||
|
Granted |
2,006,350 | 0.53 | ||||||
|
Vested |
(2,055,250 | ) | 0.68 | |||||
|
Forfeited |
(120,000 | ) | 0.67 | |||||
|
Balance, July 31, 2019 |
3,310,600 | 0.59 | ||||||
|
Granted |
6,163,900 | 0.45 | ||||||
|
Vested |
(2,590,154 | ) | 0.60 | |||||
|
Cancelled/Forfeited |
(86,875 | ) | 0.43 | |||||
|
Balance, July 31, 2020 |
6,797,471 | $ | 0.46 | |||||
|
URANIUM ENERGY CORP. |
|
NOTES TO THE CONSOLIDATED FINANCIAL STATEMENTS |
|
JULY 31, 2020 |
At July 31, 2020, the aggregate intrinsic value of all outstanding stock options granted was estimated at $391,508 (vested: $95,261 and unvested: $296,247). At July 31, 2020, the unrecognized compensation cost related to unvested stock options was $2,500,153 expected to be recognized over 1.31 years.
A summary of stock options outstanding and exercisable at July 31, 2020 is as follows:
|
Options Outstanding |
Options Exercisable |
||||||||||||||||||||||||
|
Range of Exercise Prices |
Outstanding at July 31, 2020 |
Weighted Average Exercise Price |
Weighted Average Remaining Contractual Term (Years) |
Exercisable at |
Weighted Average Exercise Price |
Weighted Average Remaining Contractual Term (Years) |
|||||||||||||||||||
|
$0.80 |
to | $0.99 | 8,169,500 | $ | 0.92 | 7.64 | 2,843,279 | $ | 0.94 | 4.03 | |||||||||||||||
|
$1.00 |
to | $1.49 | 5,005,000 | 1.19 | 3.81 | 3,533,750 | 1.22 | 1.47 | |||||||||||||||||
| $1.50 | to | $3.28 | 2,340,250 | 1.75 | 2.59 | 2,340,250 | 1.75 | 2.59 | |||||||||||||||||
| 15,514,750 | $ | 1.13 | 5.64 | 8,717,279 | $ | 1.27 | 2.61 | ||||||||||||||||||
Restricted Stock Units
During Fiscal 2020, the Company granted an aggregate of 1,305,000 RSUs with a fair value of $0.91 per RSU, determined using the share price at the date of grant, to certain directors and officers of the Company under the Stock Incentive Plan. These RSUs have a vesting period of three years from the grant date, whereby one-half of the RSUs will vest at the end of the first year, and one-third of the remaining one-half will vest at the end of each of the first, second and third year, respectively, from the date of grant.
During Fiscal 2019, the Company granted an aggregate of 465,000 RSUs with a fair value of $0.9421 per RSU, determined using the share price at the date of grant, to certain directors and officers of the Company under the Stock Incentive Plan. These RSUs have a vesting period of three years from the grant date such that one-third of the RSUs will vest at the end of each of the first, second and third year, respectively, from the date of grant.
A summary of outstanding unvested RSUs at July 31, 2020 is as follows:
|
Grant Date |
Number of Restricted Stock Units |
Grant Date Fair Value |
Remaining Life (Years) |
Aggregate Intrinsic Value |
||||||||||||
|
July 30, 2019 |
310,000 | $ | 0.94 | 2.00 | $ | 8,649 | ||||||||||
|
July 16, 2020 |
1,305,000 | 0.91 | 2.96 | 78,300 | ||||||||||||
| 1,615,000 | $ | 0.92 | 2.77 | $ | 86,949 | |||||||||||
A continuity schedule of outstanding RSUs at July 31, 2020, and the changes during the periods, is as follows:
|
Number of Restricted Stock Units |
Weighted Average Grant Date Fair Value |
|||||||
|
Balance, July 31, 2018 |
- | $ | - | |||||
|
Granted |
465,000 | 0.94 | ||||||
|
Balance, July 31, 2019 |
465,000 | 0.94 | ||||||
|
Granted |
1,305,000 | 0.91 | ||||||
|
Vested |
(155,000 | ) | 0.94 | |||||
|
Balance, July 31, 2020 |
1,615,000 | $ | 0.92 | |||||
During Fiscal 2020, stock-based compensation relating to the RSUs totaled $310,127 (Fiscal 2019: $Nil; Fiscal 2018: $Nil). During Fiscal 2020, 155,000 RSUs were vested resulting in 105,844 net RSU shares being issued with 49,156 RSUs forfeited as payments for payroll withholding amounts. At July 31, 2020, outstanding unvested RSUs totaled 1,615,000 (July 31, 2019: 465,000), and unrecognized compensation costs relating to unvested RSUs totaled $1,315,500, which is expected to be recognized over a period of approximately 1.48 years.
|
URANIUM ENERGY CORP. |
|
NOTES TO THE CONSOLIDATED FINANCIAL STATEMENTS |
|
JULY 31, 2020 |
Performance Based Restricted Stock Units
During Fiscal 2019, the Company granted 445,000 target PRSUs (the “Target PRSUs”) and allocated up to an additional 445,000 PRSUs (the “Additional PRSUs”, and together with the Target PRSUs, the “PRSUs”) to the Company’s executive officers. These PRSUs vest based on certain performance goals measured on the Company’s share price relative to the Global X Uranium ETF share price on each anniversary from the grant date over the next three years (the “Performance Period”). The PRSUs will vest based on three (3) one-year relative Total Shareholder Return’s (“TSR”) (stock price appreciation) and one (1) three-year relative TSR from the grant date of the PRSUs (each such measurement period being a “Measurement Period”). Each Measurement Period will be equally weighted 25% as to the number of PRSUs that may vest for such Measurement Period. Depending on the TSR performance, the percentage eligible to vest at the end of each Measurement Period would range from 0% to 200% of the Target PRSUs for that Measurement Period. The vested PRSUs will accrue annually and will not settle until the end of the Performance Period. Each vested PRSU converts into one common share of the Company at the end of the three years Performance Period with no cash settlement alternatives. The PRSUs carry neither rights to dividends nor voting rights. The Company accounts for the PRSU as an equity-settled plan.
These PRSUs have a market condition considered in the determination of the fair value such that the ultimate number of PRSUs that vest will be determined by the Company’s share performance relative to the Global X Uranium ETF share price on each anniversary from the grant date over the Performance Period. The fair value of the Target PRSUs was estimated at $1.15 per Target PRSU at the date of grant using the Monte Carlo simulation model with the following principal assumptions:
|
Expected Risk Free Interest Rate |
1.99% | to | 2.20% | |
|
Expected Volatility |
56.74% | to | 61.75% | |
|
Expected Dividend Yield |
0% | |||
|
Expected Life in Years |
3 | |||
|
Correlation |
57.10% |
On July 30, 2020, 90,001 of PRSUs vested based on UEC’s share performance then relative to the Global X Uranium ETF. As a result, 90,001 underlying shares were accrued and recorded as share issuance obligations on our Consolidated Balance Sheets.
During Fiscal 2020, stock-based compensation related to amortization of Target PRSUs totaled $272,658 (Fiscal 2019: $Nil; Fiscal 2018: $Nil). At July 31, 2020, outstanding unvested Target PRSUs totaled 333,750 (July 31, 2019: 445,000) and unrecognized compensation costs relating to unvested Target PRSUs totaled $239,352, which is expected to be recognized over a period of approximately 2.0 years.
|
URANIUM ENERGY CORP. |
|
NOTES TO THE CONSOLIDATED FINANCIAL STATEMENTS |
|
JULY 31, 2020 |
Stock-Based Compensation
A summary of stock-based compensation expense for Fiscal 2020, Fiscal 2019 and Fiscal 2018 is as follows:
|
Year Ended July 31, |
||||||||||||
|
2020 |
2019 |
2018 |
||||||||||
|
Stock-Based Compensation for Consultants |
||||||||||||
|
Common stock issued for consulting services |
$ | 539,552 | $ | 644,307 | $ | 740,640 | ||||||
|
Amortization of stock option expenses |
240,912 | 153,549 | 582,842 | |||||||||
| 780,464 | 797,856 | 1,323,482 | ||||||||||
|
Stock-Based Compensation for Management |
||||||||||||
|
Common stock issued to management |
225,217 | 269,688 | 702,505 | |||||||||
|
Amortization of stock option expenses |
644,516 | 516,266 | 284,556 | |||||||||
|
Amortization of RSU & PRSU expenses |
582,785 | - | - | |||||||||
| 1,452,518 | 785,954 | 987,061 | ||||||||||
|
Stock-Based Compensation for Employees |
||||||||||||
|
Common stock issued to employees |
635,414 | 674,488 | 773,899 | |||||||||
|
Amortization of stock option expenses |
640,011 | 689,743 | 547,231 | |||||||||
| 1,275,425 | 1,364,231 | 1,321,130 | ||||||||||
|
Settlement of share issuance obligation |
(15,189 | ) | - | (127,615 | ) | |||||||
| $ | 3,493,218 | $ | 2,948,041 | $ | 3,504,058 | |||||||
During Fiscal 2020, we issued 188,914 shares with a fair value of $171,911 as settlement of share issuance obligations of $187,100 relating to the Fiscal 2019 share bonuses under our Stock Incentive Plan. During Fiscal 2018, we issued 398,839 shares with a fair value of $510,527 as settlement of share issuance obligations of $638,142 relating to the Fiscal 2017 share bonuses under our Stock Incentive Plan.
|
NOTE 14: |
NET LOSS PER SHARE |
The following table reconciles the weighted average number of shares used in the computation of basic and diluted loss per share for Fiscal 2020, Fiscal 2019 and Fiscal 2018:
|
Year Ended July 31, |
||||||||||||
|
2020 |
2019 |
2018 |
||||||||||
|
Numerator |
||||||||||||
|
Net Loss for the Year |
$ | (14,610,516 | ) | $ | (17,152,789 | ) | $ | (17,826,634 | ) | |||
|
Denominator |
||||||||||||
|
Basic Weighted Average Number of Shares |
183,041,766 | 175,844,624 | 157,123,025 | |||||||||
|
Dilutive Stock Options, RSUs, PRSUs and Warrants |
- | - | - | |||||||||
|
Diluted Weighted Average Number of Shares |
183,041,766 | 175,844,624 | 157,123,025 | |||||||||
|
Net Loss per Share, Basic and Diluted |
$ | (0.08 | ) | $ | (0.10 | ) | $ | (0.11 | ) | |||
For Fiscal 2020, Fiscal 2019 and Fiscal 2018, all outstanding stock options, share purchase warrants and, in particular to Fiscal 2020 and Fiscal 2019, RSUs and PRSUs, were excluded from the computation of diluted loss per share as their effects would be anti-dilutive.
|
URANIUM ENERGY CORP. |
|
NOTES TO THE CONSOLIDATED FINANCIAL STATEMENTS |
|
JULY 31, 2020 |
|
NOTE 15: |
INCOME TAXES |
At July 31, 2020, we had U.S. and Canadian net operating loss carry-forwards of approximately $167.3 million and $5.1 million in Canadian dollars, respectively, that may be available to reduce future years’ taxable income. These carry-forwards will begin to expire, if not utilized, commencing in 2023. In addition, at July 31, 2020, we had U.S. net operating loss totalling $37.3 million and interest expenses of $3.4 million subject to IRC section 163(j) limitation, which will be carried forward indefinitely as a result of the Tax Cut and Jobs Act enacted on December 22, 2017. Future tax benefits which may arise as a result of these losses have not been recognized in these consolidated financial statements, as their realization has been determined not likely to occur and, accordingly, we have recorded a full valuation allowance for the deferred tax asset relating to these tax loss carry-forwards.
We review the valuation allowance requirements on an annual basis based on projected future operations. When circumstances change resulting in a change in management’s judgement about the recoverability of deferred tax assets, the impact of the change on the valuation allowance will generally be reflected in current income.
A reconciliation of income tax computed at the federal and state statutory tax rates including the Company’s effective tax rate is as follows:
|
Year Ended July 31, |
|||||||||
|
2020 |
2019 |
2018 |
|||||||
|
Federal income tax provision rate |
21.00 | % | 21.00 | % | 26.87 | % | |||
|
State income tax provision rate, net of federal income tax effect |
0.72 | % | 0.52 | % | 0.59 | % | |||
|
Total income tax provision rate |
21.72 | % | 21.52 | % | 27.46 | % | |||
The actual income tax provisions differ from the expected amounts calculated by applying the combined federal and state corporate income tax rates to our loss before income taxes. The components of these differences are as follows:
|
Year Ended July 31, |
||||||||||||
|
2020 |
2019 |
2018 |
||||||||||
|
Loss before income taxes |
$ | (14,616,067 | ) | $ | (17,167,161 | ) | $ | (18,534,145 | ) | |||
|
Corporate tax rate |
21.72 | % | 21.52 | % | 27.46 | % | ||||||
|
Expected tax recovery |
(3,174,610 | ) | (3,694,373 | ) | (5,089,476 | ) | ||||||
|
Increase (decrease) resulting from |
||||||||||||
|
Foreign tax rate differences |
85,796 | 90,391 | 167,162 | |||||||||
|
Permanent differences |
170,023 | 2,427,665 | 434,863 | |||||||||
|
Prior year true-up |
(435,565 | ) | (160,019 | ) | (141,814 | ) | ||||||
|
Foreign exchange rate differences |
17,456 | 39,667 | (41,014 | ) | ||||||||
|
Other |
71,805 | (94,291 | ) | 35,706 | ||||||||
|
Recognition of deferred tax assets |
- | - | 430,121 | |||||||||
|
Change in valuation allowance |
3,233,427 | 1,373,462 | 4,156,768 | |||||||||
|
Tax adjustment from operations |
(31,668 | ) | (17,498 | ) | (47,684 | ) | ||||||
|
Re-measurement of deferred tax liability at 21% |
- | - | (232,843 | ) | ||||||||
|
Recognition of deferred tax assets to offset deferred tax liability |
- | - | (430,121 | ) | ||||||||
|
Unrealized loss, other comprehensive loss |
26,117 | 3,126 | 3,137 | |||||||||
|
Deferred tax benefits |
$ | (5,551 | ) | $ | (14,372 | ) | $ | (707,511 | ) | |||
We have incurred taxable losses for all years since inception and, accordingly, no provision for current income tax has been recorded for the current or any prior fiscal years. During Fiscal 2020 and Fiscal 2019, we recorded a deferred tax benefit of $5,551 and $14,372, respectively. During Fiscal 2018, we recognized a deferred tax benefit of $707,511, of which $232,843 resulted from the re-measurement of deferred tax liabilities to the enacted tax rate of 21% on December 22, 2017, and $430,121 resulted from the recognition of deferred tax assets relating to the taxable losses incurred in Fiscal 2018 to offset the remaining deferred tax liabilities relating to the acquisition of the Reno Creek Project.
|
URANIUM ENERGY CORP. |
|
NOTES TO THE CONSOLIDATED FINANCIAL STATEMENTS |
|
JULY 31, 2020 |
At July 31, 2020, we re-evaluated the realizability of our tax loss carry-forwards and our conclusion that the realization of these tax loss carry-forwards is not likely to occur remains unchanged. As a result, we will continue to record a full valuation allowance for the deferred tax assets relating to the remaining tax loss carry-forwards.
The components of income (loss) from operations before income taxes, by tax jurisdiction, are as follows:
|
Year Ended July 31, |
||||||||||||
|
2020 |
2019 |
2018 |
||||||||||
|
United States |
$ | (13,962,287 | ) | $ | (16,560,132 | ) | $ | (17,709,866 | ) | |||
|
Canada |
53,960 | 120,362 | 145,267 | |||||||||
|
Paraguay |
(707,740 | ) | (727,391 | ) | (969,546 | ) | ||||||
| $ | (14,616,067 | ) | $ | (17,167,161 | ) | $ | (18,534,145 | ) | ||||
The Company’s deferred tax assets (liabilities) are as follows:
|
July 31, 2020 |
July 31, 2019 |
|||||||
|
Deferred tax assets (liabilities) |
||||||||
|
Mineral properties |
$ | 1,270,292 | $ | 1,256,327 | ||||
|
Exploration costs |
6,384,265 | 6,551,403 | ||||||
|
Stock option expense |
4,594,159 | 4,570,905 | ||||||
|
Depreciable property |
(1,157,934 | ) | (937,614 | ) | ||||
|
Inventories |
(3,550,814 | ) | (3,343,361 | ) | ||||
|
Asset retirement obligations |
62,626 | 20,561 | ||||||
|
Other |
58,559 | 35,983 | ||||||
|
Section 163(j) interest expense carry forwards |
733,343 | 384,109 | ||||||
|
Loss carry forwards |
46,552,687 | 43,198,434 | ||||||
| 54,947,183 | 51,736,747 | |||||||
|
Valuation allowance |
(54,973,300 | ) | (51,739,873 | ) | ||||
|
Deferred tax assets |
(26,117 | ) | (3,126 | ) | ||||
|
Deferred tax assets, other comprehensive loss |
26,117 | 3,126 | ||||||
|
Deferred tax liabilities |
||||||||
|
Mineral properties |
(545,000 | ) | (550,551 | ) | ||||
|
Net deferred tax liabilities |
$ | (545,000 | ) | $ | (550,551 | ) | ||
As the criteria for recognizing deferred income tax assets have not been met due to the uncertainty of realization, a valuation allowance of 100% has been recorded for the current and prior years.
The Company’s U.S. net operating loss carry-forwards expire as follows:
|
July 31, 2023 |
$ | 180,892 | ||
|
July 31, 2024 |
228,757 | |||
|
July 31, 2025 |
507,833 | |||
|
July 31, 2026 |
5,895,221 | |||
|
July 31, 2027 |
3,892,722 | |||
|
Remaining balance |
156,594,095 | |||
| $ | 167,299,520 |
For U.S. federal income tax purposes, a change in ownership under IRC Section 382 has occurred as a result of the acquisition of the Reno Creek Project during Fiscal 2018 and also in prior years. When an ownership change has occurred, the utilization of these losses against future income would be subject to an annual limitation, which would be equal to the value of the acquired company immediately prior to the change in ownership multiplied by the IRC Section 382 rate in effect during the month of the change.
|
URANIUM ENERGY CORP. |
|
NOTES TO THE CONSOLIDATED FINANCIAL STATEMENTS |
|
JULY 31, 2020 |
The Company’s Canadian net operating loss carry-forwards in Canadian dollars expire as follows:
|
July 31, 2027 |
$ | 183,105 | ||
|
July 31, 2028 |
629,788 | |||
|
July 31, 2029 |
769,072 | |||
|
July 31, 2030 |
764,230 | |||
|
July 31, 2031 |
1,747,548 | |||
|
Remaining balance |
958,124 | |||
| $ | 5,051,867 |
|
NOTE 16: |
FAIR VALUE MEASUREMENT |
Fair value accounting establishes a fair value hierarchy that prioritizes the inputs to valuation techniques used to measure fair value. The hierarchy gives the highest priority to unadjusted quoted prices in active markets for identical assets or liabilities (Level 1 measurements) and the lowest priority to unobservable inputs (Level 3 measurements). The three levels of the fair value hierarchy are described below:
|
● |
Level 1 Unadjusted quoted prices in active markets that are accessible at the measurement date for identical unrestricted assets or liabilities; |
|
● |
Level 2 Quoted prices in markets that are not active, quoted prices for similar assets or liabilities in active markets, quoted prices or inputs that are observable, either directly or indirectly, for substantially the full term of the asset or liability and model-based valuation techniques for which all significant inputs are observable in the market or can be corroborated by observable market data for substantially the full term of the assets or liabilities; and |
|
● |
Level 3 Prices or valuation techniques that require inputs that are both significant to the fair value measurement and unobservable (supported by little or no market activity). |
The financial instruments, including cash and cash equivalents, term deposits, accounts payable and accrued liabilities and due to related party amounts, are carried at cost, which approximate their fair values due to the immediate or short-term maturity. Restricted cash are primarily investments in money market funds at major financial institutions and their fair values approximate their carrying values. Government loan payable is carried at amortized cost which approximates its fair value. Long-term debt is carried at amortized costs which approximates its fair value.
|
NOTE 17: |
SEGMENTED INFORMATION |
We currently operate in a single reportable segment and we are focused on uranium mining and related activities, including exploration, pre-extraction, extraction and processing of uranium concentrates.
At July 31, 2020, long-term assets located in the U.S. were $57,786,932 or 68% of our total long-term assets of $84,799,738.
The table below provides a breakdown of the Company’s long-term assets by geographic segment:
|
July 31, 2020 |
||||||||||||||||||||||||||||
| Balance Sheet Items |
United States |
|||||||||||||||||||||||||||
|
|
Texas |
Arizona |
Wyoming |
Other States |
Canada |
Paraguay |
Total |
|||||||||||||||||||||
|
Mineral Rights and Properties |
$ | 12,422,661 | $ | 4,527,477 | $ | 31,527,870 | $ | 116,971 | $ | 546,938 | $ | 14,513,586 | $ | 63,655,503 | ||||||||||||||
|
Property, Plant and Equipment |
6,299,786 | - | 327,639 | - | 29,677 | 362,715 | 7,019,817 | |||||||||||||||||||||
|
Restricted Cash |
1,750,243 | 15,000 | 73,973 | - | - | - | 1,839,216 | |||||||||||||||||||||
|
Equity-Accounted Investment |
- | - | - | - | 11,515,327 | - | 11,515,327 | |||||||||||||||||||||
|
Other Non-Current Assets |
703,312 | - | 22,000 | - | 44,563 | - | 769,875 | |||||||||||||||||||||
|
Total Long-Term Assets |
$ | 21,176,002 | $ | 4,542,477 | $ | 31,951,482 | $ | 116,971 | $ | 12,136,505 | $ | 14,876,301 | $ | 84,799,738 | ||||||||||||||
|
July 31, 2019 |
||||||||||||||||||||||||||||
| Balance Sheet Items |
United States |
|||||||||||||||||||||||||||
|
|
Texas |
Arizona |
Wyoming |
Other States |
Canada |
Paraguay |
Total |
|||||||||||||||||||||
|
Mineral Rights and Properties |
$ | 12,433,203 | $ | 4,427,477 | $ | 31,527,870 | $ | 87,822 | $ | 546,938 | $ | 14,513,585 | $ | 63,536,895 | ||||||||||||||
|
Property, Plant and Equipment |
6,333,950 | - | 342,515 | - | 14,223 | 351,671 | 7,042,359 | |||||||||||||||||||||
|
Restricted Cash |
1,732,419 | 15,000 | 73,973 | - | - | - | 1,821,392 | |||||||||||||||||||||
|
Equity-Accounted Investment |
- | - | - | - | 8,680,449 | - | 8,680,449 | |||||||||||||||||||||
|
Other Non-Current Assets |
221,214 | - | 28,000 | - | - | - | 249,214 | |||||||||||||||||||||
|
Total Long-Term Assets |
$ | 20,720,786 | $ | 4,442,477 | $ | 31,972,358 | $ | 87,822 | $ | 9,241,610 | $ | 14,865,256 | $ | 81,330,309 | ||||||||||||||
|
URANIUM ENERGY CORP. |
|
NOTES TO THE CONSOLIDATED FINANCIAL STATEMENTS |
|
JULY 31, 2020 |
The table below provides a breakdown of our operating results by geographic segment. All intercompany transactions have been eliminated.
|
Year ended July 31, 2020 |
||||||||||||||||||||||||||||
| Statement of Operations |
United States |
|||||||||||||||||||||||||||
|
|
Texas |
Arizona |
Wyoming |
Other States |
Canada |
Paraguay |
Total |
|||||||||||||||||||||
|
Costs and Expenses: |
||||||||||||||||||||||||||||
|
Mineral property expenditures |
$ | 3,165,898 | $ | 104,191 | $ | 596,551 | $ | 69,523 | $ | - | $ | 646,240 | $ | 4,582,403 | ||||||||||||||
|
General and administrative |
6,982,684 | 13,717 | 112,193 | 2,277 | 2,272,138 | 58,889 | 9,441,898 | |||||||||||||||||||||
|
Depreciation, amortization and accretion |
273,687 | - | 14,876 | 850 | 11,959 | 8,850 | 310,222 | |||||||||||||||||||||
|
Loss from operations |
(10,422,269 | ) | (117,908 | ) | (723,620 | ) | (72,650 | ) | (2,284,097 | ) | (713,979 | ) | (14,334,523 | ) | ||||||||||||||
|
Other income (expenses) |
(3,417,783 | ) | (18,965 | ) | 2,095 | - | 3,147,724 | 5,385 | (281,544 | ) | ||||||||||||||||||
|
Loss before income taxes |
$ | (13,840,052 | ) | $ | (136,873 | ) | $ | (721,525 | ) | $ | (72,650 | ) | $ | 863,627 | $ | (708,594 | ) | $ | (14,616,067 | ) | ||||||||
|
Year ended July 31, 2019 |
||||||||||||||||||||||||||||
| Statement of Operations |
United States |
|||||||||||||||||||||||||||
|
|
Texas |
Arizona |
Wyoming |
Other States |
Canada |
Paraguay |
Total |
|||||||||||||||||||||
|
Costs and Expenses: |
||||||||||||||||||||||||||||
|
Mineral property expenditures |
$ | 3,072,855 | $ | 112,724 | $ | 655,807 | $ | 69,910 | $ | 16,078 | $ | 560,163 | $ | 4,487,537 | ||||||||||||||
|
General and administrative |
6,619,855 | 14,040 | 147,648 | 3,557 | 3,165,883 | 191,052 | 10,142,035 | |||||||||||||||||||||
|
Depreciation, amortization and accretion |
314,599 | - | 14,876 | 996 | 11,666 | 5,304 | 347,441 | |||||||||||||||||||||
|
Loss from operations |
(10,007,309 | ) | (126,764 | ) | (818,331 | ) | (74,463 | ) | (3,193,627 | ) | (756,519 | ) | (14,977,013 | ) | ||||||||||||||
|
Other income (expenses) |
(3,337,331 | ) | (18,914 | ) | 2,284 | 1,578,864 | (432,598 | ) | 17,547 | (2,190,148 | ) | |||||||||||||||||
|
Loss before income taxes |
$ | (13,344,640 | ) | $ | (145,678 | ) | $ | (816,047 | ) | $ | 1,504,401 | $ | (3,626,225 | ) | $ | (738,972 | ) | $ | (17,167,161 | ) | ||||||||
|
Year ended July 31, 2018 |
||||||||||||||||||||||||||||
|
Statement of Operations |
United States |
|||||||||||||||||||||||||||
|
Texas |
Arizona |
Wyoming |
Other States |
Canada |
Paraguay |
Total |
||||||||||||||||||||||
|
Costs and Expenses: |
||||||||||||||||||||||||||||
|
Mineral property expenditures |
$ | 2,381,993 | $ | 100,296 | $ | 1,282,164 | $ | 67,550 | $ | - | $ | 720,148 | $ | 4,552,151 | ||||||||||||||
|
General and administrative |
7,055,370 | 13,877 | 581,277 | 10,931 | 3,467,934 | 277,817 | 11,407,206 | |||||||||||||||||||||
|
Depreciation, amortization and accretion |
325,567 | - | 12,847 | 996 | 11,599 | 3,615 | 354,624 | |||||||||||||||||||||
|
Loss from operations |
(9,762,930 | ) | (114,173 | ) | (1,876,288 | ) | (79,477 | ) | (3,479,533 | ) | (1,001,580 | ) | (16,313,981 | ) | ||||||||||||||
|
Other income (expenses) |
(2,630,691 | ) | (18,914 | ) | 1,541 | - | 423,657 | 4,243 | (2,220,164 | ) | ||||||||||||||||||
|
Loss before income taxes |
$ | (12,393,621 | ) | $ | (133,087 | ) | $ | (1,874,747 | ) | $ | (79,477 | ) | $ | (3,055,876 | ) | $ | (997,337 | ) | $ | (18,534,145 | ) | |||||||
|
NOTE 18: |
SUPPLEMENTAL CASH FLOW INFORMATION |
During Fiscal 2020, we paid $1,626,667 (Fiscal 2019: $1,622,222; Fiscal 2018; $1,622,222) for interest on our long-term debt. During Fiscal 2020, we paid $116,279 (Fiscal 2019: $113,117; Fiscal 2018: $118,944) for surety bond premiums.
During Fiscal 2018, we issued 14,634,748 shares and paid $909,930 in cash as consideration to acquire the Reno Creek Project. In addition, we issued 353,160 shares as payment of the reimbursable expenses totaling $483,829 and issued 217,702 shares with a fair value of $283,013 as payment of certain transaction costs.
During Fiscal 2018, we issued 1,625,531 shares with a fair value of $2,617,105 and paid $2,940,000 in cash as consideration to acquire the North Reno Creek Project. In addition, we issued 65,684 shares with a fair value of $105,751 as payment of certain transaction costs.
During Fiscal 2018, we issued 164,767 shares with a fair value of $232,321 and paid $239,120 in cash as consideration to acquire the Diabase Project.
SIGNATURES
Pursuant to the requirements of Section 13 or 15(d) of the Securities Exchange Act of 1934, the registrant has duly caused this report to be signed on its behalf by the undersigned, thereunto duly authorized.
| URANIUM ENERGY CORP. | ||
|
By: |
/s/ Amir Adnani |
|
|
Amir Adnani President, Chief Executive Officer |
||
|
(Principal Executive Officer) and Director |
||
|
Date: October 28, 2020. |
||
Pursuant to the requirements of the Securities Exchange Act of 1934, this report has been signed below by the following persons on behalf of the registrant and in the capacities and on the dates indicated.
|
By: |
/s/ Amir Adnani |
|
|
Amir Adnani |
||
|
President, Chief Executive Officer (Principal |
||
|
Executive Officer) and Director |
||
|
Date: October 28, 2020. |
||
|
By: |
/s/ Pat Obara |
|
|
Pat Obara |
||
|
Chief Financial Officer (Principal Financial Officer |
||
|
and Principal Accounting Officer) |
||
|
Date: October 28, 2020. |
||
|
By: |
/s/ Spencer Abraham |
|
|
Spencer Abraham |
||
|
Chairman and Director |
||
|
Date: October 28, 2020. |
||
|
By: |
/s/ Vincent Della Volpe |
|
|
Vincent Della Volpe |
||
|
Director |
||
|
Date: October 28, 2020. |
||
|
By: |
/s/ David Kong |
|
|
David Kong |
||
|
Director |
||
|
Date: October 28, 2020. |
||
|
By: |
/s/ Ganpat Mani |
|
|
Ganpat Mani |
||
|
Director |
||
|
Date: October 28, 2020. |
||
|
By: |
/s/ Gloria Ballesta |
|
|
Gloria Ballesta |
||
|
Director |
||
|
Date: October 28, 2020. |
__________