Attached files
| file | filename |
|---|---|
| EX-99.1 - EX-99.1 - MidWestOne Financial Group, Inc. | financialresultsq32020.htm |
| 8-K - 8-K - MidWestOne Financial Group, Inc. | mofg-20201029.htm |

SUPPLEMENTAL INFORMATION THIRD QUARTER 2020 September 30, 2020

Credit Monitoring 2

Credit Monitoring • During the third quarter of 2020, credit monitoring procedures included a review of the following loan totals: ◦ Enhanced Risk Rating Review $801 million, or 23% of the loan portfolio. ◦ Loan Strategy $139 million, or 4% of the loan portfolio. $940 million, or 27% of the loan portfolio Foundational Credit Monitoring Processes Enhanced Risk Rating Review (quarterly beginning 2Q.2020) • Monthly Past Due Loan Reviews • Loans >$1 million from the following COVID-19 vulnerable industry groups ◦ Population: All past due loans. ◦ Nonessential retail ◦ Objective: Delinquency resolution and loan risk rating evaluation ◦ Restaurants (excluding quick-service restaurants) ◦ Hotel • Quarterly Loan Strategy ◦ CRE-retail ◦ Population: Watch risk rated loans >$1 million ◦ Arts, entertainment & gaming Substandard risk rated loans >$500 thousand Non-accrual loans >$250 thousand • The top 30 largest credit relationships which ranged in size from $3-29 million. ◦ Objective: Loan risk rating evaluation, relationship strategy, loan accrual status and ACL for individually analyzed loans • Annual Credit Reviews ◦ Population: Pass risk rated credit relationships >$1million ◦ Objective: Loan risk rating evaluation 3

COVID-19 Vulnerable Industries 4

Exposure in Vulnerable Industries Loan Portfolio Vulnerable Industries Vulnerable Industries 14% Non-essential Retail $101.2 20% Restaurants $52.7 11% Hotel $121.1 24% CRE - Retail $200.0 40% 86% Arts, Entertainment & Gaming $25.9 5% $— $25.0 $50.0 $75.0 $100.0 $125.0 $150.0 $175.0 $200.0 $225.0 All Other Loans $ of Portfolio • $ in millions, Loan balances as of 9/30/20 • % are representative of each underlying vulnerable industry as a percentage of the total vulnerable industry loans 5

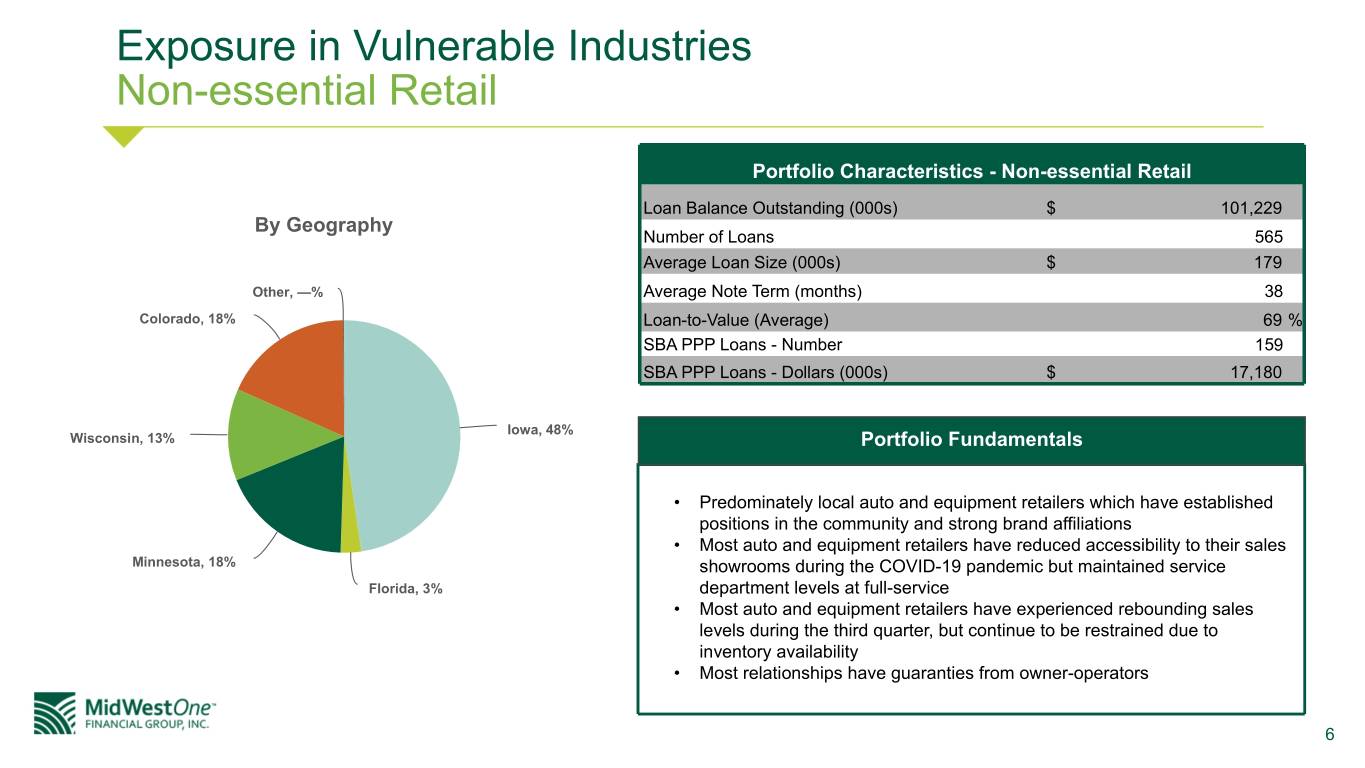
Exposure in Vulnerable Industries Non-essential Retail Portfolio Characteristics - Non-essential Retail Loan Balance Outstanding (000s) $ 101,229 By Geography Number of Loans 565 Average Loan Size (000s) $ 179 Other, —% Average Note Term (months) 38 Colorado, 18% Loan-to-Value (Average) 69 % SBA PPP Loans - Number 159 SBA PPP Loans - Dollars (000s) $ 17,180 Iowa, 48% Wisconsin, 13% Portfolio Fundamentals • Predominately local auto and equipment retailers which have established positions in the community and strong brand affiliations • Most auto and equipment retailers have reduced accessibility to their sales Minnesota, 18% showrooms during the COVID-19 pandemic but maintained service Florida, 3% department levels at full-service • Most auto and equipment retailers have experienced rebounding sales levels during the third quarter, but continue to be restrained due to inventory availability • Most relationships have guaranties from owner-operators 6

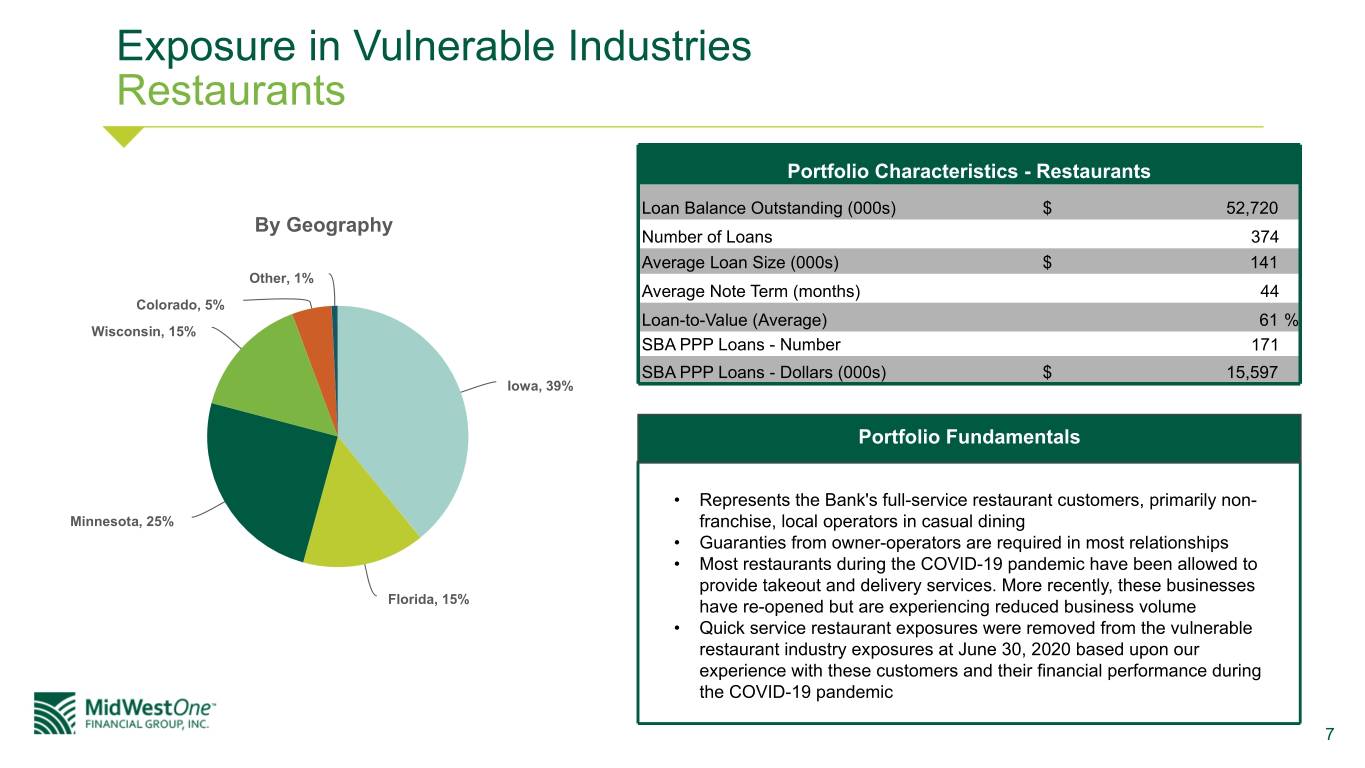
Exposure in Vulnerable Industries Restaurants Portfolio Characteristics - Restaurants Loan Balance Outstanding (000s) $ 52,720 By Geography Number of Loans 374 Average Loan Size (000s) $ 141 Other, 1% Average Note Term (months) 44 Colorado, 5% Loan-to-Value (Average) 61 % Wisconsin, 15% SBA PPP Loans - Number 171 SBA PPP Loans - Dollars (000s) $ 15,597 Iowa, 39% Portfolio Fundamentals • Represents the Bank's full-service restaurant customers, primarily non- Minnesota, 25% franchise, local operators in casual dining • Guaranties from owner-operators are required in most relationships • Most restaurants during the COVID-19 pandemic have been allowed to provide takeout and delivery services. More recently, these businesses Florida, 15% have re-opened but are experiencing reduced business volume • Quick service restaurant exposures were removed from the vulnerable restaurant industry exposures at June 30, 2020 based upon our experience with these customers and their financial performance during the COVID-19 pandemic 7

Exposure in Vulnerable Industries Hotel Portfolio Characteristics - Hotel Loan Balance Outstanding (000s) $ 121,078 By Geography Number of Loans 86 Average Loan Size (000s) $ 1,408 Average Note Term (months) 56 Other, 6% Loan-to-Value (Average) 62 % Colorado, 1% SBA PPP Loans - Number 26 Wisconsin, 4% SBA PPP Loans - Dollars (000s) $ 2,184 Minnesota, 22% Portfolio Fundamentals Iowa, 50% • Lending focus is on experienced, local developers within the Bank's trade areas. Approximately 80% of properties have major flags while the remainder is comprised of gaming industry related boutique hotels in the Dubuque, IA market • Flagged hotels are primarily core travel hotels that are positioned close to major highways in the Bank's key metropolitan markets with no convention center exposure Florida, 17% • Conservative underwriting standards include a maximum LTV of 75% • Guaranties from owner-operators are regularly required. Non-recourse lending is not a material exposure • Occupancy was severely reduced between April - June 2020 (generally to less than 10%). Most operators have recently seen improving occupancy trends with some reporting 40% or higher in August 2020. Hotels associated with Dubuque's gaming industry have recently been experiencing weekend occupancy rates comparable to pre-pandemic levels 8

Exposure in Vulnerable Industries CRE-Retail Portfolio Characteristics - CRE-Retail Loan Balance Outstanding (000s) $ 199,958 By Geography Number of Loans 216 Other, 3% Average Loan Size (000s) $ 926 Wisconsin, 12% Iowa, 18% Average Note Term (months) 72 Loan-to-Value (Average) 56 % SBA PPP Loans - Number 3 SBA PPP Loans - Dollars (000s) $ 86 Florida, 15% Portfolio Fundamentals • Lending focus is on experienced, local developers and operators, with properties that are within the Bank's trade areas • Exposure is predominately retail strip centers with a diverse tenant base including services, restaurants, and national retailers; malls are not included Minnesota, 52% within the exposure group • Conservative underwriting standards include a maximum LTV of 75% • Guaranties are regularly required; non-recourse is rare and associated with strong properties and LTV <60-65% • This segment has largely stabilized for the current state as businesses have generally re-opened 9

Exposure in Vulnerable Industries Arts, Entertainment & Gaming Portfolio Characteristics - Arts, Entertainment & Gaming Loan Balance Outstanding (000s) $ 25,915 By Geography Number of Loans 169 Average Loan Size (000s) $ 153 Other, 5% Average Note Term (months) 51 Colorado, 2% Loan-to-Value (Average) 55 % Wisconsin, 10% SBA PPP Loans - Number 69 SBA PPP Loans - Dollars (000s) $ 3,039 Portfolio Fundamentals Minnesota, 19% • Small overall exposure relative to the portfolio; not a key focus of the Bank's Iowa, 64% lending efforts Florida, —% • Largest concentration of exposure is gaming operations in our Dubuque, IA market (in the Mississippi River Entertainment district) • While completely shutdown during the initial COVID-19 risk mitigation orders in Iowa, the facilities have since re-opened, with strict risk mitigation guidelines, and are experiencing a solid rebound in business volume 10

COVID-19 Loan Modifications 11

COVID-19 Loan Modification Status Declining COVID-19 Deferrals: Down 75% from 6/30/20 to 9/30/20 As of September 30, 2020 As of June 30, 2020 % Change % Loan Payments Payments Portfolio Total Modifications Resumed Ending Modifications Total Modifications Resumed Ending Modifications 6/30 > 9/30 9/30 (dollars in millions) # $ $ # $ # $ $ # $ $ Agricultural 17 $ 2.6 $ 2.4 2 $ 0.2 16 $ 2.5 $ — 16 $ 2.5 (92) % — % Commercial 285 75.7 67.2 12 8.5 272 75.9 2.5 248 73.4 (88) % — % CRE 418 390.9 287.9 41 103.0 393 370.2 3.1 385 367.1 (72) % 3 % RRE 217 25.2 20.9 62 4.3 202 25.5 0.6 196 24.9 (83) % — % Consumer 80 0.7 0.7 4 — 76 0.8 0.1 66 0.7 (100) % — % Total 1,017 $ 495.1 $ 379.1 121 $ 116.0 (1) 959 $ 474.9 $ 6.3 911 $ 468.6 (75) % 3 % (1) $41.2 million in 1st modification, $74.8 million in or being processed for 2nd modification. 12

Digital and Branch Banking Trends 13

Digital and Branch Banking Trends 646,272 642,141 559,370 526,384 3,064,858 481,913 2,774,297 2,768,206 2,669,468 2,486,406 Q3'19 Q4'19 Q1'20 Q2'20 Q3'20 Branch/Teller Transactions 38,538 37,735 31,119 32,971 32,462 Q3'19 Q4'19 Q1'20 Q2'20 Q3'20 Q3'19 Q4'19 Q1'20 Q2'20 Q3'20 Mobile Logins Online/Dekstop Logins # of Mobile Deposits 14
