Attached files
| file | filename |
|---|---|
| EX-99.2 - EX-99.2 - CTO Realty Growth, Inc. | cto-20201028xex99d2.htm |
| EX-99.1 - EX-99.1 - CTO Realty Growth, Inc. | cto-20201028xex99d1.htm |
| 8-K - 8-K - CTO Realty Growth, Inc. | cto-20201028x8k.htm |
Exhibit 99.3
| REALTY GROWTH OCTOBER 2020 |
| 2 CTO Realty Growth, Inc. FORWARD LOOKING STATEMENTS Certain statements contained in this presentation (other than statements of historical fact) are forward-looking statements within the meaning of Section 27A of the Securities Act of 1933, as amended, and Section 21E of the Securities Exchange Act of 1934, as amended. Forward-looking statements can typically be identified by words such as “believe,” “estimate,” “expect,” “intend,” “anticipate,” “will,” “could,” “may,” “should,” “plan,” “potential,” “predict,” “forecast,” “project,” and similar expressions, as well as variations or negatives of these words. Although forward-looking statements are made based upon management’s present expectations and reasonable beliefs concerning future developments and their potential effect upon the Company, a number of factors could cause the Company’s actual results to differ materially from those set forth in the forward-looking statements. Such factors may include:(1) uncertainties relating to the estimate of the amount of the Special Distribution;(2) the expected timing and likelihood of completion of the Merger;(3) the possibility that the Company’s shareholders may not approve the Merger;(4) risks related to disruption of management’s attention from ongoing business operations due to the Merger and REIT conversion;(5) the Company’s ability to remain qualified as a REIT;(6) the Company’s exposure to U.S. federal and state income tax law changes, including changes to the REIT requirements;(7) general adverse economic and real estate conditions;(8) the ultimate geographic spread, severity and duration of pandemics such as the recent outbreak of novel coronavirus, actions that may be taken by governmental authorities to contain or address the impact of such pandemics, and the potential negative impacts of such pandemics on the global economy and the Company’s financial condition and results of operations;(9) the inability of major tenants to continue paying their rent or obligations due to bankruptcy, insolvency or a general downturn in their business;(10) the completion of 1031 exchange transactions;(11) the availability of investment properties that meet the Company’s investment goals and criteria;(12) the uncertainties associated with obtaining required governmental permits and satisfying other closing conditions for planned acquisitions and sales; and (13) an epidemic or pandemic (such as the outbreak and worldwide spread of COVID-19), and the measures that international, federal, state and local governments, agencies, law enforcement and/or health authorities implement to address it, which may (as with COVID-19) precipitate or exacerbate one or more of the above-mentioned and/or other risks, and significantly disrupt or prevent us from operating our business in the ordinary course for an extended period. For additional information regarding factors that may cause the Company’s actual results to differ materially from those set forth in the Company’s forward-looking statements, the Company refers you to the information contained under the caption “Risk Factors” in the Company’s Annual Report on Form 10-K for the fiscal year ended December 31, 2019, in the Company’s Quarterly Report on Form 10-Q for the quarter ended June 30, 2020 and in the Company’s Definitive Proxy Statement on Schedule 14A dated October 19, 2020, each as filed with the Securities and Exchange Commission. There can be no assurance that future developments will be in accordance with management’s expectations or that the effect of future developments on the Company will be those anticipated by management. Readers are cautioned not to place undue reliance on these forward-looking statements, which speak only as of the date of this release. The Company undertakes no obligation to update the information contained in this presentation to reflect subsequently occurring events or circumstances. Investor Inquiries: Matthew M. Partridge Chief Financial Officer (386) 944-5643 mpartridge@ctorealtygrowth.com |
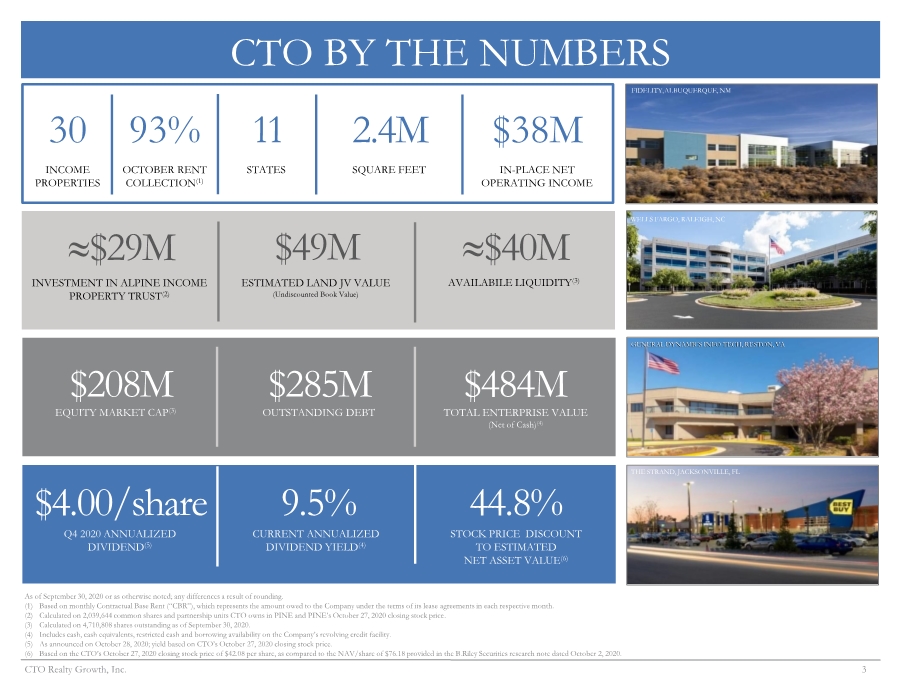
| 3 CTO Realty Growth, Inc. CTO BY THE NUMBERS FIDELITY,ALBUQUERQUE, NM WELLS FARGO, RALEIGH, NC GENERAL DYNAMICS INFO TECH, RESTON, VA THE STRAND, JACKSONVILLE, FL As of September 30, 2020 or as otherwise noted; any differences a result of rounding. (1) Based on monthly Contractual Base Rent (“CBR”), which represents the amount owed to the Company under the terms of its lease agreements in each respective month. (2) Calculated on 2,039,644 common shares and partnership units CTO owns in PINE and PINE’s October 27, 2020 closing stock price. (3) Calculated on 4,710,808 shares outstanding as of September 30, 2020. (4) Includes cash, cash equivalents, restricted cash and borrowing availability on the Company’s revolving credit facility. (5) As announced on October 28, 2020; yield based on CTO’s October 27, 2020 closing stock price. (6) Based on the CTO’s October 27, 2020 closing stock price of $42.08 per share, as compared to the NAV/share of $76.18 provided in the B.Riley Securities research note dated October 2, 2020. 30 11 INCOME PROPERTIES 2.4M $38M $29M $208M $285M $484M STATES SQUARE FEET IN-PLACE NET OPERATING INCOME INVESTMENT IN ALPINE INCOME PROPERTY TRUST(2) EQUITY MARKET CAP(3) OUTSTANDING DEBT TOTAL ENTERPRISE VALUE (Net of Cash)(4) Q4 2020 ANNUALIZED DIVIDEND(5) $4.00/share 44.8% STOCK PRICE DISCOUNT TO ESTIMATED NET ASSET VALUE(6) $49M ESTIMATED LAND JV VALUE (Undiscounted Book Value) 93% OCTOBER RENT COLLECTION(1) 9.5% CURRENT ANNUALIZED DIVIDEND YIELD(4) $40M AVAILABILE LIQUIDITY(3) |
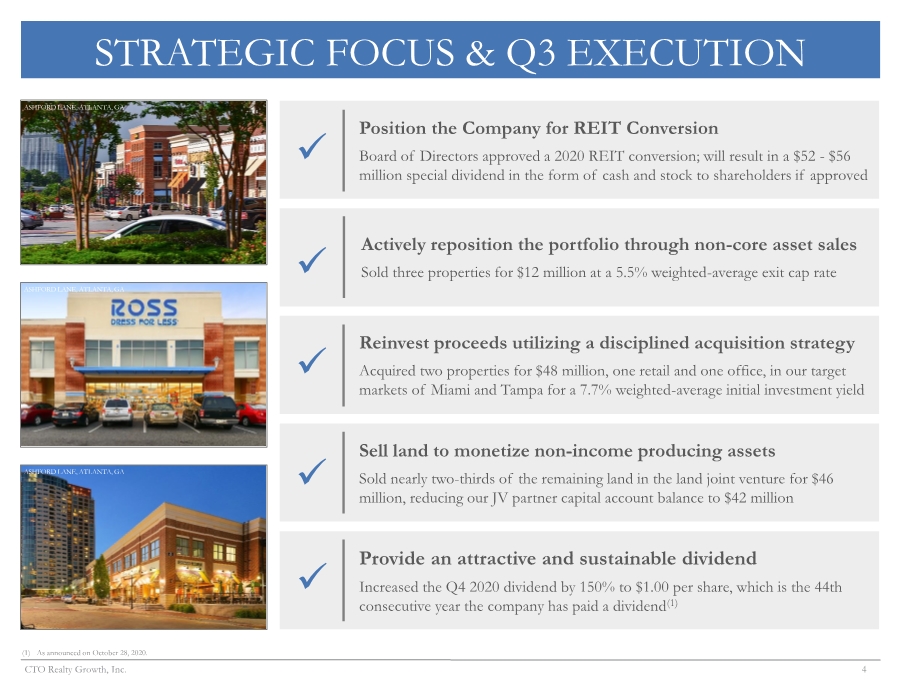
| 4 CTO Realty Growth, Inc. STRATEGIC FOCUS & Q3 EXECUTION ASHFORD LANE, ATLANTA, GA ASHFORD LANE, ATLANTA, GA ASHFORD LANE, ATLANTA, GA Position the Company for REIT Conversion Board of Directors approved a 2020 REIT conversion; will result in a $52 - $56 million special dividend in the form of cash and stock to shareholders if approved ✓ ✓ Provide an attractive and sustainable dividend Increased the Q4 2020 dividend by 150% to $1.00 per share, which is the 44th consecutive year the company has paid a dividend(1) ✓ Sell land to monetize non-income producing assets Sold nearly two-thirds of the remaining land in the land joint venture for $46 million, reducing our JV partner capital account balance to $42 million ✓ Actively reposition the portfolio through non-core asset sales Sold three properties for $12 million at a 5.5% weighted-average exit cap rate ✓ Reinvest proceeds utilizing a disciplined acquisition strategy Acquired two properties for $48 million, one retail and one office, in our target markets of Miami and Tampa for a 7.7% weighted-average initial investment yield (1) As announced on October 28, 2020. |
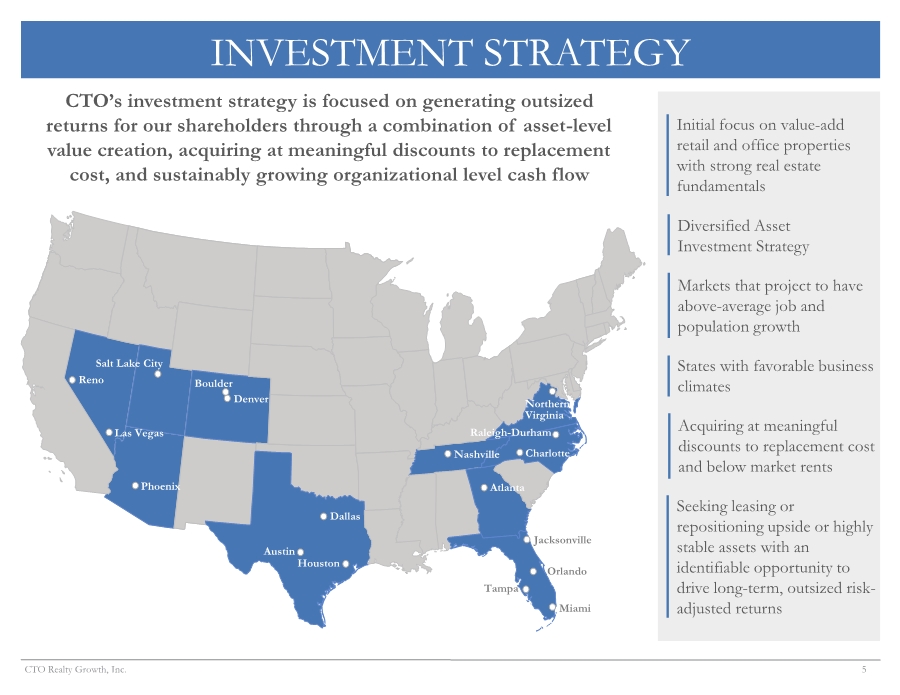
| 5 CTO Realty Growth, Inc. INVESTMENT STRATEGY Miami Orlando Tampa Atlanta Jacksonville Nashville Charlotte Raleigh-Durham Northern Virginia Dallas Houston Austin Denver Boulder Salt Lake City Las Vegas Reno Phoenix Diversified Asset Investment Strategy Markets that project to have above-average job and population growth States with favorable business climates Initial focus on value-add retail and office properties with strong real estate fundamentals Seeking leasing or repositioning upside or highly stable assets with an identifiable opportunity to drive long-term, outsized risk- adjusted returns CTO’s investment strategy is focused on generating outsized returns for our shareholders through a combination of asset-level value creation, acquiring at meaningful discounts to replacement cost, and sustainably growing organizational level cash flow Acquiring at meaningful discounts to replacement cost and below market rents |
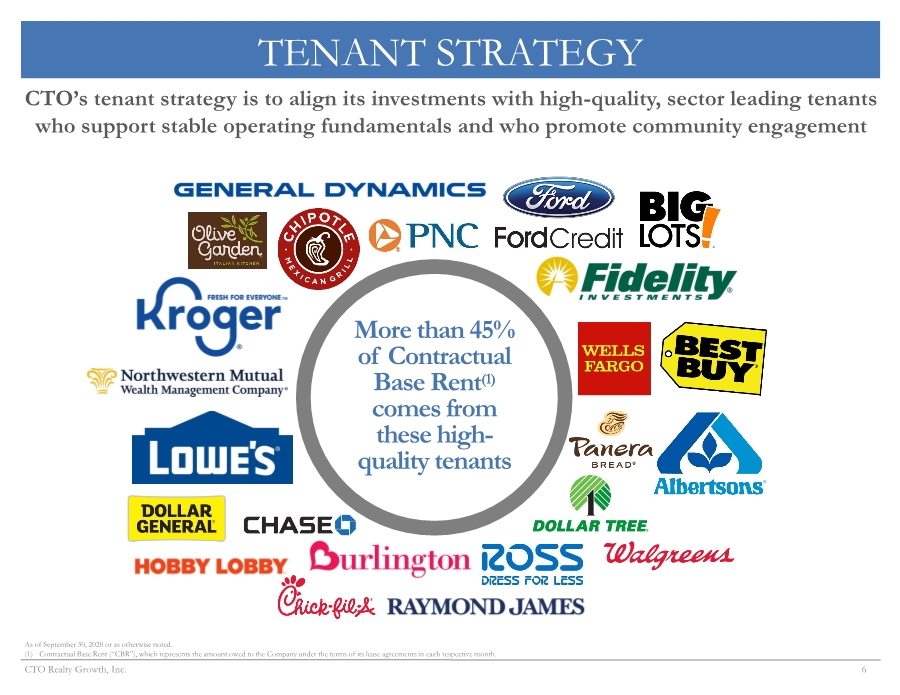
| 6 CTO Realty Growth, Inc. TENANT STRATEGY CTO’s tenant strategy is to align its investments with high-quality, sector leading tenants who support stable operating fundamentals and who promote community engagement More than 45% of Contractual Base Rent(1) comes from these high- quality tenants As of September 30, 2020 or as otherwise noted. (1) Contractual Base Rent (“CBR”), which represents the amount owed to the Company under the terms of its lease agreements in each respective month. |
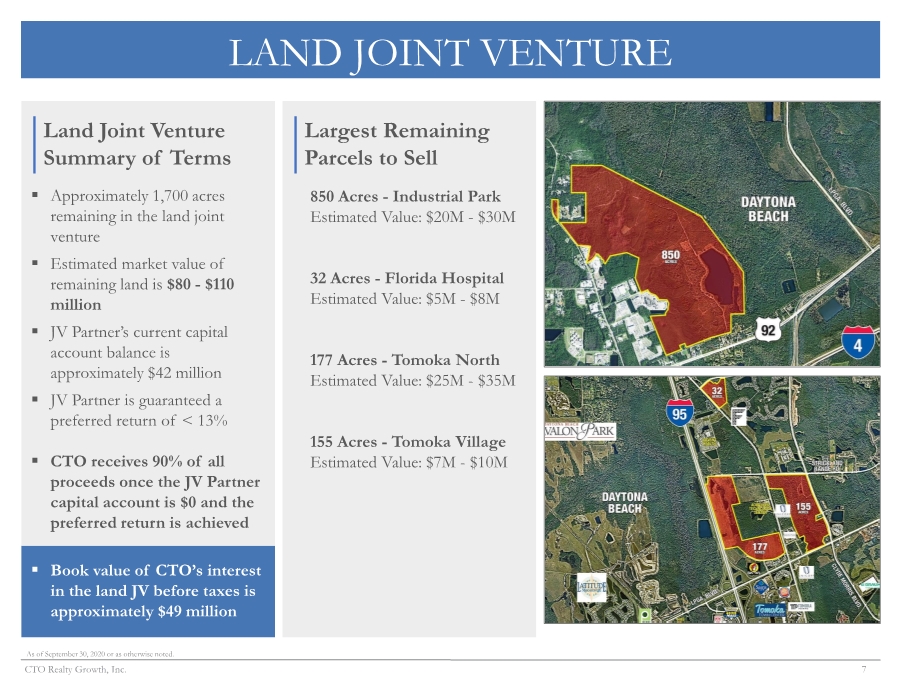
| 7 CTO Realty Growth, Inc. LAND JOINT VENTURE Land Joint Venture Summary of Terms ▪ Approximately 1,700 acres remaining in the land joint venture ▪ Estimated market value of remaining land is $80 - $110 million ▪ JV Partner’s current capital account balance is approximately $42 million ▪ JV Partner is guaranteed a preferred return of < 13% ▪ CTO receives 90% of all proceeds once the JV Partner capital account is $0 and the preferred return is achieved ▪ Book value of CTO’s interest in the land JV before taxes is approximately $49 million As of September 30, 2020 or as otherwise noted. Largest Remaining Parcels to Sell 850 Acres - Industrial Park Estimated Value: $20M - $30M 32 Acres - Florida Hospital Estimated Value: $5M - $8M 177 Acres - Tomoka North Estimated Value: $25M - $35M 155 Acres - Tomoka Village Estimated Value: $7M - $10M |
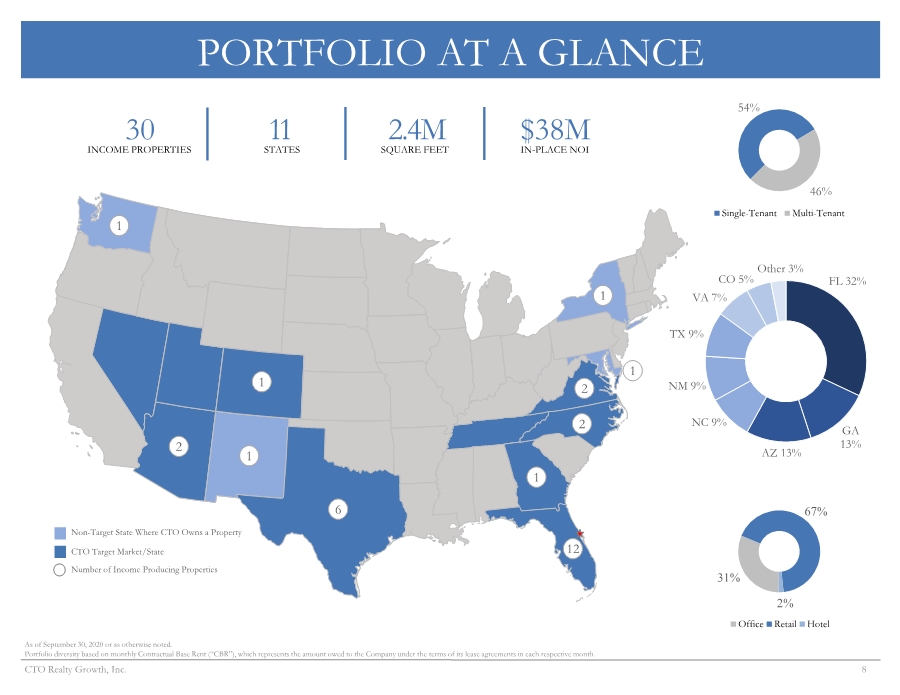
| 8 CTO Realty Growth, Inc. PORTFOLIO AT A GLANCE 6 Number of Income Producing Properties CTO Target Market/State Non-Target State Where CTO Owns a Property 1 1 2 12 1 2 1 2 1 1 FL 32% GA 13% AZ 13% NC 9% NM 9% TX 9% VA 7% CO 5% Other 3% 31% 67% 2% Office Retail Hotel 54% 46% Single-Tenant Multi-Tenant 30 11 INCOME PROPERTIES 2.4M $38M STATES SQUARE FEET IN-PLACE NOI As of September 30, 2020 or as otherwise noted. Portfolio diversity based on monthly Contractual Base Rent (“CBR”), which represents the amount owed to the Company under the terms of its lease agreements in each respective month. |
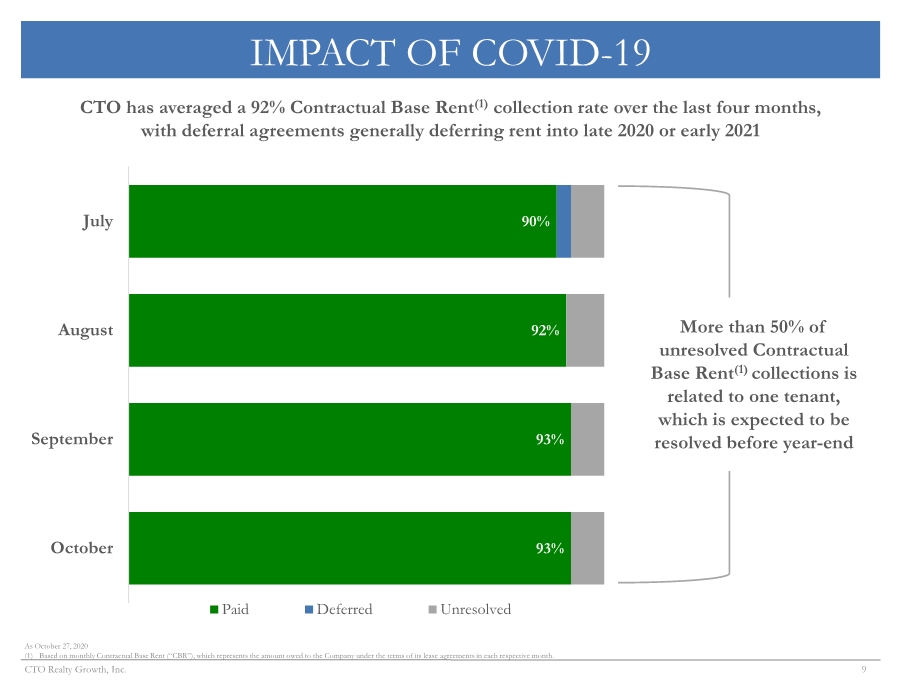
| 9 CTO Realty Growth, Inc. IMPACT OF COVID-19 93% 93% 92% 90% October September August July Paid Deferred Unresolved CTO has averaged a 92% Contractual Base Rent(1) collection rate over the last four months, with deferral agreements generally deferring rent into late 2020 or early 2021 As October 27, 2020 (1) Based on monthly Contractual Base Rent (“CBR”), which represents the amount owed to the Company under the terms of its lease agreements in each respective month. More than 50% of unresolved Contractual Base Rent(1) collections is related to one tenant, which is expected to be resolved before year-end |
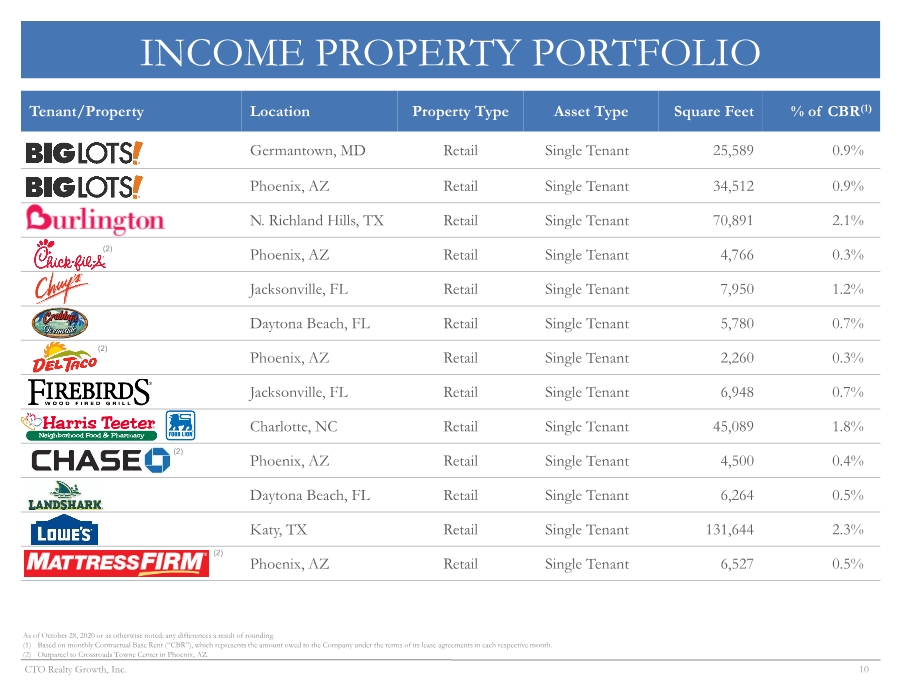
| 10 CTO Realty Growth, Inc. INCOME PROPERTY PORTFOLIO Tenant/Property Location Property Type Asset Type Square Feet % of CBR(1) Germantown, MD Retail Single Tenant 25,589 0.9% Phoenix, AZ Retail Single Tenant 34,512 0.9% N. Richland Hills, TX Retail Single Tenant 70,891 2.1% Phoenix, AZ Retail Single Tenant 4,766 0.3% Jacksonville, FL Retail Single Tenant 7,950 1.2% Daytona Beach, FL Retail Single Tenant 5,780 0.7% Phoenix, AZ Retail Single Tenant 2,260 0.3% Jacksonville, FL Retail Single Tenant 6,948 0.7% Charlotte, NC Retail Single Tenant 45,089 1.8% Phoenix, AZ Retail Single Tenant 4,500 0.4% Daytona Beach, FL Retail Single Tenant 6,264 0.5% Katy, TX Retail Single Tenant 131,644 2.3% Phoenix, AZ Retail Single Tenant 6,527 0.5% As of October 28, 2020 or as otherwise noted; any differences a result of rounding. (1) Based on monthly Contractual Base Rent (“CBR”), which represents the amount owed to the Company under the terms of its lease agreements in each respective month. (2) Outparcel to Crossroads Towne Center in Phoenix, AZ. (2) (2) (2) (2) |
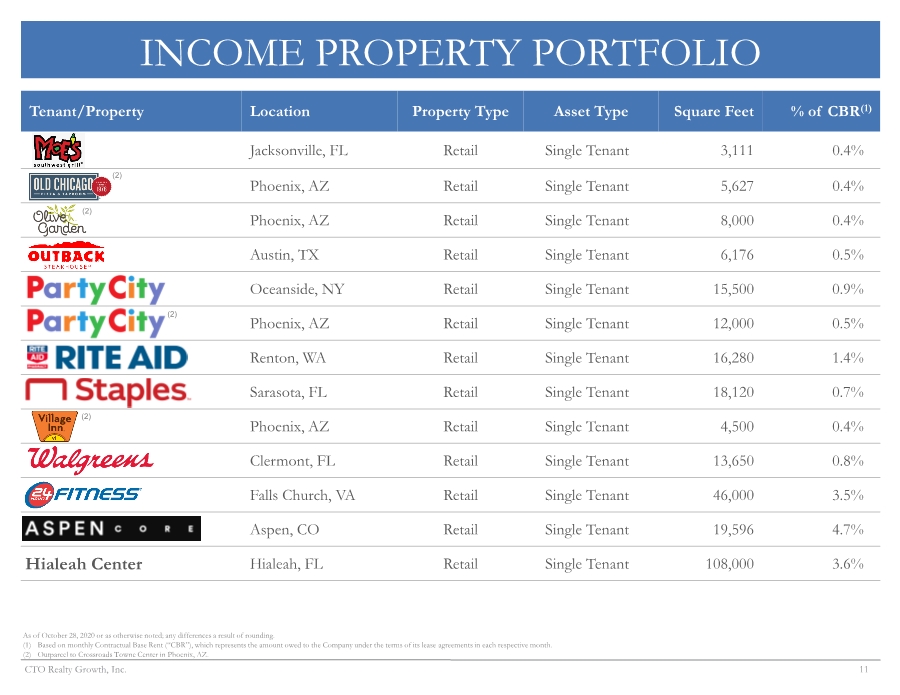
| 11 CTO Realty Growth, Inc. INCOME PROPERTY PORTFOLIO Tenant/Property Location Property Type Asset Type Square Feet % of CBR(1) Jacksonville, FL Retail Single Tenant 3,111 0.4% Phoenix, AZ Retail Single Tenant 5,627 0.4% Phoenix, AZ Retail Single Tenant 8,000 0.4% Austin, TX Retail Single Tenant 6,176 0.5% Oceanside, NY Retail Single Tenant 15,500 0.9% Phoenix, AZ Retail Single Tenant 12,000 0.5% Renton, WA Retail Single Tenant 16,280 1.4% Sarasota, FL Retail Single Tenant 18,120 0.7% Phoenix, AZ Retail Single Tenant 4,500 0.4% Clermont, FL Retail Single Tenant 13,650 0.8% Falls Church, VA Retail Single Tenant 46,000 3.5% Aspen, CO Retail Single Tenant 19,596 4.7% Hialeah Center Hialeah, FL Retail Single Tenant 108,000 3.6% As of October 28, 2020 or as otherwise noted; any differences a result of rounding. (1) Based on monthly Contractual Base Rent (“CBR”), which represents the amount owed to the Company under the terms of its lease agreements in each respective month. (2) Outparcel to Crossroads Towne Center in Phoenix, AZ. (2) (2) (2) (2) |
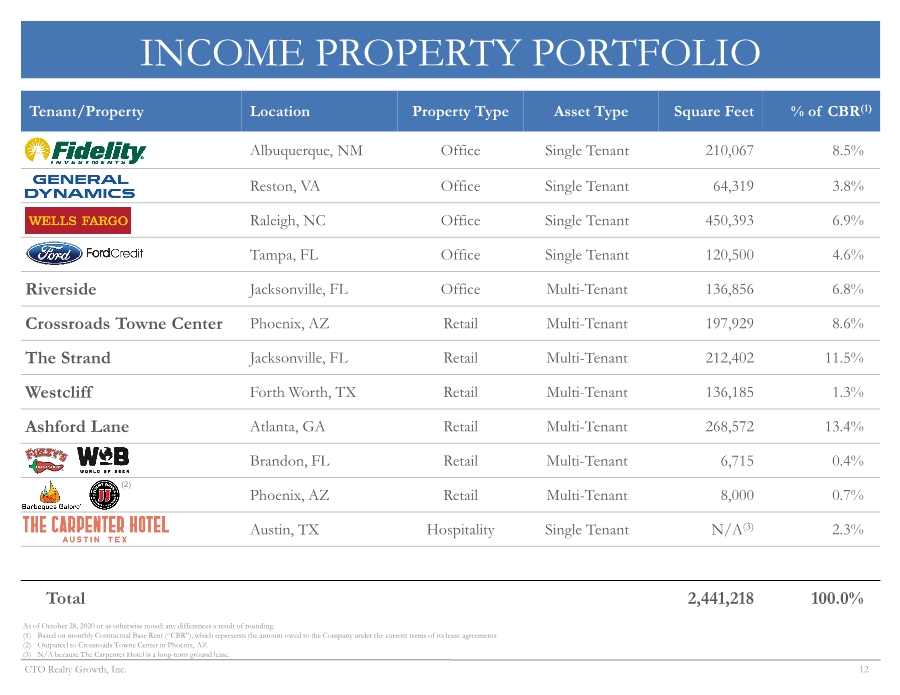
| 12 CTO Realty Growth, Inc. INCOME PROPERTY PORTFOLIO Tenant/Property Location Property Type Asset Type Square Feet % of CBR(1) Albuquerque, NM Office Single Tenant 210,067 8.5% Reston, VA Office Single Tenant 64,319 3.8% Raleigh, NC Office Single Tenant 450,393 6.9% Tampa, FL Office Single Tenant 120,500 4.6% Riverside Jacksonville, FL Office Multi-Tenant 136,856 6.8% Crossroads Towne Center Phoenix, AZ Retail Multi-Tenant 197,929 8.6% The Strand Jacksonville, FL Retail Multi-Tenant 212,402 11.5% Westcliff Forth Worth, TX Retail Multi-Tenant 136,185 1.3% Ashford Lane Atlanta, GA Retail Multi-Tenant 268,572 13.4% Brandon, FL Retail Multi-Tenant 6,715 0.4% Phoenix, AZ Retail Multi-Tenant 8,000 0.7% Austin, TX Hospitality Single Tenant N/A(3) 2.3% Total 2,441,218 100.0% As of October 28, 2020 or as otherwise noted; any differences a result of rounding. (1) Based on monthly Contractual Base Rent (“CBR”), which represents the amount owed to the Company under the current terms of its lease agreements (2) Outparcel to Crossroads Towne Center in Phoenix, AZ. (3) N/A because The Carpenter Hotel is a long-term ground lease. (2) |
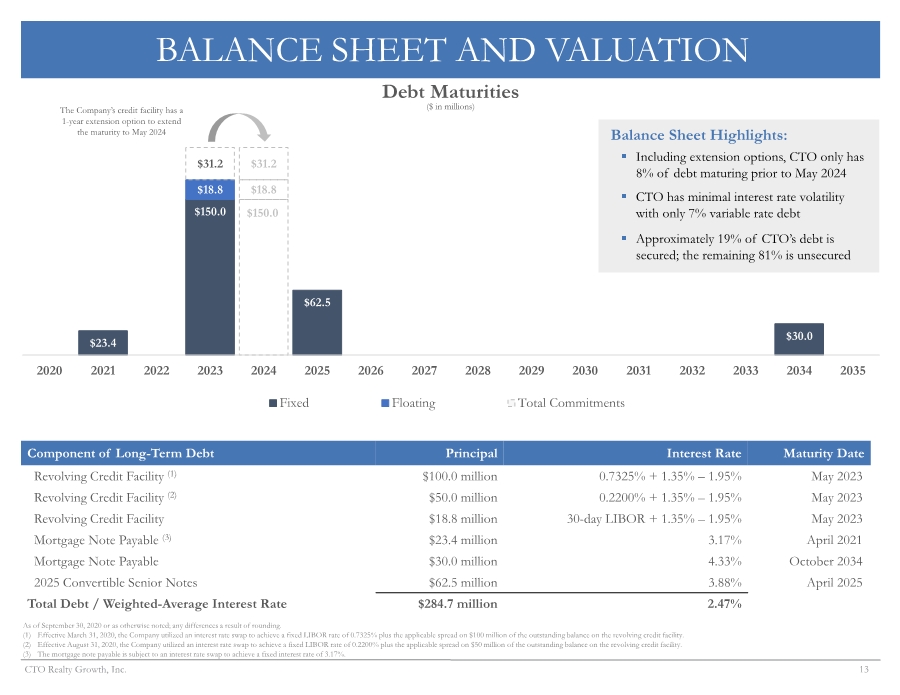
| 13 CTO Realty Growth, Inc. $23.4 $150.0 $150.0 $62.5 $30.0 $18.8 $18.8 $31.2 $31.2 2020 2021 2022 2023 2024 2025 2026 2027 2028 2029 2030 2031 2032 2033 2034 2035 Fixed Floating Total Commitments BALANCE SHEET AND VALUATION Debt Maturities ($ in millions) As of September 30, 2020 or as otherwise noted; any differences a result of rounding. (1) Effective March 31, 2020, the Company utilized an interest rate swap to achieve a fixed LIBOR rate of 0.7325% plus the applicable spread on $100 million of the outstanding balance on the revolving credit facility. (2) Effective August 31, 2020, the Company utilized an interest rate swap to achieve a fixed LIBOR rate of 0.2200% plus the applicable spread on $50 million of the outstanding balance on the revolving credit facility. (3) The mortgage note payable is subject to an interest rate swap to achieve a fixed interest rate of 3.17%. The Company’s credit facility has a 1-year extension option to extend the maturity to May 2024 Balance Sheet Highlights: ▪ Including extension options, CTO only has 8% of debt maturing prior to May 2024 ▪ CTO has minimal interest rate volatility with only 7% variable rate debt ▪ Approximately 19% of CTO’s debt is secured; the remaining 81% is unsecured Component of Long-Term Debt Principal Interest Rate Maturity Date Revolving Credit Facility (1) $100.0 million 0.7325% + 1.35% – 1.95% May 2023 Revolving Credit Facility (2) $50.0 million 0.2200% + 1.35% – 1.95% May 2023 Revolving Credit Facility $18.8 million 30-day LIBOR + 1.35% – 1.95% May 2023 Mortgage Note Payable (3) $23.4 million 3.17% April 2021 Mortgage Note Payable $30.0 million 4.33% October 2034 2025 Convertible Senior Notes $62.5 million 3.88% April 2025 Total Debt / Weighted-Average Interest Rate $284.7 million 2.47% |
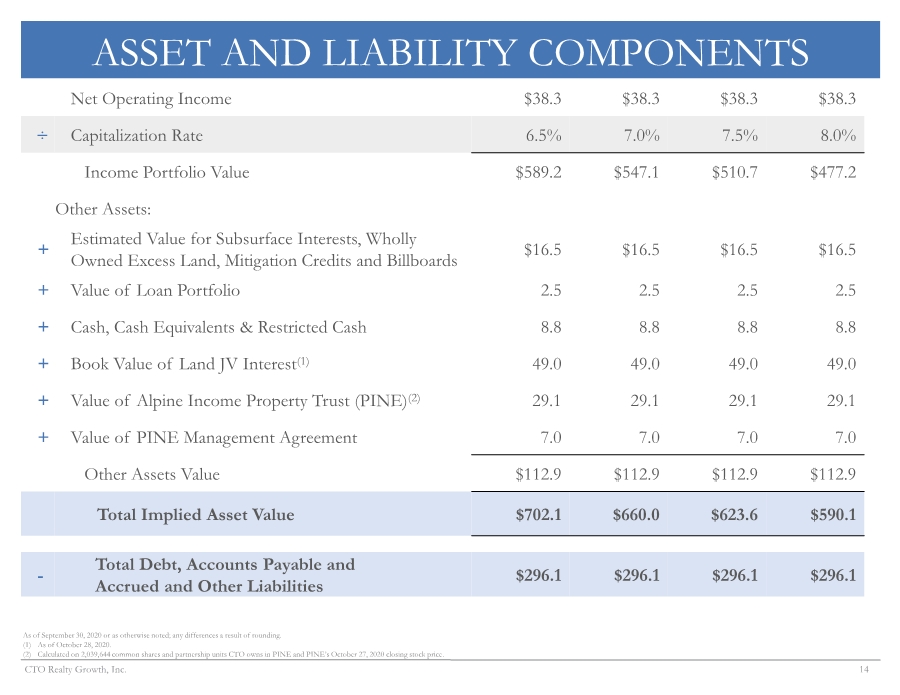
| 14 CTO Realty Growth, Inc. ASSET AND LIABILITY COMPONENTS Net Operating Income $38.3 $38.3 $38.3 $38.3 ÷ Capitalization Rate 6.5% 7.0% 7.5% 8.0% Income Portfolio Value $589.2 $547.1 $510.7 $477.2 Other Assets: + Estimated Value for Subsurface Interests, Wholly Owned Excess Land, Mitigation Credits and Billboards $16.5 $16.5 $16.5 $16.5 + Value of Loan Portfolio 2.5 2.5 2.5 2.5 + Cash, Cash Equivalents & Restricted Cash 8.8 8.8 8.8 8.8 + Book Value of Land JV Interest(1) 49.0 49.0 49.0 49.0 + Value of Alpine Income Property Trust (PINE)(2) 29.1 29.1 29.1 29.1 + Value of PINE Management Agreement 7.0 7.0 7.0 7.0 Other Assets Value $112.9 $112.9 $112.9 $112.9 Total Implied Asset Value $702.1 $660.0 $623.6 $590.1 - Total Debt, Accounts Payable and Accrued and Other Liabilities $296.1 $296.1 $296.1 $296.1 As of September 30, 2020 or as otherwise noted; any differences a result of rounding. (1) As of October 28, 2020. (2) Calculated on 2,039,644 common shares and partnership units CTO owns in PINE and PINE’s October 27, 2020 closing stock price. |
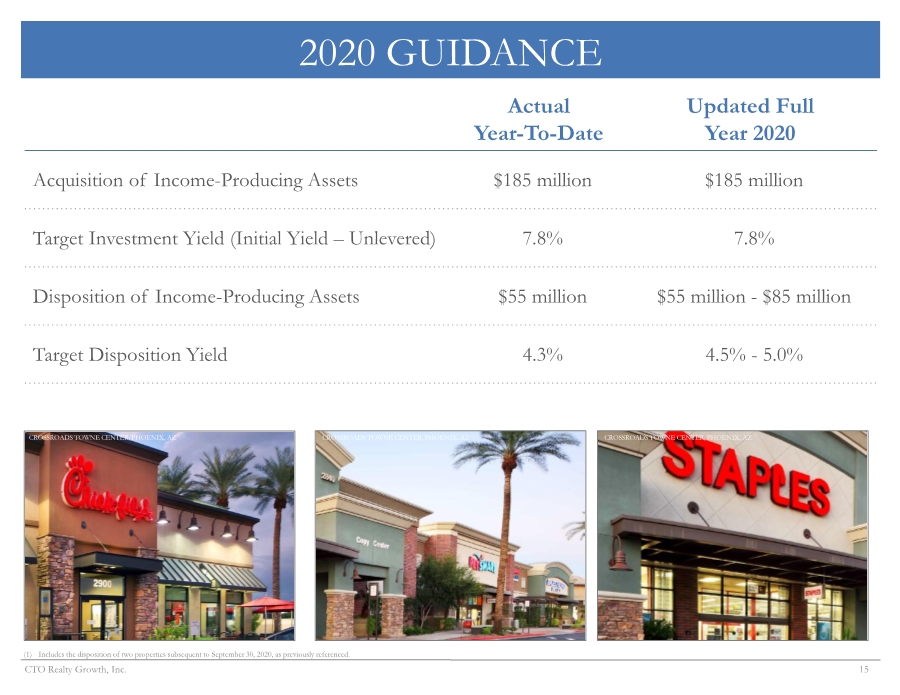
| 15 CTO Realty Growth, Inc. 2020 GUIDANCE Actual Year-To-Date Updated Full Year 2020 Acquisition of Income-Producing Assets $185 million $185 million Target Investment Yield (Initial Yield – Unlevered) 7.8% 7.8% Disposition of Income-Producing Assets $55 million $55 million - $85 million Target Disposition Yield 4.3% 4.5% - 5.0% CROSSROADS TOWNE CENTER, PHOENIX, AZ CROSSROADS TOWNE CENTER, PHOENIX, AZ CROSSROADS TOWNE CENTER, PHOENIX, AZ (1) Includes the disposition of two properties subsequent to September 30, 2020, as previously referenced. |
| 16 CTO Realty Growth, Inc. REALTY GROWTH OCTOBER 2020 |
