Attached files
| file | filename |
|---|---|
| EX-99.1 - EXHIBIT 99.1 - ALLIANCE DATA SYSTEMS CORP | exhibit_99-1.htm |
| 8-K - FORM 8-K - ALLIANCE DATA SYSTEMS CORP | form_8k.htm |
Exhibit 99.2
Alliance Data Third Quarter 2020 ResultsOctober 29, 2020Ralph Andretta – President & CEOTim King –
EVP & CFO
Forward-Looking StatementsThis presentation contains forward-looking statements within the meaning of
Section 27A of the Securities Act of 1933 and Section 21E of the Securities Exchange Act of 1934. Forward-looking statements give our expectations or forecasts of future events and can generally be identified by the use of words such as
“believe,” “expect,” “anticipate,” “estimate,” “intend,” “project,” “plan,” “likely,” “may,” “should” or other words or phrases of similar import. Similarly, statements that describe our business strategy, outlook, objectives, plans, intentions
or goals also are forward-looking statements. Examples of forward-looking statements include, but are not limited to, statements we make regarding, and the guidance we give with respect to, our anticipated operating or financial results,
initiation or completion of strategic initiatives, future dividend declarations, and future economic conditions, including, but not limited to, fluctuation in currency exchange rates, market conditions and COVID-19 impacts related to relief
measures for impacted borrowers and depositors, labor shortages due to quarantine, reduction in demand from clients, supply chain disruption for our reward suppliers and disruptions in the airline or travel industries.We believe that our
expectations are based on reasonable assumptions. Forward-looking statements, however, are subject to a number of risks and uncertainties that could cause actual results to differ materially from the projections, anticipated results or other
expectations expressed in this presentation, and no assurances can be given that our expectations will prove to have been correct. These risks and uncertainties include, but are not limited to, factors set forth in the Risk Factors section in
our Annual Report on Form 10-K for the most recently ended fiscal year, which may be updated in Item 1A of, or elsewhere in, our Quarterly Reports on Form 10-Q filed for periods subsequent to such Form 10-K. Our forward-looking statements speak
only as of the date made, and we undertake no obligation, other than as required by applicable law, to update or revise any forward-looking statements, whether as a result of new information, subsequent events, anticipated or unanticipated
circumstances or otherwise.
Key Highlights Strong financial results across key metricsContinued progress on strategic
prioritiesInvestment in initiatives to drive long-term growth 3
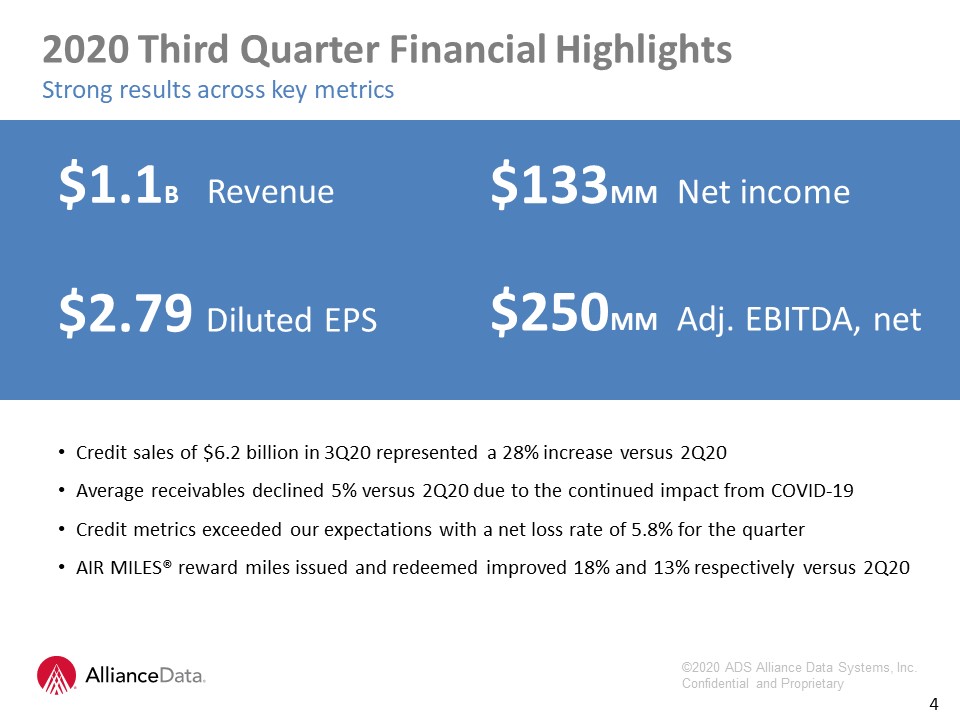
$2.79 Diluted EPS $1.1B Revenue $133MM Net income Credit sales of $6.2 billion in 3Q20 represented a
28% increase versus 2Q20 Average receivables declined 5% versus 2Q20 due to the continued impact from COVID-19Credit metrics exceeded our expectations with a net loss rate of 5.8% for the quarterAIR MILES® reward miles issued and redeemed
improved 18% and 13% respectively versus 2Q20 4 2020 Third Quarter Financial HighlightsStrong results across key metrics $250MM Adj. EBITDA, net
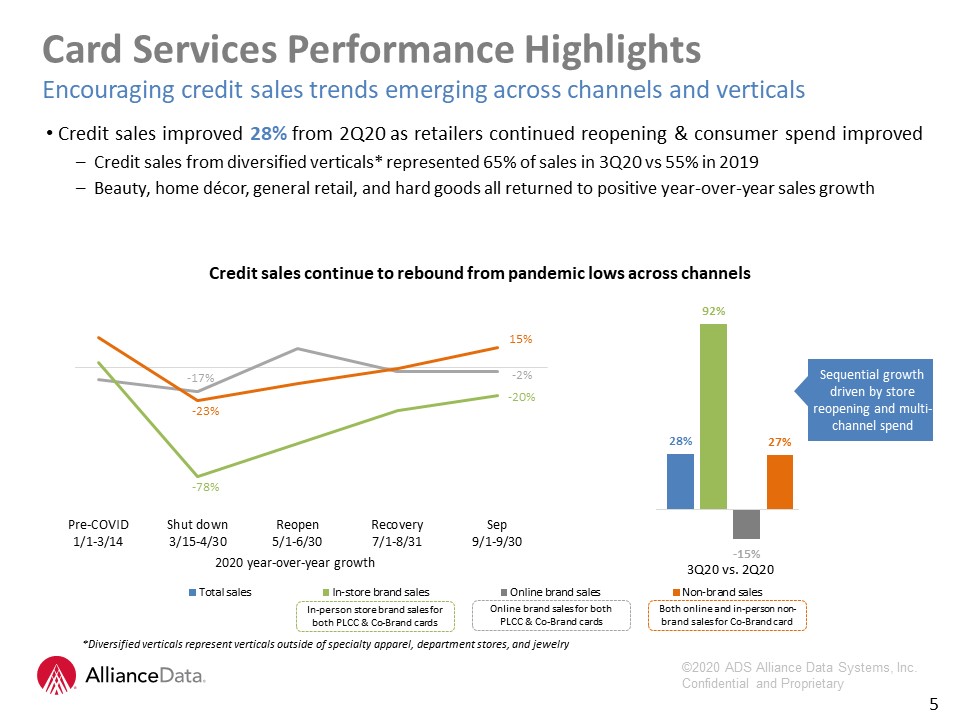
Credit sales improved 28% from 2Q20 as retailers continued reopening & consumer spend improvedCredit
sales from diversified verticals* represented 65% of sales in 3Q20 vs 55% in 2019Beauty, home décor, general retail, and hard goods all returned to positive year-over-year sales growth Card Services Performance HighlightsEncouraging credit
sales trends emerging across channels and verticals 5 Credit sales continue to rebound from pandemic lows across channels *Diversified verticals represent verticals outside of specialty apparel, department stores, and
jewelry Sequential growth driven by store reopening and multi-channel spend 2020 year-over-year growth Online brand sales for both PLCC & Co-Brand cards Both online and in-person non-brand sales for Co-Brand card In-person
store brand sales forboth PLCC & Co-Brand cards

Renewal of key partner relationships including:GameStop, the world’s largest video game, consumer
electronics and collectibles retailerBealls Outlet/Burkes Outlet, a regional off-price retailer with more than 500 locations Card Services Performance HighlightsFocus on driving sustained, profitable growth 6 Partner Renewals New Vertical
Growth Customer Expansion Market leader in fast-growing specialty retail verticals, including beauty ($530B industry / 7% CAGR)Launched two new partnerships:Sally Beauty, the largest distributor of professional beauty supplies in the U.SSalon
Centric (part of L'Oréal), one of the largest distributors of professional salon and beauty supplies in the U.S.Alliance Data now manages the Top 4 programs in the U.S. beauty industry Strategically offering the new Comenity bankcard to select
customers for expanded customer utilityCash back rewards and category accelerators that drove higher than expected response ratesStrong millennial engagement with highest sales/activeEarly metrics suggest strong credit performance
trendsOpportunity to grow via new acquisition and retention strategies Digital and mobile engagement and servicing Integrated real-time prescreen and expanded loyalty program
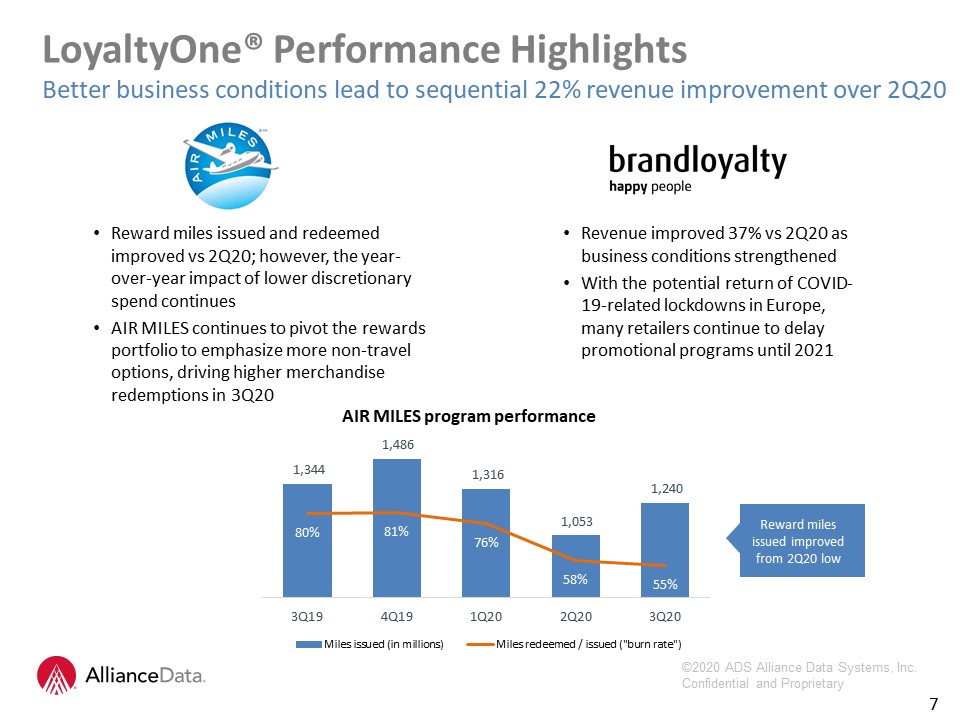
LoyaltyOne® Performance HighlightsBetter business conditions lead to sequential 22% revenue improvement
over 2Q20 Reward miles issued and redeemed improved vs 2Q20; however, the year-over-year impact of lower discretionary spend continuesAIR MILES continues to pivot the rewards portfolio to emphasize more non-travel options, driving higher
merchandise redemptions in 3Q20 7 AIR MILES program performance Revenue improved 37% vs 2Q20 as business conditions strengthenedWith the potential return of COVID-19-related lockdowns in Europe, many retailers continue to delay promotional
programs until 2021 Reward miles issued improved from 2Q20 low
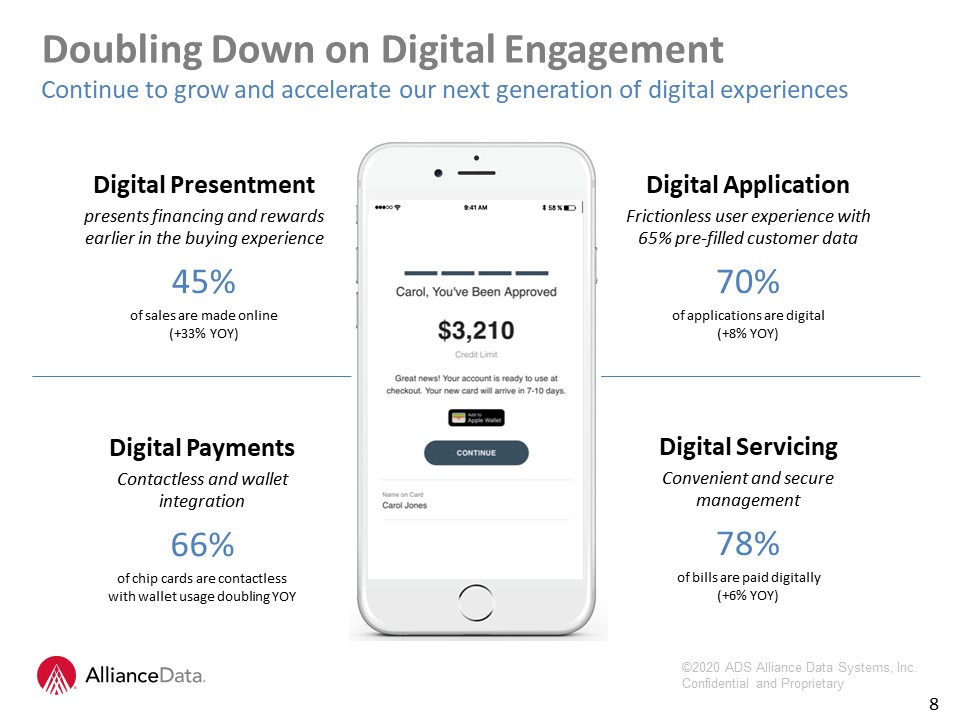
Doubling Down on Digital EngagementContinue to grow and accelerate our next generation of digital
experiences 8 Digital ServicingConvenient and secure management78% of bills are paid digitally (+6% YOY) Digital Presentmentpresents financing and rewards earlier in the buying experience45% of sales are made online (+33% YOY) Digital
ApplicationFrictionless user experience with 65% pre-filled customer data70%of applications are digital (+8% YOY) Digital PaymentsContactless and wallet integration66% of chip cards are contactless with wallet usage doubling YOY
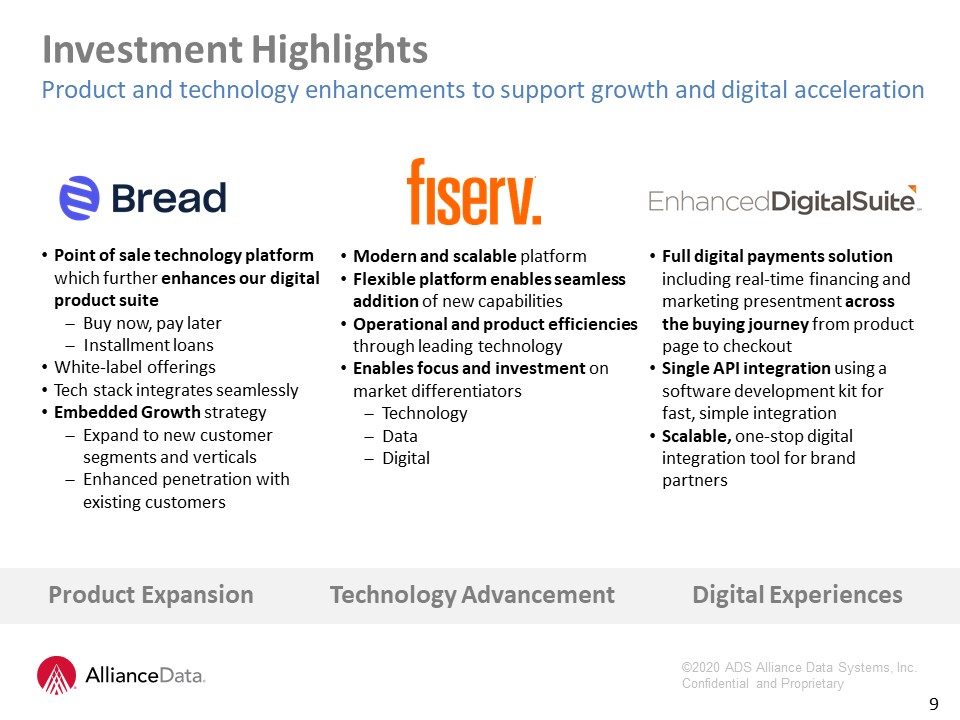
Modern and scalable platformFlexible platform enables seamless addition of new capabilitiesOperational
and product efficiencies through leading technologyEnables focus and investment on market differentiatorsTechnologyDataDigital Investment HighlightsProduct and technology enhancements to support growth and digital acceleration 9 Point of
sale technology platform which further enhances our digital product suiteBuy now, pay laterInstallment loansWhite-label offeringsTech stack integrates seamlesslyEmbedded Growth strategyExpand to new customer segments and verticals Enhanced
penetration with existing customers Full digital payments solution including real-time financing and marketing presentment across the buying journey from product page to checkoutSingle API integration using a software development kit for fast,
simple integrationScalable, one-stop digital integration tool for brand partners Technology Advancement Digital Experiences Product Expansion
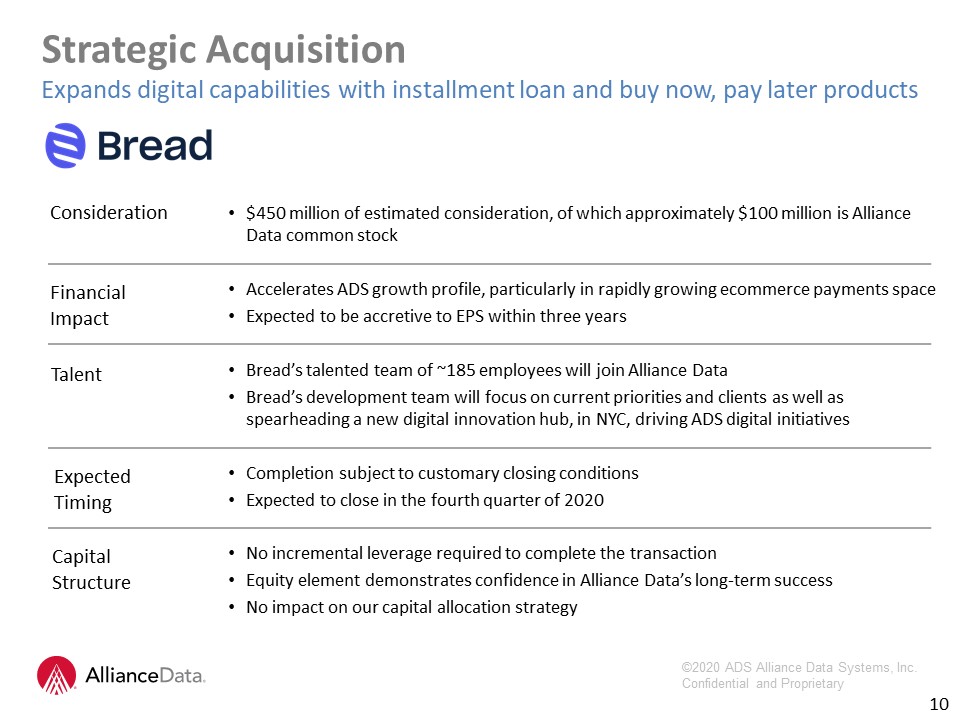
10 $450 million of estimated consideration, of which approximately $100 million is Alliance Data common
stockAccelerates ADS growth profile, particularly in rapidly growing ecommerce payments spaceExpected to be accretive to EPS within three yearsBread’s talented team of ~185 employees will join Alliance DataBread’s development team will focus on
current priorities and clients as well as spearheading a new digital innovation hub, in NYC, driving ADS digital initiatives Completion subject to customary closing conditionsExpected to close in the fourth quarter of 2020No incremental
leverage required to complete the transactionEquity element demonstrates confidence in Alliance Data’s long-term success No impact on our capital allocation
strategy Consideration FinancialImpact Talent ExpectedTiming CapitalStructure Strategic Acquisition Expands digital capabilities with installment loan and buy now, pay later products
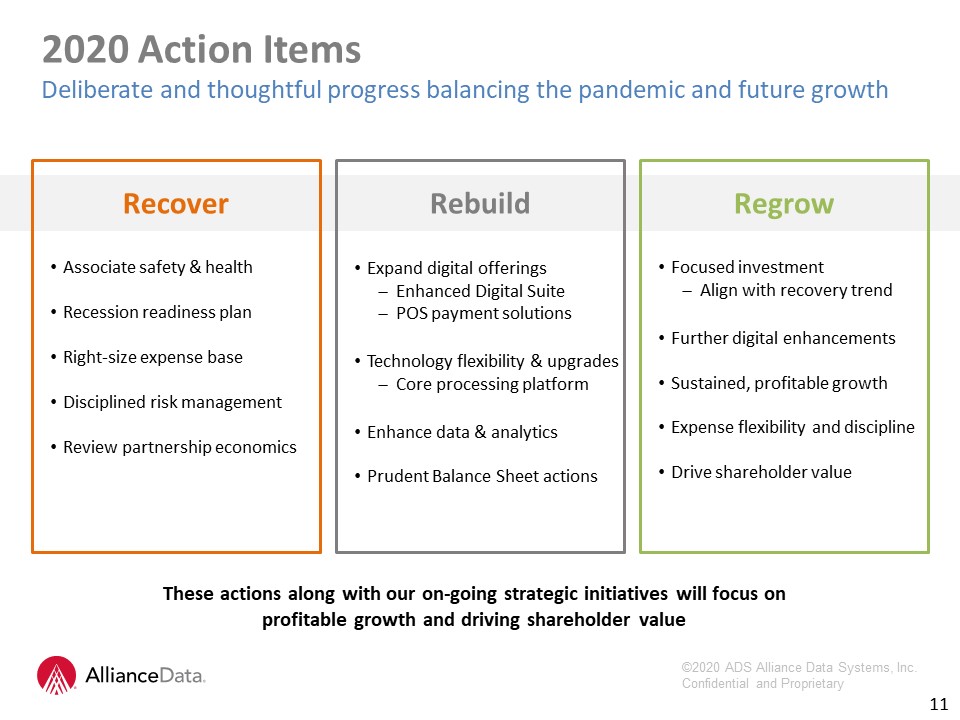
Expand digital offeringsEnhanced Digital SuitePOS payment solutionsTechnology flexibility &
upgradesCore processing platformEnhance data & analyticsPrudent Balance Sheet actions Associate safety & healthRecession readiness planRight-size expense baseDisciplined risk management Review partnership economics 11 2020 Action
ItemsDeliberate and thoughtful progress balancing the pandemic and future growth Rebuild Recover These actions along with our on-going strategic initiatives will focus on profitable growth and driving shareholder value Focused
investmentAlign with recovery trendFurther digital enhancementsSustained, profitable growthExpense flexibility and disciplineDrive shareholder value Regrow
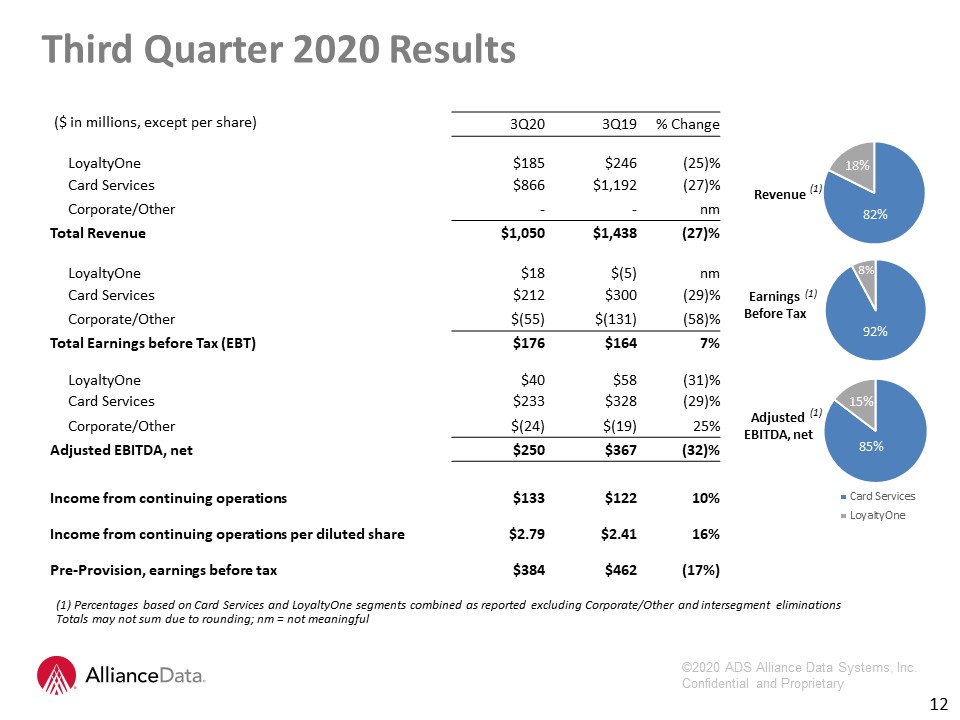
Totals may not sum due to rounding; nm = not meaningful Third Quarter 2020 Results Revenue Adjusted
EBITDA, net Earnings Before Tax 12 (1) Percentages based on Card Services and LoyaltyOne segments combined as reported excluding Corporate/Other and intersegment eliminations ($ in millions, except per share) 3Q20 3Q19 % Change
LoyaltyOne $185 $246 (25)% Card Services $866 $1,192 (27)% Corporate/Other - - nm Total Revenue $1,050 $1,438 (27)% LoyaltyOne $18 $(5) nm Card Services $212 $300 (29)% Corporate/Other $(55) $(131) (58)% Total
Earnings before Tax (EBT) $176 $164 7% LoyaltyOne $40 $58 (31)% Card Services $233 $328 (29)% Corporate/Other $(24) $(19) 25% Adjusted EBITDA, net $250 $367 (32)% Income from continuing
operations $133 $122 10% Income from continuing operations per diluted share $2.79 $2.41 16% Pre-Provision, earnings before tax $384 $462 (17%) 8% (1) (1) (1)
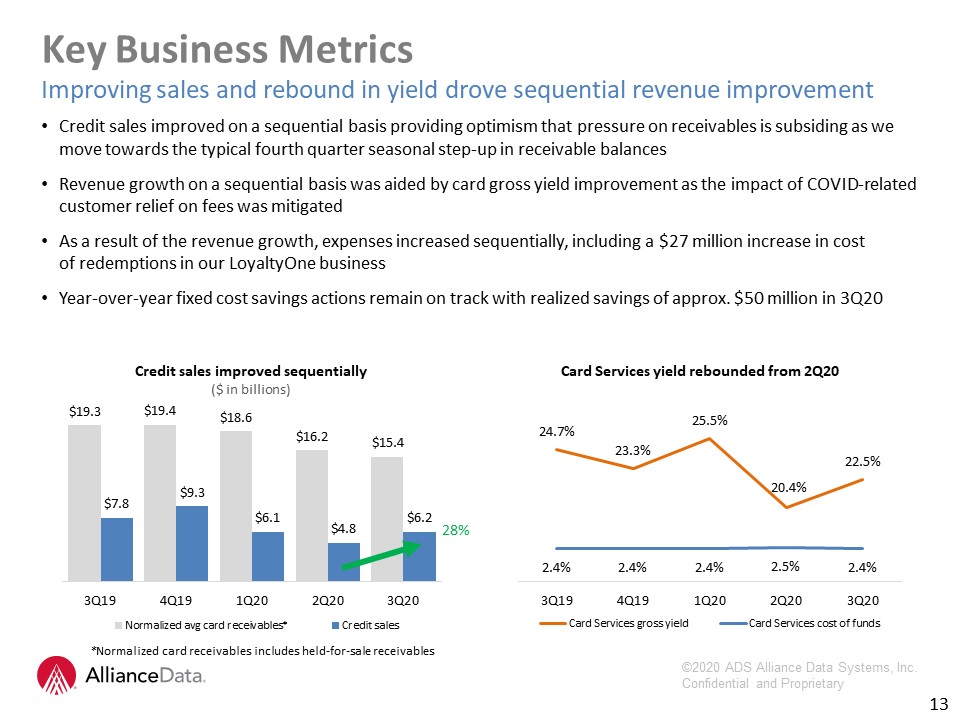
13 Key Business MetricsImproving sales and rebound in yield drove sequential revenue improvement Credit
sales improved on a sequential basis providing optimism that pressure on receivables is subsiding as we move towards the typical fourth quarter seasonal step-up in receivable balances Revenue growth on a sequential basis was aided by card gross
yield improvement as the impact of COVID-related customer relief on fees was mitigatedAs a result of the revenue growth, expenses increased sequentially, including a $27 million increase in cost of redemptions in our LoyaltyOne
businessYear-over-year fixed cost savings actions remain on track with realized savings of approx. $50 million in 3Q20 *Normalized card receivables includes held-for-sale receivables Card Services yield rebounded from 2Q20 Credit sales
improved sequentially($ in billions) 28%
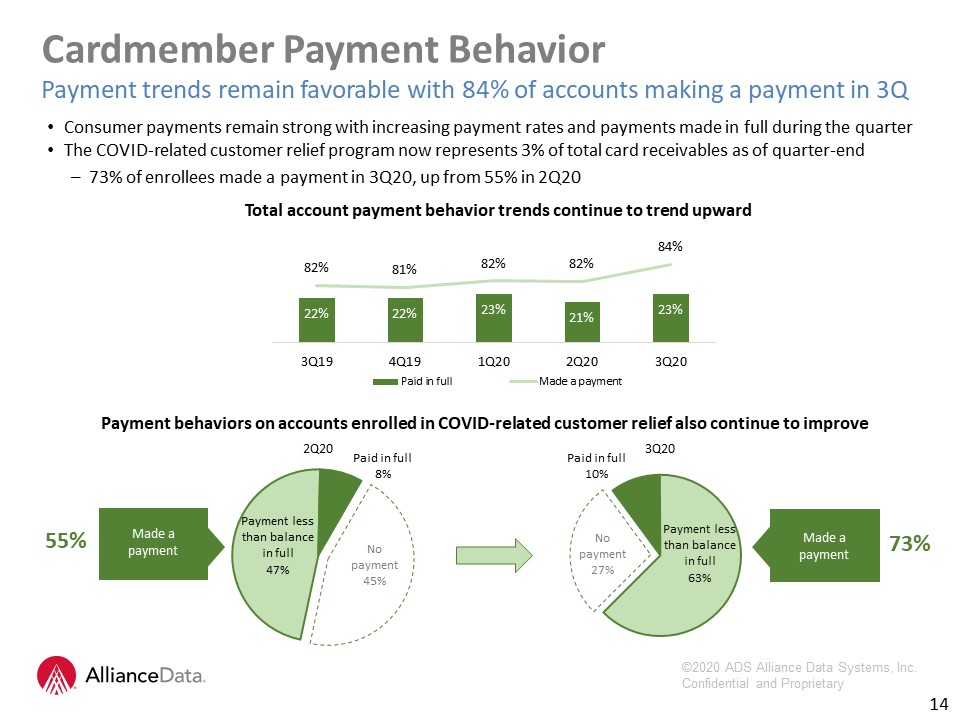
Consumer payments remain strong with increasing payment rates and payments made in full during the
quarterThe COVID-related customer relief program now represents 3% of total card receivables as of quarter-end73% of enrollees made a payment in 3Q20, up from 55% in 2Q20 Total account payment behavior trends continue to trend
upward Cardmember Payment BehaviorPayment trends remain favorable with 84% of accounts making a payment in 3Q 14 2Q20 Payment behaviors on accounts enrolled in COVID-related customer relief also continue to improve 3Q20 55% Made a
payment 73% Made a payment
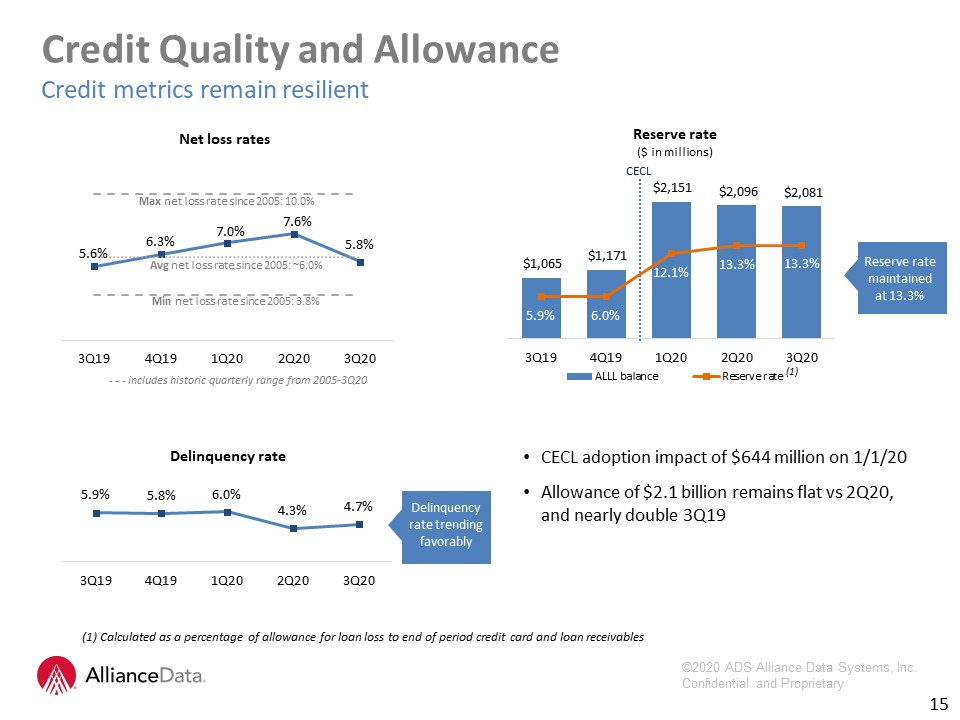
CECL adoption impact of $644 million on 1/1/20Allowance of $2.1 billion remains flat vs 2Q20, and
nearly double 3Q19 CECL 15 Credit Quality and AllowanceCredit metrics remain resilient Max net loss rate since 2005: 10.0% Min net loss rate since 2005: 3.8% Avg net loss rate since 2005: ~6.0% Delinquency rate Net loss rates Reserve
rate ($ in millions) (1) Calculated as a percentage of allowance for loan loss to end of period credit card and loan receivables (1) Delinquency rate trending favorably - - - includes historic quarterly range from 2005-3Q20 Reserve
rate maintained at 13.3%
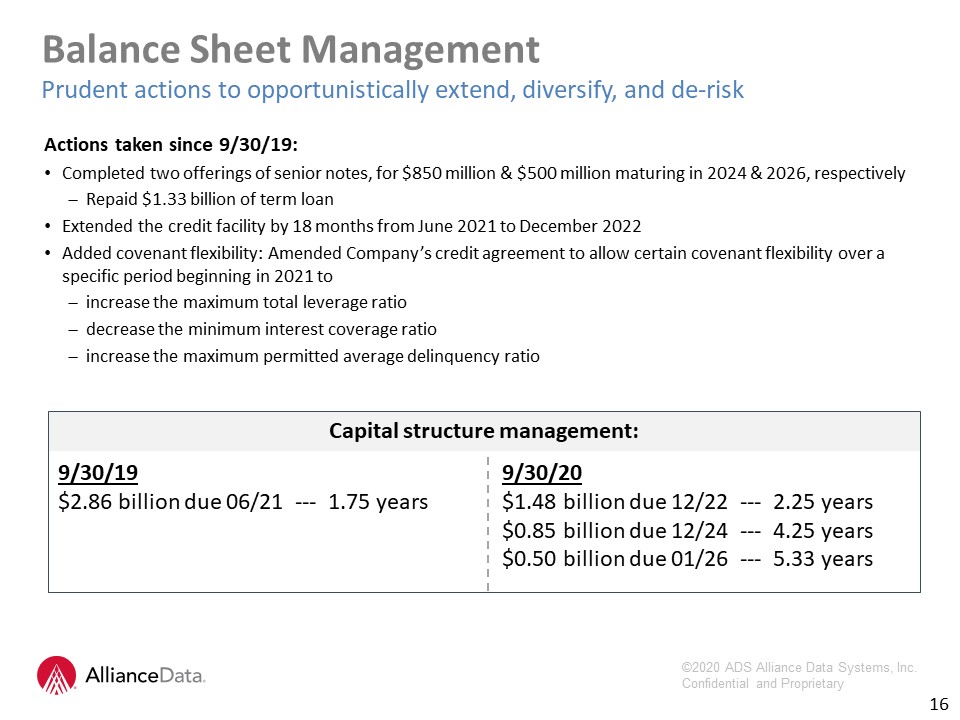
Actions taken since 9/30/19:Completed two offerings of senior notes, for $850 million & $500
million maturing in 2024 & 2026, respectivelyRepaid $1.33 billion of term loanExtended the credit facility by 18 months from June 2021 to December 2022Added covenant flexibility: Amended Company’s credit agreement to allow certain covenant
flexibility over a specific period beginning in 2021 toincrease the maximum total leverage ratiodecrease the minimum interest coverage ratioincrease the maximum permitted average delinquency ratio 16 Balance Sheet ManagementPrudent actions to
opportunistically extend, diversify, and de-risk Capital structure management:9/30/19 9/30/20$2.86 billion due 06/21 --- 1.75 years $1.48 billion due 12/22 --- 2.25 years $0.85 billion due 12/24 --- 4.25 years $0.50 billion due 01/26 --- 5.33
years

Parent Level Liquidity at 9/30 of $1.2 billion, consisting of cash on hand plus revolver capacity
Approximately $430 million in cash and cash equivalents, $750 million in unused revolverFully paid down revolver in the third quarter 2020The next debt maturity in December 2022 is out more than two yearsBank LevelBanks finished the quarter
with $2.7 billion in cash and $2.6 billion in equityTotal Risk Based Capital Ratio at 20.1% - double the 10% threshold to be considered well-capitalized; CET1 at 18.8%Funding readily availableHeavy demand for FDIC-insured deposit products –
both direct-to-consumer and brokeredRetail deposits have tripled as a percentage of our funding since 2Q19Renewed all three conduits with $3.2 billion of conduit capacity through either April or October 2022 17 Capital and Liquidity
UpdateSufficient corporate liquidity; Banks remain well-capitalized
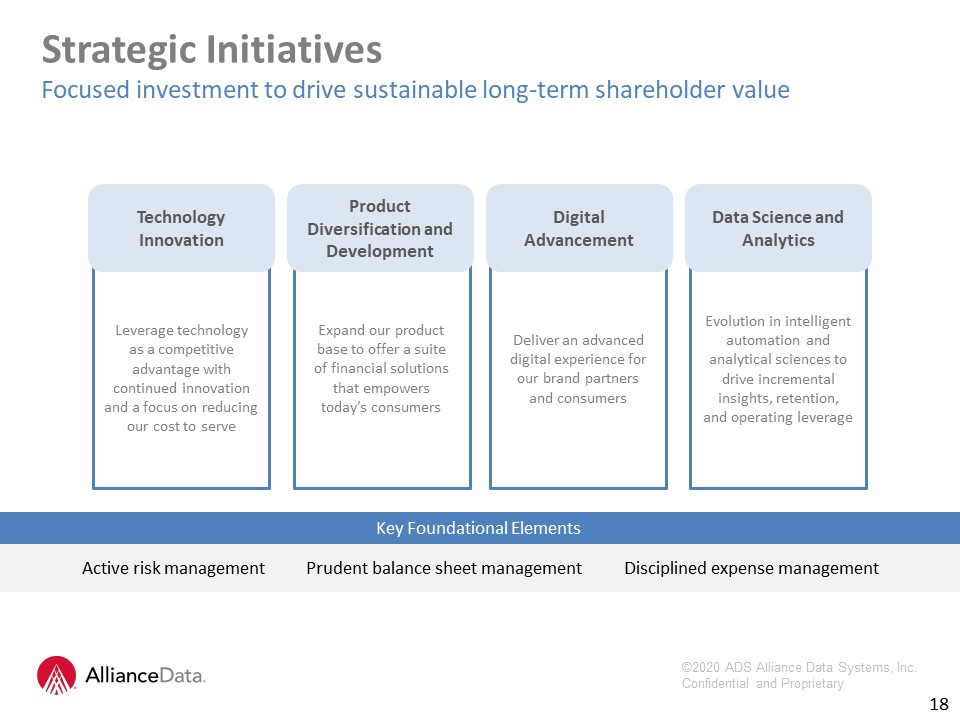
18 Leverage technology as a competitive advantage with continued innovation and a focus on reducing our
cost to serve TechnologyInnovation Expand our product base to offer a suite of financial solutions that empowers today’s consumers Product Diversification and Development Deliver an advanced digital experience for our brand partners and
consumers DigitalAdvancement Evolution in intelligent automation and analytical sciences to drive incremental insights, retention, and operating leverage Data Science and Analytics Strategic InitiativesFocused investment to drive
sustainable long-term shareholder value Active risk management Prudent balance sheet management Disciplined expense management Key Foundational Elements
Questions & Answers

Financial MeasuresIn addition to the results presented in accordance with generally accepted accounting
principles, or GAAP, the Company may present financial measures that are non-GAAP measures, such as constant currency financial measures, pre-provision earnings before taxes, adjusted EBITDA, adjusted EBITDA margin, adjusted EBITDA, net of
funding costs, core earnings and core earnings per diluted share (core EPS). Constant currency excludes the impact of fluctuations in foreign exchange rates. The Company calculates constant currency by converting our current period local
currency financial results using the prior period exchange rates. The Company uses adjusted EBITDA and adjusted EBITDA, net as an integral part of internal reporting to measure the performance and operational strength of reportable segments and
to evaluate the performance of senior management. Adjusted EBITDA eliminates the uneven effect across all reportable segments of non-cash depreciation of tangible assets and amortization of intangible assets, including certain intangible assets
that were recognized in business combinations, and the non-cash effect of stock compensation expense. In addition, adjusted EBITDA eliminates the effect of the gain (loss) on the sale of a business, strategic transaction costs, asset
impairments, restructuring and other charges, and the loss on extinguishment of debt. Adjusted EBITDA, net is equal to adjusted EBITDA less securitization funding costs and interest expense on deposits. Similarly, core earnings and core EPS
eliminate non-cash or non-operating items, including, but not limited to, stock compensation expense, amortization of purchased intangibles, non-cash interest, gain (loss) on the sale of a business, strategic transaction costs, asset
impairments, restructuring and other charges, and the loss on extinguishment of debt. The Company believes that these non-GAAP financial measures, viewed in addition to and not in lieu of the Company’s reported GAAP results, provide useful
information to investors regarding the Company’s performance and overall results of operations. 20

Appendix 21
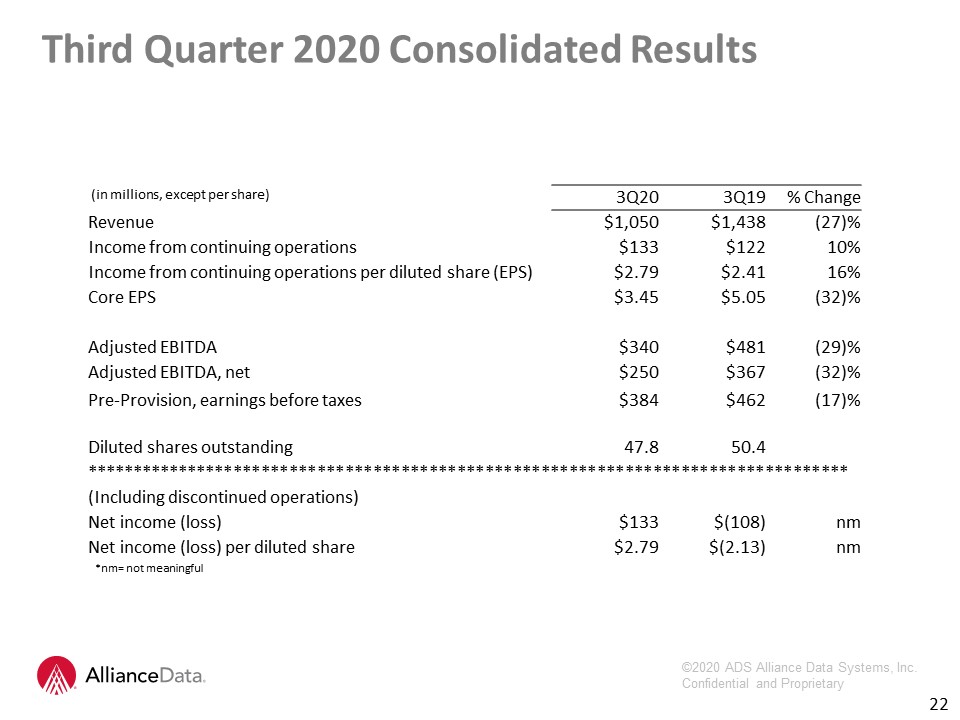
(in millions, except per share) 3Q20 3Q19 % Change Revenue $1,050 $1,438 (27)% Income
from continuing operations $133 $122 10% Income from continuing operations per diluted share (EPS) $2.79 $2.41 16% Core EPS $3.45 $5.05 (32)% Adjusted EBITDA $340 $481 (29)% Adjusted EBITDA,
net $250 $367 (32)% Pre-Provision, earnings before taxes $384 $462 (17)% Diluted shares outstanding 47.8 50.4 ********************************************************************************** (Including
discontinued operations) Net income (loss) $133 $(108) nm Net income (loss) per diluted share $2.79 $(2.13) nm Third Quarter 2020 Consolidated Results 22 *nm= not meaningful
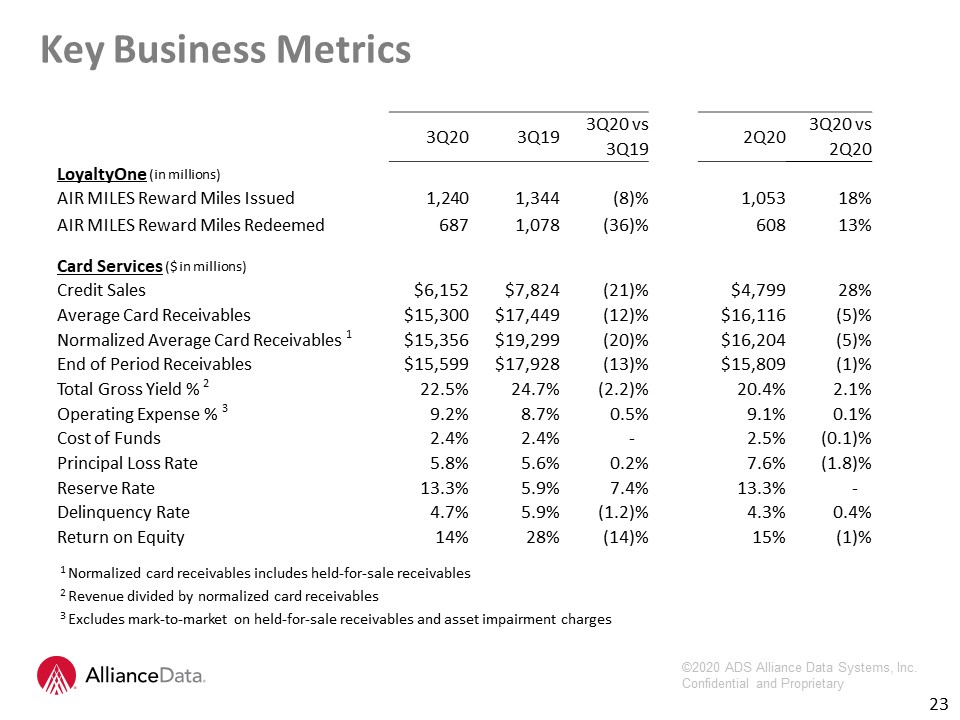
1 Normalized card receivables includes held-for-sale receivables2 Revenue divided by normalized card
receivables3 Excludes mark-to-market on held-for-sale receivables and asset impairment charges 3Q20 3Q19 3Q20 vs 2Q20 3Q20 vs 3Q19 2Q20 LoyaltyOne (in millions) AIR MILES Reward Miles Issued 1,240 1,344
(8)% 1,053 18% AIR MILES Reward Miles Redeemed 687 1,078 (36)% 608 13% Card Services ($ in millions) Credit Sales $6,152 $7,824 (21)% $4,799 28% Average Card
Receivables $15,300 $17,449 (12)% $16,116 (5)% Normalized Average Card Receivables 1 $15,356 $19,299 (20)% $16,204 (5)% End of Period Receivables $15,599 $17,928 (13)% $15,809 (1)% Total Gross Yield %
2 22.5% 24.7% (2.2)% 20.4% 2.1% Operating Expense % 3 9.2% 8.7% 0.5% 9.1% 0.1% Cost of Funds 2.4% 2.4% -% 2.5% (0.1)% Principal Loss Rate 5.8% 5.6% 0.2% 7.6% (1.8)% Reserve
Rate 13.3% 5.9% 7.4% 13.3% -% Delinquency Rate 4.7% 5.9% (1.2)% 4.3% 0.4% Return on Equity 14% 28% (14)% 15% (1)% Key Business Metrics 23
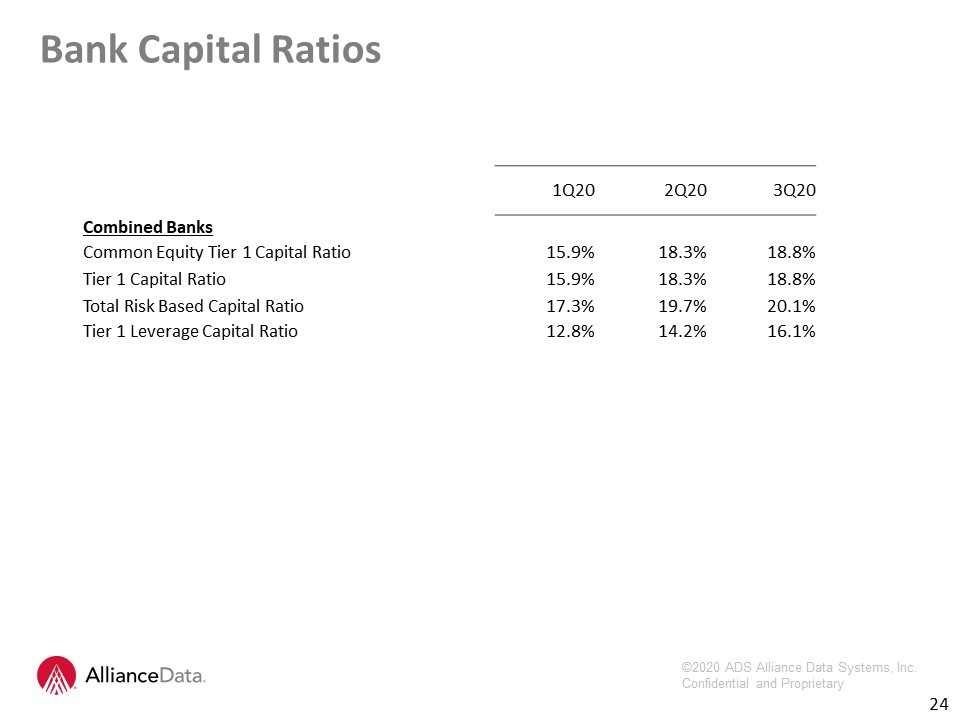
Bank Capital Ratios 24 1Q20 2Q20 3Q20 Combined Banks Common Equity Tier 1 Capital
Ratio 15.9% 18.3% 18.8% Tier 1 Capital Ratio 15.9% 18.3% 18.8% Total Risk Based Capital Ratio 17.3% 19.7% 20.1% Tier 1 Leverage Capital Ratio 12.8% 14.2% 16.1%