Attached files
| file | filename |
|---|---|
| 8-K - 8-K - BRYN MAWR BANK CORP | bmtc-20201022.htm |
Third Quarter 2020 Earnings Review Frank Leto Mike Harrington Liam Brickley President and Chief Financial Officer Chief Credit Officer Chief Executive Officer
Forward Looking Statement This presentation contains statements which, to the extent that they are not recitations of historical fact may constitute forward-looking statements for purposes of the Securities Act of 1933, as amended, and the Securities Exchange Act of 1934, as amended. Such forward-looking statements may include financial and other projections as well as statements regarding the Corporation’s future plans, objectives, performance, revenues, growth, profits, operating expenses or the Bryn Mawr Bank Corporation’s (the “Corporation”) underlying assumptions. The words “may,” “would,” “should,” “could,” “will,” “likely,” “possibly,” “expect,” “anticipate,” “intend,” “indicate,” “estimate,” “target,” “potentially,” “promising,” “probably,” “outlook,” “predict,” “contemplate,” “continue,” “plan,” “forecast,” “project,” “annualized,” “are optimistic,” “are looking,” “are looking forward” and “believe” or other similar words and phrases may identify forward-looking statements. Persons reading this press release are cautioned that such statements are only predictions, and that the Corporation’s actual future results or performance may be materially different. Such forward-looking statements involve known and unknown risks and uncertainties. A number of factors, many of which are beyond the Corporation’s control, could cause our actual results, events or developments, or industry results, to be materially different from any future results, events or developments expressed, implied or anticipated by such forward-looking statements, and so our business and financial condition and results of operations could be materially and adversely affected. The COVID-19 pandemic is adversely affecting us, our customers, counterparties, employees, and third-party service providers, and the ultimate extent of the impacts on our business, financial position, results of operations, liquidity, and prospects is uncertain. Continued deterioration in general business and economic conditions, including further increases in unemployment rates, or turbulence in domestic or global financial markets could adversely affect our revenues and the values of our assets and liabilities, reduce the availability of funding, lead to a tightening of credit, and further increase stock price volatility. In addition, changes to statutes, regulations, or regulatory policies or practices as a result of, or in response to COVID-19, could affect us in substantial and unpredictable ways. Other factors include, among others, our need for capital, our ability to control operating costs and expenses, and to manage loan and lease delinquency rates; the credit risks of lending activities and overall quality of the composition of our loan, lease and securities portfolio; the impact of economic conditions, consumer and business spending habits, and real estate market conditions on our business and in our market area; changes in the levels of general interest rates, deposit interest rates, or net interest margin and funding sources; changes in banking regulations and policies and the possibility that any banking agency approvals we might require for certain activities will not be obtained in a timely manner or at all or will be conditioned in a manner that would impair our ability to implement our business plans; changes in accounting policies and practices or accounting standards, including ASU 2016-13 (Topic 326), “Measurement of Credit Losses on Financial Instruments,” commonly referenced as the Current Expected Credit Loss model, which has changed how we estimate credit losses and may result in further increases in the required level of our allowance for credit losses; unanticipated regulatory or legal proceedings, outcomes of litigation or other contingencies; cybersecurity events; the inability of key third-party providers to perform their obligations to us; our ability to attract and retain key personnel; competition in our marketplace; war or terrorist activities; material differences in the actual financial results, cost savings and revenue enhancements associated with our acquisitions; uncertainty regarding the future of LIBOR; the impact of public health issues and pandemics, and their effects on the economic and business environments in which we operate; the effect of the COVID-19 pandemic, including on our credit quality and business operations, as well as its impact on general economic and financial market conditions; and other factors as described in our securities filings with the U.S. Securities and Exchange Commission (the “SEC”). All forward-looking statements and information set forth herein are based on Corporation management’s current beliefs and assumptions as of the date hereof and speak only as of the date they are made. The Corporation does not undertake to update forward-looking statements. For a complete discussion of the assumptions, risks and uncertainties related to our business, you are encouraged to review our filings with the SEC, including our most recent Annual Report on Form 10-K, as updated by our quarterly or other reports subsequently filed with the SEC. Member FDIC. Equal Housing Lender. Securities, insurance, foreign exchange, and derivatives products are not a deposit, not FDIC insured, not bank guaranteed, not insured by any federal government agency, and may lose value. Statement on Non-GAAP Measures: The Corporation believes the presentation of the following non-GAAP financial measures provides useful supplemental information that is essential to an investor’s proper understanding of the results of operations and financial condition of the Corporation. Management uses non-GAAP financial measures in its analysis of the Corporation’s performance. These non-GAAP measures should not be viewed as substitutes for the financial measures determined in accordance with GAAP, nor are they necessarily comparable to non-GAAP performance measures that may be presented by other companies. 2 3rd Quarter 2020 Earnings Review

Third Quarter 2020 Recap ➢ Reported net income of $13.2 million, or $0.66 diluted earnings per share ➢ Wealth, insurance, and capital market businesses continue to produce solid fee income results ➢ Established 15 client service centers within branch network ➢ Continuing to execute on operational and technological transformation ➢ Tax-equivalent net interest margin contracted 19 basis points from the second quarter of 2020 ➢ Higher average cash balances and decline in loan yields ➢ Total loan deferrals decreased from 21% to 9% of total loans quarter over quarter ➢ Declared dividend of $0.27 per share 3 3rd Quarter 2020 Earnings Review

3rd Quarter 2020 Results Income Statement 3Q20 2Q20 % Change $ in thousands, except share and per share data Net interest income $35,032 $37,385 -6% Provision for credit losses on loans & leases 3,641 4,302 -15% Net interest income after provision 31,391 33,083 -5% Noninterest income 21,099 20,566 3% Total noninterest expense 35,657 34,636 3% Income before income taxes 16,833 19,013 -11% Income tax expense 3,709 4,010 -8% Net income $13,124 $ 15,003 -13% Net loss attributable to noncontrolling interest (40) (32) -25% Net income attributable to Bryn Mawr Bank Corporation $13,164 $15,035 -12% Diluted earnings per common share $0.66 $0.75 Weighted average diluted shares 20,021,617 20,008,219 Financial Metrics Core return on average assets* 1.02% 1.19% Core return on tangible equity* 13.47% 16.23% Efficiency ratio* 61.97% 57.25% Tax-equivalent net interest margin 3.03% 3.22% *Non-GAAP measure, see reconciliation on slides 13-14 4 3rd Quarter 2020 Earnings Review
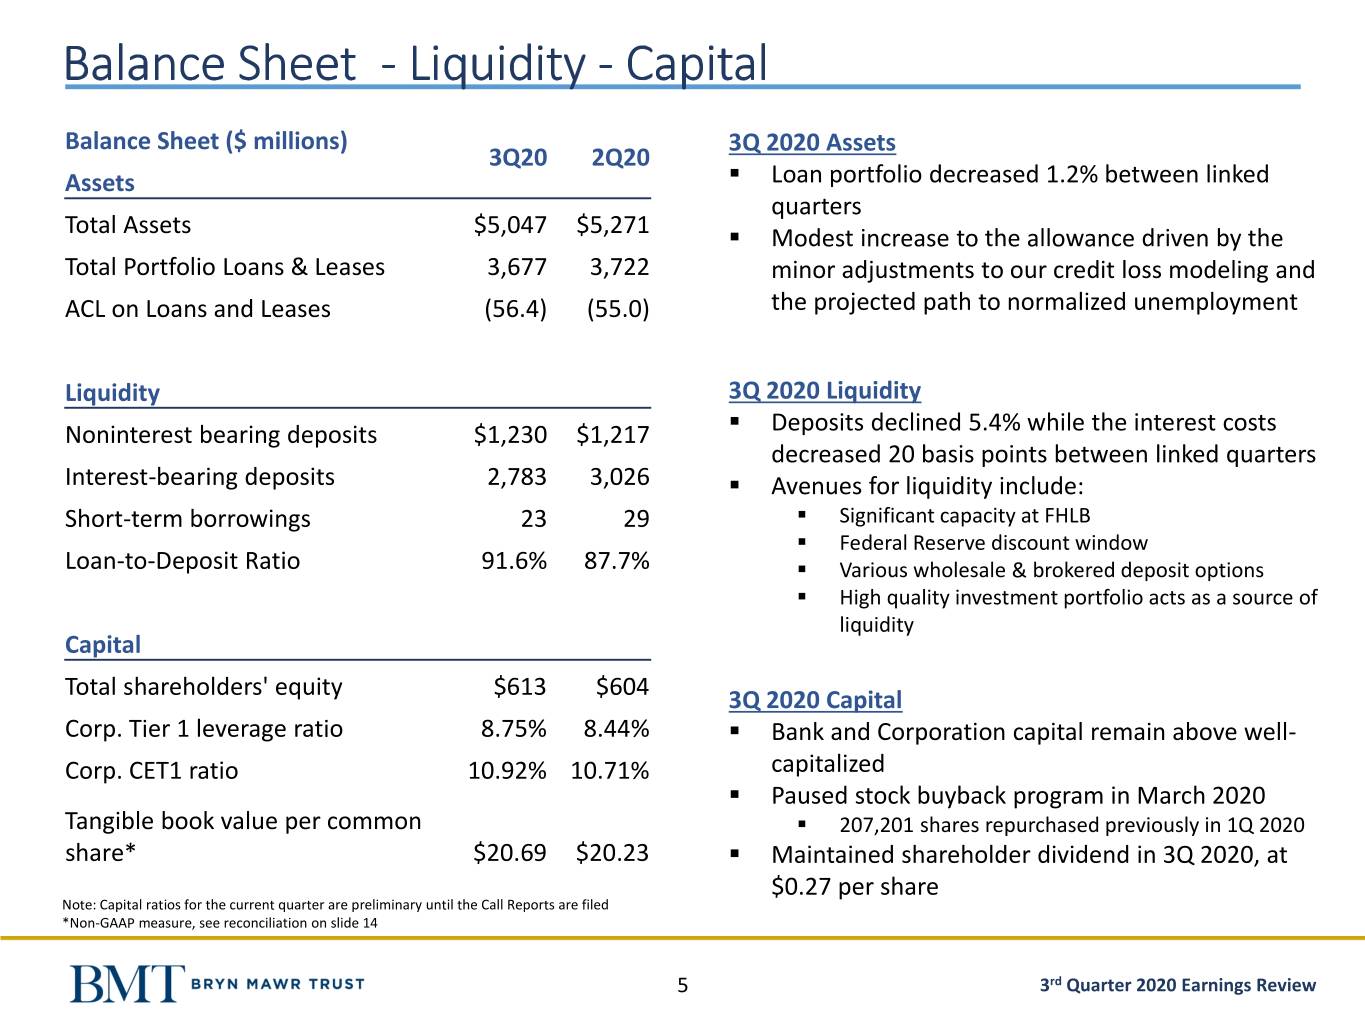
Balance Sheet - Liquidity - Capital Balance Sheet ($ millions) 3Q 2020 Assets 3Q20 2Q20 Assets ▪ Loan portfolio decreased 1.2% between linked quarters Total Assets $5,047 $5,271 ▪ Modest increase to the allowance driven by the Total Portfolio Loans & Leases 3,677 3,722 minor adjustments to our credit loss modeling and ACL on Loans and Leases (56.4) (55.0) the projected path to normalized unemployment Liquidity 3Q 2020 Liquidity ▪ Noninterest bearing deposits $1,230 $1,217 Deposits declined 5.4% while the interest costs decreased 20 basis points between linked quarters Interest-bearing deposits 2,783 3,026 ▪ Avenues for liquidity include: Short-term borrowings 23 29 ▪ Significant capacity at FHLB ▪ Federal Reserve discount window Loan-to-Deposit Ratio 91.6% 87.7% ▪ Various wholesale & brokered deposit options ▪ High quality investment portfolio acts as a source of liquidity Capital Total shareholders' equity $613 $604 3Q 2020 Capital Corp. Tier 1 leverage ratio 8.75% 8.44% ▪ Bank and Corporation capital remain above well- Corp. CET1 ratio 10.92% 10.71% capitalized ▪ Paused stock buyback program in March 2020 Tangible book value per common ▪ 207,201 shares repurchased previously in 1Q 2020 share* $20.69 $20.23 ▪ Maintained shareholder dividend in 3Q 2020, at $0.27 per share Note: Capital ratios for the current quarter are preliminary until the Call Reports are filed *Non-GAAP measure, see reconciliation on slide 14 5 3rd Quarter 2020 Earnings Review
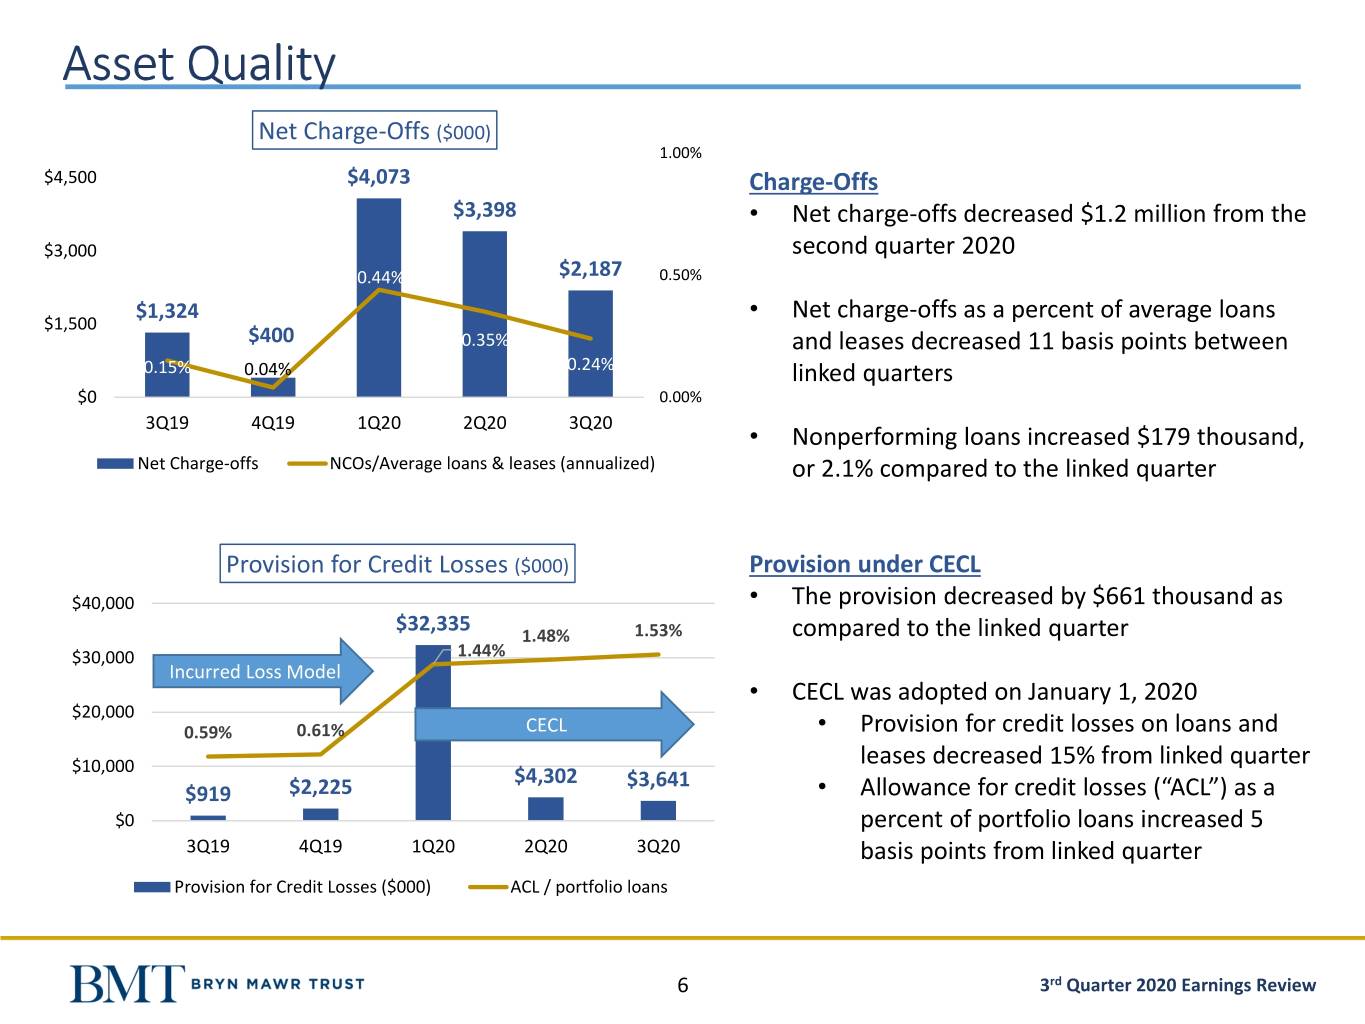
Asset Quality Net Charge-Offs ($000) 1.00% $4,500 $4,073 Charge-Offs $3,398 • Net charge-offs decreased $1.2 million from the $3,000 second quarter 2020 0.44% $2,187 0.50% $1,324 • Net charge-offs as a percent of average loans $1,500 $400 0.35% and leases decreased 11 basis points between 0.15% 0.04% 0.24% linked quarters $0 0.00% 3Q19 4Q19 1Q20 2Q20 3Q20 • Nonperforming loans increased $179 thousand, Net Charge-offs NCOs/Average loans & leases (annualized) or 2.1% compared to the linked quarter Provision for Credit Losses ($000) Provision under CECL $40,000 • The provision decreased by $661 thousand as $32,335 1.48% 1.53% compared to the linked quarter $30,000 1.44% Incurred Loss Model • CECL was adopted on January 1, 2020 $20,000 0.59% 0.61% CECL • Provision for credit losses on loans and $10,000 leases decreased 15% from linked quarter $4,302 $3,641 $919 $2,225 • Allowance for credit losses (“ACL”) as a $0 percent of portfolio loans increased 5 3Q19 4Q19 1Q20 2Q20 3Q20 basis points from linked quarter Provision for Credit Losses ($000) ACL / portfolio loans 6 3rd Quarter 2020 Earnings Review
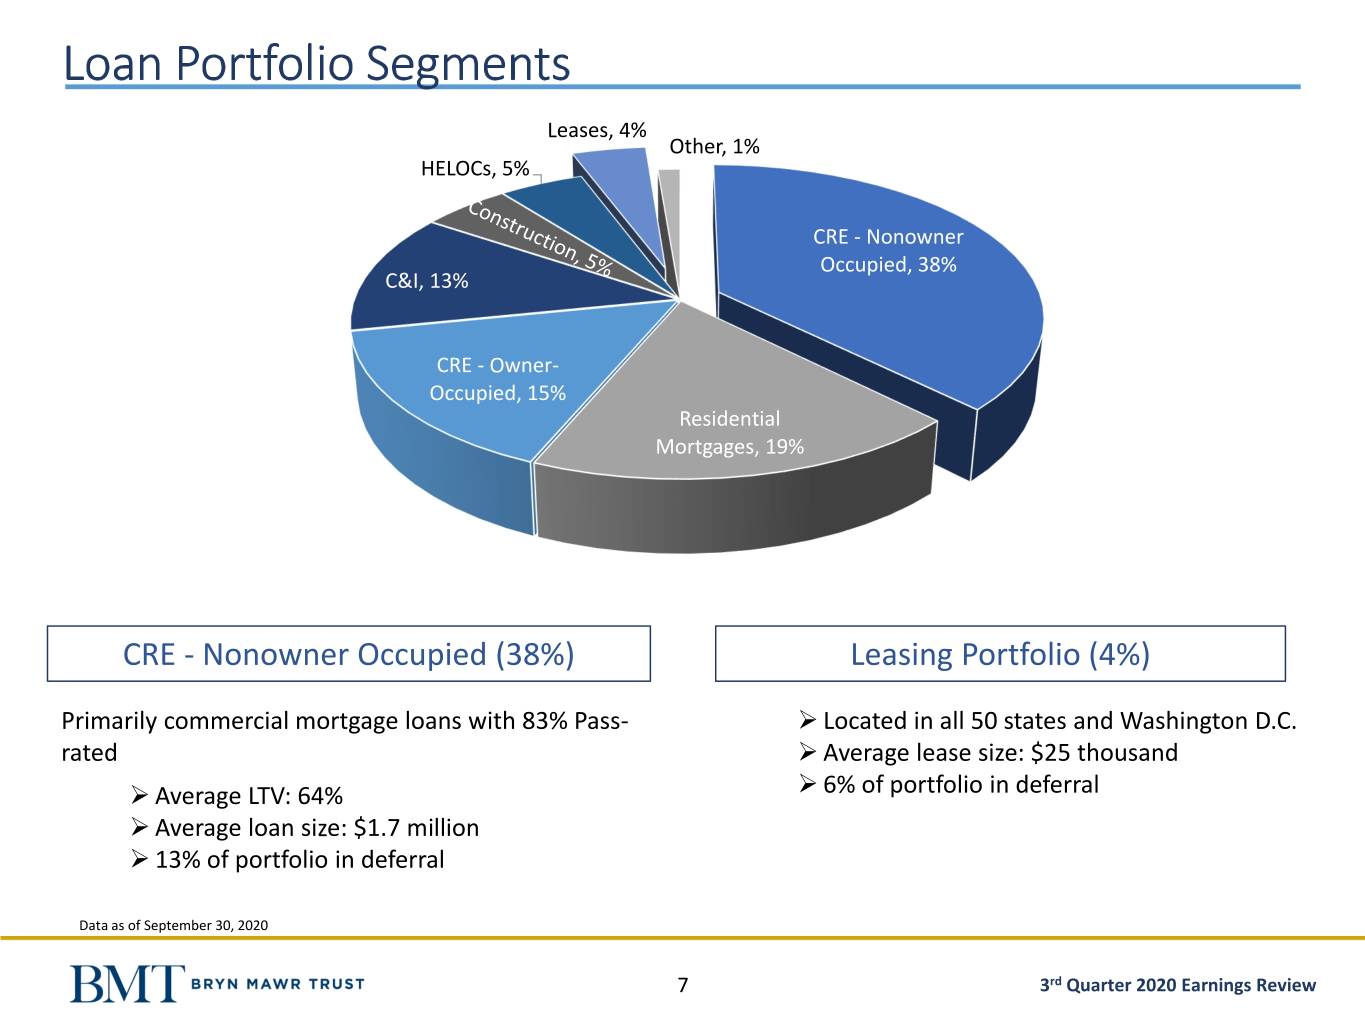
Loan Portfolio Segments Leases, 4% Other, 1% HELOCs, 5% CRE - Nonowner Occupied, 38% C&I, 13% CRE - Owner- Occupied, 15% Residential Mortgages, 19% CRE - Nonowner Occupied (38%) Leasing Portfolio (4%) Primarily commercial mortgage loans with 83% Pass- ➢ Located in all 50 states and Washington D.C. rated ➢ Average lease size: $25 thousand ➢ Average LTV: 64% ➢ 6% of portfolio in deferral ➢ Average loan size: $1.7 million ➢ 13% of portfolio in deferral Data as of September 30, 2020 7 3rd Quarter 2020 Earnings Review

Specialized Sector Exposures Commercial Real Estate-Sector ($000) Size % of Total Loans Avg. Loan Size Avg. LTV Retail $348,128 9.5% $1,642 61.5% Multifamily 290,464 7.9% 1,252 66.0% Flex 237,652 6.5% 1,121 63.7% Office 218,285 5.9% 1,732 68.4% Hospitality 91,140 2.5% 3,376 62.7% CRE Sector Rating Lines of Credit Usage 70.0% Pass Special CRE-Sector Pass Watch Mention Substandard 60.0% Retail 73% 19% 0% 8% 50.0% 40.0% Multifamily 97% 1% 2% 0% 30.0% Flex 94% 4% 1% 1% 20.0% Commercial Construction Consumer HELOC Master Small Office 95% 4% 1% 0% Commitment Business 12/31/2019 3/31/2020 6/30/2020 9/30/2020 Hospitality 0% 2% 19% 79% Lines of credit usage decreased 0.7%, or $5.4 million since June 30, 2020. *as of September 30, 2020 8 3rd Quarter 2020 Earnings Review
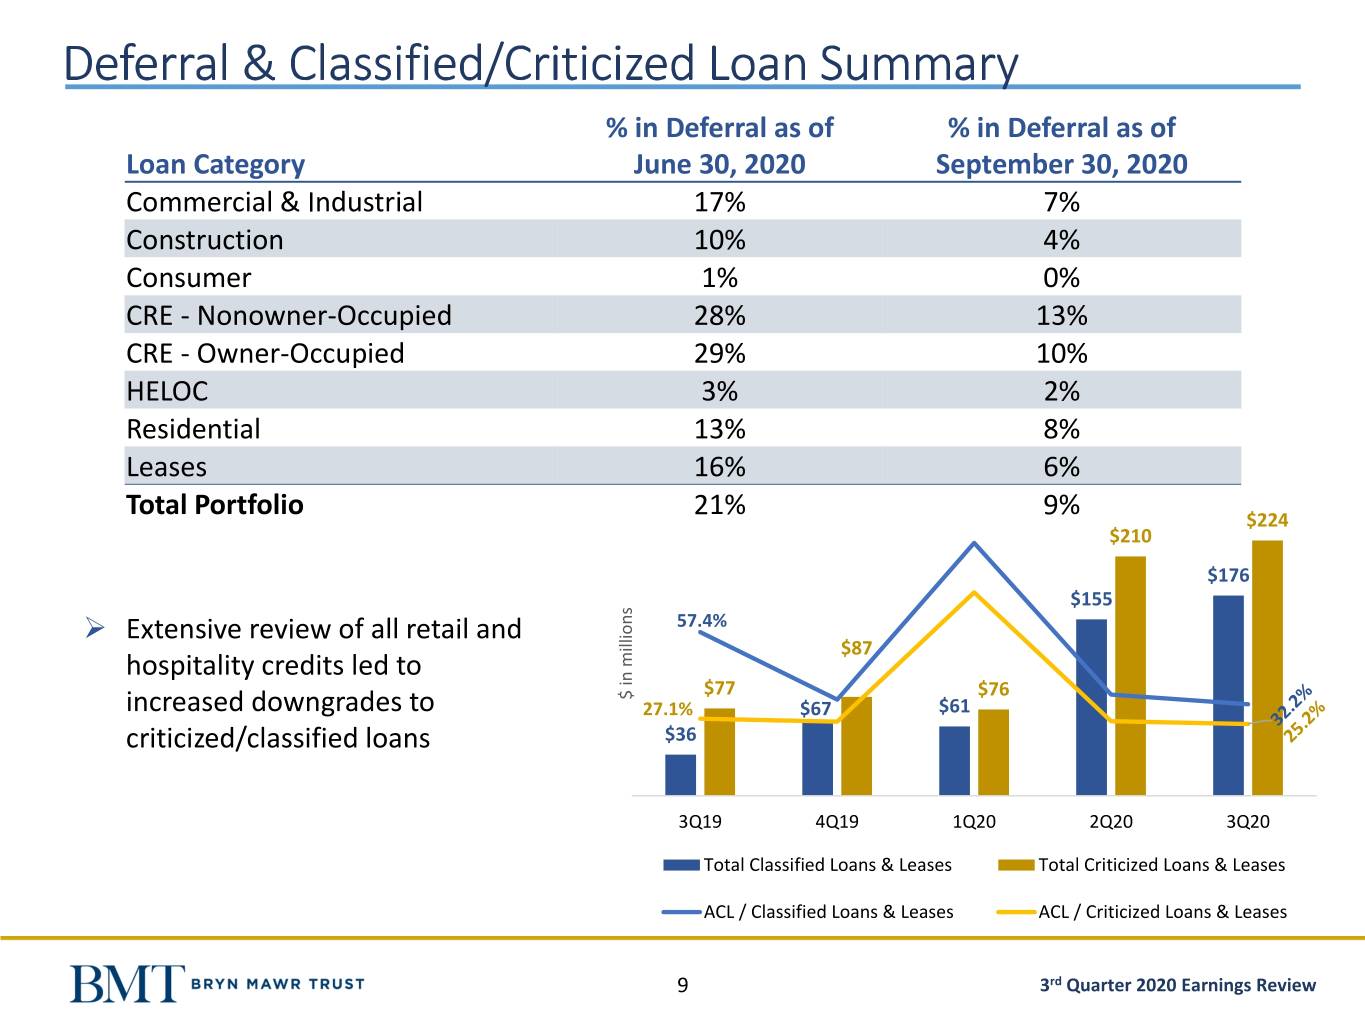
Deferral & Classified/Criticized Loan Summary % in Deferral as of % in Deferral as of Loan Category June 30, 2020 September 30, 2020 Commercial & Industrial 17% 7% Construction 10% 4% Consumer 1% 0% CRE - Nonowner-Occupied 28% 13% CRE - Owner-Occupied 29% 10% HELOC 3% 2% Residential 13% 8% Leases 16% 6% Total Portfolio 21% 9% $224 $210 $176 $155 ➢ Extensive review of all retail and 57.4% $87 hospitality credits led to $ in millions in $ $77 $76 increased downgrades to 27.1% $67 $61 criticized/classified loans $36 3Q19 4Q19 1Q20 2Q20 3Q20 Total Classified Loans & Leases Total Criticized Loans & Leases ACL / Classified Loans & Leases ACL / Criticized Loans & Leases 9 3rd Quarter 2020 Earnings Review
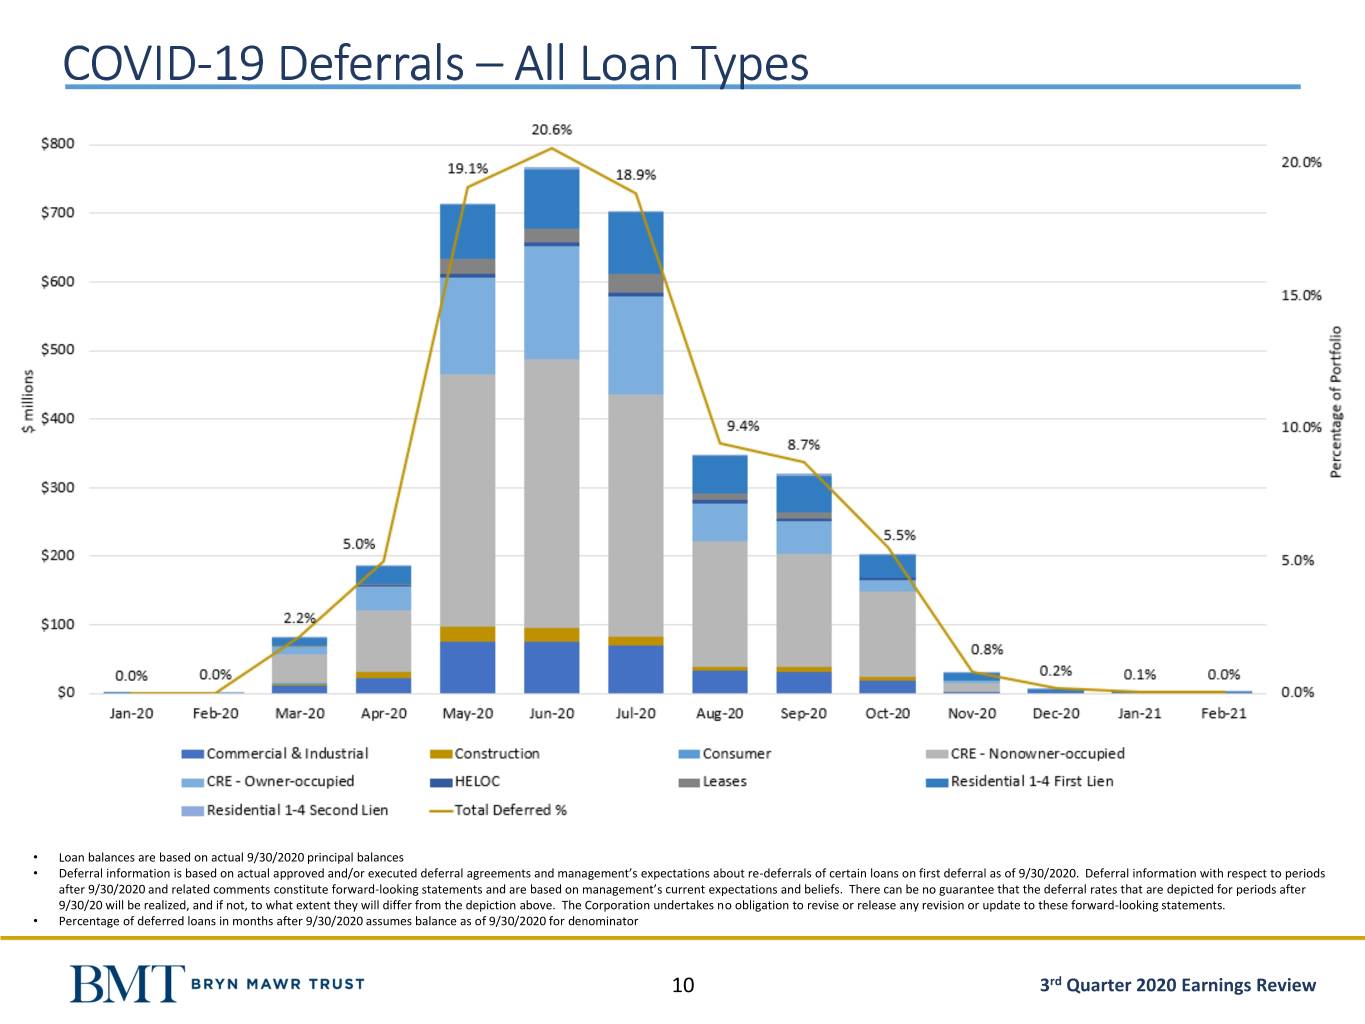
COVID-19 Deferrals – All Loan Types • Loan balances are based on actual 9/30/2020 principal balances • Deferral information is based on actual approved and/or executed deferral agreements and management’s expectations about re-deferrals of certain loans on first deferral as of 9/30/2020. Deferral information with respect to periods after 9/30/2020 and related comments constitute forward-looking statements and are based on management’s current expectations and beliefs. There can be no guarantee that the deferral rates that are depicted for periods after 9/30/20 will be realized, and if not, to what extent they will differ from the depiction above. The Corporation undertakes no obligation to revise or release any revision or update to these forward-looking statements. • Percentage of deferred loans in months after 9/30/2020 assumes balance as of 9/30/2020 for denominator 10 3rd Quarter 2020 Earnings Review
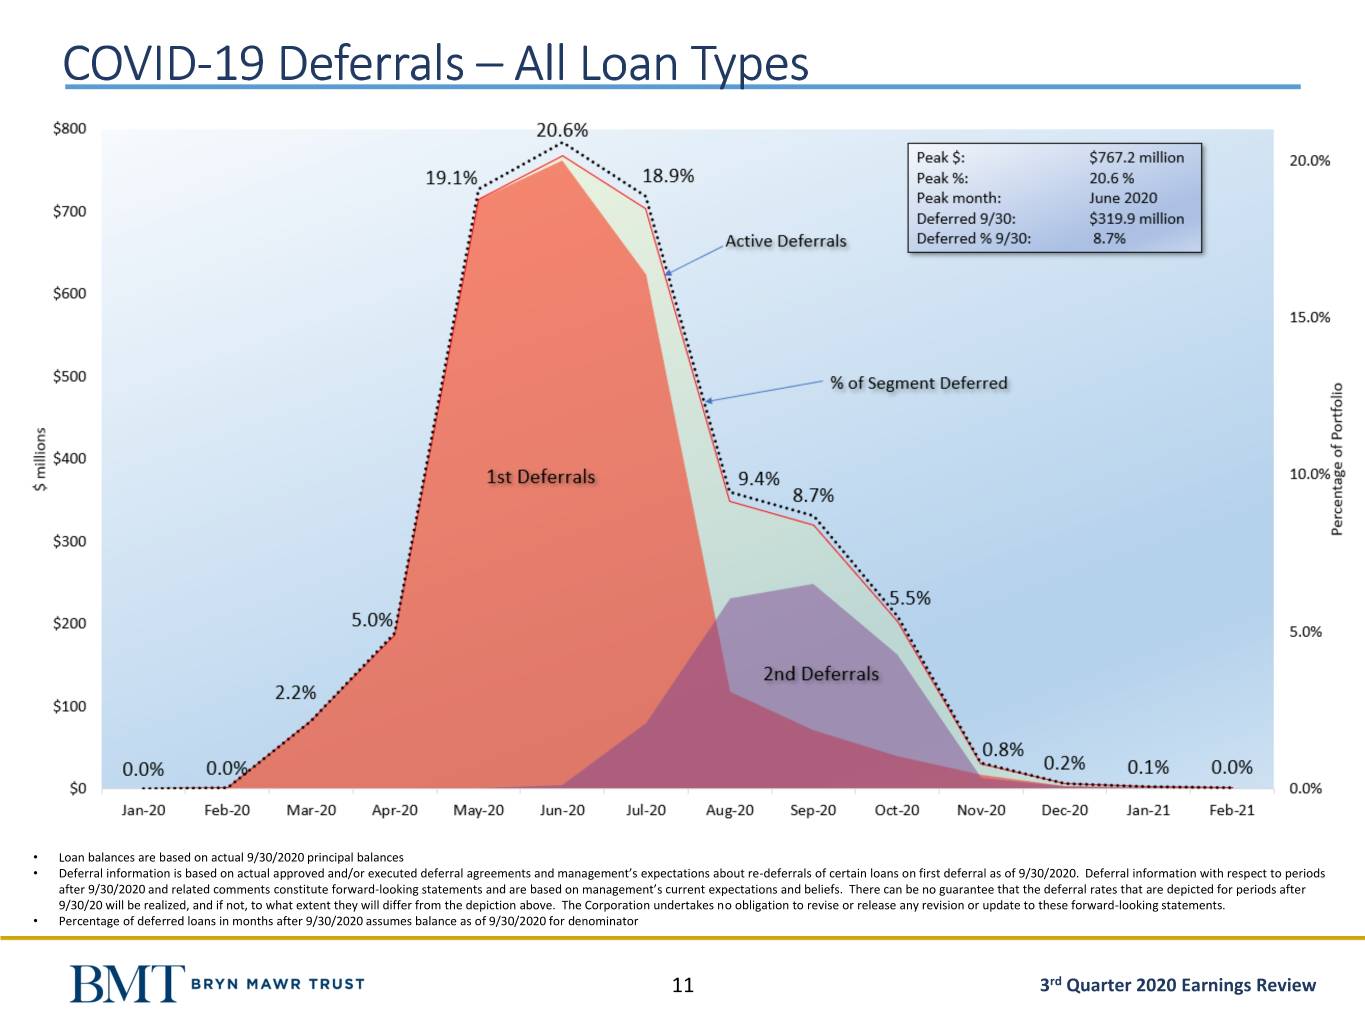
COVID-19 Deferrals – All Loan Types • Loan balances are based on actual 9/30/2020 principal balances • Deferral information is based on actual approved and/or executed deferral agreements and management’s expectations about re-deferrals of certain loans on first deferral as of 9/30/2020. Deferral information with respect to periods after 9/30/2020 and related comments constitute forward-looking statements and are based on management’s current expectations and beliefs. There can be no guarantee that the deferral rates that are depicted for periods after 9/30/20 will be realized, and if not, to what extent they will differ from the depiction above. The Corporation undertakes no obligation to revise or release any revision or update to these forward-looking statements. • Percentage of deferred loans in months after 9/30/2020 assumes balance as of 9/30/2020 for denominator 11 3rd Quarter 2020 Earnings Review

COVID-19 Deferrals – Nonowner-Occupied CRE • Loan balances are based on actual 9/30/2020 principal balances • Deferral information is based on actual approved and/or executed deferral agreements and management’s expectations about re-deferrals of certain loans on first deferral as of 9/30/2020. Deferral information with respect to periods after 9/30/2020 and related comments constitute forward-looking statements and are based on management’s current expectations and beliefs. There can be no guarantee that the deferral rates that are depicted for periods after 9/30/20 will be realized, and if not, to what extent they will differ from the depiction above. The Corporation undertakes no obligation to revise or release any revision or update to these forward-looking statements. • Percentage of deferred loans in months after 9/30/2020 assumes balance as of 9/30/2020 for denominator 12 3rd Quarter 2020 Earnings Review
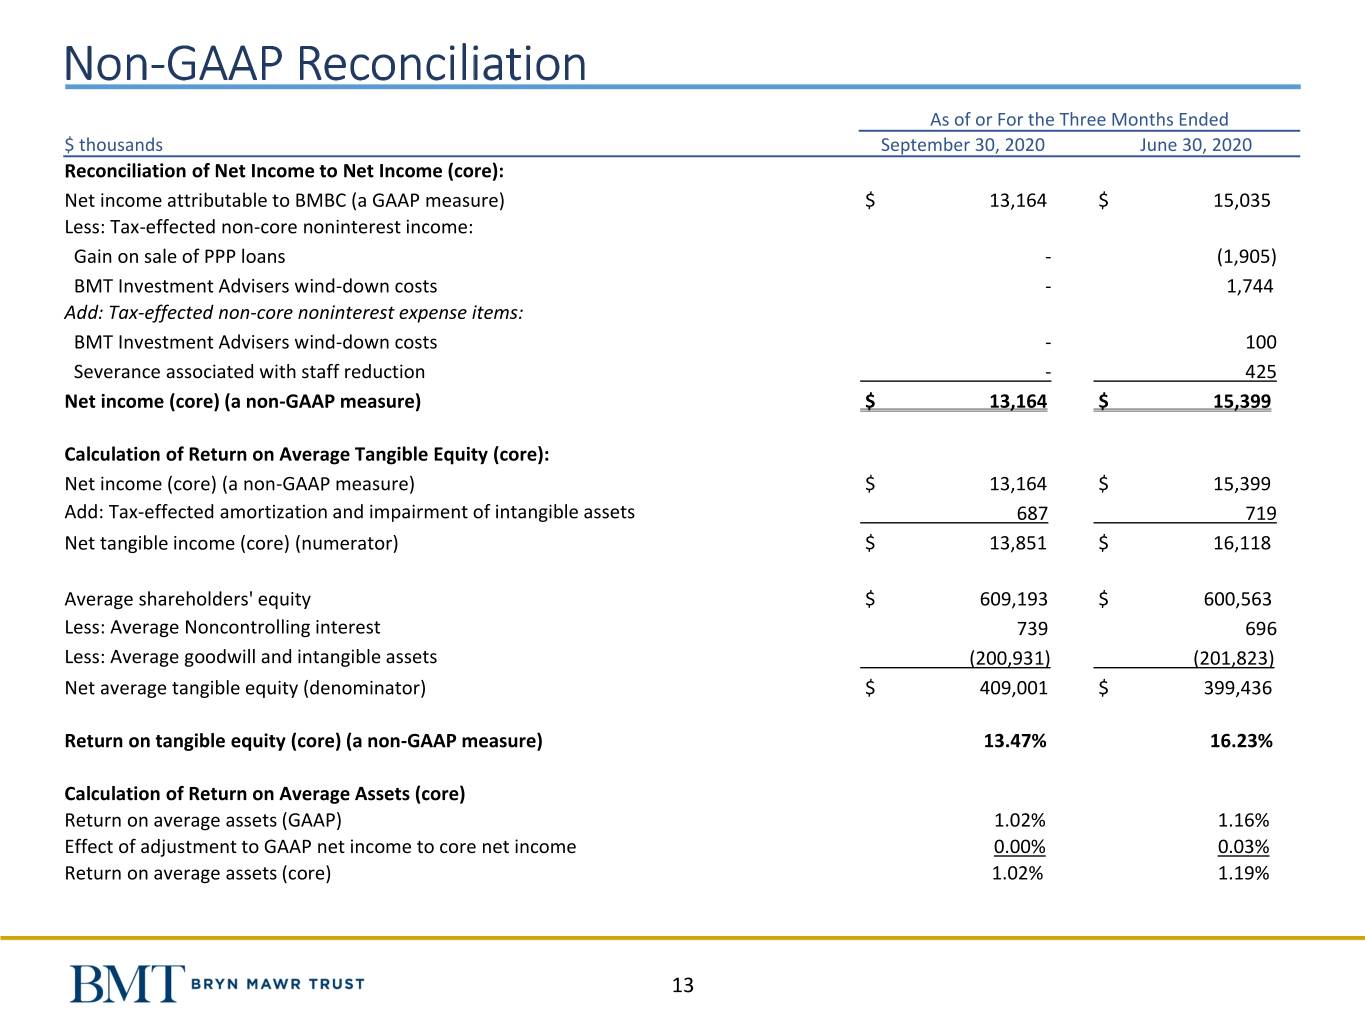
Non-GAAP Reconciliation As of or For the Three Months Ended $ thousands September 30, 2020 June 30, 2020 Reconciliation of Net Income to Net Income (core): Net income attributable to BMBC (a GAAP measure) $ 13,164 $ 15,035 Less: Tax-effected non-core noninterest income: Gain on sale of PPP loans - (1,905) BMT Investment Advisers wind-down costs - 1,744 Add: Tax-effected non-core noninterest expense items: BMT Investment Advisers wind-down costs - 100 Severance associated with staff reduction - 425 Net income (core) (a non-GAAP measure) $ 13,164 $ 15,399 Calculation of Return on Average Tangible Equity (core): Net income (core) (a non-GAAP measure) $ 13,164 $ 15,399 Add: Tax-effected amortization and impairment of intangible assets 687 719 Net tangible income (core) (numerator) $ 13,851 $ 16,118 Average shareholders' equity $ 609,193 $ 600,563 Less: Average Noncontrolling interest 739 696 Less: Average goodwill and intangible assets (200,931) (201,823) Net average tangible equity (denominator) $ 409,001 $ 399,436 Return on tangible equity (core) (a non-GAAP measure) 13.47% 16.23% Calculation of Return on Average Assets (core) Return on average assets (GAAP) 1.02% 1.16% Effect of adjustment to GAAP net income to core net income 0.00% 0.03% Return on average assets (core) 1.02% 1.19% 13

Non-GAAP Reconciliation As of or For the Three Months Ended $ thousands September 30, 2020 June 30, 2020 Calculation of tangible book value per common share: Total shareholders' equity $ 612,617 $ 603,674 Less: Noncontrolling interest 767 727 Less: Goodwill and intangible assets (200,445) (201,315) Net tangible equity (numerator) $ 412,939 $ 403,086 Shares outstanding , end of period (denominator) 19,958,186 19,927,893 Tangible book value per common share (a non-GAAP measure) $ 20.69 $ 20.23 Calculation of Efficiency Ratio: Noninterest expense $ 35,657 $ 34,636 Less: certain noninterest expense items*: Amortization of intangibles (870) (910) BMT Investment Advisers, Inc. wind-down costs - (127) Severance associated with staff reduction - (538) Noninterest expense (adjusted) (numerator) $ 34,787 $ 33,061 Noninterest income $ 21,099 $ 20,566 Less: non-core noninterest income items: Gain on sale of PPP loans - (2,411) BMT Investment Advisers, Inc. wind-down costs - 2,207 Noninterest income (core) $ 21,099 $ 20,362 Net interest income 35,032 37,385 Noninterest income (core) and net interest income (denominator) $ 56,131 $ 57,747 Efficiency ratio 61.97% 57.25% * In calculating the Corporation's efficiency ratio, which is used by Management to identify the cost of generating each dollar of core revenue, certain non-core income and expense items as well as the amortization of intangible assets, are excluded. 14
