Attached files
| file | filename |
|---|---|
| 8-K - 8-K - TRINITY INDUSTRIES INC | trn-20201021.htm |
| EX-99.2 - EX-99.2 - TRINITY INDUSTRIES INC | q32020exh992-conferenc.htm |
| EX-99.1 - EX-99.1 - TRINITY INDUSTRIES INC | exh991pressrelease9302.htm |

Exh. 99.3 TRINITY INDUSTRIES, INC. Investor Day Presentation November 19, 2020 3Q 2020 – Earnings Conference Call Supplemental Material October 22, 2020 – based on financial results as of September 30, 2020 Investor Contact: TrinityInvestorRelations@trin.net Website: www.trin.net DELIVERING GOODS for THE GOOD of ALL
Forward Looking Statements Some statements in this presentation, which are not historical facts, are “forward-looking statements” as defined by the Private Securities Litigation Reform Act of 1995. Forward-looking statements include statements about Trinity's estimates, expectations, beliefs, intentions or strategies for the future, and the assumptions underlying these forward-looking statements, including, but not limited to, future financial and operating performance, future opportunities and any other statements regarding events or developments that Trinity believes or anticipates will or may occur in the future, including the potential financial and operational impacts of the COVID-19 pandemic. Trinity uses the words “anticipates,” “assumes,” “believes,” “estimates,” “expects,” “intends,” “forecasts,” “may,” “will,” “should,” “guidance,” “projected,” “outlook,” and similar expressions to identify these forward-looking statements. Forward-looking statements speak only as of the date of this release, and Trinity expressly disclaims any obligation or undertaking to disseminate any updates or revisions to any forward-looking statement contained herein to reflect any change in Trinity’s expectations with regard thereto or any change in events, conditions or circumstances on which any such statement is based, except as required by federal securities laws. Forward- looking statements involve risks and uncertainties that could cause actual results to differ materially from historical experience or our present expectations, including but not limited to risks and uncertainties regarding economic, competitive, governmental, and technological factors affecting Trinity’s operations, markets, products, services and prices, and such forward-looking statements are not guarantees of future performance. For a discussion of such risks and uncertainties, which could cause actual results to differ from those contained in the forward-looking statements, see “Risk Factors” and “Forward-Looking Statements” in Trinity’s Annual Report on Form 10-K for the most recent fiscal year, as may be revised and updated by Trinity’s Quarterly Reports on Form 10-Q, and Trinity’s Current Reports on Form 8-K. Additionally, the information and metrics on slide 6 are assumptions used for scenario modeling purposes only. They are not statements of the Company’s expectations, projections, guidance, forecasts, or estimates and readers should not interpret them as such. DELIVERING GOODS for THE GOOD of ALL /// 2
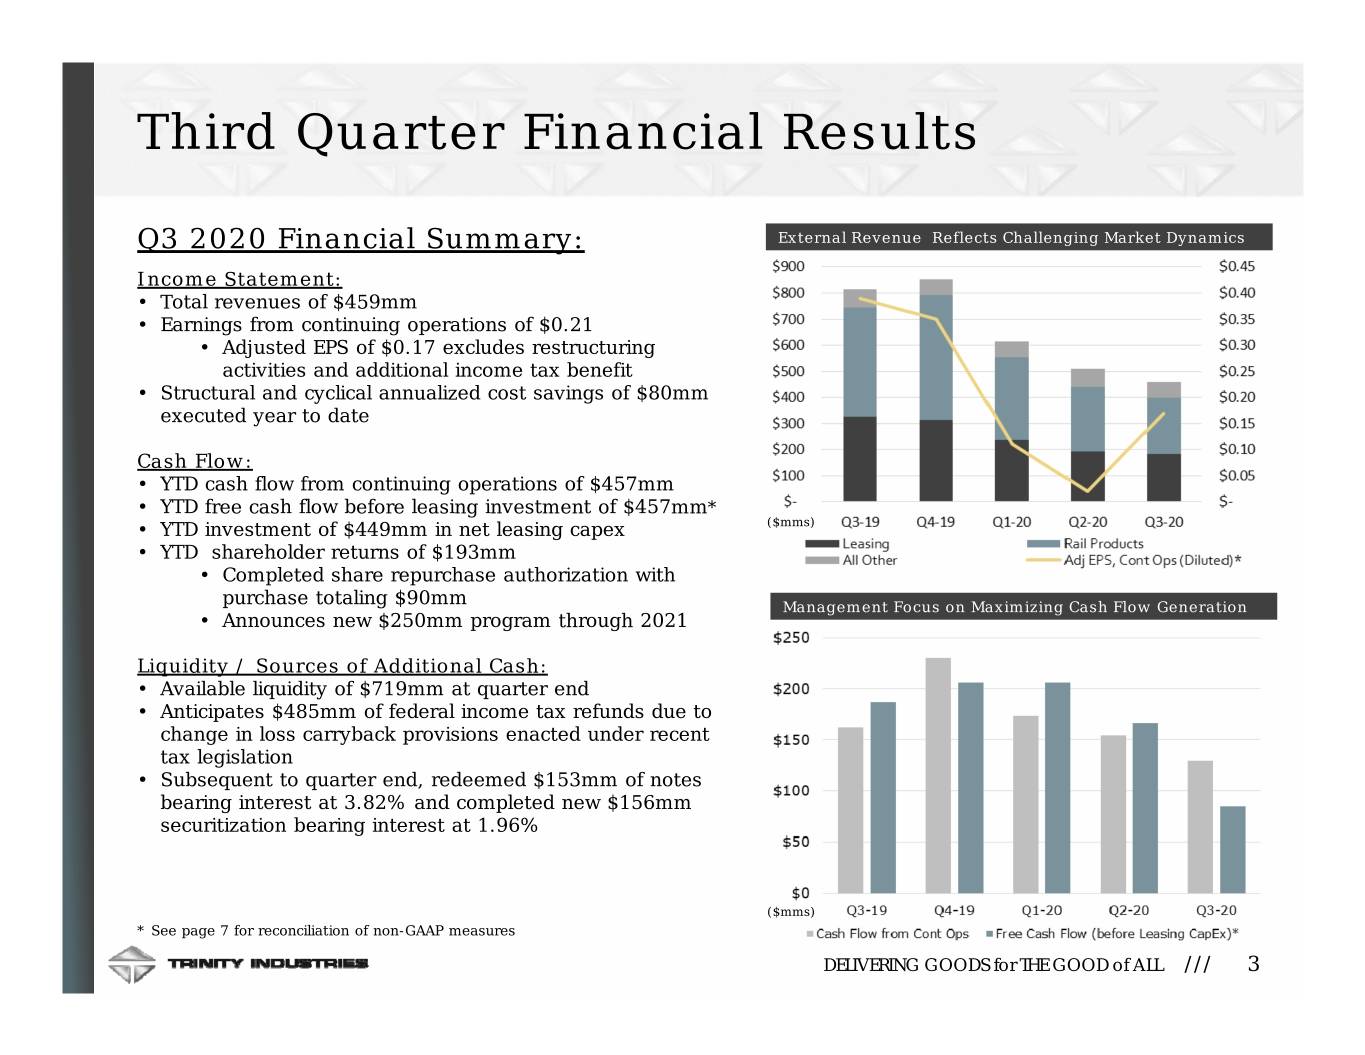
Third Quarter Financial Results Q3 2020 Financial Summary: External Revenue Reflects Challenging Market Dynamics Income Statement: • Total revenues of $459mm • Earnings from continuing operations of $0.21 • Adjusted EPS of $0.17 excludes restructuring activities and additional income tax benefit • Structural and cyclical annualized cost savings of $80mm executed year to date Cash Flow: • YTD cash flow from continuing operations of $457mm • YTD free cash flow before leasing investment of $457mm* • YTD investment of $449mm in net leasing capex ($mms) • YTD shareholder returns of $193mm • Completed share repurchase authorization with purchase totaling $90mm Management Focus on Maximizing Cash Flow Generation • Announces new $250mm program through 2021 Liquidity / Sources of Additional Cash: • Available liquidity of $719mm at quarter end • Anticipates $485mm of federal income tax refunds due to change in loss carryback provisions enacted under recent tax legislation • Subsequent to quarter end, redeemed $153mm of notes bearing interest at 3.82% and completed new $156mm securitization bearing interest at 1.96% ($mms) * See page 7 for reconciliation of non-GAAP measures DELIVERING GOODS for THE GOOD of ALL /// 3
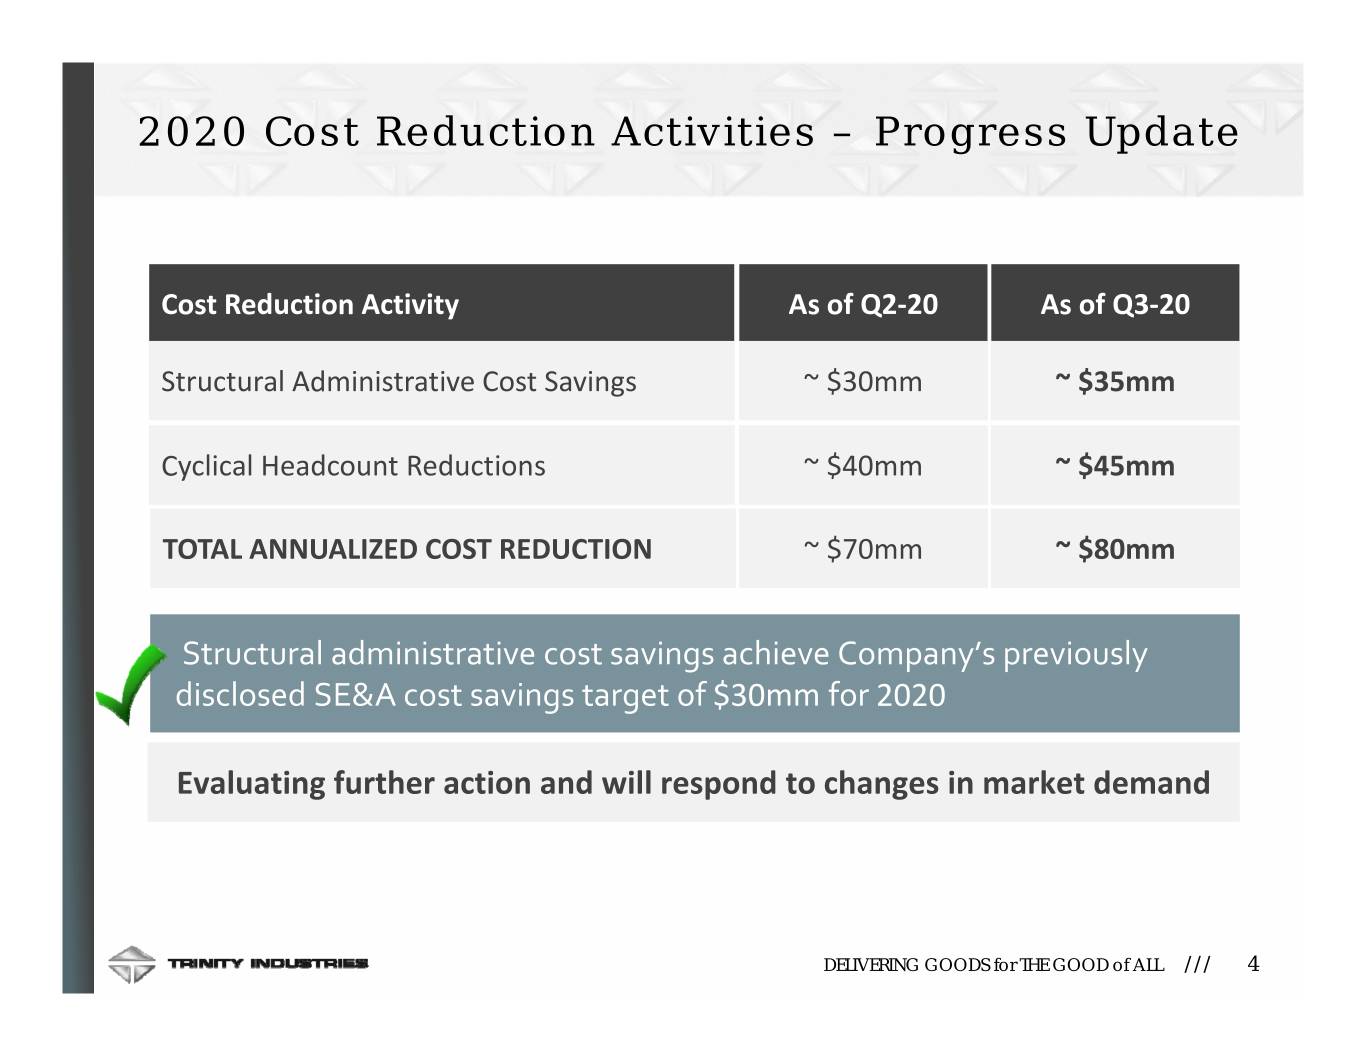
2020 Cost Reduction Activities – Progress Update Cost Reduction Activity As of Q2‐20 As of Q3‐20 Structural Administrative Cost Savings ~ $30mm ~ $35mm Cyclical Headcount Reductions ~ $40mm ~ $45mm TOTAL ANNUALIZED COST REDUCTION ~ $70mm ~ $80mm Structural administrative cost savings achieve Company’s previously disclosed SE&A cost savings target of $30mm for 2020 Evaluating further action and will respond to changes in market demand DELIVERING GOODS for THE GOOD of ALL /// 4
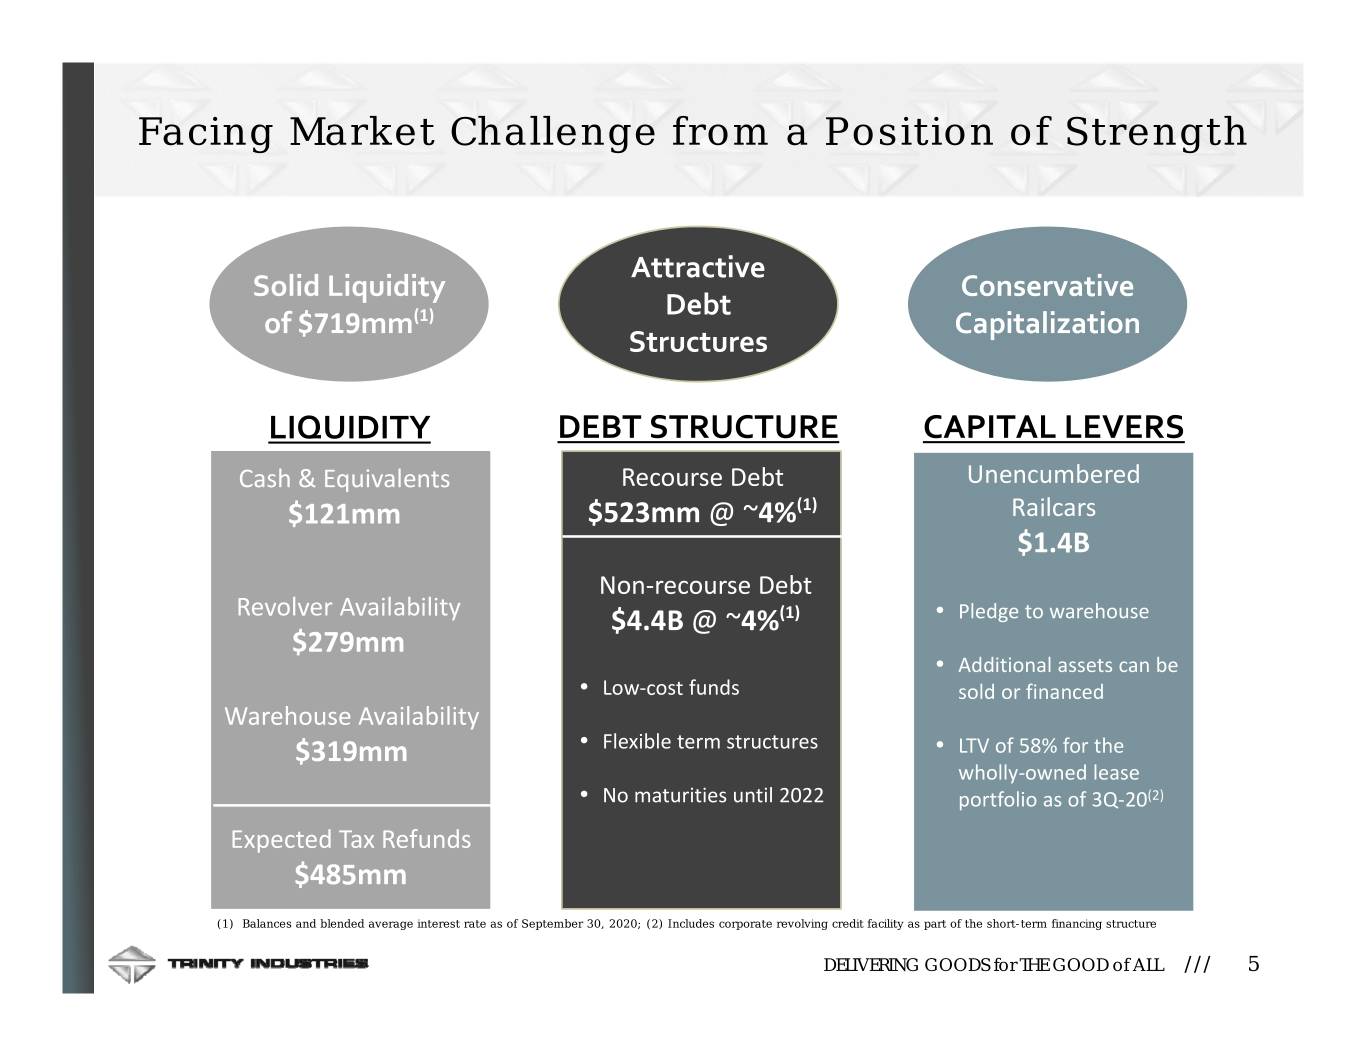
Facing Market Challenge from a Position of Strength Attractive Solid Liquidity Conservative Debt of $719mm(1) Capitalization Structures LIQUIDITY DEBT STRUCTURE CAPITAL LEVERS Cash & Equivalents Recourse Debt Unencumbered $121mm $523mm @ ~4%(1) Railcars $1.4B Non‐recourse Debt Revolver Availability $4.4B @ ~4%(1) • Pledge to warehouse $279mm • Additional assets can be • Low‐cost funds sold or financed Warehouse Availability $319mm • Flexible term structures • LTV of 58% for the wholly‐owned lease • No maturities until 2022 portfolio as of 3Q‐20(2) Expected Tax Refunds $485mm (1) Balances and blended average interest rate as of September 30, 2020; (2) Includes corporate revolving credit facility as part of the short-term financing structure DELIVERING GOODS for THE GOOD of ALL /// 5
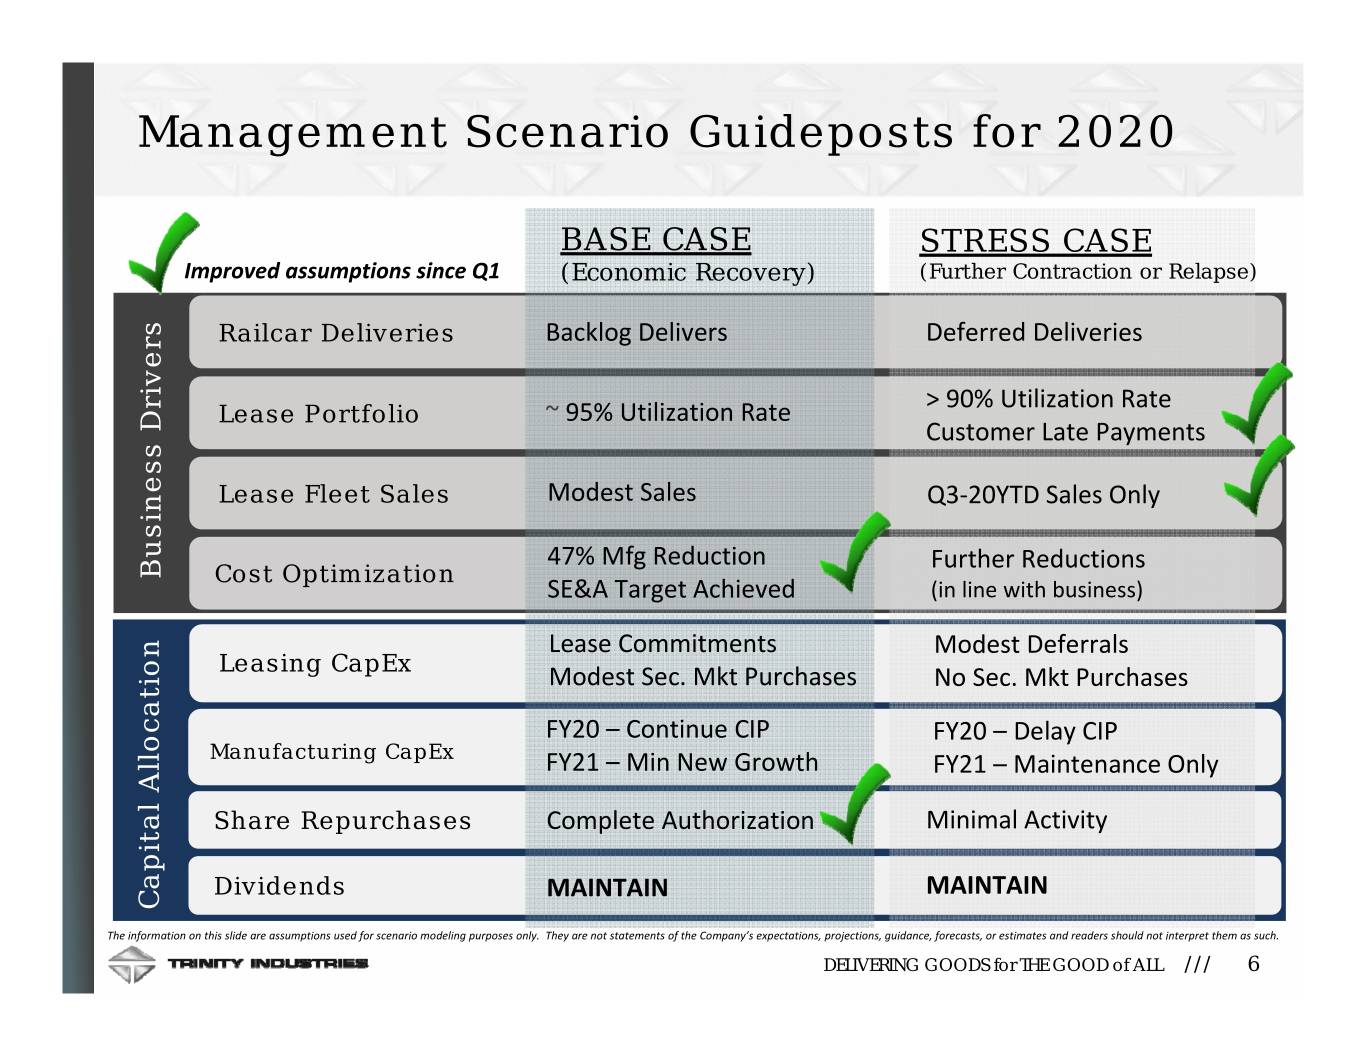
Management Scenario Guideposts for 2020 BASE CASE STRESS CASE Improved assumptions since Q1 (Economic Recovery) (Further Contraction or Relapse) Railcar Deliveries Backlog Delivers Deferred Deliveries > 90% Utilization Rate Lease Portfolio ~ 95% Utilization Rate Customer Late Payments Lease Fleet Sales Modest Sales Q3‐20YTD Sales Only 47% Mfg Reduction Further Reductions Business Drivers Cost Optimization SE&A Target Achieved (in line with business) Lease Commitments Modest Deferrals Leasing CapEx Modest Sec. Mkt Purchases No Sec. Mkt Purchases FY20 – Continue CIP FY20 –Delay CIP Manufacturing CapEx FY21 – Min New Growth FY21 – Maintenance Only Share Repurchases Complete Authorization Minimal Activity Dividends MAINTAIN MAINTAIN Capital Allocation The information on this slide are assumptions used for scenario modeling purposes only. They are not statements of the Company’s expectations, projections, guidance, forecasts, or estimates and readers should not interpret them as such. DELIVERING GOODS for THE GOOD of ALL /// 6
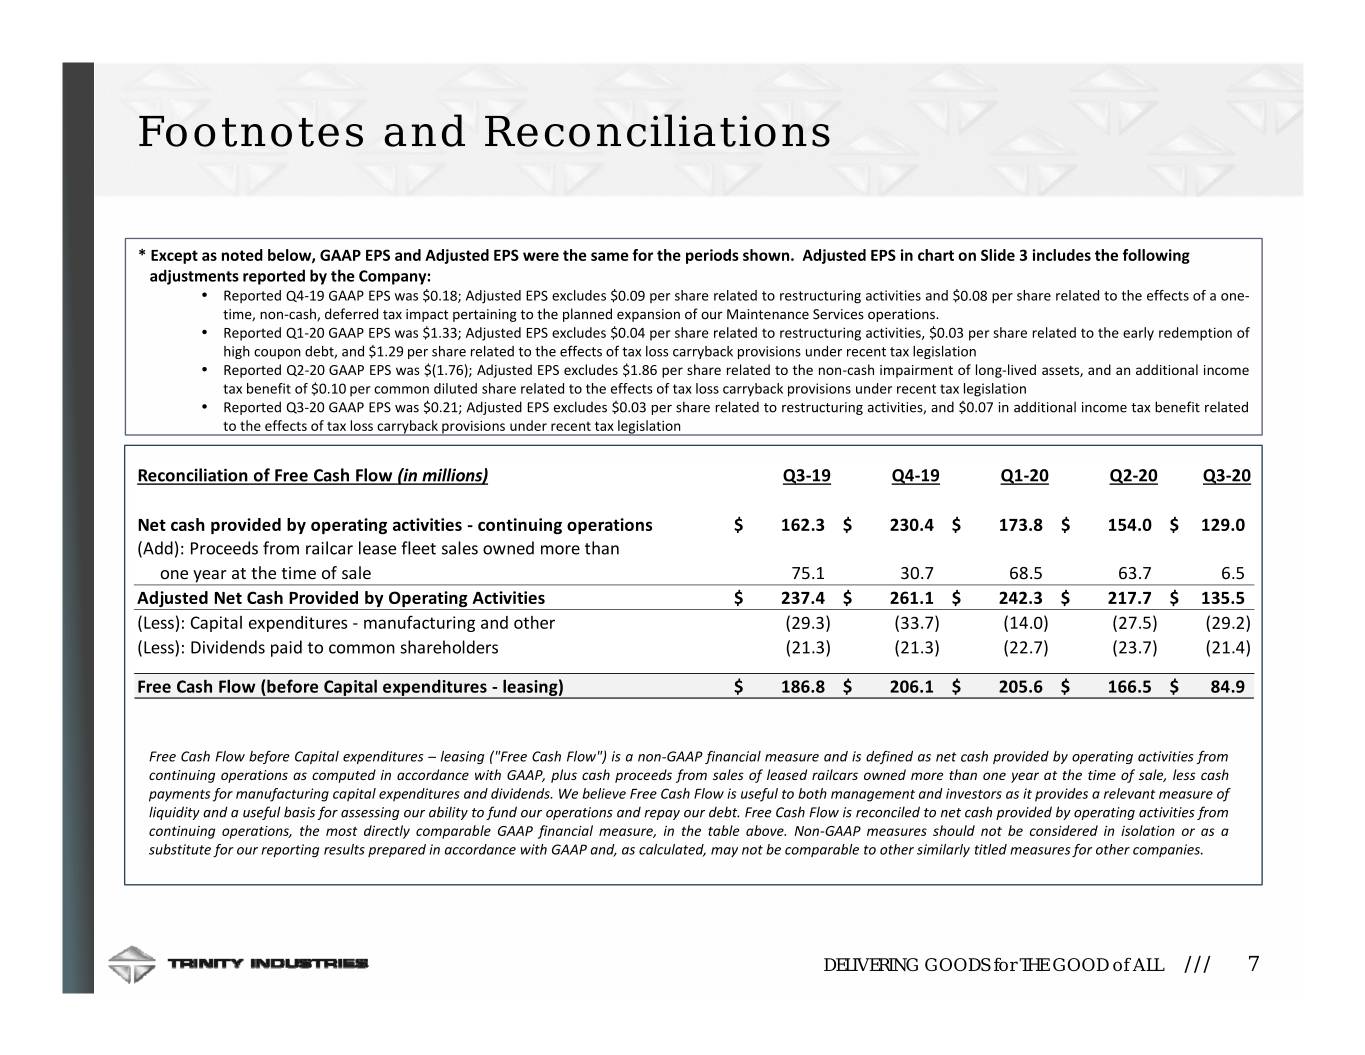
Footnotes and Reconciliations * Except as noted below, GAAP EPS and Adjusted EPS were the same for the periods shown. Adjusted EPS in chart on Slide 3 includes the following adjustmentsreportedbytheCompany: • Reported Q4‐19 GAAP EPS was $0.18; Adjusted EPS excludes $0.09 per share related to restructuring activities and $0.08 per share related to the effects of a one‐ time, non‐cash, deferred tax impact pertaining to the planned expansion of our Maintenance Services operations. • Reported Q1‐20 GAAP EPS was $1.33; Adjusted EPS excludes $0.04 per share related to restructuring activities, $0.03 per share related to the early redemption of high coupon debt, and $1.29 per share related to the effects of tax loss carryback provisions under recent tax legislation • Reported Q2‐20 GAAP EPS was $(1.76); Adjusted EPS excludes $1.86 per share related to the non‐cash impairment of long‐lived assets, and an additional income tax benefit of $0.10 per common diluted share related to the effects of tax loss carryback provisions under recent tax legislation • Reported Q3‐20 GAAP EPS was $0.21; Adjusted EPS excludes $0.03 per share related to restructuring activities, and $0.07 in additional income tax benefit related to the effects of tax loss carryback provisions under recent tax legislation Reconciliation of Free Cash Flow (in millions) Q3‐19 Q4‐19 Q1‐20 Q2‐20 Q3‐20 Net cash provided by operating activities ‐ continuing operations$ 162.3 $ 230.4 $ 173.8 $ 154.0 $ 129.0 (Add): Proceeds from railcar lease fleet sales owned more than one year at the time of sale 75.1 30.7 68.5 63.7 6.5 Adjusted Net Cash Provided by Operating Activities$ 237.4 $ 261.1 $ 242.3 $ 217.7 $ 135.5 (Less): Capital expenditures ‐ manufacturing and other (29.3) (33.7) (14.0) (27.5) (29.2) (Less): Dividends paid to common shareholders (21.3) (21.3) (22.7) (23.7) (21.4) Free Cash Flow (before Capital expenditures ‐ leasing)$ 186.8 $ 206.1 $ 205.6 $ 166.5 $ 84.9 Free Cash Flow before Capital expenditures – leasing ("Free Cash Flow") is a non‐GAAP financial measure and is defined as net cash provided by operating activities from continuing operations as computed in accordance with GAAP, plus cash proceeds from sales of leased railcars owned more than one year at the time of sale,lesscash payments for manufacturing capital expenditures and dividends. We believe Free Cash Flow is useful to both management and investors as it provides a relevant measure of liquidity and a useful basis for assessing our ability to fund our operations and repay our debt. Free Cash Flow is reconciled to net cash provided by operating activities from continuing operations, the most directly comparable GAAP financial measure, in the table above. Non‐GAAP measures should not be considered in isolation or as a substitute for our reporting results prepared in accordance with GAAP and, as calculated, may not be comparable to other similarly titled measures for other companies. DELIVERING GOODS for THE GOOD of ALL /// 7
