Attached files
| file | filename |
|---|---|
| 8-K - FORM 8-K - Midland States Bancorp, Inc. | f8k_102220.htm |
| EX-99.1 - PRESS RELEASE - Midland States Bancorp, Inc. | exh_991.htm |
Exhibit 99.2

1 Midland States Bancorp, Inc. NASDAQ: MSBI Third Quarter 2020 Earnings Call
2 Forward - Looking Statements. This presentation may contain forward - looking statements within the meaning of the federal securities laws. Forward - looking statements expressing management’s current expectations, forecasts of future events or long - te rm goals may be based upon beliefs, expectations and assumptions of Midland’s management, and are generally identifiable by the use of words such as “believe,” “expect,” “anticipate,” “plan,” “intend,” “estimate,” “may,” “will,” “would,” “could,” “should” o r o ther similar expressions. All statements in this presentation speak only as of the date they are made, and Midland undertakes no obligation to update any statement. A number of factors, many of which are beyond the ability of Midland to control or predic t, could cause actual results to differ materially from those in its forward - looking statements including the effects of the Corona virus Disease 2019 (COVID - 19) pandemic, including its potential effects on the economic environment, our customers and our operations, as well as any changes to federal, state or local government laws, regulations or orders in connection with the pandemic. These risks and uncertainties should be considered in evaluating forward - looking statements, and undue reliance should not be placed o n such statements. Additional information concerning Midland and its businesses, including additional factors that could materi all y affect Midland’s financial results, are included in Midland’s filings with the Securities and Exchange Commission. Use of Non - GAAP Financial Measures. This presentation may contain certain financial information determined by methods other than in accordance with accounting principles generally accepted in the United States (“GAAP”). These non - GAAP financial measure s include “Adjusted Earnings,” “Adjusted Diluted Earnings Per Share,” “Adjusted Return on Average Assets,” “Adjusted Return on Average Shareholders’ Equity,” “Adjusted Return on Average Tangible Common Equity,” “Efficiency Ratio,” “Tangible Common Equ ity to Tangible Assets,” “Tangible Book Value Per Share,” and “Return on Average Tangible Common Equity.” The Company believes th at these non - GAAP financial measures provide both management and investors a more complete understanding of the Company’s funding profile and profitability. These non - GAAP financial measures are supplemental and are not a substitute for any analysis based on GAAP financial measures. Not all companies use the same calculation of these measures; therefore this presentation m ay not be comparable to other similarly titled measures as presented by other companies. Reconciliations of these non - GAAP measures are provided in the Appendix section of this presentation.

3 Overview of 3Q20 3 Positive Trends Across Multiple Business Lines 3Q20 Earnings Optimization and Efficiency Initiatives • Wealth management continues to provide stable source of noninterest income • Equipment financing group continues to see strong demand • Residential mortgage banking group capitalizing on continued demand for refinancings • Sale of commercial FHA origination platform • Announcement of branch and facilities optimization plan Asset Quality • 69% decline in total deferred loans • Increase in NPAs primarily due to three relationships • Allowance for credit losses strengthened to 1.07% of total loans • Net income of $86 thousand, or $0.00 diluted EPS, reflect $13.9 million in one - time charges primarily related to branch and facilities optimization plan • Adjusted earnings (1) of $12.0 million, or $0.52 diluted EPS, excluding charges primarily related to branch and facilities optimization plan Notes: (1) Represents a non - GAAP financial measure. See “Non - GAAP Reconciliation” in the appendix. Solid Balance Sheet Growth • Annualized loan growth of 8.4%, driven by growth in equipment finance, consumer and warehouse lines to commercial FHA lenders • Annualized deposit growth of 6.9%, driven by continued increases in core deposits

4 2020 Optimization and Efficiency Initiatives 4 Sale of Commercial FHA Loan Origination Platform • Sale of origination platform to Dwight Capital • No significant gain on sale (reduced goodwill by $10.9 million) • $3.0 million tax charge on sale • Retain servicing and low - cost deposits • Ongoing warehouse and servicing deposit relationship with Dwight Capital • Ongoing commercial FHA revenue of $1.2 million for servicing • $8 - $9 million expense reduction Branch Network and Facilities Optimization • Pending consolidation of 13 branches (20% of network and ~30 FTEs) • Most affected branches located within 3 miles of another Midland branch • 4 of the branches have been closed since March due to pandemic • Expected to retain 70% to 80% of deposits from consolidated branches • Exiting three corporate locations including St. Louis and Denver • Restructuring charge in 3Q20 of $13.6 million • Other branch renovation and upgrading projects beginning in 4Q20 and continuing in 2021 at a cost of $4 million • $6 million expense reduction in 2021 Initiative Details FY 2021 Expected Financial Impact

5 Paycheck Protection Program Overview Paycheck Protection Program (as of 9/30/20) Loans Outstanding $277.6 million Number of Loans 2,295 Average Loan Size $120,938 Total Fees Earned $9.8 million Remaining Fees to be Recognized $7.6 million Impact on 3Q20 Financials At or for the Three Months Ended 9/30/20 Metrics Excluding PPP Impact Total Loans $4.94 billion $4.66 billion Average Loans $4.80 billion $4.53 billion Net Interest Income FTE (1) $50.0 million $48.5 million Net Interest Margin (1) 3.33% 3.36% ACL/Total Loans 1.07% 1.12% 1. Loan fees and deferred loan origination costs being amortized over an estimated 24 - month life of PPP loans Paycheck Protection Program Loan Forgiveness (as of 10/9/20) Loans Submitted to SBA $71.6 million Loans Forgiven by SBA $3.1 million Estimated Percentage to be Forgiven During 4Q20 25% - 30%

6 Loan Deferral Overview Total Loan Deferrals As of June 30, 2020 As of September 30, 2020 Percentage Change Total Loans Deferred $898.4 million $279.3 million (68.9%) % of Total Loans 18.6% 5.7% (69.7%) Deferrals by Industry (as of September 30, 2020) Hotels/Motels $105.6 38% Transit & Ground Passenger $55.5 20% RE Rental & Leasing $24.7 9% Assisted Living $20.7 7% All Others <4% $72.8 26% ($ in millions) Deferral Type (as of September 30, 2020) Full Payment Deferral $237.9 million Interest Only Deferral $41.4 million
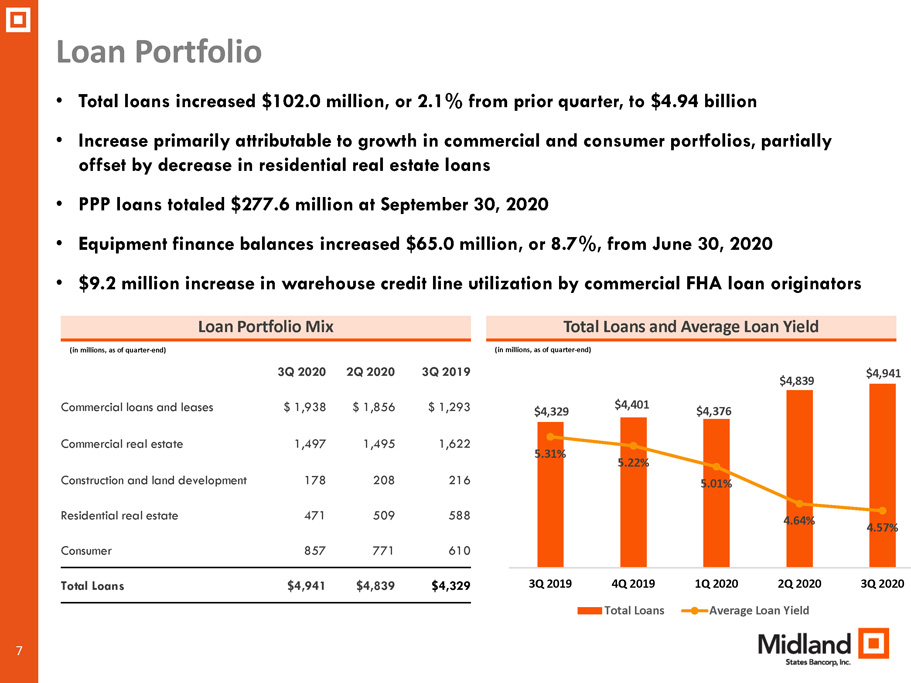
7 3Q 2020 2Q 2020 3Q 2019 Commercial loans and leases $ 1,938 $ 1,856 $ 1,293 Commercial real estate 1,497 1,495 1,622 Construction and land development 178 208 216 Residential real estate 471 509 588 Consumer 857 771 610 Total Loans $4,941 $4,839 $4,329 Loan Portfolio Total Loans and Average Loan Yield • Total loans increased $102.0 million, or 2.1% from prior quarter, to $4.94 billion • Increase primarily attributable to growth in commercial and consumer portfolios, partially offset by decrease in residential real estate loans • PPP loans totaled $277.6 million at September 30, 2020 • Equipment finance balances increased $65.0 million, or 8.7%, from June 30, 2020 • $9.2 million increase in warehouse credit line utilization by commercial FHA loan originators Loan Portfolio Mix (in millions, as of quarter - end) (in millions, as of quarter - end) $4,329 $4,401 $4,376 $4,839 $4,941 5.31% 5.22% 5.01% 4.64% 4.57% 3Q 2019 4Q 2019 1Q 2020 2Q 2020 3Q 2020 Total Loans Average Loan Yield

8 Midland Equipment Finance Portfolio Overview ($ in millions) Portfolio Characteristics (as of 9/30/20) Nationwide portfolio providing financing solutions to equipment vendors and end - users Total Outstanding Loans and Leases $815.5 million (16.5% of total loans) Number of Loans and Leases 6,210 Average Loan/Lease Size $132,603 Largest Loan/Lease $1.8 million Weighted Average Rate 4.97% Avg. FICO Score 604 Transit and Ground Passenger $52.9 70.3% General Freight Trucking $5.4 7.2% Manufacturing $4.8 6.4% Arts, Ent. & Recreation $2.5 3.3% All Others <3% of Total $9.6 12.8% Total Deferred Loans and Leases As of June 30, 2020 As of September 30, 2020 Percentage Change Total Deferrals $233.0 million $75.2 million (67.7%) Percentage of portfolio 31.5% 9.2% (70.8%) Equipment Finance Deferrals by Industry (as of September 30, 2020)

9 Hotel/Motel Portfolio Overview Deferrals by Chain Scale ($ in millions) Upper Midscale Chain $82.5 78% Upscale Chain $11.6 11% Midscale Chain $9.1 9% Other $2.4 2% Portfolio Characteristics (CRE & C&I) (as of 9/30/20) Total Outstanding $187.6 million (3.8% of total loans) Number of Loans 61 Average Loan Size $2.2 million Largest Loan $11.1 million Average LTV 58% Total Deferred Loans as of 6/30/20 $146.2 million (84.8% of portfolio) Total Deferred Loans as of 9/30/20 $105.6 million (56.3% of portfolio) Average LTV of Deferred Loans as of 9/30/20 50% Deferred Loans Making I/O or Other Payments $19.2 million (18.2% of deferrals) Portfolio by State IL $98.5 52% MO $44.1 24% MI $11.9 6% WI $11.1 6% CO $11.1 6% Other $10.9 6%

10 GreenSky Consumer Loan Portfolio Overview Delinquency Rate (greater than 60 days) Portfolio Characteristics (as of 9/30/20) Total Outstanding $768.6 million (15.6% of total loans) Number of Loans 330,751 Average Loan Size $2,324 Average FICO Score 763 Total Deferred Loans (as of June 30, 2020) $35.8 million (5.3% of portfolio) Total Deferred Loans (as of September 30, 2020) $8.1 million (1.1% of portfolio) ▪ Average FICO score of 763 ▪ No losses to MSBI in 9 year history of the portfolio ▪ Portfolio can be sold to provide liquidity; Loan sales were executed at par in Sep and Oct 2020 Prime Credit 0.81% 0.66% 0.61% 0.50% 0.47% 0.34% 0.35% 0.33% 0.42% Jan 2020 Feb 2020 Mar 2020 Apr 2020 May 2020 Jun 2020 Jul 2020 Aug 2020 Sep 2020 ▪ Cash flow waterfall structure » Cash flow from portfolio covers servicing fee, credit losses and our target margin » Excess cash flow is an incentive fee to GreenSky that is available to cover additional losses » GreenSky received incentive fees in 20 of past 21 months including every month in 2020 ▪ Escrow deposits » Escrow deposits absorb losses in excess of cash flow waterfall » Escrow account totaled $30.6 million at 9/30/20 or 4.0% of the portfolio Credit Enhancement

11 3Q 2020 2Q 2020 3Q 2019 Noninterest - bearing demand $ 1,355 $ 1,273 $ 1,015 Interest - bearing: Checking 1,581 1,485 1,222 Money market 827 877 754 Savings 581 595 527 Time 662 690 833 Brokered time 23 23 94 Total Deposits $5,029 $4,943 $4,445 Total Deposits Total Deposits and Cost of Deposits • Total deposits increased $85.6 million, or 1.7% from prior quarter, to $5.03 billion • Growth in deposits attributable to increase in commercial FHA servicing deposits • Continued intentional run - off of higher - cost time deposits, replaced with lower - cost core deposits Deposit Mix (in millions, as of quarter - end) (in millions, as of quarter - end) $4,445 $4,544 $4,651 $4,943 $5,029 0.84% 0.80% 0.74% 0.45% 0.34% 3Q 2019 4Q 2019 1Q 2020 2Q 2020 3Q 2020 Total Deposits Cost of Deposits
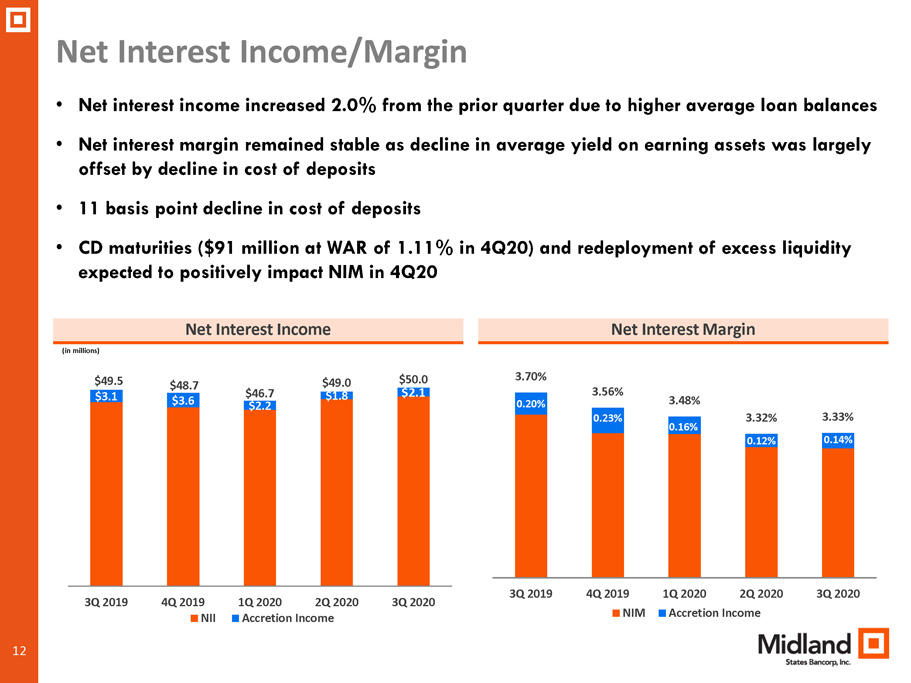
12 $3.1 $3.6 $2.2 $1.8 $2.1 $49.5 $48.7 $46.7 $49.0 $50.0 3Q 2019 4Q 2019 1Q 2020 2Q 2020 3Q 2020 NII Accretion Income 0.20% 0.23% 0.16% 0.12% 0.14% 3.70% 3.56% 3.48% 3.32% 3.33% 3Q 2019 4Q 2019 1Q 2020 2Q 2020 3Q 2020 NIM Accretion Income • Net interest income increased 2.0% from the prior quarter due to higher average loan balances • Net interest margin remained stable as decline in average yield on earning assets was largely offset by decline in cost of deposits • 11 basis point decline in cost of deposits • CD maturities ($91 million at WAR of 1.11% in 4Q20) and redeployment of excess liquidity expected to positively impact NIM in 4Q20 Net Interest Income/Margin Net Interest Margin Net Interest Income (in millions)

13 $6.00 $5.38 $5.68 $5.70 $5.56 3Q 2019 4Q 2019 1Q 2020 2Q 2020 3Q 2020 $3,281 $3,410 $2,968 $3,254 $3,261 3Q 2019 4Q 2019 1Q 2020 2Q 2020 3Q 2020 • During 3Q20, assets under administration increased $7.1 million, primarily due to market performance • Wealth Management revenue remains a consistent source of noninterest income • Slight variation in quarter - to - quarter revenue primarily relates to seasonal fees related to tax preparation Wealth Management Wealth Management Revenue Assets Under Administration (in millions) (in millions )

14 Noninterest Income • Noninterest income reduced 2.5% from prior quarter, due to lower Commercial FHA revenue resulting from the sale of the origination platform at the end of August and a $1.4 million impairment of commercial mortgage servicing rights (“MSRs”) • Excluding the impact of the impairment of commercial MSRs, noninterest income increased due to higher residential mortgage banking and community banking revenue • Increase in economic activity resulting in higher community bank revenue including service charges and interchange fees Noninterest Income (in millions) $19.6 $19.0 $17.1 $19.4 $18.9 3Q 2019 4Q 2019 1Q 2020 2Q 2020 3Q 2020 All Other Community Banking Revenue Residential Mortgage Commercial FHA Wealth Management Notes: (1) Represents service charges, interchange revenue, net gain (loss) on sale of investment securities, and other income (2) Excludes $8.5 million impairment of commercial mortgage servicing rights (1) (2)
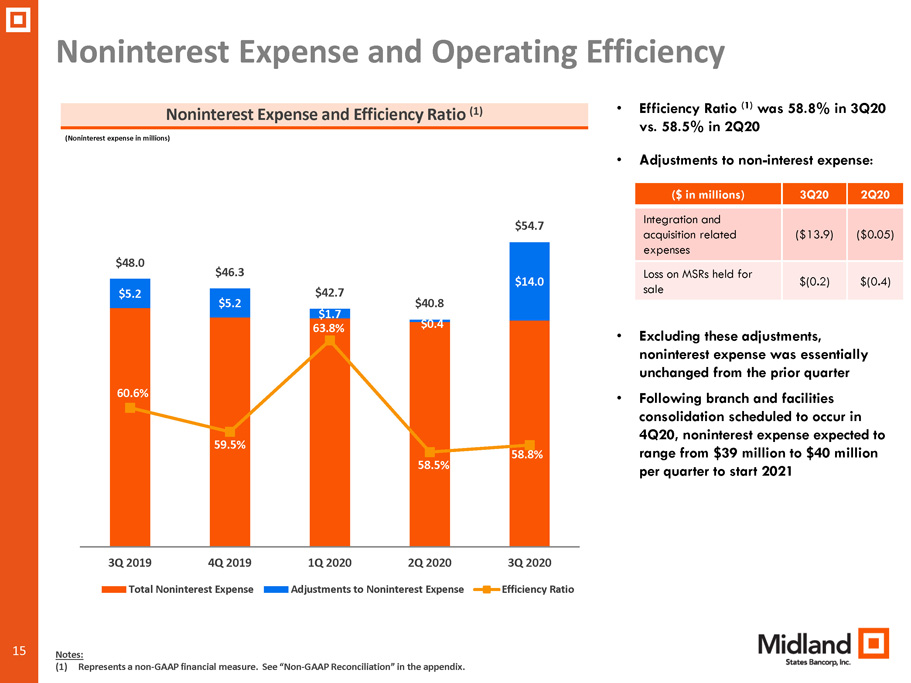
15 Noninterest Expense and Operating Efficiency • Efficiency Ratio (1) was 58.8% in 3Q20 vs. 58.5% in 2Q20 • Adjustments to non - interest expense: • Excluding these adjustments, noninterest expense was essentially unchanged from the prior quarter • Following branch and facilities consolidation scheduled to occur in 4Q20, noninterest expense expected to range from $39 million to $40 million per quarter to start 2021 Noninterest Expense and Efficiency Ratio (1) (Noninterest expense in millions) $5.2 $5.2 $1.7 $0.4 $14.0 $48.0 $46.3 $42.7 $40.8 $54.7 60.6% 59.5% 63.8% 58.5% 58.8% 3Q 2019 4Q 2019 1Q 2020 2Q 2020 3Q 2020 Total Noninterest Expense Adjustments to Noninterest Expense Efficiency Ratio Notes: (1) Represents a non - GAAP financial measure. See “Non - GAAP Reconciliation” in the appendix. ($ in millions) 3Q20 2Q20 Integration and acquisition related expenses ($13.9) ($0.05) Loss on MSRs held for sale $(0.2) $(0.4)

16 Asset Quality NCO / Average Loans • Nonperforming loans/total loans increased to 1.36% from 1.25% at the end of the prior quarter, primarily due to the addition of three CRE loans • Net charge - offs of $5.3 million, or 0.44% of average loans, reflects charge - offs taken against the three CRE loans moved into NPL in 3Q20 • Provision for loan losses of $11.0 million in 3Q20 primarily reflects the higher level of net charge - offs experienced in the quarter • At 9/30/20, approximately 96% of ACL was allocated to general reserves Nonperforming Loans / Total Loans (Total Loans as of quarter - end) 1.04% 0.96% 1.33% 1.25% 1.36% 3Q 2019 4Q 2019 1Q 2020 2Q 2020 3Q 2020 0.49% 0.20% 1.18% 0.26% 0.44% 3Q 2019 4Q 2019 1Q 2020 2Q 2020 3Q 2020

17 Changes in Allowance for Credit Losses ACL 6/30/20 ACL 9/30/20 ($ in thousands) Specific Reserves Portfolio Changes Economic Factors ▪ Changes to specific reserves ▪ New loans ▪ Changes in credit quality including risk downgrades and deferrals ▪ Aging of existing portfolio ▪ Other charge - offs and recoveries ▪ Changes to macro - economic variables and forecasts ▪ Changes to other economic qualitative factors

18 ACL by Portfolio Portfolio Total Loans at 9/30/20 ACL % of Total Loans Total Loans at 6/30/20 ACL % of Total Loans Commercial $ 729,745 $ 7,846 1.08% $ 715,206 $ 4,916 0.69% Warehouse Lines 136,761 - 0.00% 127,568 - 0.00% Commercial Other 813,412 10,014 1.23% 767,175 7,297 0.95% Equipment Finance 420,003 9,285 2.21% 376,499 6,553 1.74% Paycheck Protection Program 277,553 416 0.15% 276,007 414 0.15% Lease Financing 395,534 4,814 1.22% 374,054 6,155 1.65% CRE non - owner occupied 824,311 12,533 1.52% 804,147 10,247 1.27% CRE owner occupied 442,692 4,927 1.11% 465,217 6,378 1.37% Multi - family 149,290 3,475 2.33% 142,194 2,982 2.10% Farmland 80,465 454 0.56% 83,625 689 0.82% Construction and Land Development 177,894 1,802 1.01% 207,593 1,512 0.73% Residential RE First Lien 380,402 3,702 0.97% 411,635 3,960 0.96% Other Residential 90,427 877 0.97% 97,818 870 0.89% Consumer 82,912 388 0.47% 81,447 354 0.43% Consumer Other (1) 774,382 1,939 0.25% 689,312 1,733 0.25% Total Loans 4,941,466 52,771 1.07% 4,839,423 47,093 0.97% Loans (excluding GreenSky, PPP and warehouse lines) 3,698,097 50,299 1.36% 3,698,092 44,835 1.21% ($ in thousands) Notes: (1) Primarily consists of loans originated through GreenSky relationship

19 Outlook and Near - Term Priorities • Maintain strong capital and liquidity positions to continue supporting clients and communities through the duration of the COVID - 19 pandemic • Continue capitalizing on areas of near - term demand to drive additional loan growth • Implement branch network and corporate facilities reduction plan • Continue evaluating opportunities to optimize our cost structure • Position Midland for more consistent financial performance and earnings growth as the economy strengthens 19

20 APPENDIX

21 Commercial Loans and Leases by Industry 21 RE / Rental & Leasing 21.3% All Others 11.5% Manufacturing 7.8% Construction - General 7.5% Accommodation & Food Svcs 7.3% Assisted Living 6.9% Finance and Insurance 6.9% Retail Trade 6.3% Ag., Forestry, & Fishing 5.2% General Freight Trucking 5.0% Health Care 4.8% Trans. / Ground Passenger 3.6% Other Services 3.5% Wholesale Trade 2.4% Industries as a percentage of Commercial, CRE and Equipment Finance Loans and Leases as of 9/30/20

22 Commercial Real Estate Portfolio by Collateral Type 22 Retail 15.5% Assisted Living 11.3% Industrial / Warehouse 10.0% Multi - Family 9.4% Hotel/Motel 9.4% All Others 9.0% Office 6.8% Residential 1 - 4 Family 6.2% C - Store / Gas Station 4.1% Farmland 4.0% Medical Building 3.7% Mixed Use / Other 2.8% Car Dealerships 2.7% Developed Land 2.4% Raw Land 2.2% Church 0.5% Collateral type as a percentage of the Commercial Real Estate and Construction Portfolio as of 9/30/20 CRE Concentration (as of 9/30/20) CRE as a % of Total Loans 30.3% CRE as a % of Total Risk - Based Capital (1) 174.6% Notes: (1) Represents non - owner occupied CRE loans only

23 Capital and Liquidity Overview Capital Ratios (as of 9/30/20) Liquidity Sources (as of 9/30/20) 6.61% 8.18% 7.72% 9.40% 13.34% 10.96% 9.01% 10.96% 11.82% 0.00% 5.00% 10.00% 15.00% TCE/TA Tier 1 Common Tier 1 Leverage Tier 1 RBC Total RBC Consolidated Bank Level ($ in millions) Cash and Cash Equivalents $ 416.2 Unpledged Securities 188.7 FHLB Committed Liquidity 451.2 FRB Discount Window Availability 52.7 Primary Liquidity 1,153.8 FRB – PPP Liquidity Facility (1) 250.0 Secondary Liquidity 250.0 Total Estimated Liquidity $ 1,403.8 Conditional Funding Based on Market Conditions Additional Credit Facility $ 250.0 Brokered CDs (additional capacity) $ 500.0 (1) Enrolled in PPP facility – loans available to submit Other Liquidity Holding Company Cash Position of $62.6 Million

24 Adjusted Earnings Reconciliation (dollars in thousands, except per share data) Income before income taxes - GAAP $ 3,270 $ 15,993 $ 2,005 $ 16,071 $ 16,670 Adjustments to noninterest income: Gain on sales of investment securities, net 1,721 - - 635 25 Other (17) 11 (13) (6) - Total adjustments to noninterest income 1,704 11 (13) 629 25 Adjustments to noninterest expense: Loss (gain) on mortgage servicing rights held for sale 188 391 496 95 (70) Loss on repurchase of subordinated debt - - 193 1,778 - Impairment related to branch optimization 12,651 60 146 - 3,229 Integration and acquisition expenses 1,199 (6) 885 3,332 2,063 Total adjustments to noninterest expense 14,038 445 1,720 5,205 5,222 Adjusted earnings pre tax 15,604 16,427 3,738 20,647 21,867 Adjusted earnings tax 3,581 3,543 932 4,537 5,445 Adjusted earnings - non-GAAP 12,023 12,884 2,806 16,110 16,422 Preferred stock dividends, net - - - - (22) Adjusted earnings available to common shareholders - non-GAAP $ 12,023 $ 12,884 $ 2,806 $ 16,110 $ 16,444 Adjusted diluted earnings per common share $ 0.52 $ 0.55 $ 0.11 $ 0.64 $ 0.66 Adjusted return on average assets 0.72 % 0.78 % 0.19 % 1.04 % 1.09 % Adjusted return on average shareholders' equity 7.56 % 8.20 % 1.73 % 9.71 % 10.01 % Adjusted return on average tangible common equity 11.04 % 12.14 % 2.53 % 14.15 % 14.52 % 2020 2020 2020 2019 2019 September 30, June 30, March 31, December 31, September 30, MIDLAND STATES BANCORP, INC.RECONCILIATIONS OF NON-GAAP FINANCIAL MEASURES (unaudited) For the Quarter Ended
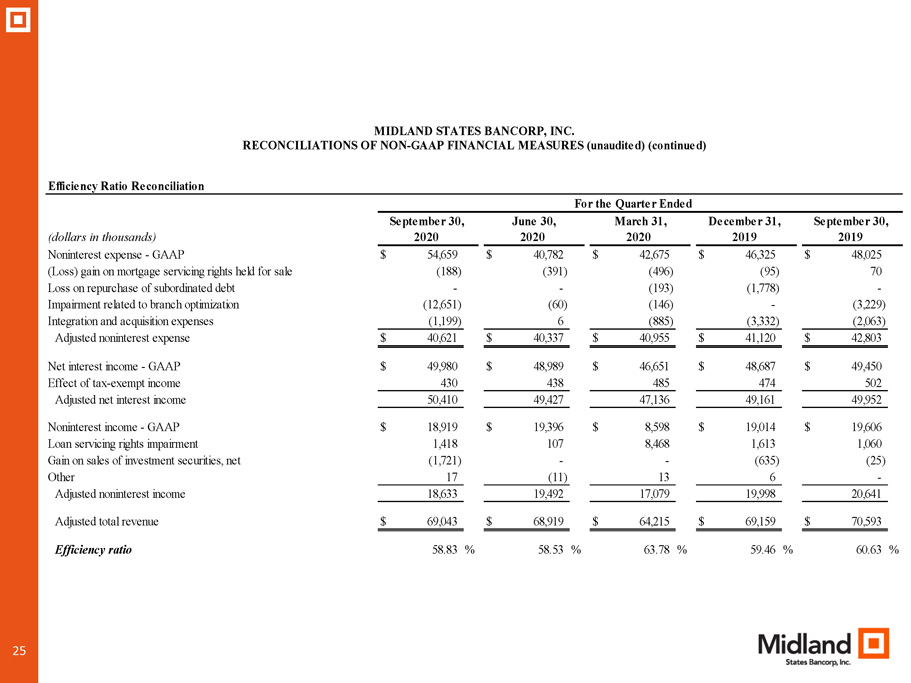
25 Efficiency Ratio Reconciliation (dollars in thousands) Noninterest expense - GAAP $ 54,659 $ 40,782 $ 42,675 $ 46,325 $ 48,025 (Loss) gain on mortgage servicing rights held for sale (188) (391) (496) (95) 70 Loss on repurchase of subordinated debt - - (193) (1,778) - Impairment related to branch optimization (12,651) (60) (146) - (3,229) Integration and acquisition expenses (1,199) 6 (885) (3,332) (2,063) Adjusted noninterest expense $ 40,621 $ 40,337 $ 40,955 $ 41,120 $ 42,803 Net interest income - GAAP $ 49,980 $ 48,989 $ 46,651 $ 48,687 $ 49,450 Effect of tax-exempt income 430 438 485 474 502 Adjusted net interest income 50,410 49,427 47,136 49,161 49,952 Noninterest income - GAAP $ 18,919 $ 19,396 $ 8,598 $ 19,014 $ 19,606 Loan servicing rights impairment 1,418 107 8,468 1,613 1,060 Gain on sales of investment securities, net (1,721) - - (635) (25) Other 17 (11) 13 6 - Adjusted noninterest income 18,633 19,492 17,079 19,998 20,641 Adjusted total revenue $ 69,043 $ 68,919 $ 64,215 $ 69,159 $ 70,593 Efficiency ratio 58.83 % 58.53 % 63.78 % 59.46 % 60.63 % 2020 2020 2020 2019 2019 September 30, June 30, March 31, December 31, September 30, MIDLAND STATES BANCORP, INC.RECONCILIATIONS OF NON-GAAP FINANCIAL MEASURES (unaudited) (continued) For the Quarter Ended
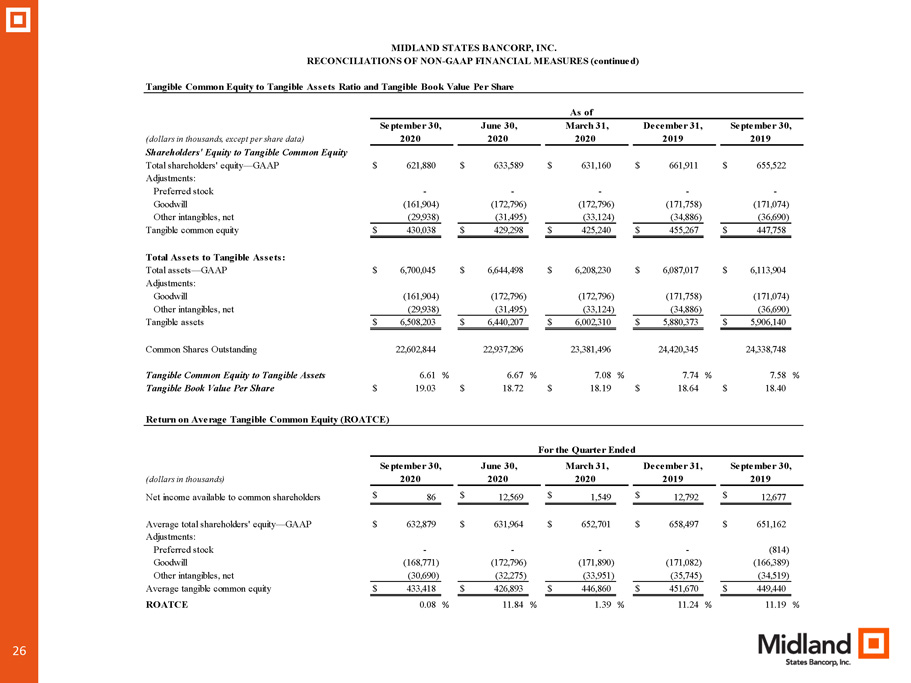
26 Tangible Common Equity to Tangible Assets Ratio and Tangible Book Value Per Share (dollars in thousands, except per share data) Shareholders' Equity to Tangible Common Equity Total shareholders' equity—GAAP $ 621,880 $ 633,589 $ 631,160 $ 661,911 $ 655,522 Adjustments: Preferred stock - - - - - Goodwill (161,904) (172,796) (172,796) (171,758) (171,074) Other intangibles, net (29,938) (31,495) (33,124) (34,886) (36,690) Tangible common equity $ 430,038 $ 429,298 $ 425,240 $ 455,267 $ 447,758 Total Assets to Tangible Assets: Total assets—GAAP $ 6,700,045 $ 6,644,498 $ 6,208,230 $ 6,087,017 $ 6,113,904 Adjustments: Goodwill (161,904) (172,796) (172,796) (171,758) (171,074) Other intangibles, net (29,938) (31,495) (33,124) (34,886) (36,690) Tangible assets $ 6,508,203 $ 6,440,207 $ 6,002,310 $ 5,880,373 $ 5,906,140 Common Shares Outstanding 22,602,844 22,937,296 23,381,496 24,420,345 24,338,748 Tangible Common Equity to Tangible Assets 6.61 % 6.67 % 7.08 % 7.74 % 7.58 % Tangible Book Value Per Share $ 19.03 $ 18.72 $ 18.19 $ 18.64 $ 18.40 Return on Average Tangible Common Equity (ROATCE) (dollars in thousands) Net income available to common shareholders $ 86 $ 12,569 $ 1,549 $ 12,792 $ 12,677 Average total shareholders' equity—GAAP $ 632,879 $ 631,964 $ 652,701 $ 658,497 $ 651,162 Adjustments: Preferred stock - - - - (814) Goodwill (168,771) (172,796) (171,890) (171,082) (166,389) Other intangibles, net (30,690) (32,275) (33,951) (35,745) (34,519) Average tangible common equity $ 433,418 $ 426,893 $ 446,860 $ 451,670 $ 449,440 ROATCE 0.08 % 11.84 % 1.39 % 11.24 % 11.19 % MIDLAND STATES BANCORP, INC. RECONCILIATIONS OF NON-GAAP FINANCIAL MEASURES (continued) As of September 30, June 30, March 31, December 31, September 30, 2020 2020 2020 2019 2019 For the Quarter Ended 2020 2020 2020 2019 2019 September 30, June 30, March 31, December 31, September 30,