Attached files
| file | filename |
|---|---|
| EX-99.1 - EX-99.1 - First Western Financial Inc | myfw-20201022xex99d1.htm |
| 8-K - 8-K - First Western Financial Inc | myfw-20201022x8k.htm |
Exhibit 99.2
| First Western Financial, Inc. The First, Western-Based Private Trust Bank Third Quarter 2020 Conference Call |

| Safe Harbor 2 This presentation contains “forward-looking statements” within the meaning of Section 27A of the Securities Act of 1933, as amended, and Section 21E of the Securities Exchange Act of 1934, as amended. These forward-looking statements reflect the current views of First Western Financial, Inc.’s (“First Western”) management with respect to, among other things, future events and First Western’s financial performance. These statements are often, but not always, made through the use of words or phrases such as “may,” “should,” “could,” “predict,” “potential,” “believe,” “will likely result,” “expect,” “continue,” “will,” “anticipate,” “seek,” “estimate,” “intend,” “plan,” “project,” “future” “forecast,” “goal,” “target,” “would” and “outlook,” or the negative variations of those words or other comparable words of a future or forward-looking nature. These forward-looking statements are not historical facts, and are based on current expectations, estimates and projections about First Western’s industry, management’s beliefs and certain assumptions made by management, many of which, by their nature, are inherently uncertain and beyond First Western’s control. Accordingly, First Western cautions you that any such forward-looking statements are not guarantees of future performance and are subject to risks, assumptions and uncertainties that are difficult to predict. Although First Western believes that the expectations reflected in these forward-looking statements are reasonable as of the date made, actual results may prove to be materially different from the results expressed or implied by the forward-looking statements. Those following risks and uncertainties, among others, could cause actual results and future events to differ materially from those set forth or contemplated in the forward-looking statements: the COVID-19 pandemic and its effects; integration risks in connection with acquisitions; the risk of geographic concentration in Colorado, Arizona, Wyoming and California; the risk of changes in the economy affecting real estate values and liquidity; the risk in our ability to continue to originate residential real estate loans and sell such loans; risks specific to commercial loans and borrowers; the risk of claims and litigation pertaining to our fiduciary responsibilities; the risk of competition for investment managers and professionals; the risk of fluctuation in the value of our investment securities; the risk of changes in interest rates; and the risk of the adequacy of our allowance for credit losses and the risk in our ability to maintain a strong core deposit base or other low-cost funding sources. Additional information regarding these and other risks and uncertainties to which our business and future financial performance are subject is contained in our Annual Report on Form 10-K filed with the U.S. Securities and Exchange Commission (“SEC”) on March 12, 2020 and other documents we file with the SEC from time to time. All subsequent written and oral forward-looking statements attributable to First Western or persons acting on First Western’s behalf are expressly qualified in their entirety by this paragraph. Forward-looking statements speak only as of the date of this presentation. First Western undertakes no obligation to publicly update or otherwise revise any forward-looking statements, whether as a result of new information, future events or otherwise (except as required by law). Certain of the information contained herein may be derived from information provided by industry sources. The Company believes that such information is accurate and the sources from which it has been obtained are reliable; however, the Company cannot guaranty the accuracy of such information and has not independently verified such information. This presentation contains certain non-GAAP financial measures intended to supplement, not substitute for, comparable GAAP measures. Reconciliations of non-GAAP financial measures to GAAP financial measures are provided at the end of this presentation. Numbers in the presentation may not sum due to rounding. |
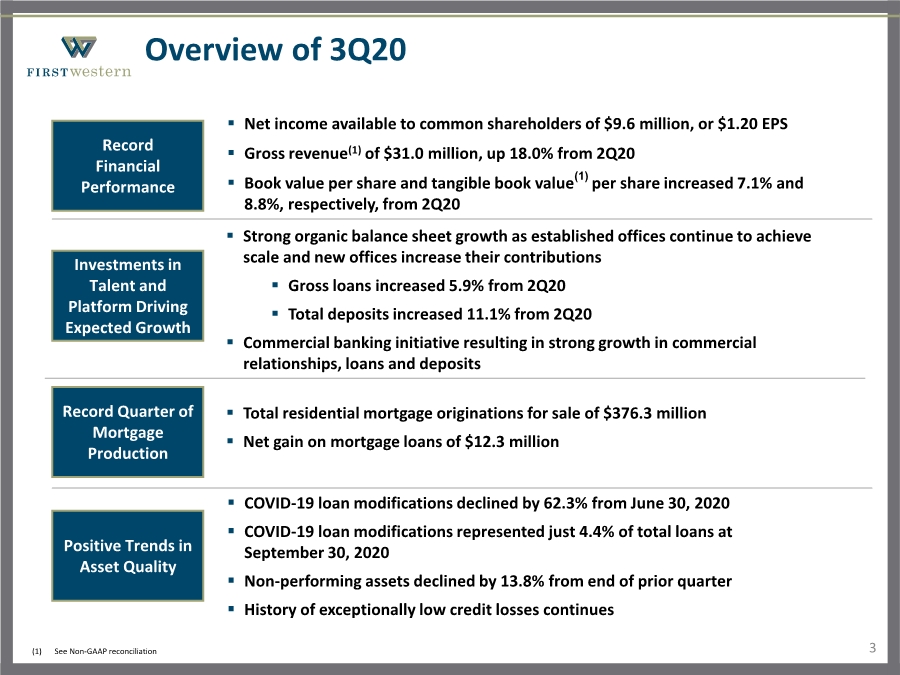
| Overview of 3Q20 Record Quarter of Mortgage Production Record Financial Performance Investments in Talent and Platform Driving Expected Growth . Strong organic balance sheet growth as established offices continue to achieve scale and new offices increase their contributions . Gross loans increased 5.9% from 2Q20 . Total deposits increased 11.1% from 2Q20 . Commercial banking initiative resulting in strong growth in commercial relationships, loans and deposits . COVID-19 loan modifications declined by 62.3% from June 30, 2020 . COVID-19 loan modifications represented just 4.4% of total loans at September 30, 2020 . Non-performing assets declined by 13.8% from end of prior quarter . History of exceptionally low credit losses continues Positive Trends in Asset Quality . Total residential mortgage originations for sale of $376.3 million . Net gain on mortgage loans of $12.3 million 3 . Net income available to common shareholders of $9.6 million, or $1.20 EPS . Gross revenue(1) of $31.0 million, up 18.0% from 2Q20 . Book value per share and tangible book value(1) per share increased 7.1% and 8.8%, respectively, from 2Q20 (1) See Non-GAAP reconciliation |
| Net Income Available to Common Shareholders and Earnings per Share 4 Net Income Available to Common Shareholders . Record financial performance despite ongoing impact of COVID-19 pandemic . Net income of $9.6 million, or $1.20 diluted earnings per share, in 3Q20 . Mortgage activity providing significant contribution to current earnings, while balance sheet growth and improving leverage demonstrating sustainable progress to improving profitability and returns Earnings per Share (in thousands) $438 $245 $2,406 $2,572 $1,772 $8,941 $9,630 Q3 2019 Q4 2019 Q1 2020 Q2 2020 Q3 2020 Net Income Adjustments to Net Income (1) (1) See Non-GAAP reconciliation (1) $0.05 $0.03 $0.30 $0.32 $0.22 $1.13 $1.20 Q3 2019 Q4 2019 Q1 2020 Q2 2020 Q3 2020 Net Income Adjustments to Net Income (1) (1) |

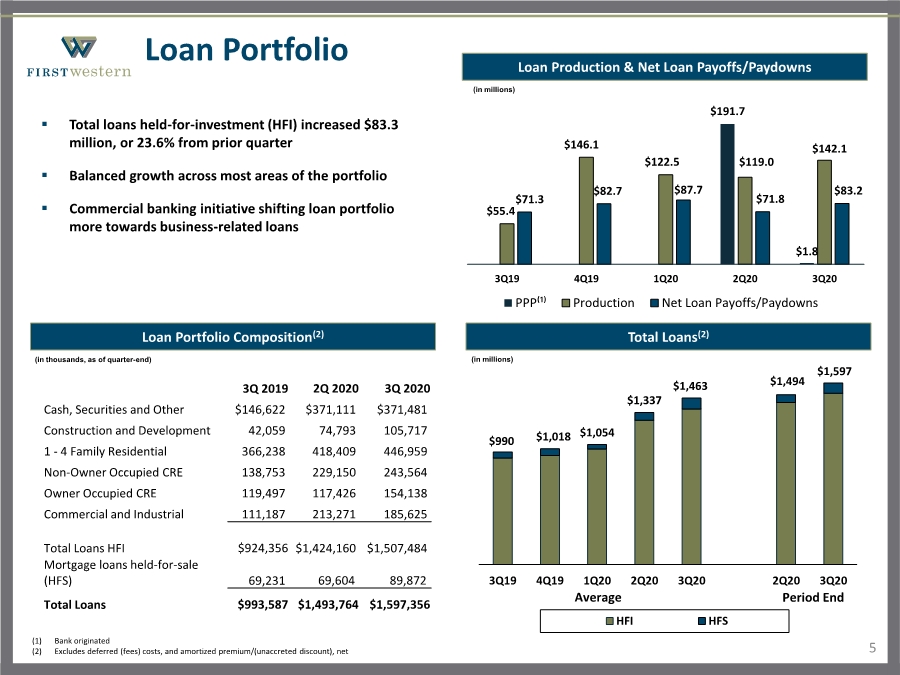
| $990 $1,018 $1,054 $1,337 $1,463 $1,494 $1,597 3Q19 4Q19 1Q20 2Q20 3Q20 2Q20 3Q20 HFI HFS Average Period End Loan Portfolio 5 Loan Portfolio Composition(2) . Total loans held-for-investment (HFI) increased $83.3 million, or 23.6% from prior quarter . Balanced growth across most areas of the portfolio . Commercial banking initiative shifting loan portfolio more towards business-related loans (in thousands, as of quarter-end) Total Loans(2) (in millions) (1) Bank originated (2) Excludes deferred (fees) costs, and amortized premium/(unaccreted discount), net 3Q 2019 2Q 2020 3Q 2020 Cash, Securities and Other $146,622 $371,111 $371,481 Construction and Development 42,059 74,793 105,717 1 - 4 Family Residential 366,238 418,409 446,959 Non-Owner Occupied CRE 138,753 229,150 243,564 Owner Occupied CRE 119,497 117,426 154,138 Commercial and Industrial 111,187 213,271 185,625 Total Loans HFI $924,356 $1,424,160 $1,507,484 Mortgage loans held-for-sale (HFS) 69,231 69,604 89,872 Total Loans $993,587 $1,493,764 $1,597,356 Loan Production & Net Loan Payoffs/Paydowns $191.7 $1.8 $55.4 $146.1 $122.5 $119.0 $142.1 $71.3 $82.7 $87.7 $71.8 $83.2 3Q19 4Q19 1Q20 2Q20 3Q20 PPP⁽¹⁾ Production Net Loan Payoffs/Paydowns (in millions) |
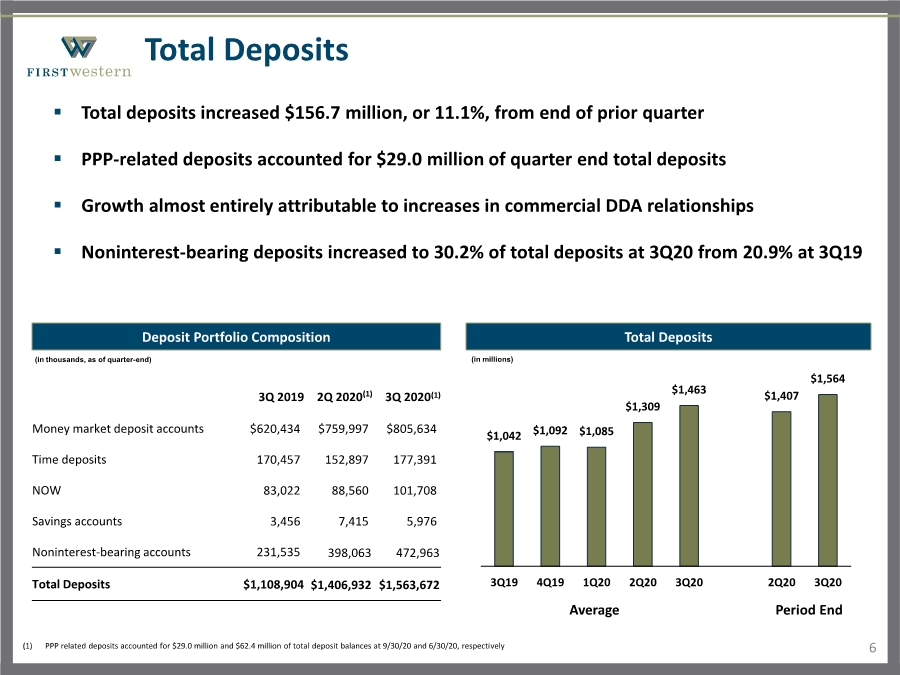
| $1,042 $1,092 $1,085 $1,309 $1,463 $1,407 $1,564 3Q19 4Q19 1Q20 2Q20 3Q20 2Q20 3Q20 Average Period End Total Deposits 6 Deposit Portfolio Composition . Total deposits increased $156.7 million, or 11.1%, from end of prior quarter . PPP-related deposits accounted for $29.0 million of quarter end total deposits . Growth almost entirely attributable to increases in commercial DDA relationships . Noninterest-bearing deposits increased to 30.2% of total deposits at 3Q20 from 20.9% at 3Q19 3Q 2019 2Q 2020(1) 3Q 2020(1) Money market deposit accounts $620,434 $759,997 $805,634 Time deposits 170,457 152,897 177,391 NOW 83,022 88,560 101,708 Savings accounts 3,456 7,415 5,976 Noninterest-bearing accounts 231,535 398,063 472,963 Total Deposits $1,108,904 $1,406,932 $1,563,672 (in thousands, as of quarter-end) Total Deposits (in millions) (1) PPP related deposits accounted for $29.0 million and $62.4 million of total deposit balances at 9/30/20 and 6/30/20, respectively |
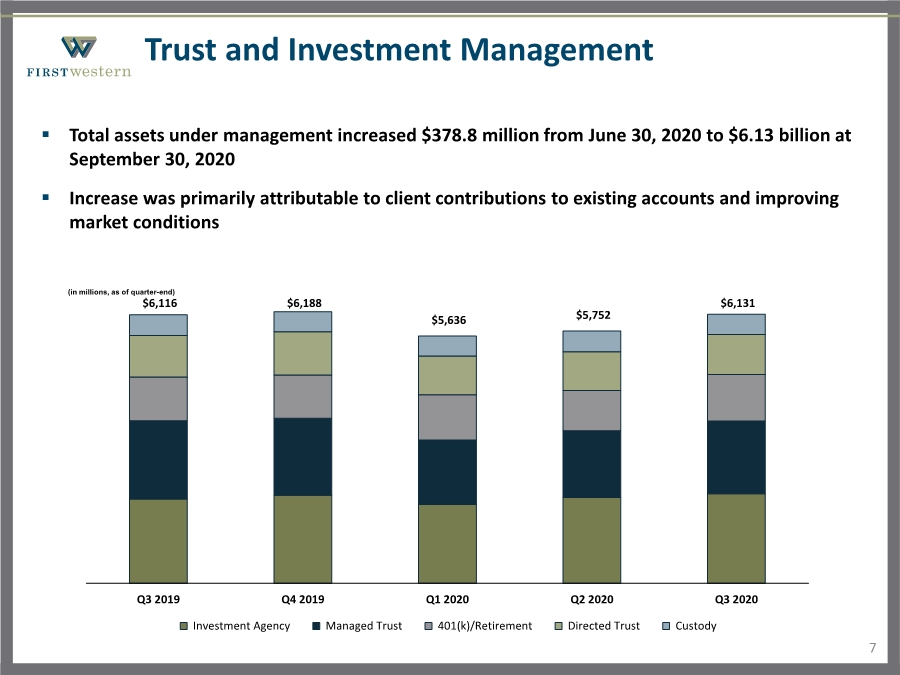
| Trust and Investment Management . Total assets under management increased $378.8 million from June 30, 2020 to $6.13 billion at September 30, 2020 . Increase was primarily attributable to client contributions to existing accounts and improving market conditions $6,116 $6,188 $5,636 $5,752 $6,131 Q3 2019 Q4 2019 Q1 2020 Q2 2020 Q3 2020 Investment Agency Managed Trust 401(k)/Retirement Directed Trust Custody (in millions, as of quarter-end) 7 |
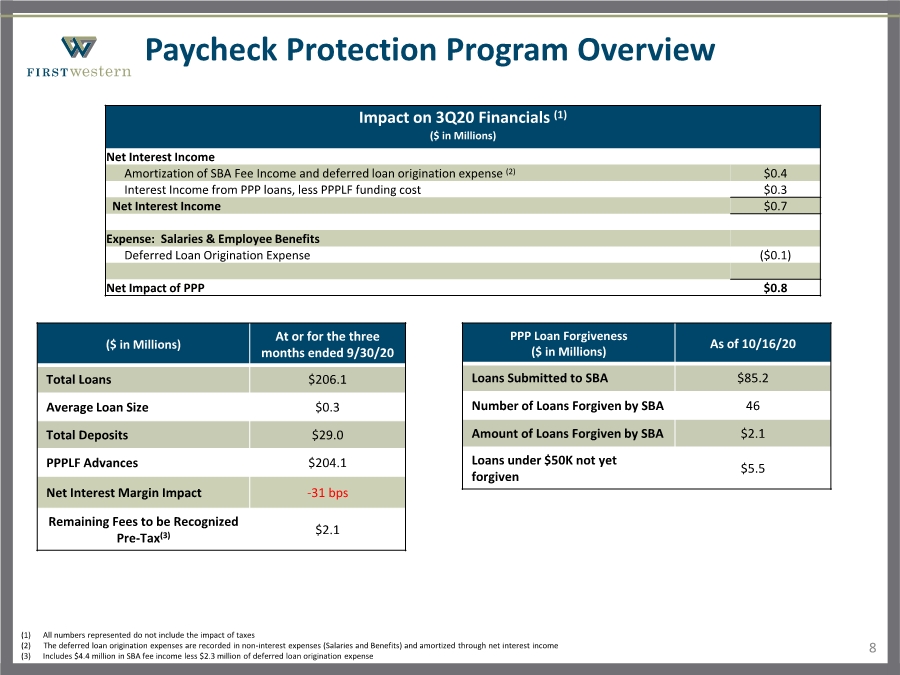
| Paycheck Protection Program Overview 8 ($ in Millions) At or for the three months ended 9/30/20 Total Loans $206.1 Average Loan Size $0.3 Total Deposits $29.0 PPPLF Advances $204.1 Net Interest Margin Impact -31 bps Remaining Fees to be Recognized Pre-Tax(3) $2.1 (1) All numbers represented do not include the impact of taxes (2) The deferred loan origination expenses are recorded in non-interest expenses (Salaries and Benefits) and amortized through net interest income (3) Includes $4.4 million in SBA fee income less $2.3 million of deferred loan origination expense Impact on 3Q20 Financials (1) ($ in Millions) Net Interest Income Amortization of SBA Fee Income and deferred loan origination expense (2) $0.4 Interest Income from PPP loans, less PPPLF funding cost $0.3 Net Interest Income $0.7 Expense: Salaries & Employee Benefits Deferred Loan Origination Expense ($0.1) Net Impact of PPP $0.8 PPP Loan Forgiveness ($ in Millions) As of 10/16/20 Loans Submitted to SBA $85.2 Number of Loans Forgiven by SBA 46 Amount of Loans Forgiven by SBA $2.1 Loans under $50K not yet forgiven $5.5 |
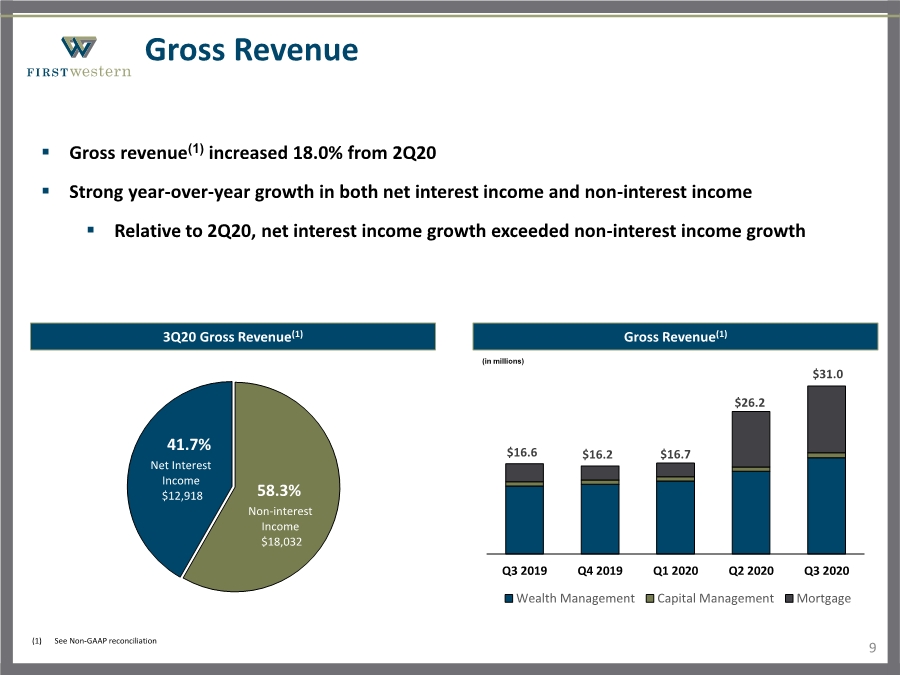
| Non-interest Income $18,032 Net Interest Income $12,918 41.7% 58.3% Gross Revenue 9 (1) See Non-GAAP reconciliation 3Q20 Gross Revenue(1) . Gross revenue(1) increased 18.0% from 2Q20 . Strong year-over-year growth in both net interest income and non-interest income . Relative to 2Q20, net interest income growth exceeded non-interest income growth Gross Revenue(1) $16.6 $16.2 $16.7 $26.2 $31.0 Q3 2019 Q4 2019 Q1 2020 Q2 2020 Q3 2020 Wealth Management Capital Management Mortgage (in millions) |
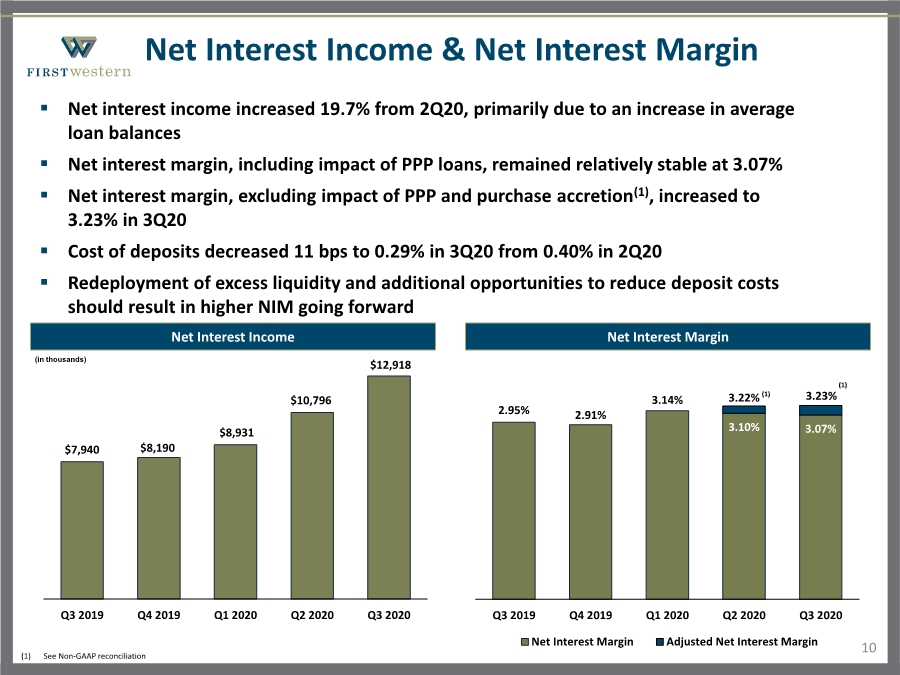
| Net Interest Income & Net Interest Margin 10 Net Interest Income . Net interest income increased 19.7% from 2Q20, primarily due to an increase in average loan balances . Net interest margin, including impact of PPP loans, remained relatively stable at 3.07% . Net interest margin, excluding impact of PPP and purchase accretion(1), increased to 3.23% in 3Q20 . Cost of deposits decreased 11 bps to 0.29% in 3Q20 from 0.40% in 2Q20 . Redeployment of excess liquidity and additional opportunities to reduce deposit costs should result in higher NIM going forward Net Interest Margin 3.10% 3.07% 2.95% 2.91% 3.14% 3.22% 3.23% Q3 2019 Q4 2019 Q1 2020 Q2 2020 Q3 2020 Net Interest Margin Adjusted Net Interest Margin $7,940 $8,190 $8,931 $10,796 $12,918 Q3 2019 Q4 2019 Q1 2020 Q2 2020 Q3 2020 (in thousands) (1) See Non-GAAP reconciliation (1) (1) |
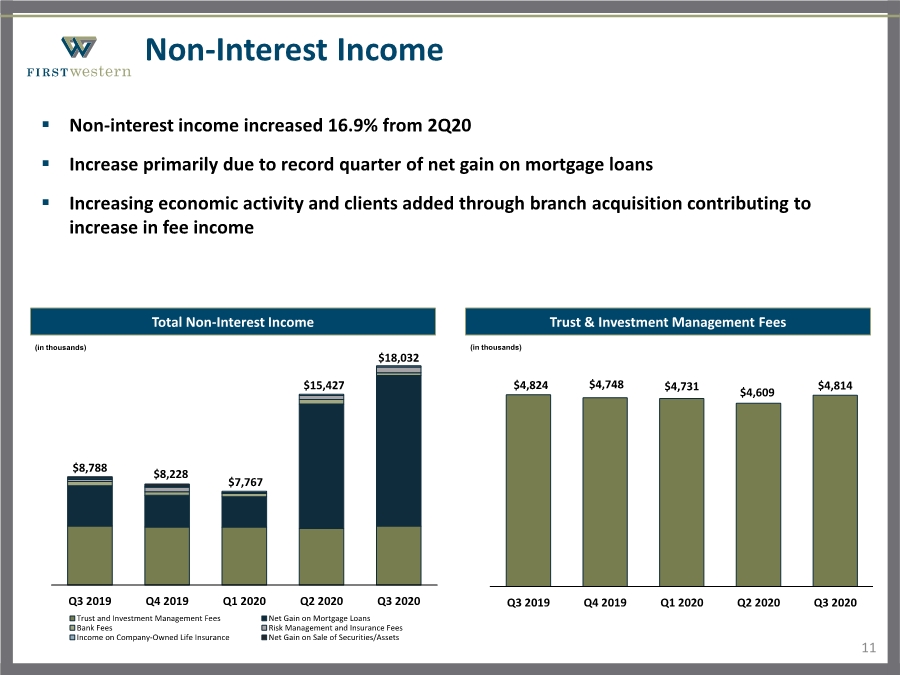
| $4,824 $4,748 $4,731 $4,609 $4,814 Q3 2019 Q4 2019 Q1 2020 Q2 2020 Q3 2020 Non-Interest Income 11 Total Non-Interest Income . Non-interest income increased 16.9% from 2Q20 . Increase primarily due to record quarter of net gain on mortgage loans . Increasing economic activity and clients added through branch acquisition contributing to increase in fee income Trust & Investment Management Fees $8,788 $8,228 $7,767 $15,427 $18,032 Q3 2019 Q4 2019 Q1 2020 Q2 2020 Q3 2020 Trust and Investment Management Fees Net Gain on Mortgage Loans Bank Fees Risk Management and Insurance Fees Income on Company-Owned Life Insurance Net Gain on Sale of Securities/Assets (in thousands) (in thousands) |
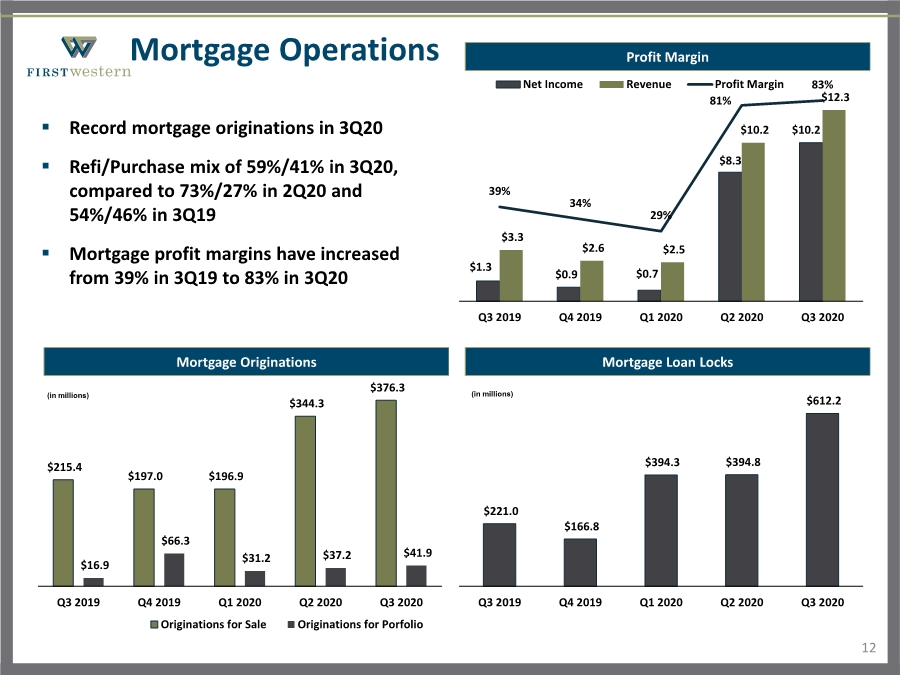
| Mortgage Operations 12 . Record mortgage originations in 3Q20 . Refi/Purchase mix of 59%/41% in 3Q20, compared to 73%/27% in 2Q20 and 54%/46% in 3Q19 . Mortgage profit margins have increased from 39% in 3Q19 to 83% in 3Q20 (in millions) $215.4 $197.0 $196.9 $344.3 $376.3 $16.9 $66.3 $31.2 $37.2 $41.9 Q3 2019 Q4 2019 Q1 2020 Q2 2020 Q3 2020 Originations for Sale Originations for Porfolio Mortgage Originations $221.0 $166.8 $394.3 $394.8 $612.2 Q3 2019 Q4 2019 Q1 2020 Q2 2020 Q3 2020 Mortgage Loan Locks (in millions) $1.3 $0.9 $0.7 $8.3 $10.2 $3.3 $2.6 $2.5 $10.2 $12.3 39% 34% 29% 81% 83% Q3 2019 Q4 2019 Q1 2020 Q2 2020 Q3 2020 Net Income Revenue Profit Margin Profit Margin |
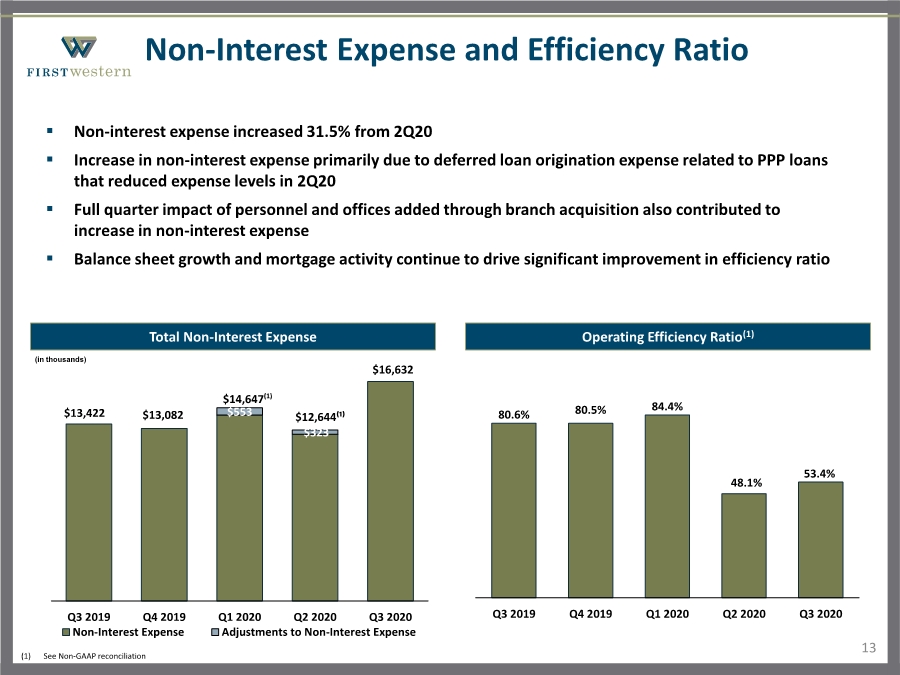
| Non-Interest Expense and Efficiency Ratio 13 Total Non-Interest Expense . Non-interest expense increased 31.5% from 2Q20 . Increase in non-interest expense primarily due to deferred loan origination expense related to PPP loans that reduced expense levels in 2Q20 . Full quarter impact of personnel and offices added through branch acquisition also contributed to increase in non-interest expense . Balance sheet growth and mortgage activity continue to drive significant improvement in efficiency ratio Operating Efficiency Ratio(1) 80.6% 80.5% 84.4% 48.1% 53.4% Q3 2019 Q4 2019 Q1 2020 Q2 2020 Q3 2020 $553 $323 $13,422 $13,082 $14,647 $12,644⁽¹⁾ $16,632 Q3 2019 Q4 2019 Q1 2020 Q2 2020 Q3 2020 Non-Interest Expense Adjustments to Non-Interest Expense (in thousands) (1) See Non-GAAP reconciliation (1) |
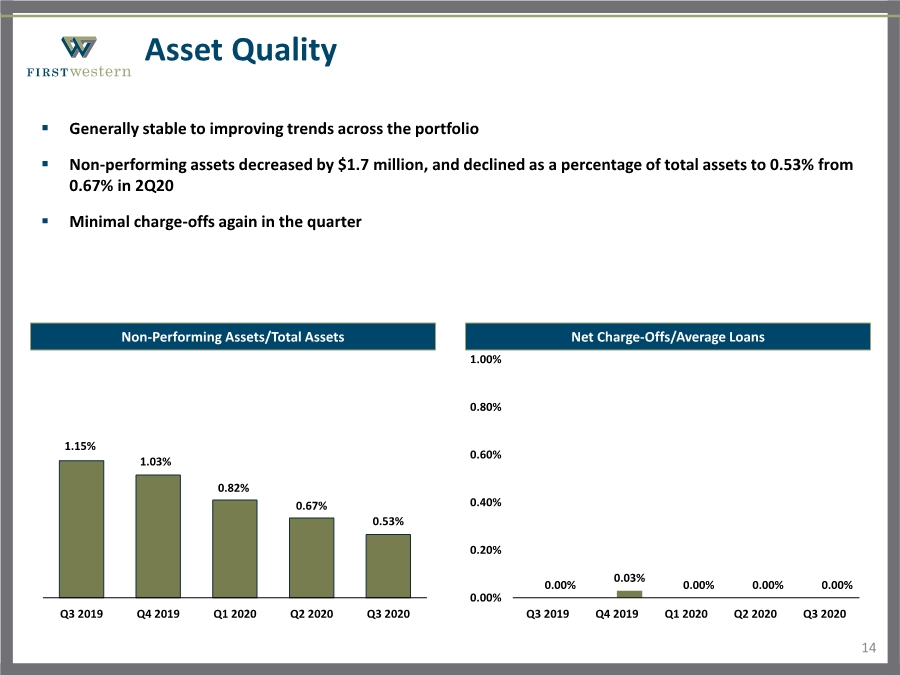
| Asset Quality 14 Non-Performing Assets/Total Assets . Generally stable to improving trends across the portfolio . Non-performing assets decreased by $1.7 million, and declined as a percentage of total assets to 0.53% from 0.67% in 2Q20 . Minimal charge-offs again in the quarter Net Charge-Offs/Average Loans 0.00% 0.03% 0.00% 0.00% 0.00% 0.00% 0.20% 0.40% 0.60% 0.80% 1.00% Q3 2019 Q4 2019 Q1 2020 Q2 2020 Q3 2020 1.15% 1.03% 0.82% 0.67% 0.53% Q3 2019 Q4 2019 Q1 2020 Q2 2020 Q3 2020 |
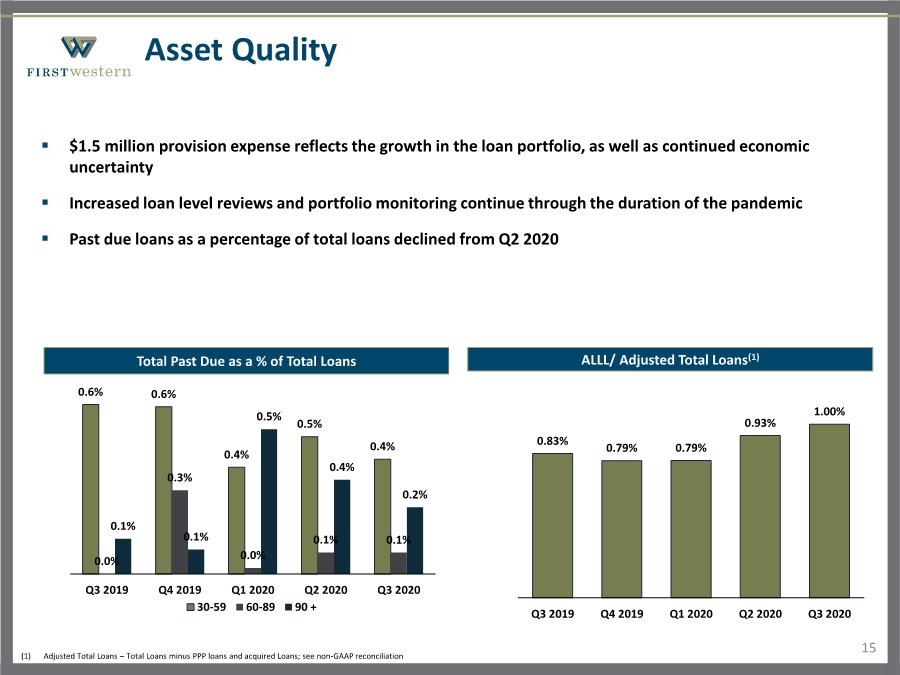
| Asset Quality 15 . $1.5 million provision expense reflects the growth in the loan portfolio, as well as continued economic uncertainty . Increased loan level reviews and portfolio monitoring continue through the duration of the pandemic . Past due loans as a percentage of total loans declined from Q2 2020 ALLL/ Adjusted Total Loans(1) 0.83% 0.79% 0.79% 0.93% 1.00% Q3 2019 Q4 2019 Q1 2020 Q2 2020 Q3 2020 0.6% 0.6% 0.4% 0.5% 0.4% 0.0% 0.3% 0.0% 0.1% 0.1% 0.1% 0.1% 0.5% 0.4% 0.2% Q3 2019 Q4 2019 Q1 2020 Q2 2020 Q3 2020 30-59 60-89 90 + Total Past Due as a % of Total Loans (1) Adjusted Total Loans – Total Loans minus PPP loans and acquired Loans; see non-GAAP reconciliation |
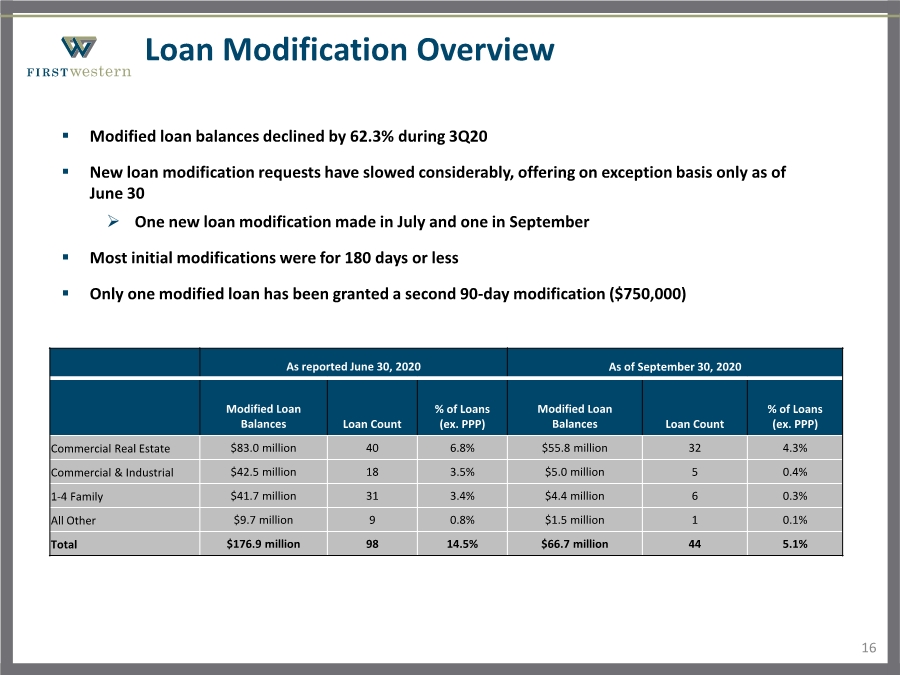
| Loan Modification Overview 16 . Modified loan balances declined by 62.3% during 3Q20 . New loan modification requests have slowed considerably, offering on exception basis only as of June 30 One new loan modification made in July and one in September . Most initial modifications were for 180 days or less . Only one modified loan has been granted a second 90-day modification ($750,000) As reported June 30, 2020 As of September 30, 2020 Modified Loan Balances Loan Count % of Loans (ex. PPP) Modified Loan Balances Loan Count % of Loans (ex. PPP) Commercial Real Estate $83.0 million 40 6.8% $55.8 million 32 4.3% Commercial & Industrial $42.5 million 18 3.5% $5.0 million 5 0.4% 1-4 Family $41.7 million 31 3.4% $4.4 million 6 0.3% All Other $9.7 million 9 0.8% $1.5 million 1 0.1% Total $176.9 million 98 14.5% $66.7 million 44 5.1% |
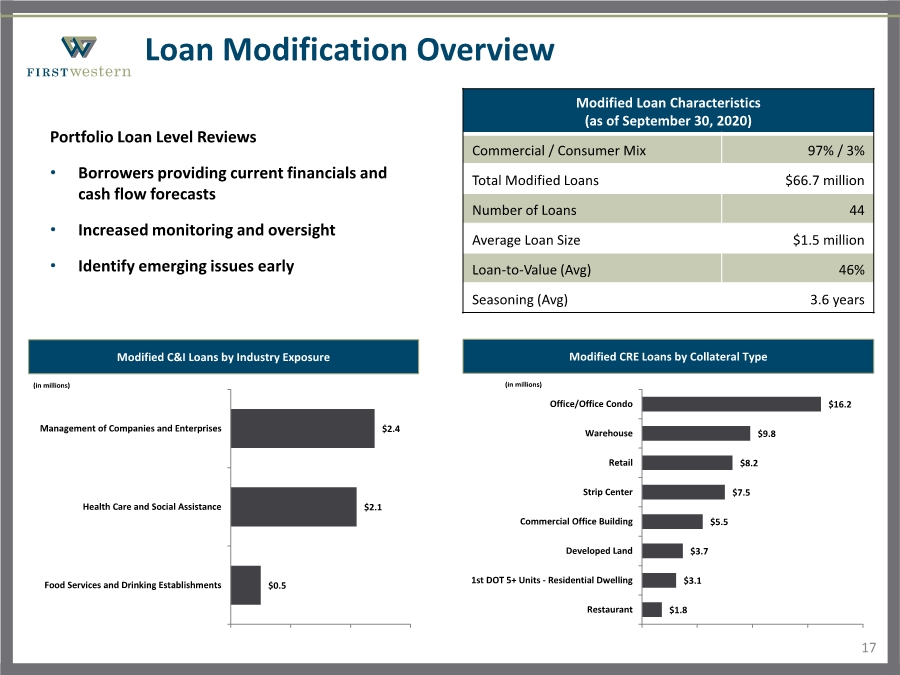
| Loan Modification Overview 17 Portfolio Loan Level Reviews • Borrowers providing current financials and cash flow forecasts • Increased monitoring and oversight • Identify emerging issues early $0.5 $2.1 $2.4 Food Services and Drinking Establishments Health Care and Social Assistance Management of Companies and Enterprises Modified C&I Loans by Industry Exposure Modified Loan Characteristics (as of September 30, 2020) Commercial / Consumer Mix 97% / 3% Total Modified Loans $66.7 million Number of Loans 44 Average Loan Size $1.5 million Loan-to-Value (Avg) 46% Seasoning (Avg) 3.6 years Modified CRE Loans by Collateral Type $1.8 $3.1 $3.7 $5.5 $7.5 $8.2 $9.8 $16.2 Restaurant 1st DOT 5+ Units - Residential Dwelling Developed Land Commercial Office Building Strip Center Retail Warehouse Office/Office Condo (in millions) (in millions) |
| Near-Term Outlook and Expectations 18 . Significant growth in tangible book value expected to continue Core earnings and operating leverage improvement expected to continue PPP fee recognition and pending sale of LA Fixed Income Team . Asset quality showing strength despite continuation of pandemic . Initial synergies being realized from branch acquisition . Net interest margin expected to expand as excess liquidity is redeployed and deposit costs continue to decline . Strong mortgage originations continuing in 4Q20 . Healthy loan pipeline should continue to drive organic loan growth . Commercial banking initiative accelerating following the addition of talent from branch acquisition in May Adding expertise to target niche industries Building SBA lending capability Actively participating in Main Street Lending Program |
| Appendix |

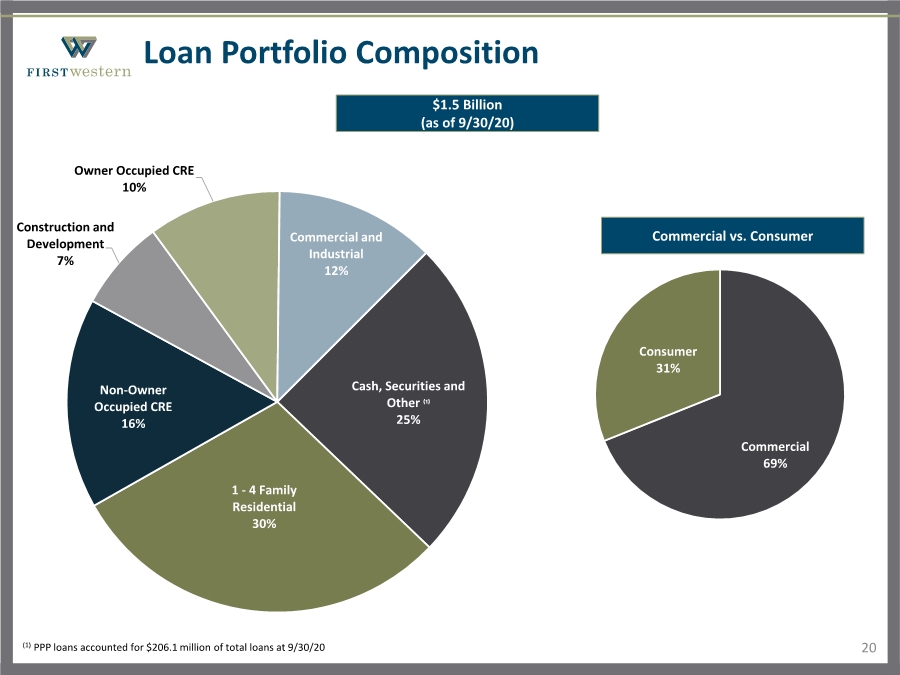
| Loan Portfolio Composition 20 Cash, Securities and Other ⁽¹⁾ 25% 1 - 4 Family Residential 30% Non-Owner Occupied CRE 16% Construction and Development 7% Owner Occupied CRE 10% Commercial and Industrial 12% Commercial 69% Consumer 31% $1.5 Billion (as of 9/30/20) Commercial vs. Consumer (1) PPP loans accounted for $206.1 million of total loans at 9/30/20 |
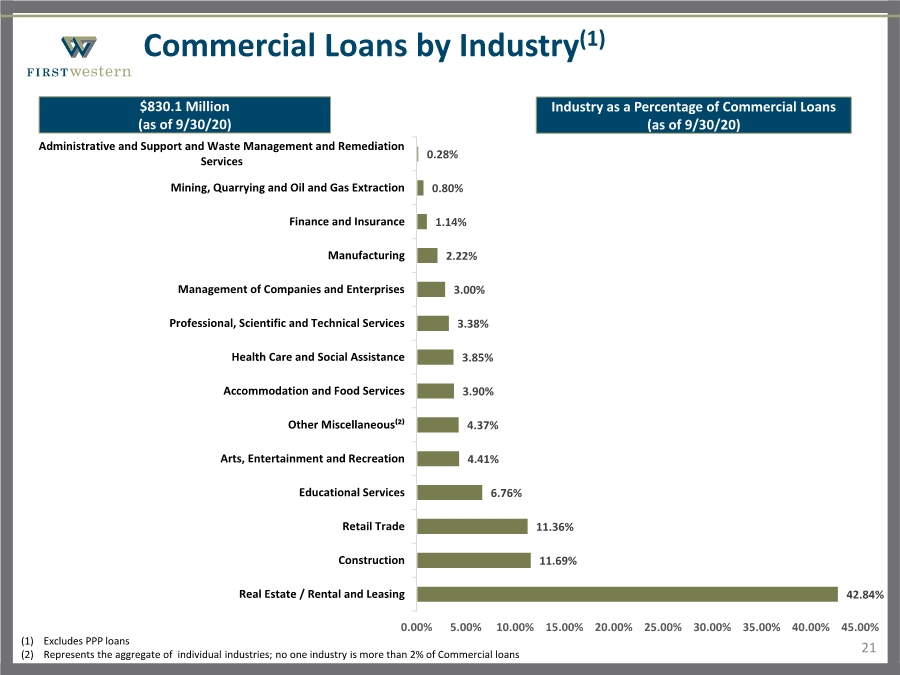
| Commercial Loans by Industry(1) 21 42.84% 11.69% 11.36% 6.76% 4.41% 4.37% 3.90% 3.85% 3.38% 3.00% 2.22% 1.14% 0.80% 0.28% Real Estate / Rental and Leasing Construction Retail Trade Educational Services Arts, Entertainment and Recreation Other Miscellaneous⁽²⁾ Accommodation and Food Services Health Care and Social Assistance Professional, Scientific and Technical Services Management of Companies and Enterprises Manufacturing Finance and Insurance Mining, Quarrying and Oil and Gas Extraction Administrative and Support and Waste Management and Remediation Services 0.00% 5.00% 10.00% 15.00% 20.00% 25.00% 30.00% 35.00% 40.00% 45.00% $830.1 Million (as of 9/30/20) Industry as a Percentage of Commercial Loans (as of 9/30/20) (1) Excludes PPP loans (2) Represents the aggregate of individual industries; no one industry is more than 2% of Commercial loans |
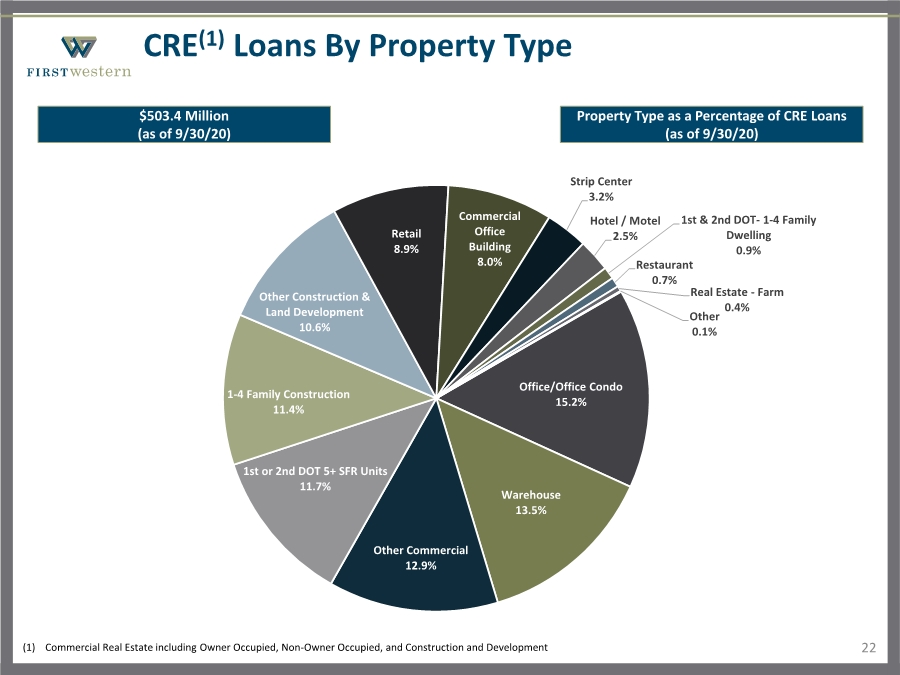
| CRE(1) Loans By Property Type 22 Office/Office Condo 15.2% Warehouse 13.5% Other Commercial 12.9% 1st or 2nd DOT 5+ SFR Units 11.7% 1-4 Family Construction 11.4% Other Construction & Land Development 10.6% Retail 8.9% Commercial Office Building 8.0% Strip Center 3.2% Hotel / Motel 2.5% 1st & 2nd DOT- 1-4 Family Dwelling 0.9% Restaurant 0.7% Real Estate - Farm 0.4% Other 0.1% (1) Commercial Real Estate including Owner Occupied, Non-Owner Occupied, and Construction and Development $503.4 Million (as of 9/30/20) Property Type as a Percentage of CRE Loans (as of 9/30/20) |
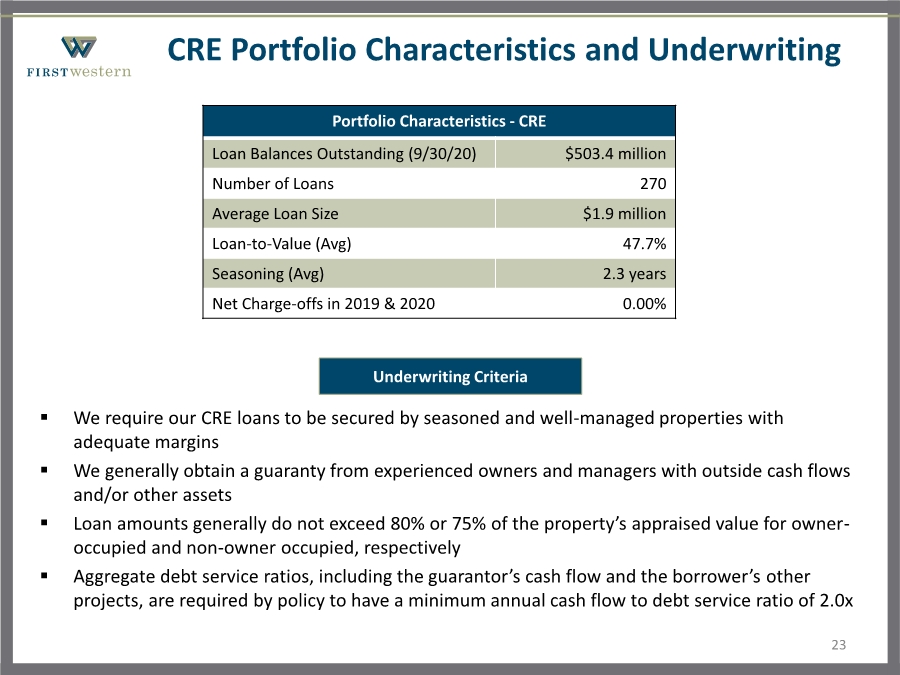
| . We require our CRE loans to be secured by seasoned and well-managed properties with adequate margins . We generally obtain a guaranty from experienced owners and managers with outside cash flows and/or other assets . Loan amounts generally do not exceed 80% or 75% of the property’s appraised value for owner- occupied and non-owner occupied, respectively . Aggregate debt service ratios, including the guarantor’s cash flow and the borrower’s other projects, are required by policy to have a minimum annual cash flow to debt service ratio of 2.0x CRE Portfolio Characteristics and Underwriting 23 Portfolio Characteristics - CRE Loan Balances Outstanding (9/30/20) $503.4 million Number of Loans 270 Average Loan Size $1.9 million Loan-to-Value (Avg) 47.7% Seasoning (Avg) 2.3 years Net Charge-offs in 2019 & 2020 0.00% Underwriting Criteria |
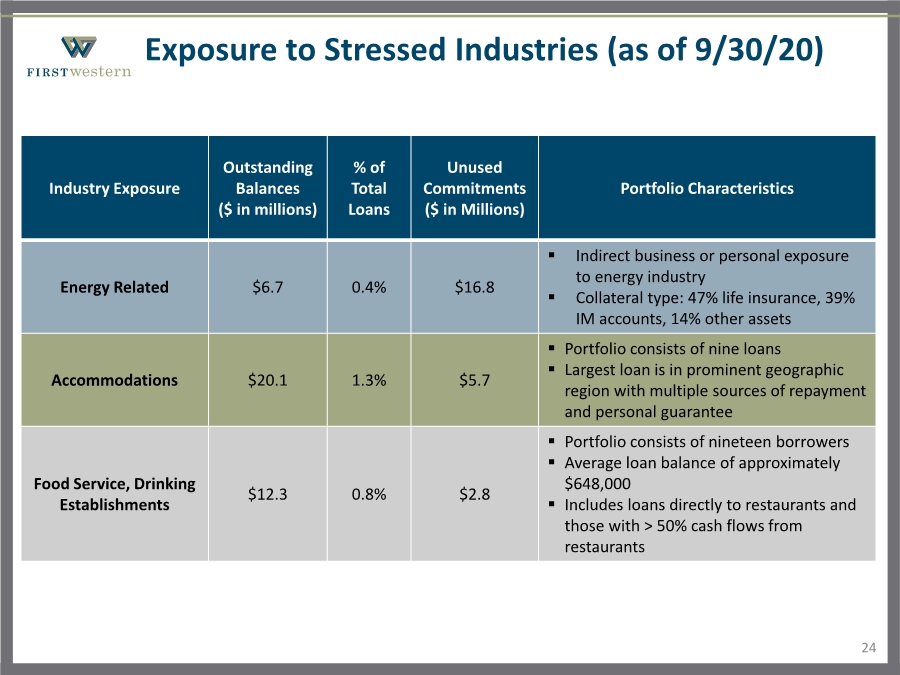
| Exposure to Stressed Industries (as of 9/30/20) 24 Industry Exposure Outstanding Balances ($ in millions) % of Total Loans Unused Commitments ($ in Millions) Portfolio Characteristics Energy Related $6.7 0.4% $16.8 . Indirect business or personal exposure to energy industry . Collateral type: 47% life insurance, 39% IM accounts, 14% other assets Accommodations $20.1 1.3% $5.7 . Portfolio consists of nine loans . Largest loan is in prominent geographic region with multiple sources of repayment and personal guarantee Food Service, Drinking Establishments $12.3 0.8% $2.8 . Portfolio consists of nineteen borrowers . Average loan balance of approximately $648,000 . Includes loans directly to restaurants and those with > 50% cash flows from restaurants |
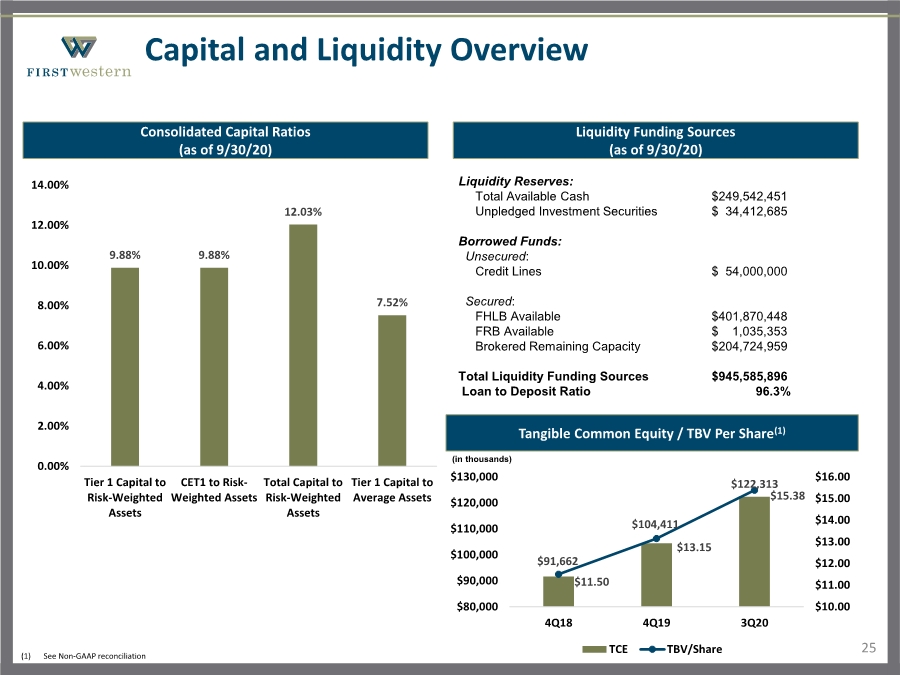
| Capital and Liquidity Overview 25 Liquidity Funding Sources (as of 9/30/20) Liquidity Reserves: Total Available Cash $249,542,451 Unpledged Investment Securities $ 34,412,685 Borrowed Funds: Unsecured: Credit Lines $ 54,000,000 Secured: FHLB Available $401,870,448 FRB Available $ 1,035,353 Brokered Remaining Capacity $204,724,959 Total Liquidity Funding Sources $945,585,896 Loan to Deposit Ratio 96.3% Consolidated Capital Ratios (as of 9/30/20) 9.88% 9.88% 12.03% 7.52% 0.00% 2.00% 4.00% 6.00% 8.00% 10.00% 12.00% 14.00% Tier 1 Capital to Risk-Weighted Assets CET1 to Risk- Weighted Assets Total Capital to Risk-Weighted Assets Tier 1 Capital to Average Assets Tangible Common Equity / TBV Per Share(1) (in thousands) $91,662 $104,411 $122,313 $11.50 $13.15 $15.38 $10.00 $11.00 $12.00 $13.00 $14.00 $15.00 $16.00 $80,000 $90,000 $100,000 $110,000 $120,000 $130,000 4Q18 4Q19 3Q20 TCE TBV/Share (1) See Non-GAAP reconciliation |
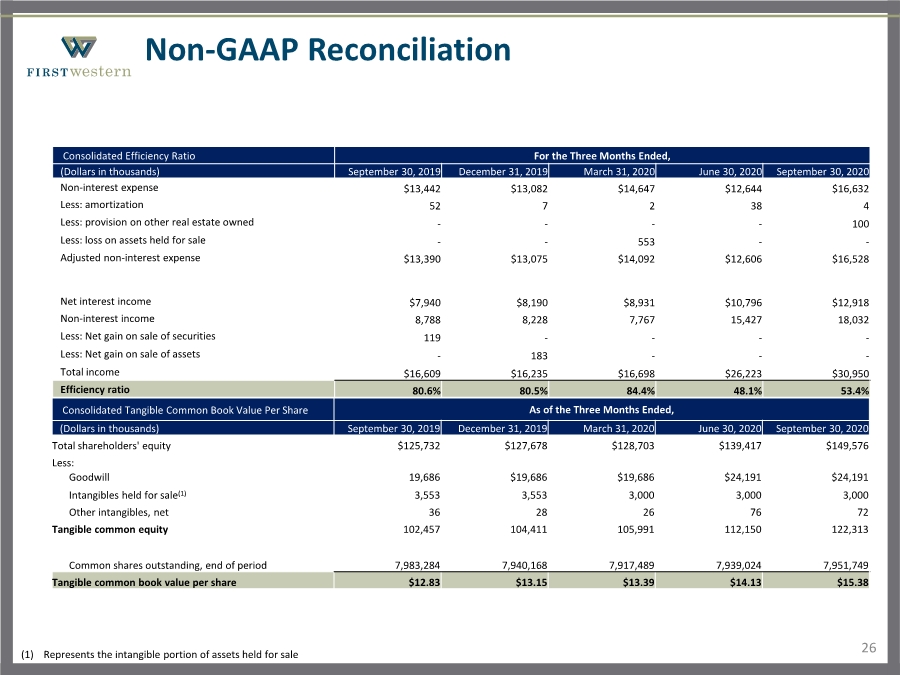
| 26 Non-GAAP Reconciliation Consolidated Efficiency Ratio For the Three Months Ended, (Dollars in thousands) September 30, 2019 December 31, 2019 March 31, 2020 June 30, 2020 September 30, 2020 Non-interest expense $13,442 $13,082 $14,647 $12,644 $16,632 Less: amortization 52 7 2 38 4 Less: provision on other real estate owned ---- 100 Less: loss on assets held for sale -- 553 -- Adjusted non-interest expense $13,390 $13,075 $14,092 $12,606 $16,528 Net interest income $7,940 $8,190 $8,931 $10,796 $12,918 Non-interest income 8,788 8,228 7,767 15,427 18,032 Less: Net gain on sale of securities 119 ---- Less: Net gain on sale of assets - 183 --- Total income $16,609 $16,235 $16,698 $26,223 $30,950 Efficiency ratio 80.6% 80.5% 84.4% 48.1% 53.4% Consolidated Tangible Common Book Value Per Share As of the Three Months Ended, (Dollars in thousands) September 30, 2019 December 31, 2019 March 31, 2020 June 30, 2020 September 30, 2020 Total shareholders' equity $125,732 $127,678 $128,703 $139,417 $149,576 Less: Goodwill 19,686 $19,686 $19,686 $24,191 $24,191 Intangibles held for sale(1) 3,553 3,553 3,000 3,000 3,000 Other intangibles, net 36 28 26 76 72 Tangible common equity 102,457 104,411 105,991 112,150 122,313 Common shares outstanding, end of period 7,983,284 7,940,168 7,917,489 7,939,024 7,951,749 Tangible common book value per share $12.83 $13.15 $13.39 $14.13 $15.38 (1) Represents the intangible portion of assets held for sale |
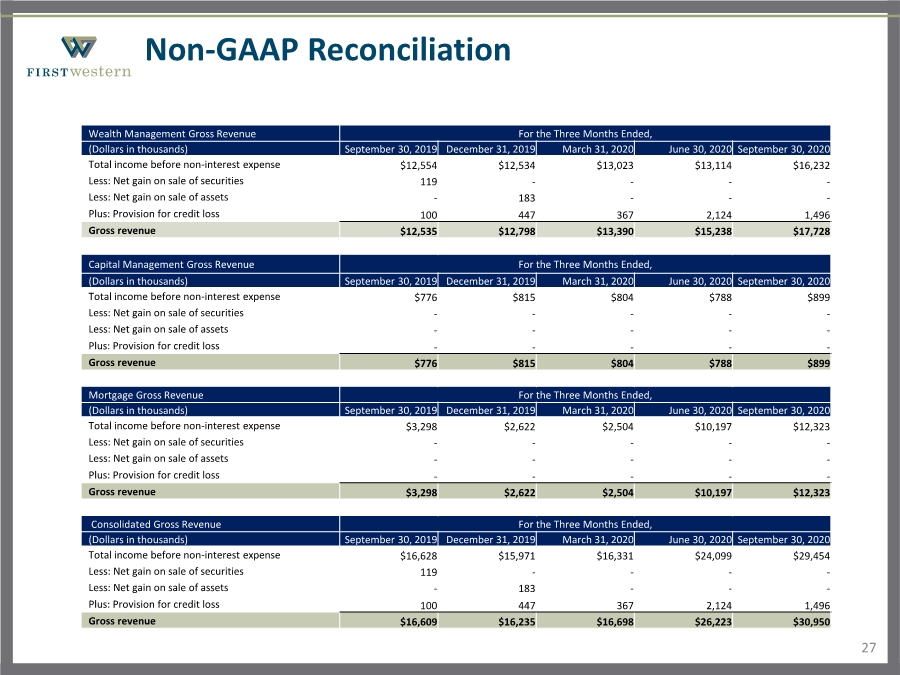
| 27 Non-GAAP Reconciliation Wealth Management Gross Revenue For the Three Months Ended, (Dollars in thousands) September 30, 2019 December 31, 2019 March 31, 2020 June 30, 2020 September 30, 2020 Total income before non-interest expense $12,554 $12,534 $13,023 $13,114 $16,232 Less: Net gain on sale of securities 119 ---- Less: Net gain on sale of assets - 183 --- Plus: Provision for credit loss 100 447 367 2,124 1,496 Gross revenue $12,535 $12,798 $13,390 $15,238 $17,728 Capital Management Gross Revenue For the Three Months Ended, (Dollars in thousands) September 30, 2019 December 31, 2019 March 31, 2020 June 30, 2020 September 30, 2020 Total income before non-interest expense $776 $815 $804 $788 $899 Less: Net gain on sale of securities ----- Less: Net gain on sale of assets ----- Plus: Provision for credit loss ----- Gross revenue $776 $815 $804 $788 $899 Mortgage Gross Revenue For the Three Months Ended, (Dollars in thousands) September 30, 2019 December 31, 2019 March 31, 2020 June 30, 2020 September 30, 2020 Total income before non-interest expense $3,298 $2,622 $2,504 $10,197 $12,323 Less: Net gain on sale of securities ----- Less: Net gain on sale of assets ----- Plus: Provision for credit loss ----- Gross revenue $3,298 $2,622 $2,504 $10,197 $12,323 Consolidated Gross Revenue For the Three Months Ended, (Dollars in thousands) September 30, 2019 December 31, 2019 March 31, 2020 June 30, 2020 September 30, 2020 Total income before non-interest expense $16,628 $15,971 $16,331 $24,099 $29,454 Less: Net gain on sale of securities 119 ---- Less: Net gain on sale of assets - 183 --- Plus: Provision for credit loss 100 447 367 2,124 1,496 Gross revenue $16,609 $16,235 $16,698 $26,223 $30,950 |
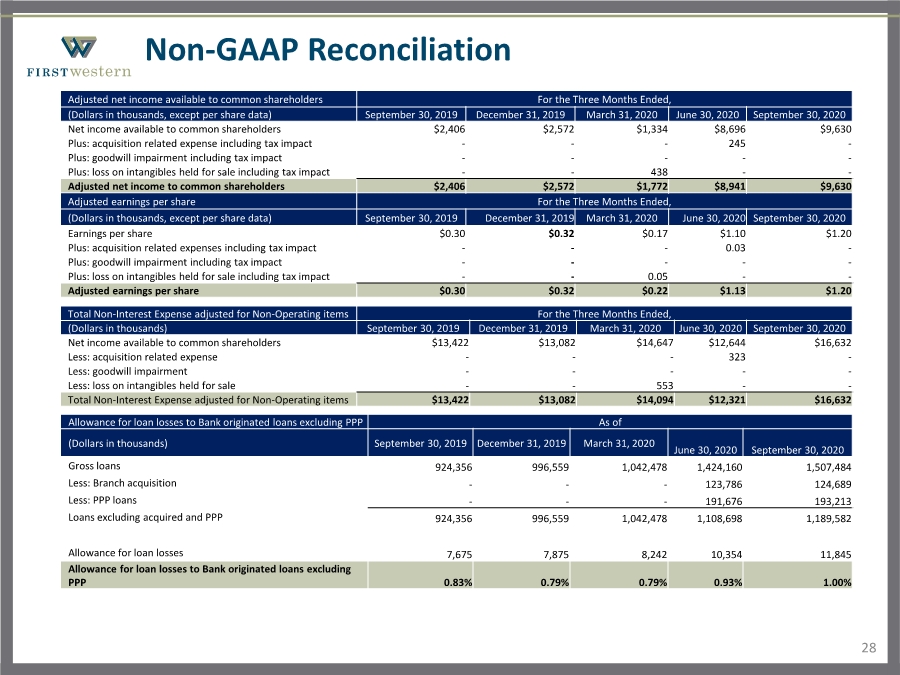
| 28 Non-GAAP Reconciliation Adjusted net income available to common shareholders For the Three Months Ended, (Dollars in thousands, except per share data) September 30, 2019 December 31, 2019 March 31, 2020 June 30, 2020 September 30, 2020 Net income available to common shareholders $2,406 $2,572 $1,334 $8,696 $9,630 Plus: acquisition related expense including tax impact --- 245 - Plus: goodwill impairment including tax impact ----- Plus: loss on intangibles held for sale including tax impact -- 438 -- Adjusted net income to common shareholders $2,406 $2,572 $1,772 $8,941 $9,630 Adjusted earnings per share For the Three Months Ended, (Dollars in thousands, except per share data) September 30, 2019 December 31, 2019 March 31, 2020 June 30, 2020 September 30, 2020 Earnings per share $0.30 $0.32 $0.17 $1.10 $1.20 Plus: acquisition related expenses including tax impact --- 0.03 - Plus: goodwill impairment including tax impact ----- Plus: loss on intangibles held for sale including tax impact -- 0.05 -- Adjusted earnings per share $0.30 $0.32 $0.22 $1.13 $1.20 Allowance for loan losses to Bank originated loans excluding PPP As of (Dollars in thousands) September 30, 2019 December 31, 2019 March 31, 2020 June 30, 2020 September 30, 2020 Gross loans 924,356 996,559 1,042,478 1,424,160 1,507,484 Less: Branch acquisition --- 123,786 124,689 Less: PPP loans --- 191,676 193,213 Loans excluding acquired and PPP 924,356 996,559 1,042,478 1,108,698 1,189,582 Allowance for loan losses 7,675 7,875 8,242 10,354 11,845 Allowance for loan losses to Bank originated loans excluding PPP 0.83% 0.79% 0.79% 0.93% 1.00% Total Non-Interest Expense adjusted for Non-Operating items For the Three Months Ended, (Dollars in thousands) September 30, 2019 December 31, 2019 March 31, 2020 June 30, 2020 September 30, 2020 Net income available to common shareholders $13,422 $13,082 $14,647 $12,644 $16,632 Less: acquisition related expense --- 323 - Less: goodwill impairment ----- Less: loss on intangibles held for sale -- 553 -- Total Non-Interest Expense adjusted for Non-Operating items $13,422 $13,082 $14,094 $12,321 $16,632 |
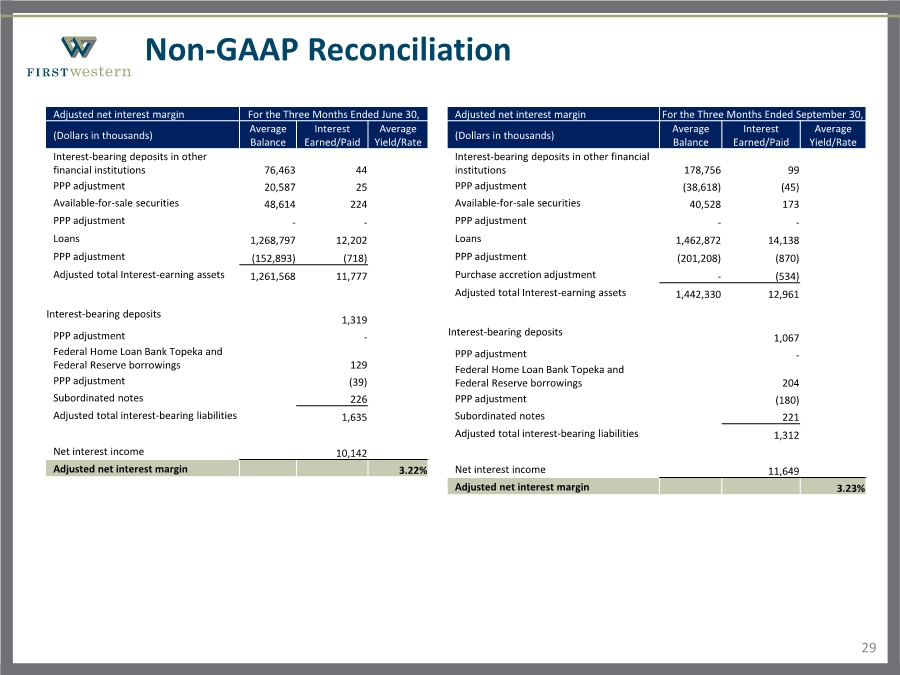
| 29 Non-GAAP Reconciliation Adjusted net interest margin For the Three Months Ended June 30, (Dollars in thousands) Average Balance Interest Earned/Paid Average Yield/Rate Interest-bearing deposits in other financial institutions 76,463 44 PPP adjustment 20,587 25 Available-for-sale securities 48,614 224 September PPP adjustment -- Loans 1,268,797 12,202 PPP adjustment (152,893) (718) Adjusted total Interest-earning assets 1,261,568 11,777 Interest-bearing deposits 1,319 PPP adjustment - Federal Home Loan Bank Topeka and Federal Reserve borrowings 129 PPP adjustment (39) Subordinated notes 226 Adjusted total interest-bearing liabilities 1,635 Net interest income 10,142 Adjusted net interest margin 3.22% Adjusted net interest margin For the Three Months Ended September 30, (Dollars in thousands) Average Balance Interest Earned/Paid Average Yield/Rate Interest-bearing deposits in other financial institutions 178,756 99 PPP adjustment (38,618) (45) Available-for-sale securities 40,528 173 September PPP adjustment -- Loans 1,462,872 14,138 PPP adjustment (201,208) (870) Purchase accretion adjustment -(534) Adjusted total Interest-earning assets 1,442,330 12,961 Interest-bearing deposits 1,067 PPP adjustment - Federal Home Loan Bank Topeka and Federal Reserve borrowings 204 PPP adjustment (180) Subordinated notes 221 Adjusted total interest-bearing liabilities 1,312 Net interest income 11,649 Adjusted net interest margin 3.23% |