Attached files
| file | filename |
|---|---|
| 8-K - 8-K - FIRST FINANCIAL BANCORP /OH/ | ffbc-20201022.htm |
| EX-99.1 - EX-99.1 - FIRST FINANCIAL BANCORP /OH/ | a8k3q20earningsrelease.htm |
Exhibit 99.2 Earnings Presentation Third Quarter 2020

Forward Looking Statement Disclosure Certain statements contained in this report which are not statements of historical fact constitute forward-looking statements within the meaning of the Private Securities Litigation Reform Act of 1995. Words such as ‘‘believes,’’ ‘‘anticipates,’’ “likely,” “expected,” “estimated,” ‘‘intends’’ and other similar expressions are intended to identify forward-looking statements but are not the exclusive means of identifying such statements. Examples of forward-looking statements include, but are not limited to, statements we make about (i) our future operating or financial performance, including revenues, income or loss and earnings or loss per share, (ii) future common stock dividends, (iii) our capital structure, including future capital levels, (iv) our plans, objectives and strategies, and (v) the assumptions that underlie our forward-looking statements. As with any forecast or projection, forward-looking statements are subject to inherent uncertainties, risks and changes in circumstances that may cause actual results to differ materially from those set forth in the forward-looking statements. Forward-looking statements are not historical facts but instead express only management’s beliefs regarding future results or events, many of which, by their nature, are inherently uncertain and outside of management’s control. It is possible that actual results and outcomes may differ, possibly materially, from the anticipated results or outcomes indicated in these forward-looking statements. Important factors that could cause actual results to differ materially from those in our forward-looking statements include the following, without limitation: • economic, market, liquidity, credit, interest rate, operational and technological risks associated with the Company’s business; • future credit quality and performance, including our expectations regarding future loan losses and our allowance for credit losses; • the effect of and changes in policies and laws or regulatory agencies, including the Dodd-Frank Wall Street Reform and Consumer Protection Act and other legislation and regulation relating to the banking industry; (iv) management’s ability to effectively execute its business plans; • mergers and acquisitions, including costs or difficulties related to the integration of acquired companies; • the possibility that any of the anticipated benefits of the Company’s acquisitions will not be realized or will not be realized within the expected time period; • the effect of changes in accounting policies and practices; • changes in consumer spending, borrowing and saving and changes in unemployment; • changes in customers’ performance and creditworthiness; • the costs and effects of litigation and of unexpected or adverse outcomes in such litigation; • current and future economic and market conditions, including the effects of declines in housing prices, high unemployment rates, U.S. fiscal debt, budget and tax matters, geopolitical matters, and any slowdown in global economic growth; • the adverse impact on the U.S. economy, including the markets in which we operate, of the novel coronavirus, which causes the Coronavirus disease 2019 (“COVID-19”), global pandemic, and the impact of a slowing U.S. economy and increased unemployment on the performance of our loan and lease portfolio, the market value of our investment securities, the availability of sources of funding and the demand for our products; • our capital and liquidity requirements (including under regulatory capital standards, such as the Basel III capital standards) and our ability to generate capital internally or raise capital on favorable terms; 2

Forward Looking Statement Disclosure • financial services reform and other current, pending or future legislation or regulation that could have a negative effect on our revenue and businesses, including the Dodd-Frank Act and other legislation and regulation relating to bank products and services; • the effect of the current interest rate environment or changes in interest rates or in the level or composition of our assets or liabilities on our net interest income, net interest margin and our mortgage originations, mortgage servicing rights and mortgage loans held for sale; • the effect of a fall in stock market prices on our brokerage, asset and wealth management businesses; • a failure in or breach of our operational or security systems or infrastructure, or those of our third-party vendors or other service providers, including as a result of cyber attacks; • the effect of changes in the level of checking or savings account deposits on our funding costs and net interest margin; and • our ability to develop and execute effective business plans and strategies. Additional factors that may cause our actual results to differ materially from those described in our forward-looking statements can be found in our Form 10-K for the year ended December 31, 2019, as well as our other filings with the SEC, which are available on the SEC website at www.sec.gov. All forward-looking statements included in this filing are made as of the date hereof and are based on information available at the time of the filing. Except as required by law, the Company does not assume any obligation to update any forward-looking statement. 3
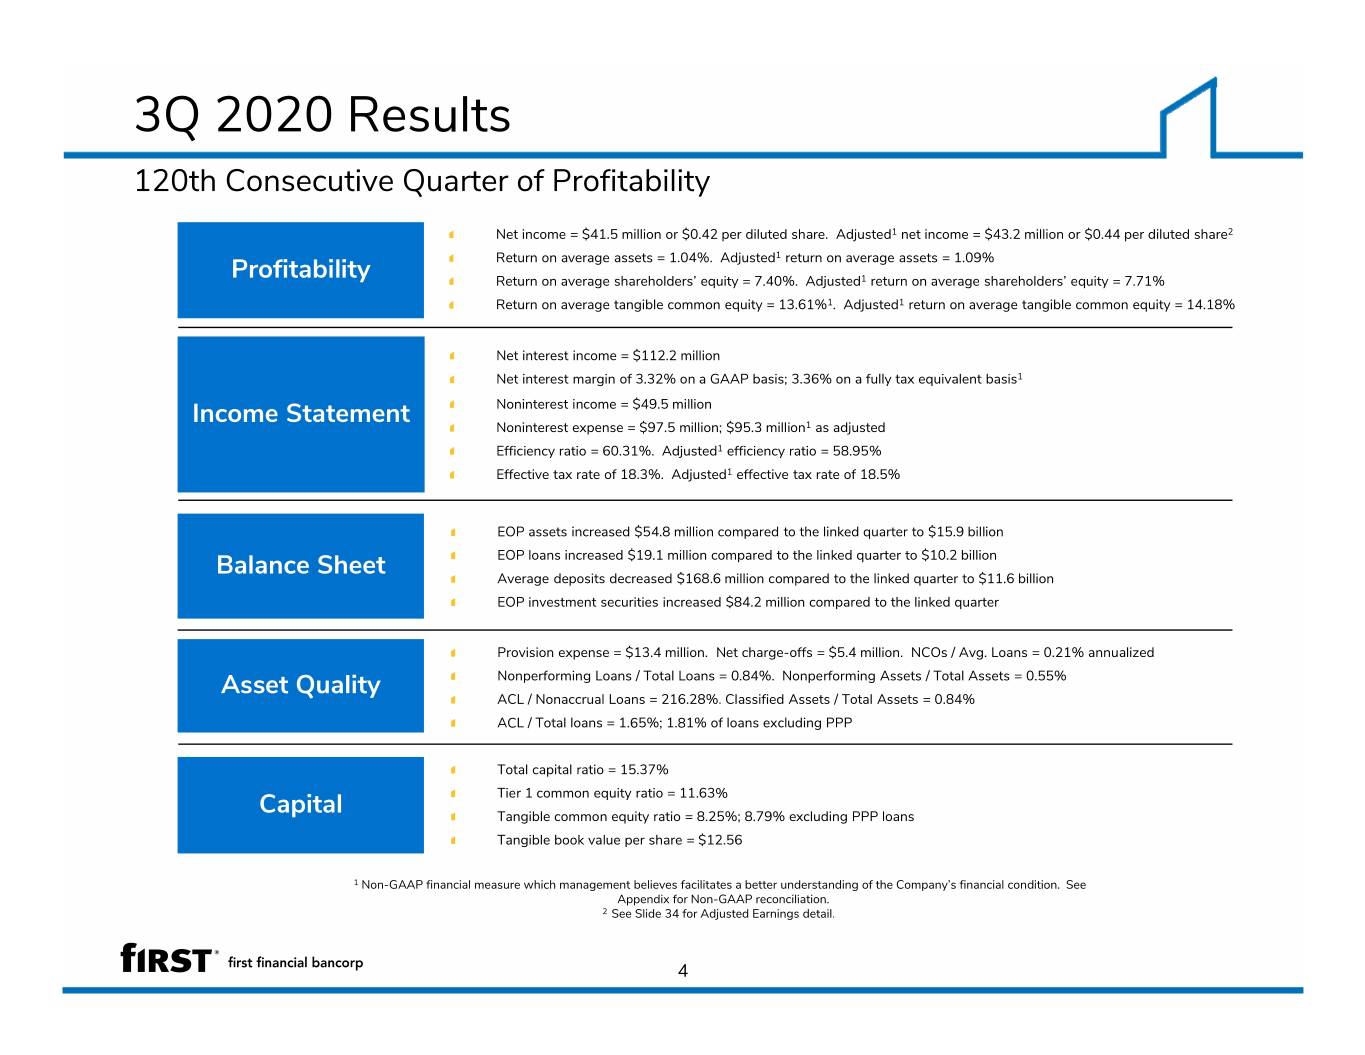
3Q 2020 Results 120th Consecutive Quarter of Profitability Net income = $41.5 million or $0.42 per diluted share. Adjusted1 net income = $43.2 million or $0.44 per diluted share2 Return on average assets = 1.04%. Adjusted1 return on average assets = 1.09% Profitability Return on average shareholders’ equity = 7.40%. Adjusted1 return on average shareholders’ equity = 7.71% Return on average tangible common equity = 13.61%1. Adjusted1 return on average tangible common equity = 14.18% Net interest income = $112.2 million Net interest margin of 3.32% on a GAAP basis; 3.36% on a fully tax equivalent basis1 Noninterest income = $49.5 million Income Statement Noninterest expense = $97.5 million; $95.3 million1 as adjusted Efficiency ratio = 60.31%. Adjusted1 efficiency ratio = 58.95% Effective tax rate of 18.3%. Adjusted1 effective tax rate of 18.5% EOP assets increased $54.8 million compared to the linked quarter to $15.9 billion EOP loans increased $19.1 million compared to the linked quarter to $10.2 billion Balance Sheet Average deposits decreased $168.6 million compared to the linked quarter to $11.6 billion EOP investment securities increased $84.2 million compared to the linked quarter Provision expense = $13.4 million. Net charge-offs = $5.4 million. NCOs / Avg. Loans = 0.21% annualized Nonperforming Loans / Total Loans = 0.84%. Nonperforming Assets / Total Assets = 0.55% Asset Quality ACL / Nonaccrual Loans = 216.28%. Classified Assets / Total Assets = 0.84% ACL / Total loans = 1.65%; 1.81% of loans excluding PPP Total capital ratio = 15.37% Tier 1 common equity ratio = 11.63% Capital Tangible common equity ratio = 8.25%; 8.79% excluding PPP loans Tangible book value per share = $12.56 1 Non-GAAP financial measure which management believes facilitates a better understanding of the Company’s financial condition. See Appendix for Non-GAAP reconciliation. 2 See Slide 34 for Adjusted Earnings detail. 4

3Q 2020 Highlights Quarterly earnings impacted by elevated provision expense Adjusted1 earnings per share - $0.44 Adjusted1 return on assets – 1.09% Adjusted1 pre-tax, pre-provision return on assets – 1.67% Adjusted1 return on average tangible common equity – 14.18% Loan balances relatively flat; strong core deposit growth Loan balances increased $19.1 million compared to the linked quarter; 0.7% on an annualized basis; Average transactional deposit balances grew $434.5 million compared to the linked quarter; 19.0% on an annualized basis Noninterest bearing deposits were 30.7% of total deposits at September 30, 2020 Net interest margin (FTE) better than expected given decline in interest rates 8 bp decline driven by the previous Fed rate cuts; margin positively impacted by disciplined funding management and higher loan fees Net interest income grew $0.6 million during the quarter Strong fee income Mortgage banking revenue increased $1.9 million, or 11.6% Foreign exchange income of $10.5 million, representing a 60.1% increase from previous quarter Service charges increased $1.4 million, or 22.6% Core expenses in line with initial expectations, incentive compensation notwithstanding Adjusted1 noninterest expense of $95.3 million; adjusted for $0.1 million of COVID-19 related expenses and approximately $2.1 million of other non- recurring costs such as merger-related and branch consolidation costs $7.0 million of incremental incentive compensation/commissions $0.5 million contribution to First Financial Foundation Allowance for credit loss (ACL) and provision expense reflects COVID-19 impact on expected lifetime losses Adopted CECL as of January 1 Loans and leases - ACL of $168.5 million or 1.65% of total loans; $15.3 provision expense Unfunded Commitments - ACL of $14.8 million; $1.9 million provision recapture Strong Capital ratios and Liquidity Total capital of 15.37%; Tier 1 common equity of 11.63%; Tangible common equity of 8.25% Tangible book value increased by $0.30 to $12.56 1 Non-GAAP financial measure which management believes facilitates a better understanding of the Company’s financial condition. See Appendix for Non-GAAP reconciliations. 5

Adjusted Net Income1 The table below lists certain adjustments that the Company believes are significant to understanding its quarterly performance. 3Q 2020 2Q 2020 As Reported Adjusted As Reported Adjusted Net interest income$ 112,180 $ 112,180 $ 111,576 $ 111,576 Provision for credit losses-loans and leases$ 15,299 $ 15,299 $ 17,859 $ 17,859 Provision for credit losses-unfunded commitments$ (1,925) $ (1,925) $ 2,370 $ 2,370 Noninterest income$ 49,499 $ 49,499 $ 42,725 $ 42,725 less: gains (losses) on investment securities - 20 A - 128 A Total noninterest income$ 49,499 $ 49,479 $ 42,725 $ 42,597 Noninterest expense$ 97,511 $ 97,511 $ 88,689 $ 88,689 less: severance and merger-related expenses - 95 A - 35 A less: COVID-19 donations and costs - 115 A - 660 A less: other - 2,011 A - 1,507 A Total noninterest expense$ 97,511 $ 95,290 $ 88,689 $ 86,487 Income before income taxes$ 50,794 $ 52,995 $ 45,383 $ 47,457 Income tax expense$ 9,317 $ 9,317 $ 7,990 $ 7,990 plus: tax effect of adjustments (A) @ 21% statutory rate - 462 - 436 Total income tax expense$ 9,317 $ 9,779 $ 7,990 $ 8,426 Net income $ 41,477 $ 43,216 $ 37,393 $ 39,031 Net earnings per share - diluted$ 0.42 $ 0.44 $ 0.38 $ 0.40 Pre-tax, pre-provision return on average assets 1.61% 1.67% 1.68% 1.73% 1 Non-GAAP financial measure which management believes facilitates a better understanding of the Company’s financial condition. See Appendix for Non-GAAP reconciliations. All dollars shown in thousands, except per share amounts 6
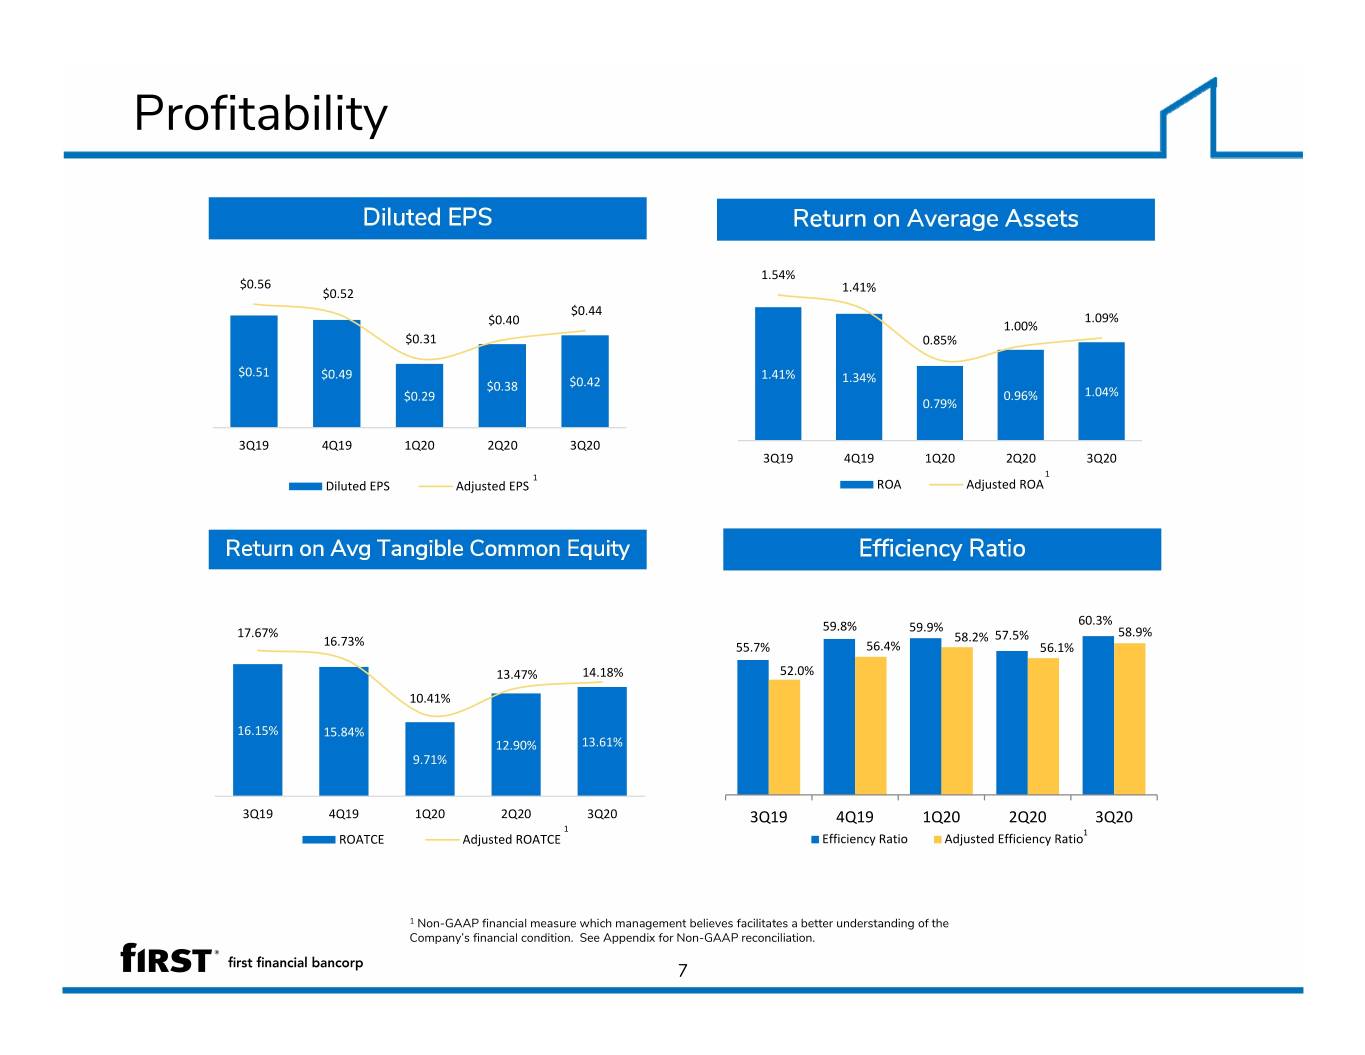
Profitability Diluted EPS Return on Average Assets 1.54% $0.56 $0.52 1.41% $0.44 1.09% $0.40 1.00% $0.31 0.85% $0.51 $0.49 1.41% 1.34% $0.38 $0.42 $0.29 0.96% 1.04% 0.79% 3Q19 4Q19 1Q20 2Q20 3Q20 3Q19 4Q19 1Q20 2Q20 3Q20 1 1 Diluted EPS Adjusted EPS ROA Adjusted ROA Return on Avg Tangible Common Equity Efficiency Ratio 59.8% 59.9% 60.3% 17.67% 58.2% 57.5% 58.9% 16.73% 55.7% 56.4% 56.1% 13.47% 14.18% 52.0% 10.41% 16.15% 15.84% 12.90% 13.61% 9.71% 3Q19 4Q19 1Q20 2Q20 3Q20 3Q19 4Q19 1Q20 2Q20 3Q20 1 1 ROATCE Adjusted ROATCE Efficiency Ratio Adjusted Efficiency Ratio 1 Non-GAAP financial measure which management believes facilitates a better understanding of the Company’s financial condition. See Appendix for Non-GAAP reconciliation. 7

Net Interest Income & Margin Net Interest Margin (FTE) 3.96% Net Interest Income 3.89% 3.77% 0.21% 0.21% 0.15% 0.16% 0.14% 0.10% 3.44% $121.5 3.36% $118.9 0.17% $6.8 $114.3 0.16% $6.7 $111.6 $112.2 0.18% $4.6 $4.9 0.23% $4.5 $3.1 $4.5 $6.2 $5.8 $5.4 3.60% 3.54% 3.51% $3.3 $3.8 3.09% 2.97% 3Q19 4Q19 1Q20 2Q20 3Q20 Basic Margin (FTE) Loan Fees Purchase Accounting 1 Includes impact of PPP 3Q20 NIM (FTE) Progression 2Q20 3.44% Asset yield / mix -0.19% 3Q19 4Q19 1Q20 2Q20 3Q20 Funding cost / mix 0.14% PPP Loan/Funding -0.03% Loan Fees Loan Accretion PPP Interest/Fees 3Q20 3.36% All dollars shown in millions 8

Average Balance Sheet Average Loans Average Deposits 0.80% 5.58% 5.33% 0.74% 5.04% 0.64% 4.25% 4.00% 0.40% 0.27% $10,253 $9,221 $10,002 $9,014 $9,149 $11,731 $11,563 $10,018 $10,222 $10,234 3Q19 4Q19 1Q20 2Q20 3Q20 3Q19 4Q19 1Q20 2Q20 3Q20 Gross Loans Loan Yield (Gross)1 Total Deposits Cost of Deposits Average Securities 3.21% 3.16% 3.04% 2.97% 2.86% $3,291 $3,103 $3,116 $3,164 $3,163 3Q19 4Q19 1Q20 2Q20 3Q20 Average Investment Securities Investment Securities Yield All dollars shown in millions 1 Includes loans fees and purchase accounting accretion 9

Loan Portfolio Loan LOB Mix (EOP) Net Loan Change-LOB (Linked Quarter) Total $10.2 Billion Franchise ICRE $88.0 $452 4% Oak Street Commercial ‐$0.7 Mortgage $609 $1,100 6% Small Business Banking ‐$27.6 11% PPP1 Consumer $886 Other Consumer ‐$1.6 $846 9% $74 8% 1% Mortgage ‐$7.8 Small Business Oak Street ‐$16.9 Banking $998 10% Franchise ‐$10.7 PPP $0.8 Commercial ICRE Other ‐$4.4 $1,661 $3,575 16% 35% Total growth/(decline): $19.1 million 1 Net of unearned fees of $24.2 million All dollars shown in millions 10

Deposits Deposit Product Mix (Avg) 3Q20 Average Deposit Progression Total $11.6 billion Interest‐bearing demand $89.3 Public Funds Interest‐bearing Noninterest‐bearing $179.1 $1,667 demand 14% $1,611 14% Brokered CDs Savings $62.0 $683 6% Money Markets $87.0 Retail CDs $1,234 Noninterest‐ Retail CDs 11% bearing ‐$84.6 $3,343 29% Brokered CDs ‐$503.9 Money Markets $1,986 17% Savings Public Funds $2.5 $1,039 9% Total growth/(decline): ($168.6 million) All dollars shown in millions 11
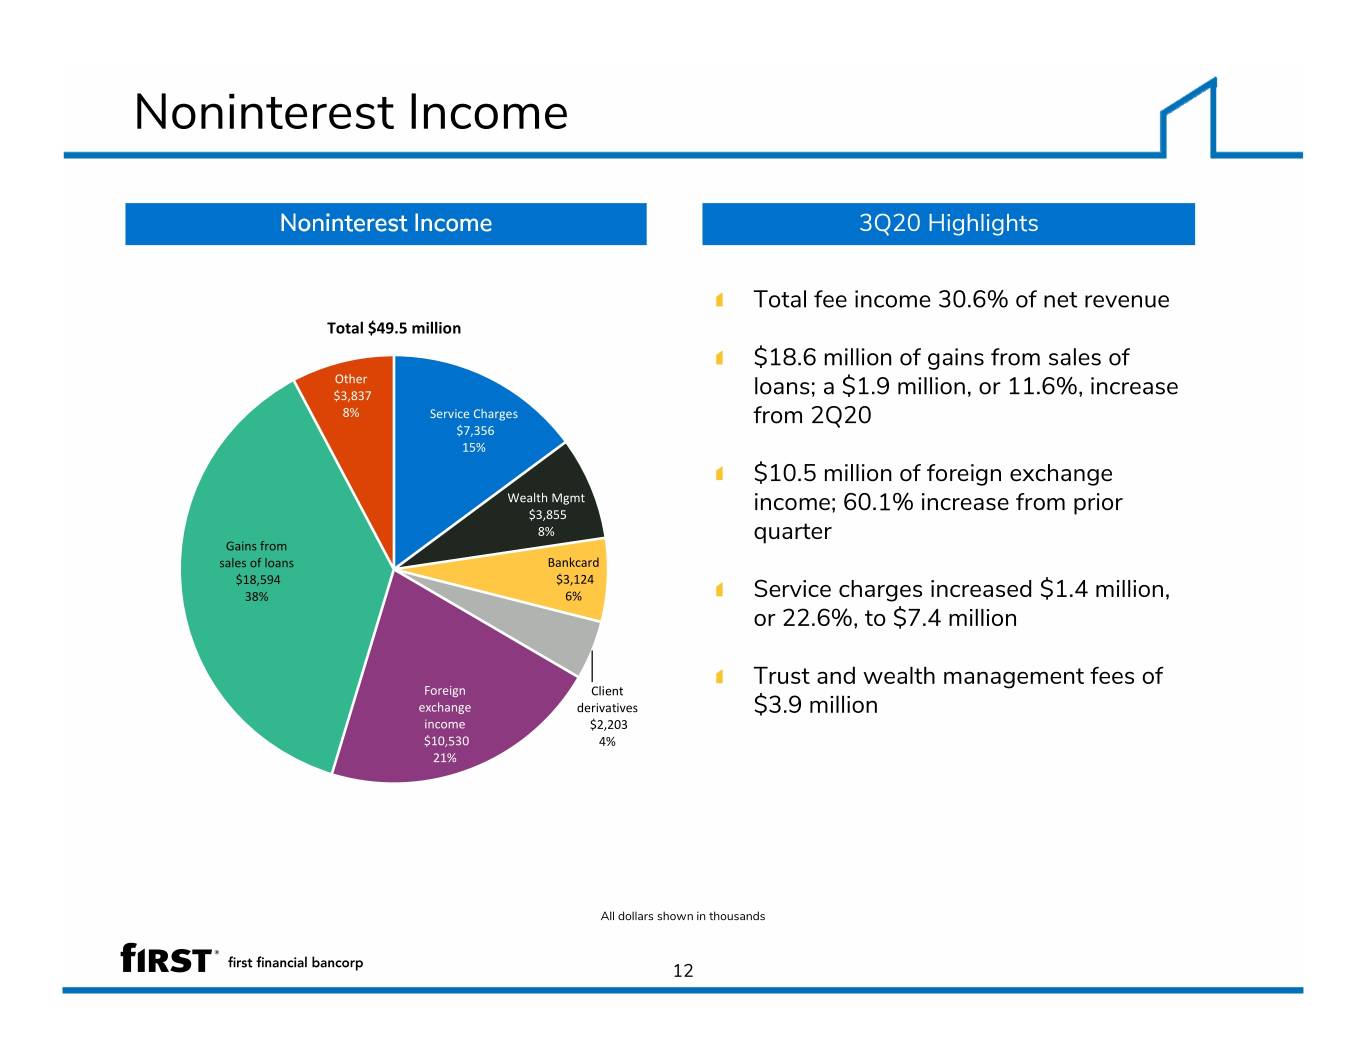
Noninterest Income Noninterest Income 3Q20 Highlights Total fee income 30.6% of net revenue Total $49.5 million $18.6 million of gains from sales of Other $3,837 loans; a $1.9 million, or 11.6%, increase 8% Service Charges $7,356 from 2Q20 15% $10.5 million of foreign exchange Wealth Mgmt $3,855 income; 60.1% increase from prior 8% Gains from quarter sales of loans Bankcard $18,594 $3,124 38% 6% Service charges increased $1.4 million, or 22.6%, to $7.4 million Foreign Client Trust and wealth management fees of exchange derivatives $3.9 million income $2,203 $10,530 4% 21% All dollars shown in thousands 12

Noninterest Expense Noninterest Expense 3Q20 Highlights Includes $0.1 million of COVID-19 Intangible Total $97.5 million amortization related expenses $2,779 3% Professional Other $2.1 million related to other non- services $12,420 $2,443 13% recurring expenses such as merger 3% related and branch consolidation costs Data processing $7.0 million of incremental incentive $6,837 compensation 7% $4.4 million related to improved Occupancy and equipment operating results $9,263 Salaries and 9% benefits $2.6 million of commissions $63,769 65% directly related to mortgage and foreign exchange $0.5 million contribution to First Financial Foundation All dollars shown in thousands 13

Current Expected Credit Losses - Loans and Leases ACL/Total Loans 3Q20 Highlights $168.5 million, or 1.65% of loan balances; 1.81% 1.55% 1.56% 1.65% excluding PPP 1.29% $168.5 $158.7 $15.3 million provision expense driven by expected $143.9 economic impact of COVID-19, partially offset by $119.2 0.62% 0.63% increase in prepayment rates $56.6 $57.7 Utilized final September Moody’s baseline forecast in quantitative model 1 1 1 3Q19 4Q19 1/1/2020 1Q20 2Q20 3Q20 $14.8 million ACL – unfunded commitments; $1.9 million provision recapture for this portion of the Allowance for Credit Losses ACL / Total Loans ACL due to increase in prepayment rates ACL by Loan Type Adoption Impact 12/31/2019 1/1/2020 3/31/2020 6/30/2020 9/30/2020 Loans $119.2 million, an increase of $61.5 million Commercial and industrial$ 18,584 $ 28,485 $ 45,409 $ 50,421 $ 50,516 Lease financing 971 1,089 1,494 1,431 1,287 from 12/31/19 Real estate ‐construction 2,381 13,960 13,511 15,357 18,970 Real estate ‐ commercial 23,579 47,697 53,155 62,340 72,207 Real estate ‐ residential 5,299 10,789 11,284 10,581 9,286 Day 1 increase driven by acquired loans and Home equity 4,787 13,217 14,827 14,236 12,530 life of loan expectations compared to the Installment 392 1,193 1,238 1,226 1,237 incurred loss model Credit card 1,657 2,726 2,967 3,069 2,511 1 ACL‐loan and lease losses $ 57,650 $ 119,155 $ 143,885 $ 158,661 $ 168,544 1 ACL‐unfunded commitments $ 585 $ 12,740 $ 14,308 $ 16,678 $ 14,753 1 Beginning January 1, 2020, calculation is based on current expected credit loss methodology. Prior to January 1, 2020, calculation was based on the incurred loss methodology. All dollars shown in thousands 14

Asset Quality Classified Assets / Total Assets Nonperforming Assets / Total Assets 0.92% 0.83% 0.79% 0.84% 0.56% 0.55% 0.42% 0.48% 0.49% 0.62% $132.5 $134.0 $124.5 $125.5 $87.3 $80.8 $78.1 $72.2 $89.3 $61.6 3Q19 4Q19 1Q20 2Q20 3Q20 3Q19 4Q19 1Q20 2Q20 3Q20 Classified Assets Classified Assets / Total Assets NPAs NPAs / Total Assets Net Charge Offs & Provision Expense2 $25.4 0.45% $20.2 $13.4 0.15% 0.21% $10.2 0.12% $5.0 $3.1 $5.4 $3.5 $4.8 ‐0.04% ‐$0.9 1 1 1 3Q19 4Q19 1Q20 2Q20 3Q20 NCOs Provision Expense NCOs / Average Loans 1 Beginning January 1,2020, calculation is based on current expected loss methodology. Prior to January 1, 2020, calculation was based on the incurred loss methodology. 2 Provision includes both loans & leases and unfunded commitments All dollars shown in millions 15
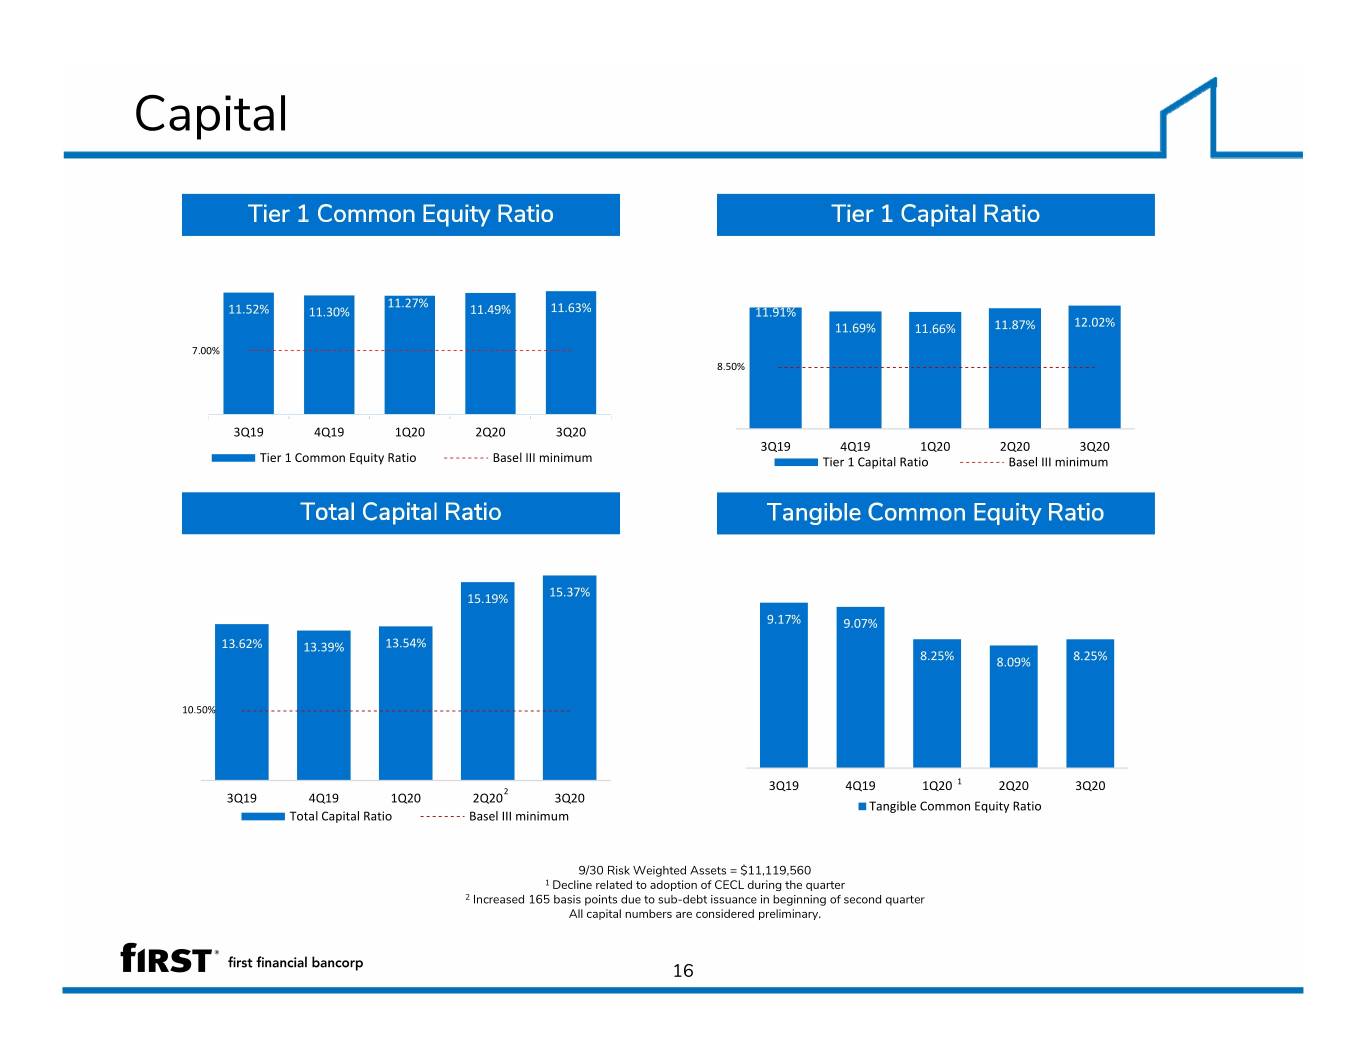
Capital Tier 1 Common Equity Ratio Tier 1 Capital Ratio 11.27% 11.52% 11.30% 11.49% 11.63% 11.91% 11.69% 11.66% 11.87% 12.02% 7.00% 8.50% 3Q19 4Q19 1Q20 2Q20 3Q20 3Q19 4Q19 1Q20 2Q20 3Q20 Tier 1 Common Equity Ratio Basel III minimum Tier 1 Capital Ratio Basel III minimum Total Capital Ratio Tangible Common Equity Ratio 15.19% 15.37% 9.17% 9.07% 13.62% 13.39% 13.54% 8.25% 8.09% 8.25% 10.50% 1 2 3Q19 4Q19 1Q20 2Q20 3Q20 3Q19 4Q19 1Q20 2Q20 3Q20 Tangible Common Equity Ratio Total Capital Ratio Basel III minimum 9/30 Risk Weighted Assets = $11,119,560 1 Decline related to adoption of CECL during the quarter 2 Increased 165 basis points due to sub-debt issuance in beginning of second quarter All capital numbers are considered preliminary. 16
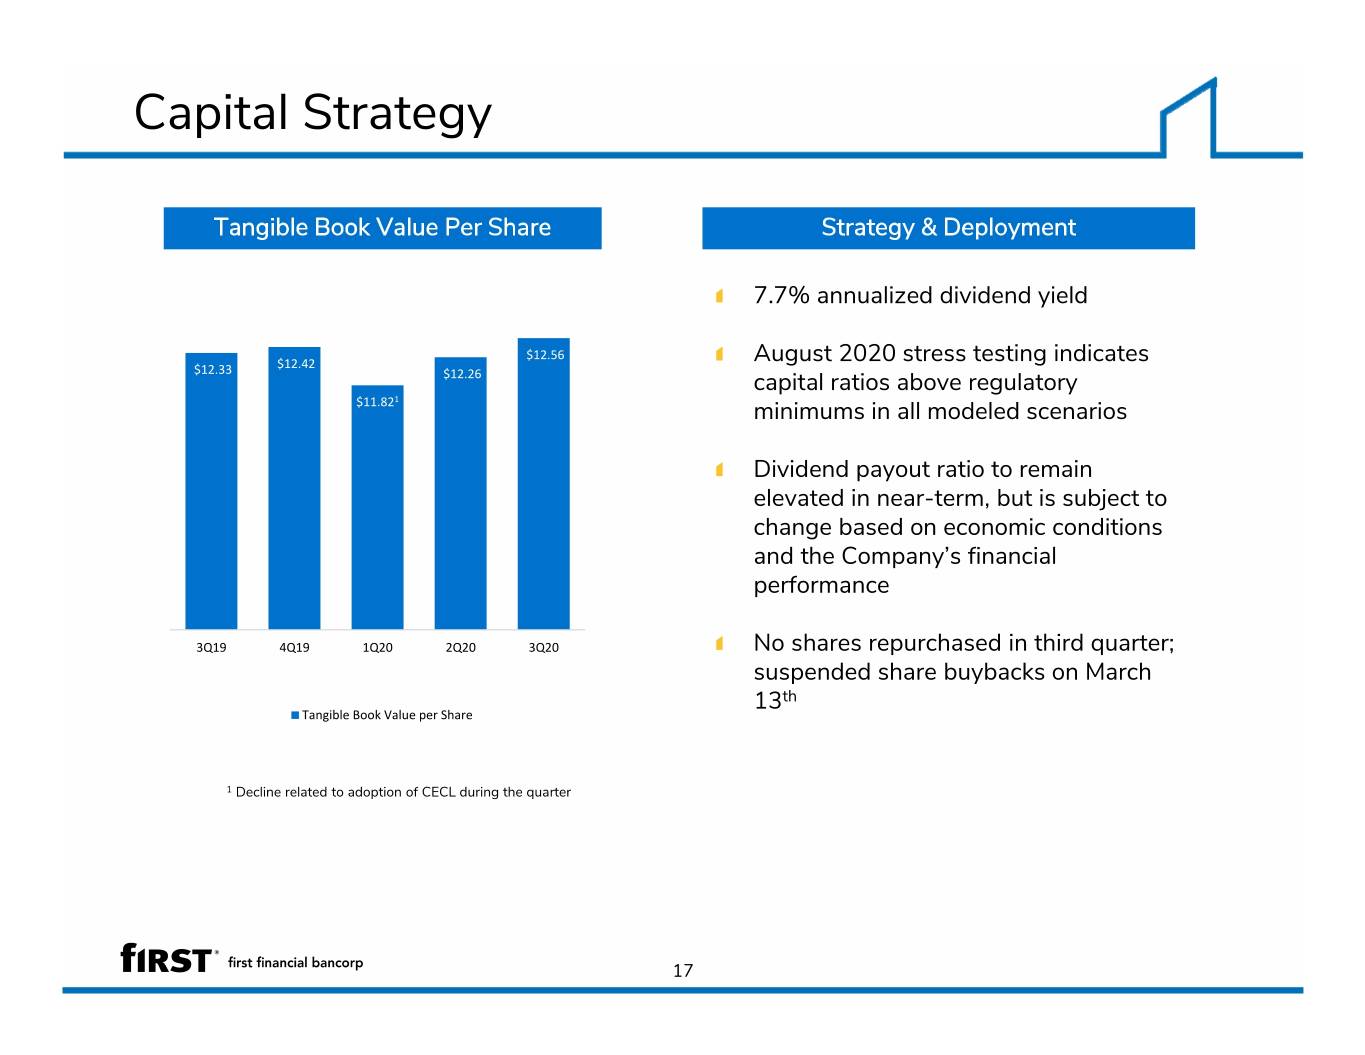
Capital Strategy Tangible Book Value Per Share Strategy & Deployment 7.7% annualized dividend yield $12.56 August 2020 stress testing indicates $12.33 $12.42 $12.26 capital ratios above regulatory $11.821 minimums in all modeled scenarios Dividend payout ratio to remain elevated in near-term, but is subject to change based on economic conditions and the Company’s financial performance 3Q19 4Q19 1Q20 2Q20 3Q20 No shares repurchased in third quarter; 1 suspended share buybacks on March th Tangible Book Value per Share 13 1 Decline related to adoption of CECL during the quarter 17

COVID – 19 Related Information

Loan Concentrations C&I Loans by Industry 1 CRE Loans by Collateral 2 C&I Loans: $4.4B CRE Loans: $3.9B Strip Center Accommodation 6% Office & Food Services 14% 13% Real Estate Manufacturing Hotel/Motel 10% 14% 11% Nursing/Assisted Living 5% Health Care Retail 7% 17% Residential, 1‐4 Finance & Family Construction Insurance 3% 6% 16% Restaurant 3% Industrial Facility Professional & 3% Tech Residential, Multi Other 5% Other Family 5+ 15% 15% Retail Trade 23% 5% Other Services Wholesale Trade 5% 4% 1 Industry types included in Other representing greater than 1% of total C&I loans include Agriculture, Transportation & Warehousing, Public Administration, Arts & Recreation, Waste Management, Educational Services, and Management of Companies & Enterprises. Includes owner- occupied CRE. 2 Collateral types included in Other representing greater than 1% of total CRE loans include Warehouse, Medical Office, Student Housing, Real Estate IUB Other, and Vacant Land Not Held for Development. 19

Loan Portfolio - Areas of Focus Loans (EOP) Areas of Focus Total $10.2 Billion Franchise Asset classes with areas of focus $452 5% Hotels PPP: $910 million in balances or 9% $431 4% of total loans Retail ICRE $831 Franchise: $452 million in balances, 8% All other loans or 5% of total loans $7,577 74% PPP $910 9% Hotels: $431 million in balances, or 4% of total loans Retail CRE: $831 million in balances, or 8% of total loans All dollars shown in millions 20

Area of Focus – Paycheck Protection Program $910 million, or 9% of the total PPP Portfolio by Division portfolio; $24.2 million of unearned Total $910.3 fees as of September 30 Commercial Finance $64.8 Forgiveness portal opened as of Consumer 7% Banking ICRE 8/31/20 $408.9 $26 45% 3% As of 9/30/20, the Bank has submitted applications for reimbursement with the SBA Commercial $410.6 totaling $74 million of loan balances 45% As of 9/30/20, $4.3 million of loans have received approval from SBA for PPP Portfolio Top 5 Industries reimbursement $200 800 $180 700 $160 600 $140 $120 500 $100 400 Balances $80 300 $60 200 Number or Loans $40 $20 100 $0 0 Manufacturing Profess, Scientific, Construction Health Care Social Accomm. & Food & Tech Services Asst Services Balances Number of Loans All dollars shown in millions 21
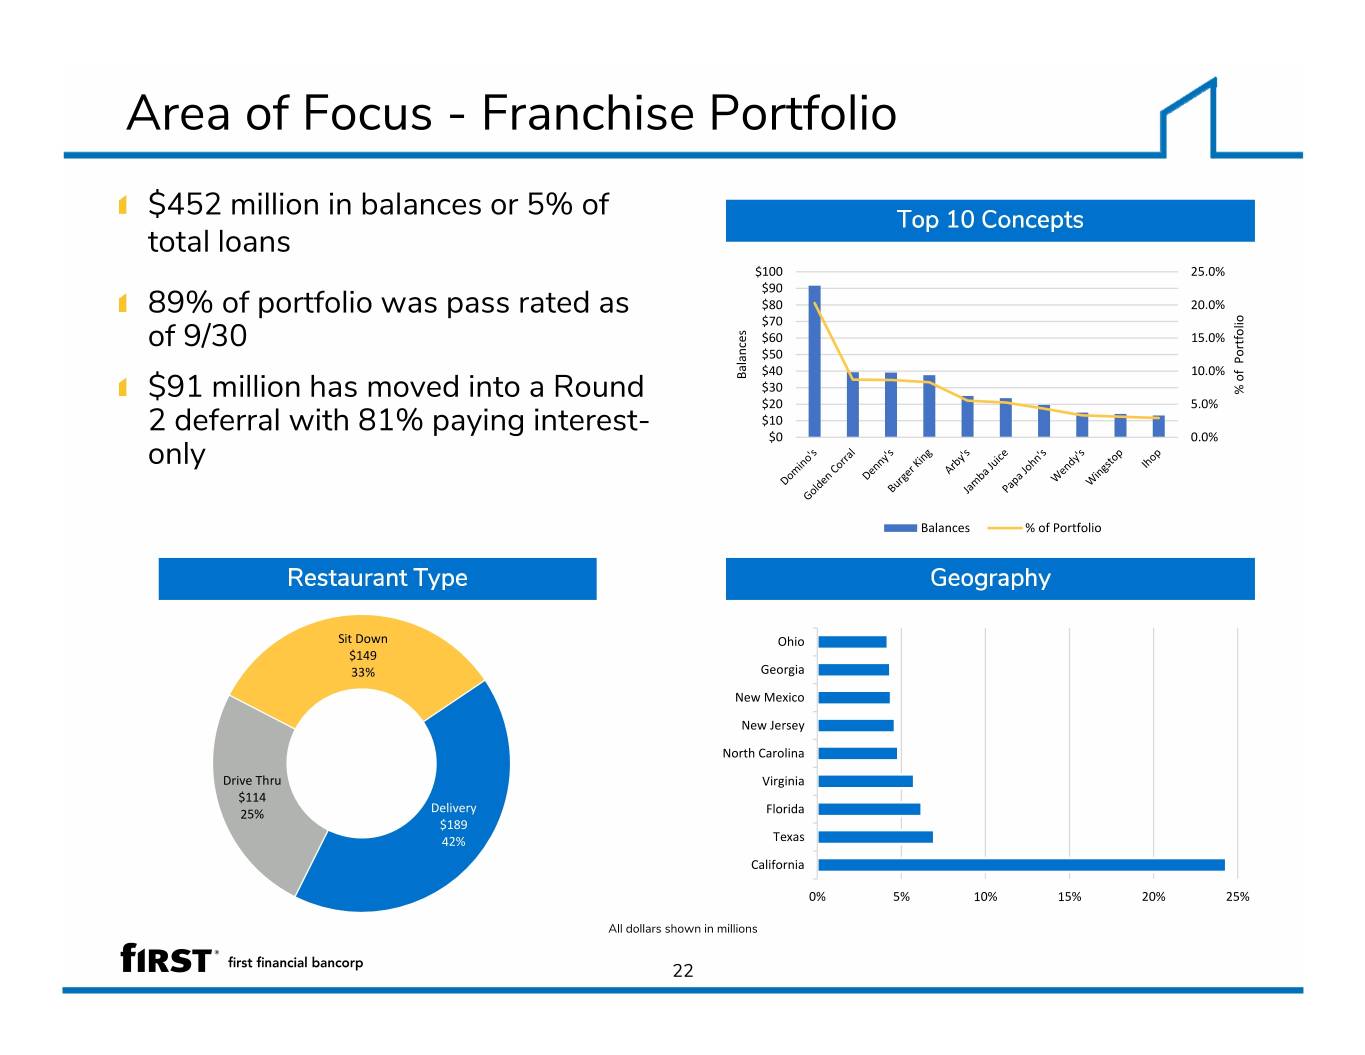
Area of Focus - Franchise Portfolio $452 million in balances or 5% of Top 10 Concepts total loans $100 25.0% $90 $80 20.0% 89% of portfolio was pass rated as $70 $60 15.0% of 9/30 $50 $40 10.0% Balances $30 % of Portfolio $91 million has moved into a Round $20 5.0% $10 2 deferral with 81% paying interest- $0 0.0% only Balances % of Portfolio Restaurant Type Geography Sit Down Ohio $149 33% Georgia New Mexico New Jersey North Carolina Drive Thru Virginia $114 25% Delivery Florida $189 42% Texas California 0% 5% 10% 15% 20% 25% All dollars shown in millions 22
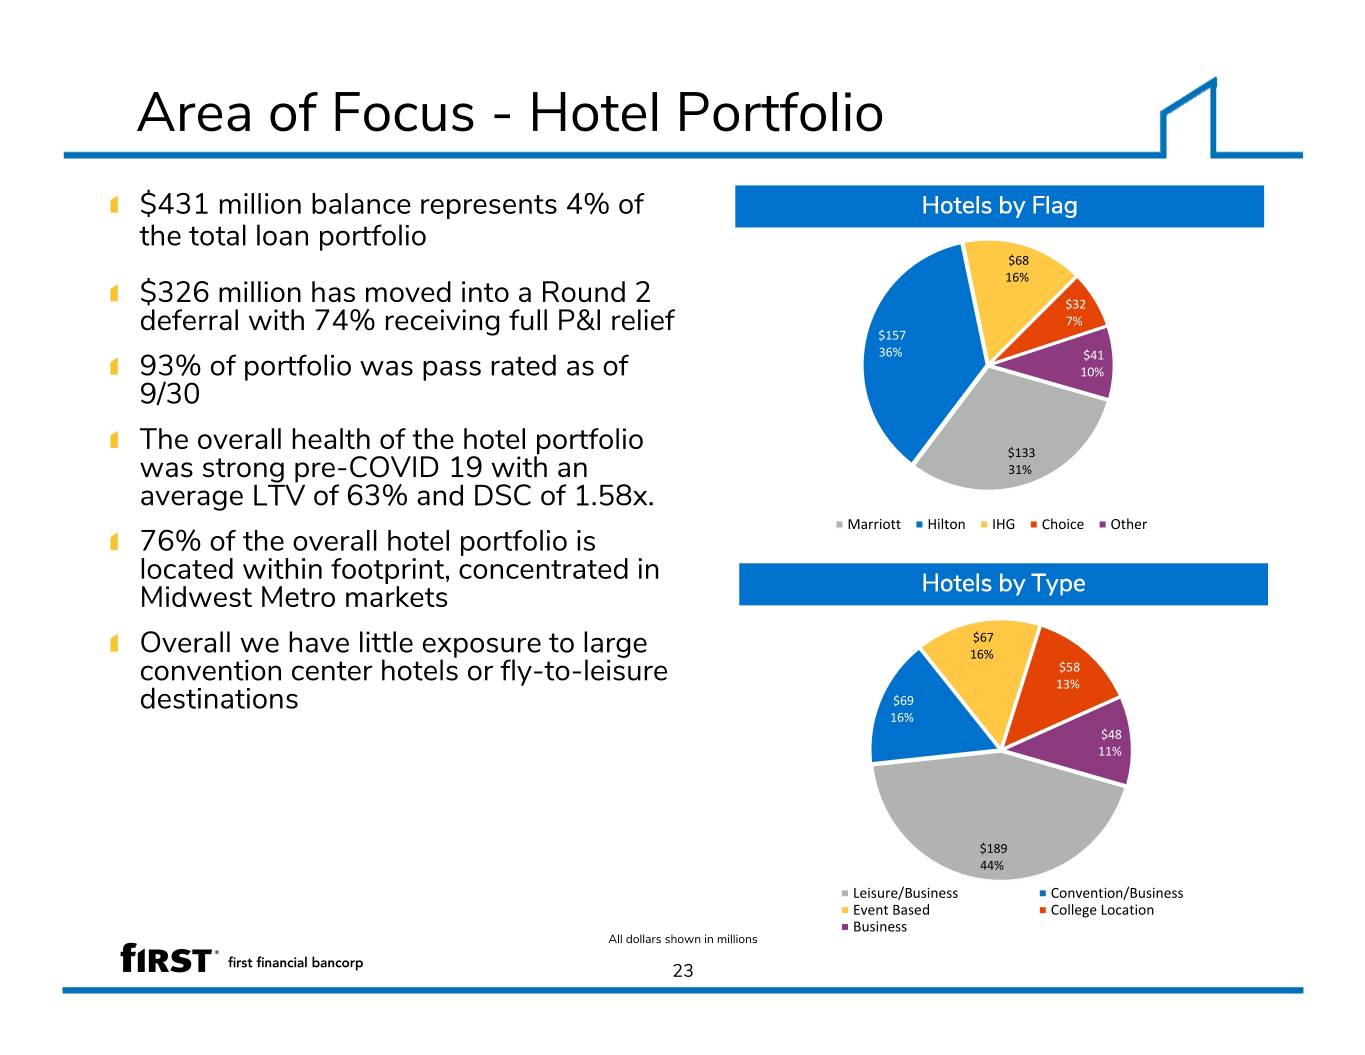
Area of Focus - Hotel Portfolio $431 million balance represents 4% of Hotels by Flag the total loan portfolio $68 16% $326 million has moved into a Round 2 $32 7% deferral with 74% receiving full P&I relief $157 36% $41 93% of portfolio was pass rated as of 10% 9/30 The overall health of the hotel portfolio $133 was strong pre-COVID 19 with an 31% average LTV of 63% and DSC of 1.58x. Marriott Hilton IHG Choice Other 76% of the overall hotel portfolio is located within footprint, concentrated in Hotels by Type Midwest Metro markets $67 Overall we have little exposure to large 16% $58 convention center hotels or fly-to-leisure 13% $69 destinations 16% $48 11% $189 44% Leisure/Business Convention/Business Event Based College Location Business All dollars shown in millions 23

Area of Focus - ICRE Retail $831 million, or 8% of the total State portfolio $300 $250 96% or $481 million of deferral balances have returned to a $200 normal payment schedule $150 $100 67% of the overall Retail $50 portfolio is located within $0 footprint OH IN KY NY SC NC NE IL MD WV 2019 data (pre-COVID 19) indicates the portfolio has an Retail Properties >$3 million average LTV of 67% $300 Bank has focused on strong $250 locations with adequately $200 capitalized sponsors. $150 $100 $50 $0 Power Anchored Unanchored Other Single Lifestyle Center Strip Strip Tenant Center All dollars shown in millions 24
Deferral Portfolio Reporting September 30, 2020

Round 1 Deferrals $2.2 billion of loans received an Round 1 Deferrals by loan type initial deferral Total $2.2 Billion Mortgage Round 1 deferrals universally C&I $102 granted $826 5% 37% Approximately 20% of entire loan Consumer $29 portfolio received an initial deferral 1% $1.3 billion, or 57%, of initial deferrals were ICRE ICRE $2.1 billion, or 96%, of the $2.2 $1,257 billion deferral portfolio has exited 57% Round 1 $1.5 billion, or 70%, has returned to Round 1 Deferral Status as of 9/30/2020 a normal payment schedule $631 million, or 30%, has moved Round 1 Deferral Round 1 deferral Loan Type Round 1 Deferral Expired not yet expired into Round 2 ICRE $ 1,256,663 $ 1,229,093 $ 27,570 $85 million, or 4%, of Round 1 C&I 825,623 784,650 40,973 deferrals yet to expire Mortgage 101,603 95,004 6,599 Consumer 29,481 19,867 9,615 Total Deferral Portfolio $ 2,213,370 $ 2,128,613 $ 84,757 All dollars shown in millions 26

Round 2 Deferrals Round 2 Deferrals $2.1 billion, or 96%, of the $2.2 Total $631.2 Million billion deferral portfolio has exited Mortgage Round 1 C&I $ 12,511 $ 183,842 2% $1.5 billion, or 70%, has returned to a 29% Consumer normal payment schedule $ 1,547 $631 million, or 6.2% of total loans, 0% has moved into Round 2 ICRE Round 2 deferrals – 6.2% of total $ 433,294 loans 69% Granted on a case by case basis Relationship managers performed enhanced due diligence of borrower Deferral Status as of 9/30/2020 operations, financial condition, liquidity and cash flow during the deferral period Round 1 Deferral Round 1 Deferral Returned to Normal Round 2 Deferral 69% of Round 2 deferrals for ICRE Loan Type Expired Payment Schedule Granted borrowers ICRE$ 1,229,093 $ 795,799 $ 433,294 $185 million, or 29%, of Round 2 C&I 784,650 600,808 183,842 deferrals are making interest only Mortgage 95,004 82,493 12,511 payments Consumer 19,867 18,320 1,547 Total Deferral Portfolio $ 2,128,613 $ 1,497,419 $ 631,194 All dollars shown in millions 27

Areas of Focus - Round 1 Deferrals Franchise Round 1 Deferrals $284 million, or 63%, of total franchise portfolio, Total $2.2 Billion secured a Round 1 deferral Other $177 million, or 66%, of $1,052 expired Round 1 deferrals 47% have returned to a normal payment schedule Franchise $284 13% Hotel Retail Hotel $505 $372 $372 million, or 17%, of 23% total Round 1 deferrals 17% $25 million, or 7%, have returned to normal payment schedule Deferral Status as of 9/30/2020 ICRE Retail Round 1 $505 million, or 61%, of Deferrals total ICRE Retail portfolio, Round 1 Returned to Round 2 secured a Round 1 deferral Round 1 Deferrals Normal Payment Deferrals $481 million, or 96%, of Area of Focus Deferrals Expired Schedule Granted expired Round 1 deferrals Franchise$ 284,306 $ 267,760 $ 176,843 $ 90,917 have returned to a normal Hotel 371,897 371,897 24,605 347,292 payment schedule ICRE 504,759 500,857 481,321 19,536 Total - Areas of Focus $ 1,160,962 $ 1,140,514 $ 682,769 $ 457,745 All dollars shown in millions 28
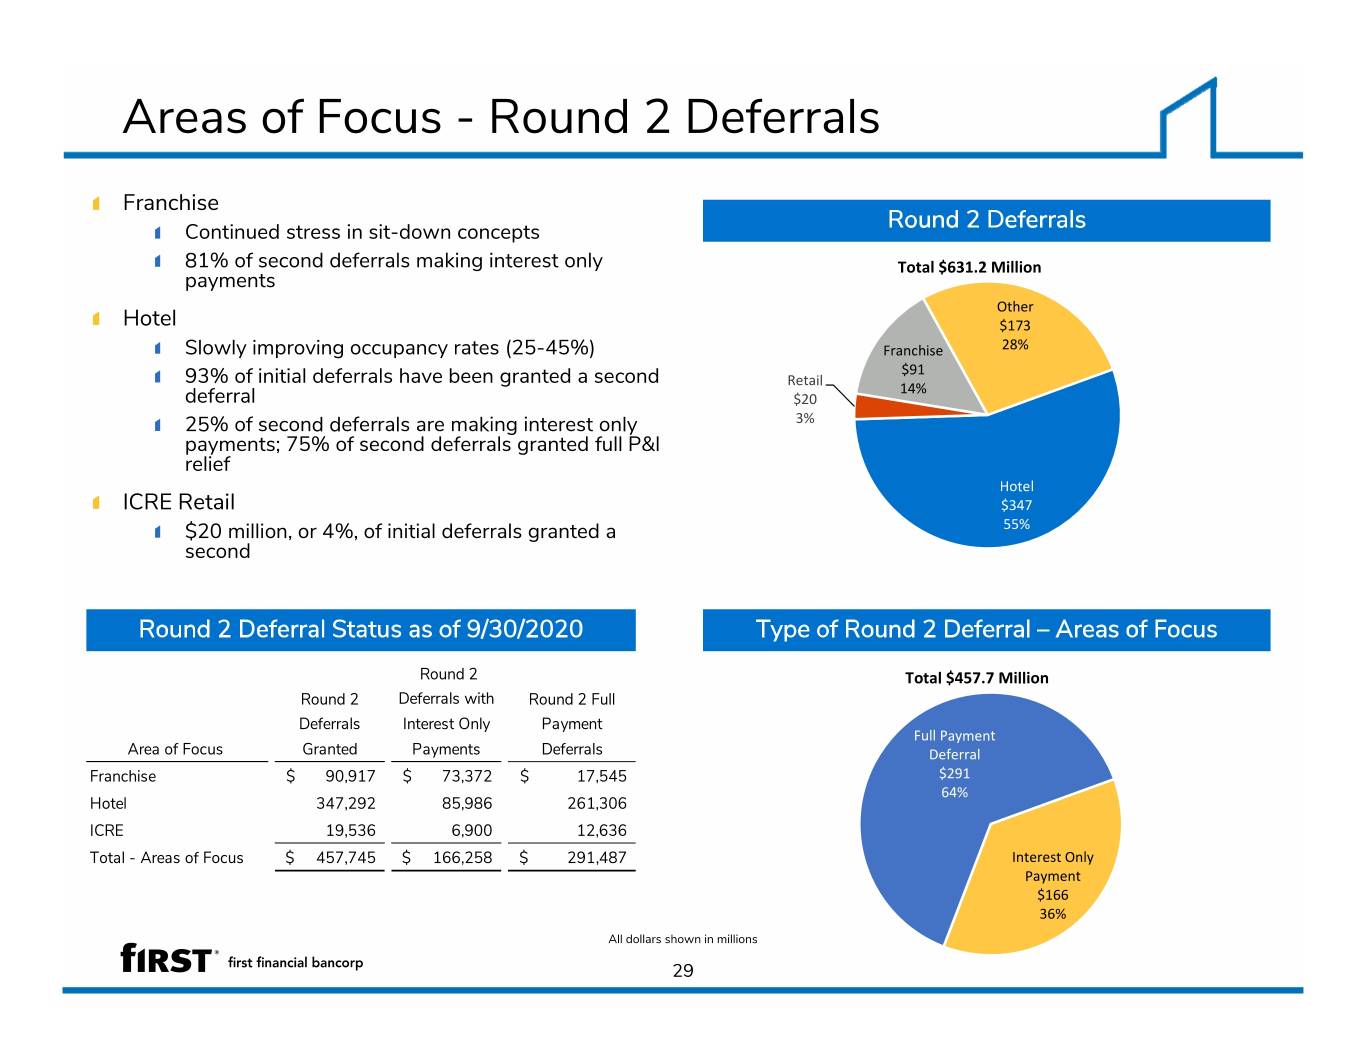
Areas of Focus - Round 2 Deferrals Franchise Continued stress in sit-down concepts Round 2 Deferrals 81% of second deferrals making interest only Total $631.2 Million payments Other Hotel $173 Slowly improving occupancy rates (25-45%) Franchise 28% $91 Retail 93% of initial deferrals have been granted a second 14% deferral $20 25% of second deferrals are making interest only 3% payments; 75% of second deferrals granted full P&I relief Hotel ICRE Retail $347 $20 million, or 4%, of initial deferrals granted a 55% second Round 2 Deferral Status as of 9/30/2020 Type of Round 2 Deferral – Areas of Focus Round 2 Total $457.7 Million Round 2 Deferrals with Round 2 Full Deferrals Interest Only Payment Full Payment Area of Focus Granted Payments Deferrals Deferral Franchise$ 90,917 $ 73,372 $ 17,545 $291 64% Hotel 347,292 85,986 261,306 ICRE 19,536 6,900 12,636 Total - Areas of Focus $ 457,745 $ 166,258 $ 291,487 Interest Only Payment $166 36% All dollars shown in millions 29
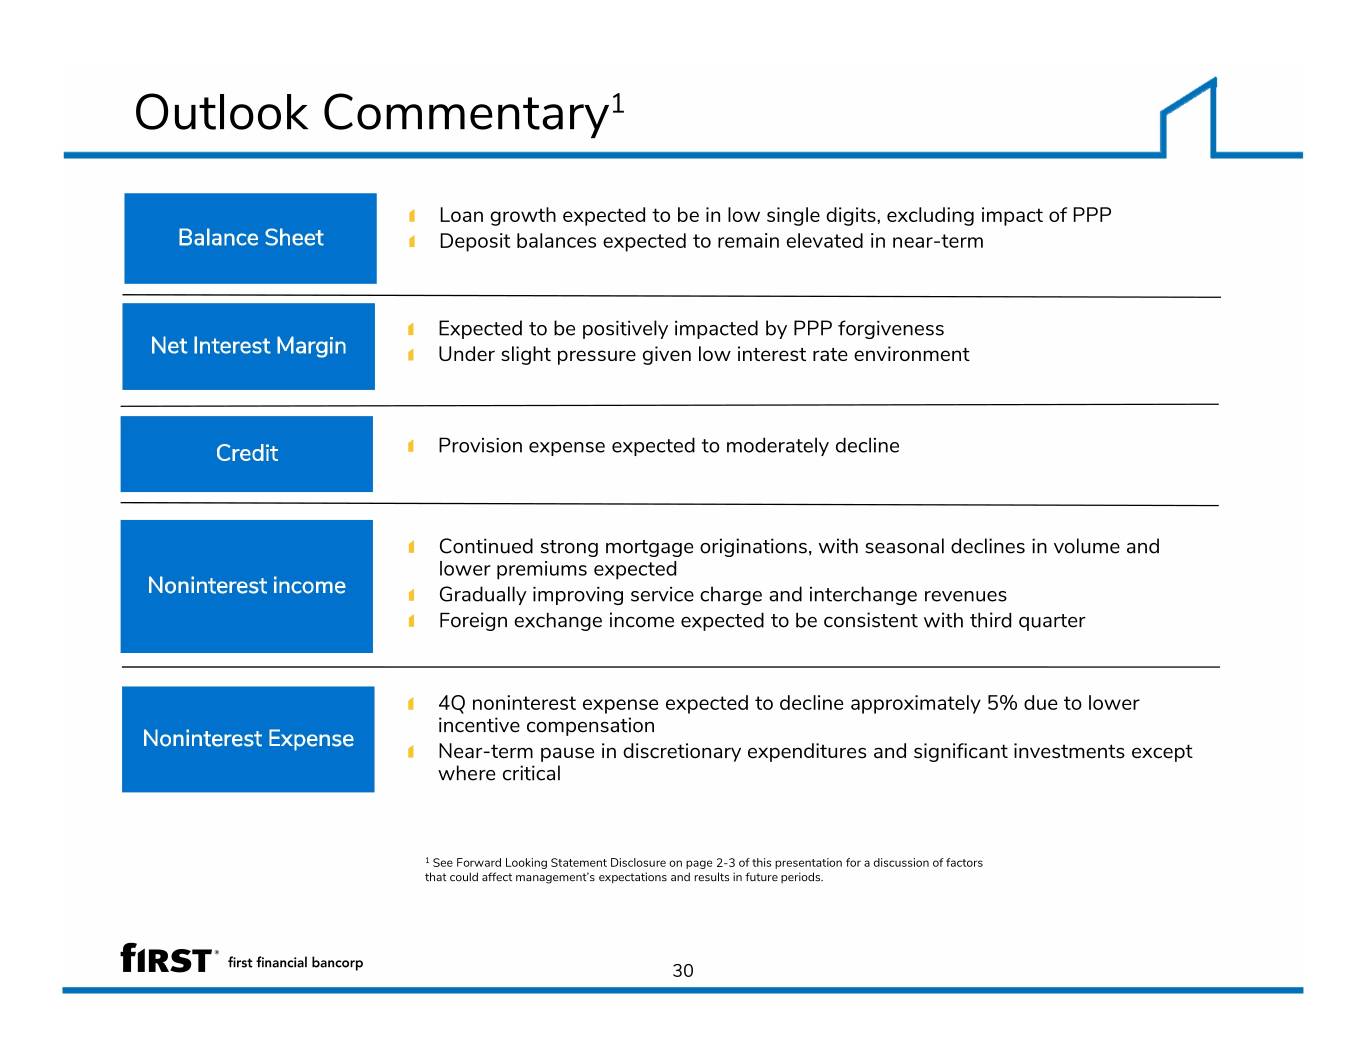
Outlook Commentary1 Loan growth expected to be in low single digits, excluding impact of PPP Balance Sheet Deposit balances expected to remain elevated in near-term Expected to be positively impacted by PPP forgiveness Net Interest Margin Under slight pressure given low interest rate environment Credit Provision expense expected to moderately decline Continued strong mortgage originations, with seasonal declines in volume and lower premiums expected Noninterest income Gradually improving service charge and interchange revenues Foreign exchange income expected to be consistent with third quarter 4Q noninterest expense expected to decline approximately 5% due to lower incentive compensation Noninterest Expense Near-term pause in discretionary expenditures and significant investments except where critical 1 See Forward Looking Statement Disclosure on page 2-3 of this presentation for a discussion of factors that could affect management’s expectations and results in future periods. 30
Appendix: Non-GAAP Measures The Company’s Investor Presentation contains certain financial information determined by methods other than in accordance with accounting principles generally accepted in the United States (GAAP). Such non-GAAP financial information should be considered supplemental to, and not as a substitute for, or superior to, financial measures calculated in accordance with GAAP. However, we believe that non-GAAP reporting provides meaningful information and therefore we use it to supplement our GAAP information. We have chosen to provide this supplemental information to investors, analysts and other interested parties to enable them to perform additional analyses of operating results, to illustrate the results of operations giving effect to the non-GAAP adjustments and to provide an additional measure of performance. We believe this information is helpful in understanding the results of operations separate and apart from items that may, or could, have a disproportional positive or negative impact in any given period. For a reconciliation of the differences between the non-GAAP financial measures and the most comparable GAAP measures, please refer to the following reconciliation tables. to GAAP Reconciliation 31

Appendix: Non-GAAP to GAAP Reconciliation Net interest income and net interest margin - fully tax equivalent Three months ended Sep. 30, June 30, Mar. 31, Dec. 31, Sep. 30, 2020 2020 2020 2019 2019 Net interest income $ 112,180 $ 111,576 $ 114,282 $ 118,902 $ 121,535 Tax equivalent adjustment 1,628 1,664 1,624 1,630 1,759 Net interest income - tax equivalent$ 113,808 $ 113,240 $ 115,906 $ 120,532 $ 123,294 Average earning assets $ 13,456,501 $ 13,258,612 $ 12,375,698 $ 12,288,761 $ 12,343,327 Net interest margin1 3.32 % 3.38 % 3.71 % 3.84 % 3.91 % Net interest margin (fully tax equivalent)1 3.36 % 3.44 % 3.77 % 3.89 % 3.96 % 1 Margins are calculated using net interest income annualized divided by average earning assets. The tax equivalent adjustment to net interest income recognizes the income tax savings when comparing taxable and tax-exempt assets and assumes a 21% tax rate. Management believes that it is a standard practice in the banking industry to present net interest margin and net interest income on a fully tax equivalent basis. Therefore, management believes these measures provide useful information to investors by allowing them to make peer comparisons. Management also uses these measures to make peer comparisons. All dollars shown in thousands 32

Appendix: Non-GAAP to GAAP Reconciliation Additional non-GAAP ratios Three months ended Sep. 30, June 30, Mar. 31, Dec. 31, Sep. 30, (Dollars in thousands, except per share data) 2020 2020 2020 2019 2019 Net income (a) $ 41,477 $ 37,393 $ 28,628 $ 48,677 $ 50,856 Average total shareholders' equity 2,230,422 2,185,865 2,209,733 2,245,107 2,210,327 Less: Goodw ill (937,771) (937,771) (937,771) (937,710) (899,888) Other intangibles (69,169) (72,086) (75,014) (78,190) (51,365) MSR's (11,274) (10,254) (10,608) (10,367) (10,118) Average tangible equity (b) 1,212,208 1,165,754 1,186,340 1,218,840 1,248,956 Total shareholders' equity 2,247,815 2,221,019 2,179,383 2,247,705 2,261,313 Less: Goodw ill (937,771) (937,771) (937,771) (937,771) (937,689) Other intangibles (67,419) (70,325) (73,258) (76,201) (79,506) MSR's (12,011) (11,250) (10,278) (10,650) (10,293) Ending tangible equity (c) 1,230,614 1,201,673 1,158,076 1,223,083 1,233,825 Total assets 15,925,647 15,870,890 15,057,567 14,511,625 14,480,445 Less: Goodw ill (937,771) (937,771) (937,771) (937,771) (937,689) Other intangibles (67,419) (70,325) (73,258) (76,201) (79,506) MSR's (12,011) (11,250) (10,278) (10,650) (10,293) Ending tangible assets (d) 14,908,446 14,851,544 14,036,260 13,487,003 13,452,957 Risk-w eighted assets (e) 11,119,560 11,034,570 11,027,347 11,023,795 10,883,554 Total average assets 15,842,010 15,710,204 14,524,422 14,460,288 14,320,514 Less: Goodw ill (937,771) (937,771) (937,771) (937,710) (899,888) Other intangibles (69,169) (72,086) (75,014) (78,190) (51,365) MSR's (11,274) (10,254) (10,608) (10,367) (10,118) Average tangible assets (f)$ 14,823,796 $ 14,690,093 $ 13,501,029 $ 13,434,021 $ 13,359,143 Ending shares outstanding (g) 97,999,763 98,018,858 97,968,958 98,490,998 100,094,819 Ratios Return on average tangible shareholders' equity (a)/(b) 13.61% 12.90% 9.71% 15.84% 16.15% Ending tangible equity as a percent of: Ending tangible assets (c)/(d) 8.25% 8.09% 8.25% 9.07% 9.17% Risk-w eighted assets (c)/(e) 11.07% 10.89% 10.50% 11.09% 11.34% Average tangible equity as a percent of average tangible assets (b)/(f) 8.18% 7.94% 8.79% 9.07% 9.35% Tangible book value per share (c)/(g)$ 12.56 $ 12.26 $ 11.82 $ 12.42 $ 12.33 All dollars shown in thousands 33

Appendix: Non-GAAP to GAAP Reconciliation Additional non-GAAP measures 3Q20 2Q20 1Q20 4Q19 3Q19 (Dollars in thousands, except per share data) As Reported Adjusted As Reported Adjusted As Reported Adjusted As Reported Adjusted As Reported Adjusted Net interest income (f)$ 112,180 $ 112,180 $ 111,576 $ 111,576 $ 114,282 $ 114,282 $ 118,902 $ 118,902 $ 121,535 $ 121,535 Provision for credit losses-loans and leases (j) 15,299 15,299 17,859 17,859 23,880 23,880 4,629 4,629 5,228 5,228 Provision for credit losses-unfunded commitments (j) (1,925) (1,925) 2,370 2,370 1,568 1,568 Noninterest income 49,499 49,499 42,725 42,725 35,384 35,384 36,768 36,768 33,140 33,140 less: gains (losses) on sale of investment securities 20 128 (157) (56) 208 Total noninterest income (g) 49,499 49,479 42,725 42,597 35,384 35,541 36,768 36,824 33,140 32,932 Noninterest expense 97,511 97,511 88,689 88,689 89,666 89,666 93,064 93,064 86,226 86,226 less: severance and merger-related expenses 95 35 329 693 5,192 less: historic tax credit write-down @ 21% 2,862 less: COVID-19 costs 115 660 1,011 less: other 2,011 1,507 1,139 1,740 711 Total noninterest expense (e) 97,511 95,290 88,689 86,487 89,666 87,187 93,064 87,769 86,226 80,323 Income before income taxes (i) 50,794 52,995 45,383 47,457 34,552 37,188 57,977 63,328 63,221 68,916 Income tax expense 9,317 9,317 7,990 7,990 5,924 5,924 9,300 9,300 12,365 12,365 plus: tax effect of adjustments 462 436 554 377 926 plus: after-tax impact of historic tax credit write-down @ 35% 2,261 Total income tax expense (h) 9,317 9,779 7,990 8,426 5,924 6,478 9,300 11,938 12,365 13,291 Net income (a)$ 41,477 $ 43,216 $ 37,393 $ 39,031 $ 28,628 $ 30,710 $ 48,677 $ 51,390 $ 50,856 $ 55,625 Average diluted shares (b) 98,009 98,009 97,989 97,989 98,356 98,356 99,232 99,232 99,078 99,078 Average assets (c) 15,842,010 15,842,010 15,710,204 15,710,204 14,524,422 14,524,422 14,460,288 14,460,288 14,320,514 14,320,514 Average shareholders' equity 2,230,422 2,230,422 2,185,865 2,185,865 2,209,733 2,209,733 2,245,107 2,245,107 2,210,327 2,210,327 Less: Goodwill and other intangibles (1,018,214) (1,018,214) (1,020,111) (1,020,111) (1,023,393) (1,023,393) (1,026,267) (1,026,267) (961,371) (961,371) Average tangible equity (d) 1,212,208 1,212,208 1,165,754 1,165,754 1,186,340 1,186,340 1,218,840 1,218,840 1,248,956 1,248,956 Ratios Net earnings per share - diluted (a)/(b) $ 0.42 $ 0.44 $ 0.38 $ 0.40 $ 0.29 $ 0.31 $ 0.49 $ 0.52 $ 0.51 $ 0.56 Return on average assets - (a)/(c) 1.04% 1.09% 0.96% 1.00% 0.79% 0.85% 1.34% 1.41% 1.41% 1.54% Pre-tax, pre-provision return on average assets - ((a)+(j)+(h))/(c) 1.61% 1.67% 1.68% 1.73% 1.66% 1.73% 1.72% 1.86% 1.90% 2.05% Return on average tangible shareholders' equity - (a)/(d) 13.61% 14.18% 12.90% 13.47% 9.71% 10.41% 15.84% 16.73% 16.15% 17.67% Efficiency ratio - (e)/((f)+(g)) 60.3% 58.9% 57.5% 56.1% 59.9% 58.2% 59.8% 56.4% 55.7% 52.0% Effective tax rate - (h)/(i) 18.3% 18.5% 17.6% 17.8% 17.1% 17.4% 16.0% 18.9% 19.6% 19.3% 34
First Financial Bank First Financial Center 225 East Fifth Street Suite 800 Cincinnati, OH 45202-4248 35
