Attached files
| file | filename |
|---|---|
| EX-99.1 - EX-99.1 - AZZ INC | q2fy2021earningsrelease.htm |
| 8-K - 8-K - AZZ INC | azz-20201013.htm |
AZZ Inc. Q2 FY2021 Earnings Release Presentation October 13, 2020
Q2 FY2021 EARNINGS PRESENTATION Safe Harbor Statement Certain statements herein about our expectations of future events or results constitute forward-looking statements for purposes of the safe harbor provisions of The Private Securities Litigation Reform Act of 1995. You can identify forward-looking statements by terminology such as “may,” “should,” “expects,” “plans,” “anticipates,” “believes,” “estimates,” “predicts,” “potential,” “continue,” or the negative of these terms or other comparable terminology. Such forward-looking statements are based on currently available competitive, financial and economic data and management’s views and assumptions regarding future events. Such forward-looking statements are inherently uncertain, and investors must recognize that actual results may differ from those expressed or implied in the forward-looking statements. Certain factors could affect the outcome of the matters described herein. This presentation may contain forward-looking statements that involve risks and uncertainties including, but not limited to, changes in customer demand for our products and services, including demand by the power generation markets, electrical transmission and distribution markets, the industrial markets, and the metal coatings markets. In addition, within each of the markets we serve, our customers and our operations could potentially be adversely impacted by the ongoing COVID-19 pandemic. We could also experience fluctuations in prices and raw material cost, including zinc and natural gas which are used in the hot dip galvanizing process; supply-chain vendor delays ; customer requested delays of our products or services; delays in additional acquisition opportunities; currency exchange rates; adequacy of financing; availability of experienced management and employees to implement AZZ’s growth strategy; a downturn in market conditions in any industry relating to the products we inventory or sell or the services that we provide; economic volatility or changes in the political stability in the United States and other foreign markets in which we operate; acts of war or terrorism inside the United States or abroad; and other changes in economic and financial conditions. AZZ has provided additional information regarding risks associated with the business in AZZ’s Annual Report on Form 10-K for the fiscal year ended February 29, 2020 and other filings with the Securities and Exchange Commission (“SEC”), available for viewing on AZZ’s website at www.azz.com and on the SEC’s website at www.sec.gov. You are urged to consider these factors carefully in evaluating the forward-looking statements herein and are cautioned not to place undue reliance on such forward-looking statements, which are qualified in their entirety by this cautionary statement. These statements are based on information as of the date hereof and AZZ assumes no obligation to update any forward-looking statements, whether as a result of new information, future events, or otherwise. 2
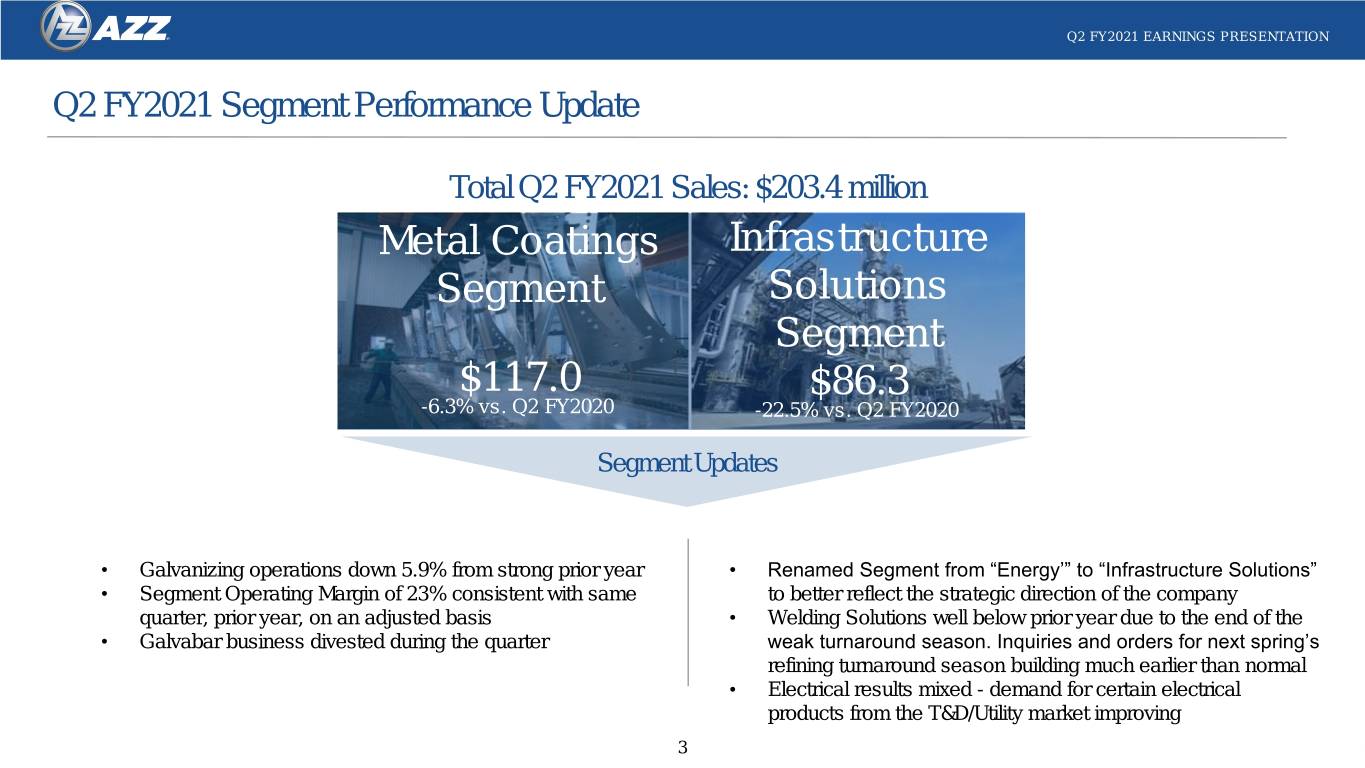
Q2 FY2021 EARNINGS PRESENTATION Q2 FY2021 Segment Performance Update Total Q2 FY2021 Sales: $203.4 million Metal Coatings Infrastructure Segment Solutions Segment $117.0 $86.3 -6.3% vs. Q2 FY2020 -22.5% vs. Q2 FY2020 Segment Updates • Galvanizing operations down 5.9% from strong prior year • Renamed Segment from “Energy’” to “Infrastructure Solutions” • Segment Operating Margin of 23% consistent with same to better reflect the strategic direction of the company quarter, prior year, on an adjusted basis • Welding Solutions well below prior year due to the end of the • Galvabar business divested during the quarter weak turnaround season. Inquiries and orders for next spring’s refining turnaround season building much earlier than normal • Electrical results mixed - demand for certain electrical products from the T&D/Utility market improving 3
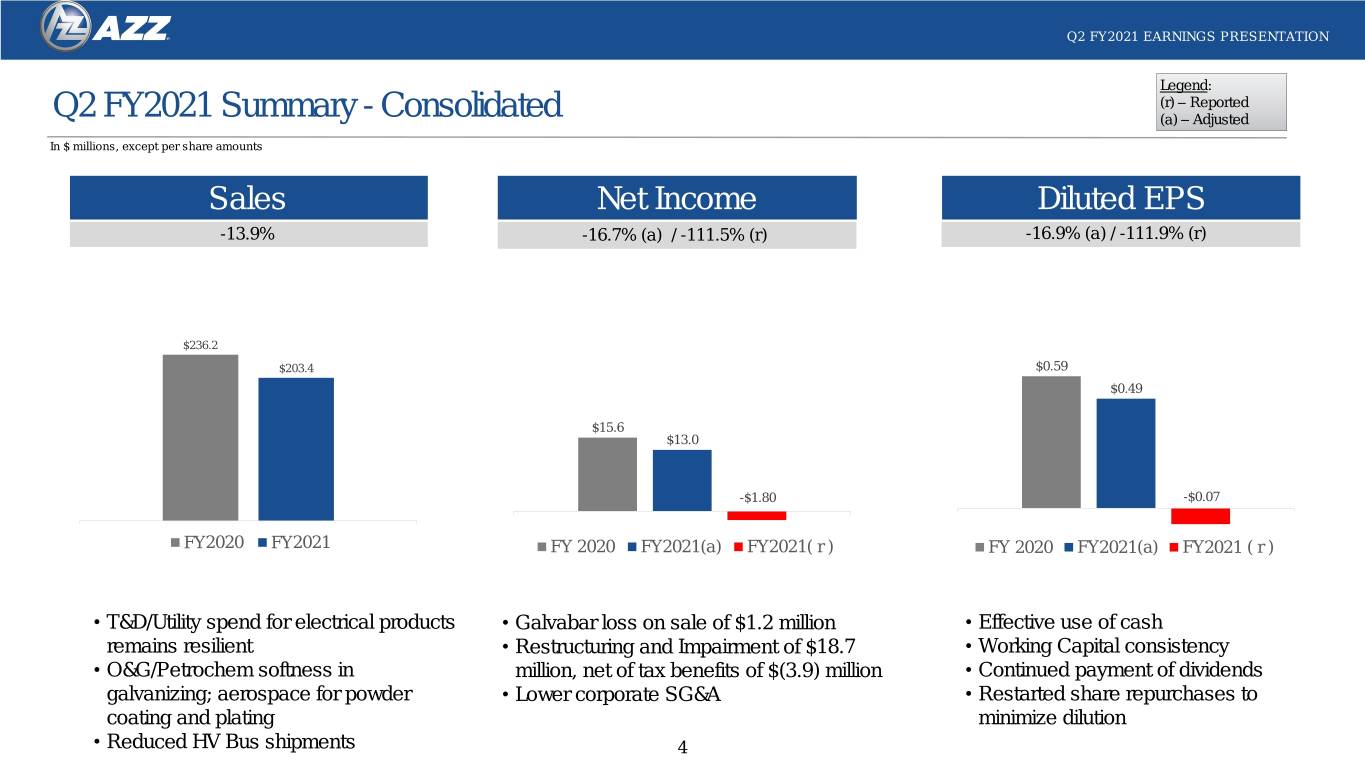
Q2 FY2021 EARNINGS PRESENTATION Legend: (r) – Reported Q2 FY2021 Summary - Consolidated (a) – Adjusted In $ millions, except per share amounts Sales Net Income Diluted EPS -13.9% -16.7% (a) / -111.5% (r) -16.9% (a) / -111.9% (r) $236.2 $203.4 $0.59 $0.49 $15.6 $13.0 -$1.80 -$0.07 FY2020 FY2021 FY 2020 FY2021(a) FY2021( r ) FY 2020 FY2021(a) FY2021 ( r ) • T&D/Utility spend for electrical products • Galvabar loss on sale of $1.2 million • Effective use of cash remains resilient • Restructuring and Impairment of $18.7 • Working Capital consistency • O&G/Petrochem softness in million, net of tax benefits of $(3.9) million • Continued payment of dividends galvanizing; aerospace for powder • Lower corporate SG&A • Restarted share repurchases to coating and plating minimize dilution • Reduced HV Bus shipments 4
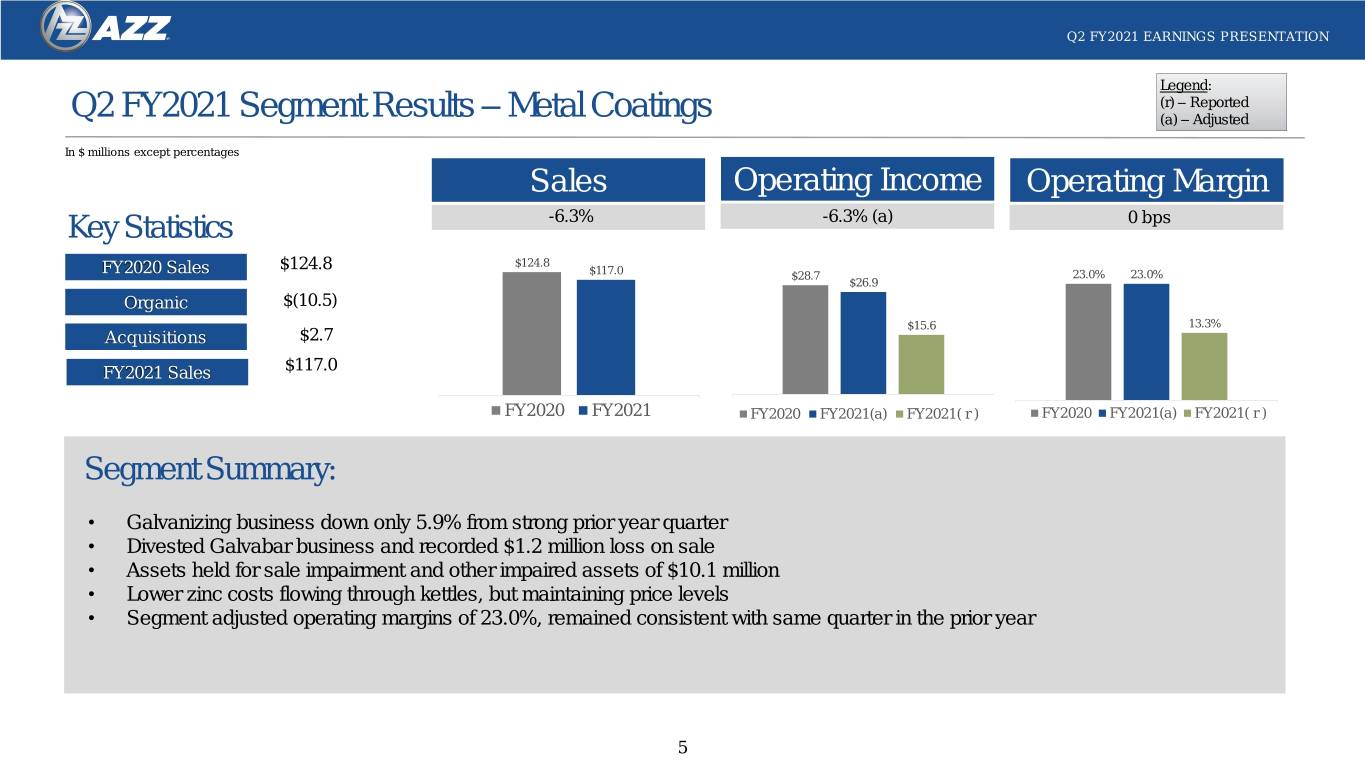
Q2 FY2021 EARNINGS PRESENTATION Legend: (r) – Reported Q2 FY2021 Segment Results – Metal Coatings (a) – Adjusted In $ millions except percentages Sales Operating Income Operating Margin Key Statistics -6.3% -6.3% (a) 0 bps $124.8 $124.8 FY2020 Sales $117.0 $28.7 23.0% 23.0% $26.9 Organic $(10.5) $15.6 13.3% Acquisitions $2.7 FY2021 Sales $117.0 FY2020 FY2021 FY2020 FY2021(a) FY2021( r ) FY2020 FY2021(a) FY2021( r ) Segment Summary: • Galvanizing business down only 5.9% from strong prior year quarter • Divested Galvabar business and recorded $1.2 million loss on sale • Assets held for sale impairment and other impaired assets of $10.1 million • Lower zinc costs flowing through kettles, but maintaining price levels • Segment adjusted operating margins of 23.0%, remained consistent with same quarter in the prior year 5
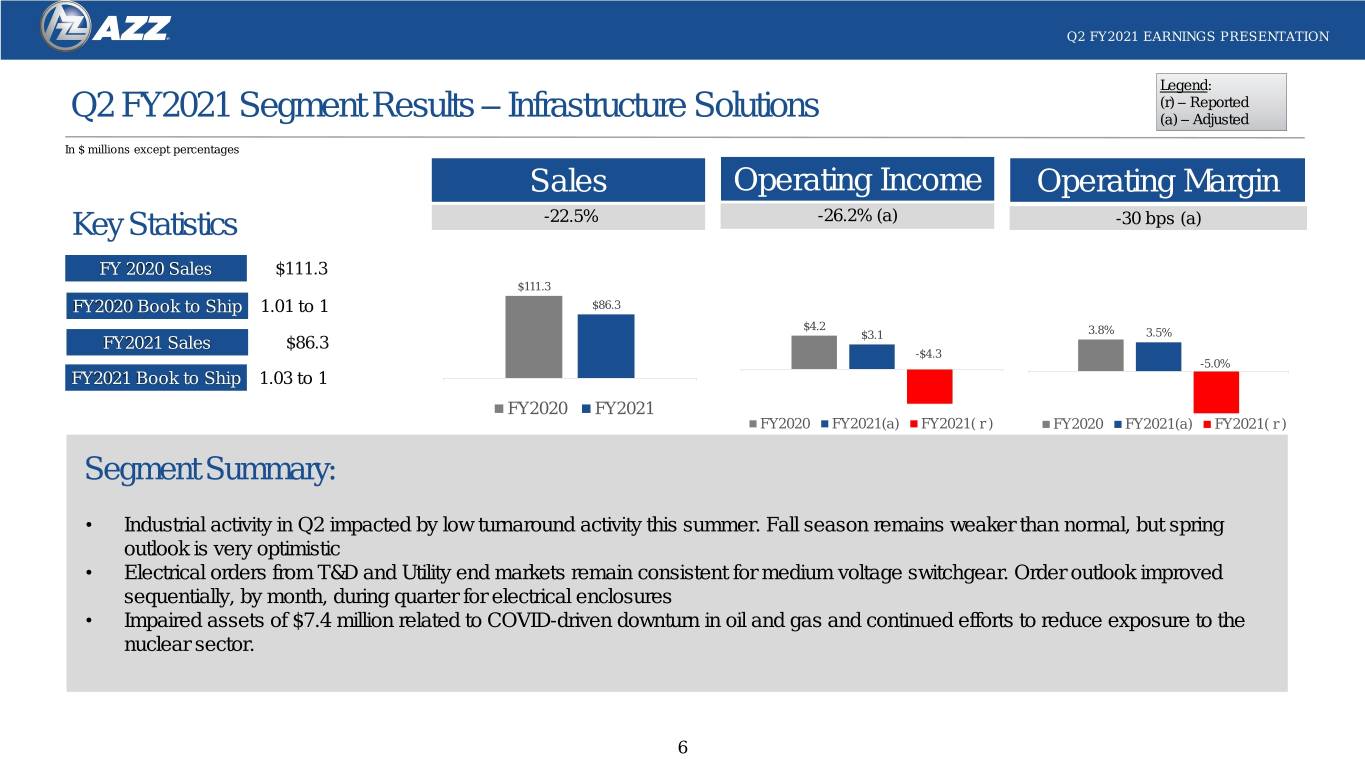
Q2 FY2021 EARNINGS PRESENTATION Legend: (r) – Reported Q2 FY2021 Segment Results – Infrastructure Solutions (a) – Adjusted In $ millions except percentages Sales Operating Income Operating Margin Key Statistics -22.5% -26.2% (a) -30 bps (a) FY 2020 Sales $111.3 $111.3 FY2020 Book to Ship 1.01 to 1 $86.3 $4.2 3.8% 3.5% FY2021 Sales $86.3 $3.1 -$4.3 -5.0% FY2021 Book to Ship 1.03 to 1 FY2020 FY2021 FY2020 FY2021(a) FY2021( r ) FY2020 FY2021(a) FY2021( r ) Segment Summary: • Industrial activity in Q2 impacted by low turnaround activity this summer. Fall season remains weaker than normal, but spring outlook is very optimistic • Electrical orders from T&D and Utility end markets remain consistent for medium voltage switchgear. Order outlook improved sequentially, by month, during quarter for electrical enclosures • Impaired assets of $7.4 million related to COVID-driven downturn in oil and gas and continued efforts to reduce exposure to the nuclear sector. 6
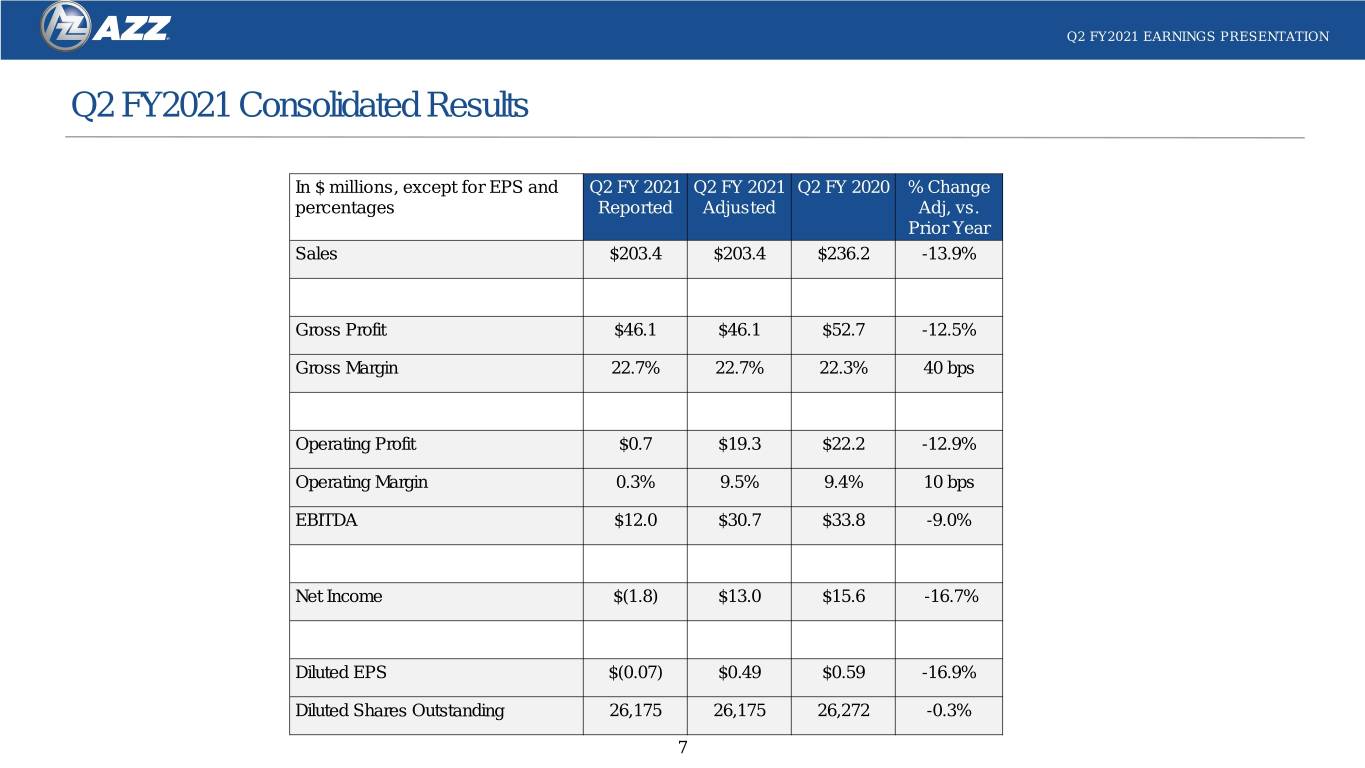
Q2 FY2021 EARNINGS PRESENTATION Q2 FY2021 Consolidated Results In $ millions, except for EPS and Q2 FY 2021 Q2 FY 2021 Q2 FY 2020 % Change percentages Reported Adjusted Adj, vs. Prior Year Sales $203.4 $203.4 $236.2 -13.9% Gross Profit $46.1 $46.1 $52.7 -12.5% Gross Margin 22.7% 22.7% 22.3% 40 bps Operating Profit $0.7 $19.3 $22.2 -12.9% Operating Margin 0.3% 9.5% 9.4% 10 bps EBITDA $12.0 $30.7 $33.8 -9.0% Net Income $(1.8) $13.0 $15.6 -16.7% Diluted EPS $(0.07) $0.49 $0.59 -16.9% Diluted Shares Outstanding 26,175 26,175 26,272 -0.3% 7
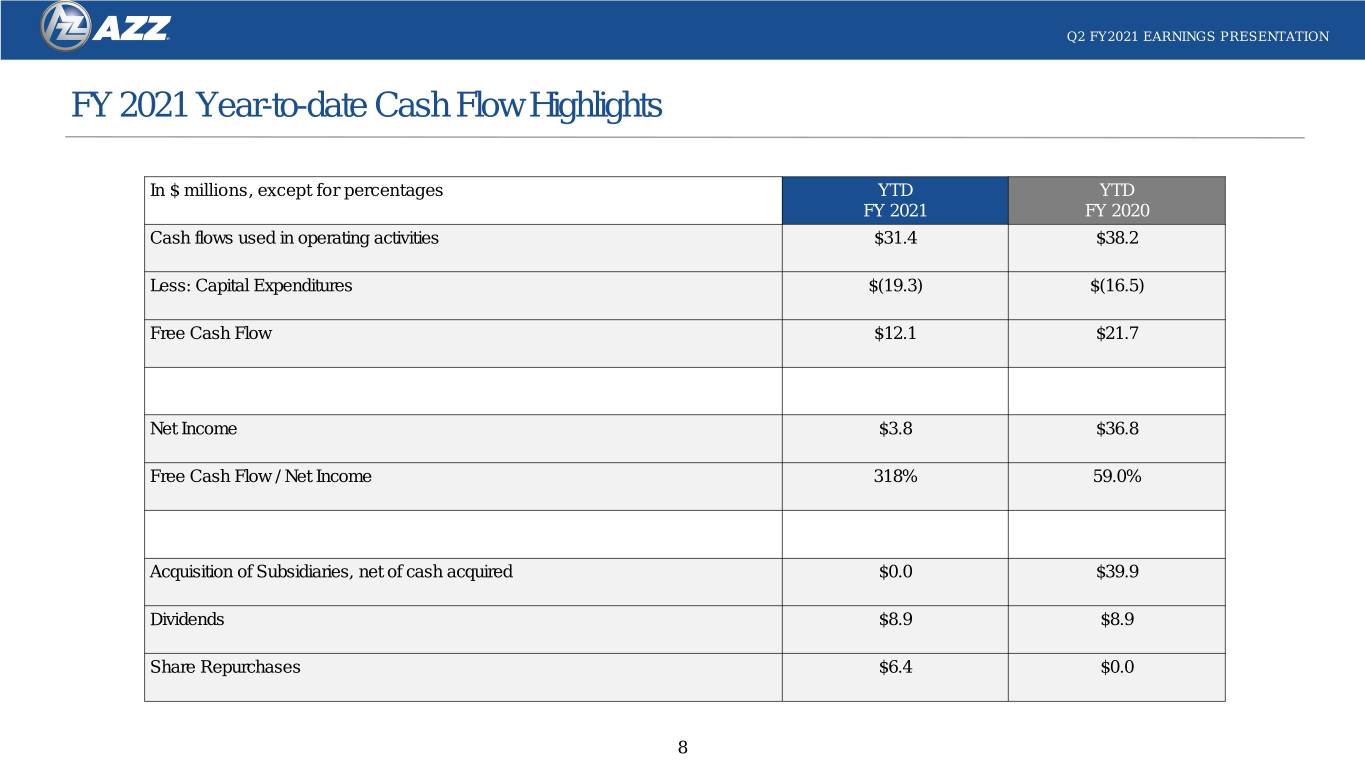
Q2 FY2021 EARNINGS PRESENTATION FY 2021 Year-to-date Cash Flow Highlights In $ millions, except for percentages YTD YTD FY 2021 FY 2020 Cash flows used in operating activities $31.4 $38.2 Less: Capital Expenditures $(19.3) $(16.5) Free Cash Flow $12.1 $21.7 Net Income $3.8 $36.8 Free Cash Flow / Net Income 318% 59.0% Acquisition of Subsidiaries, net of cash acquired $0.0 $39.9 Dividends $8.9 $8.9 Share Repurchases $6.4 $0.0 8
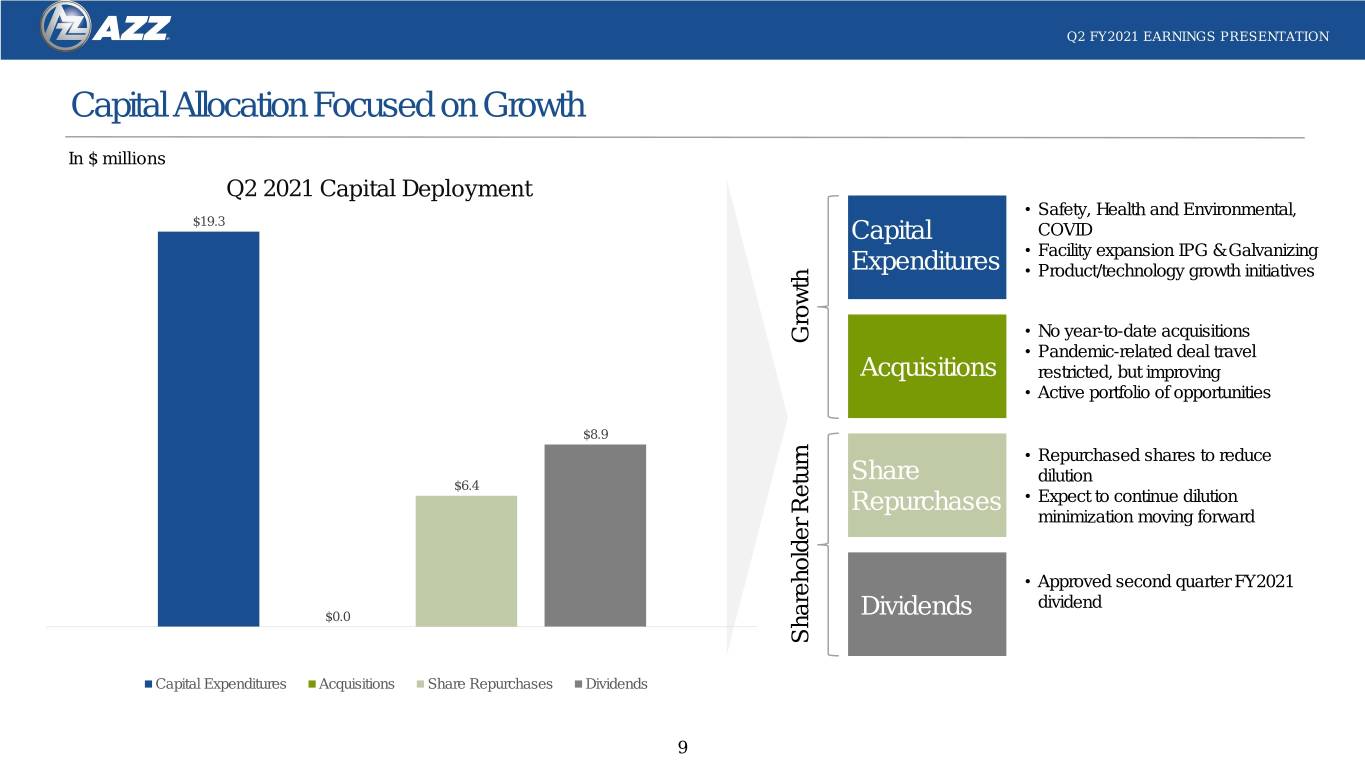
Q2 FY2021 EARNINGS PRESENTATION Capital Allocation Focused on Growth In $ millions Q2 2021 Capital Deployment • Safety, Health and Environmental, $19.3 Capital COVID • Facility expansion IPG & Galvanizing Expenditures • Product/technology growth initiatives • No year-to-date acquisitions Growth • Pandemic-related deal travel Acquisitions restricted, but improving • Active portfolio of opportunities $8.9 • Repurchased shares to reduce Share dilution $6.4 Repurchases • Expect to continue dilution minimization moving forward • Approved second quarter FY2021 dividend $0.0 Dividends Shareholder Return Shareholder Capital Expenditures Acquisitions Share Repurchases Dividends 9
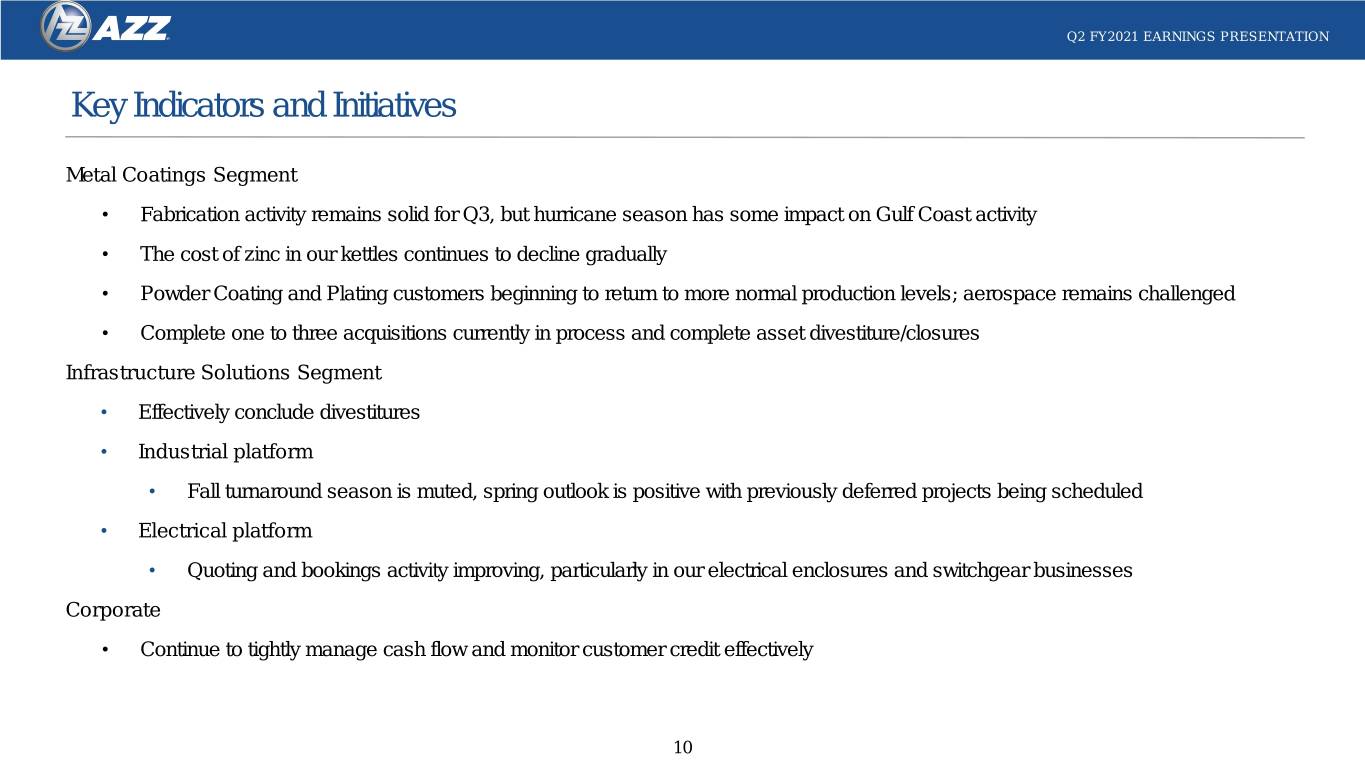
Q2 FY2021 EARNINGS PRESENTATION Key Indicators and Initiatives Metal Coatings Segment • Fabrication activity remains solid for Q3, but hurricane season has some impact on Gulf Coast activity • The cost of zinc in our kettles continues to decline gradually • Powder Coating and Plating customers beginning to return to more normal production levels; aerospace remains challenged • Complete one to three acquisitions currently in process and complete asset divestiture/closures Infrastructure Solutions Segment • Effectively conclude divestitures • Industrial platform • Fall turnaround season is muted, spring outlook is positive with previously deferred projects being scheduled • Electrical platform • Quoting and bookings activity improving, particularly in our electrical enclosures and switchgear businesses Corporate • Continue to tightly manage cash flow and monitor customer credit effectively 10
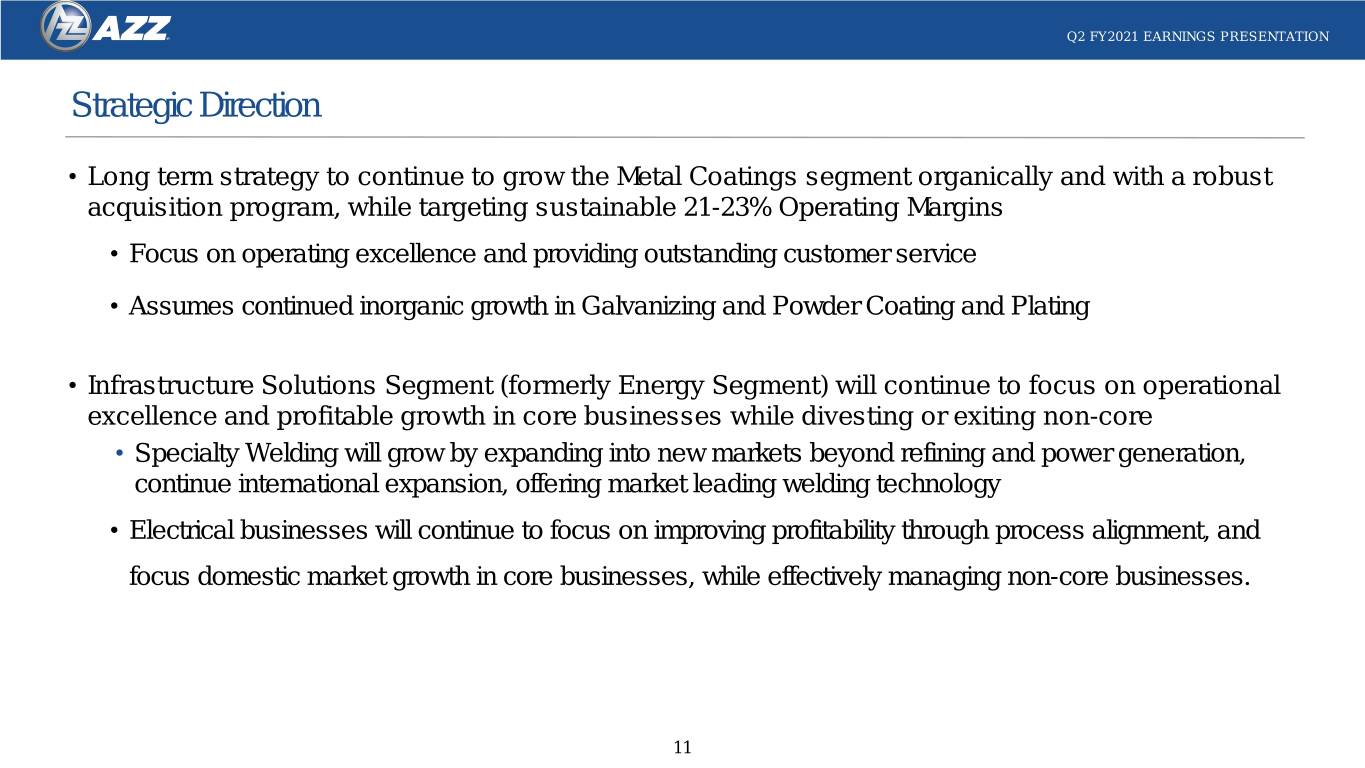
Q2 FY2021 EARNINGS PRESENTATION Strategic Direction • Long term strategy to continue to grow the Metal Coatings segment organically and with a robust acquisition program, while targeting sustainable 21-23% Operating Margins • Focus on operating excellence and providing outstanding customer service • Assumes continued inorganic growth in Galvanizing and Powder Coating and Plating • Infrastructure Solutions Segment (formerly Energy Segment) will continue to focus on operational excellence and profitable growth in core businesses while divesting or exiting non-core • Specialty Welding will grow by expanding into new markets beyond refining and power generation, continue international expansion, offering market leading welding technology • Electrical businesses will continue to focus on improving profitability through process alignment, and focus domestic market growth in core businesses, while effectively managing non-core businesses. 11
Q&A
Appendix and Additional Information
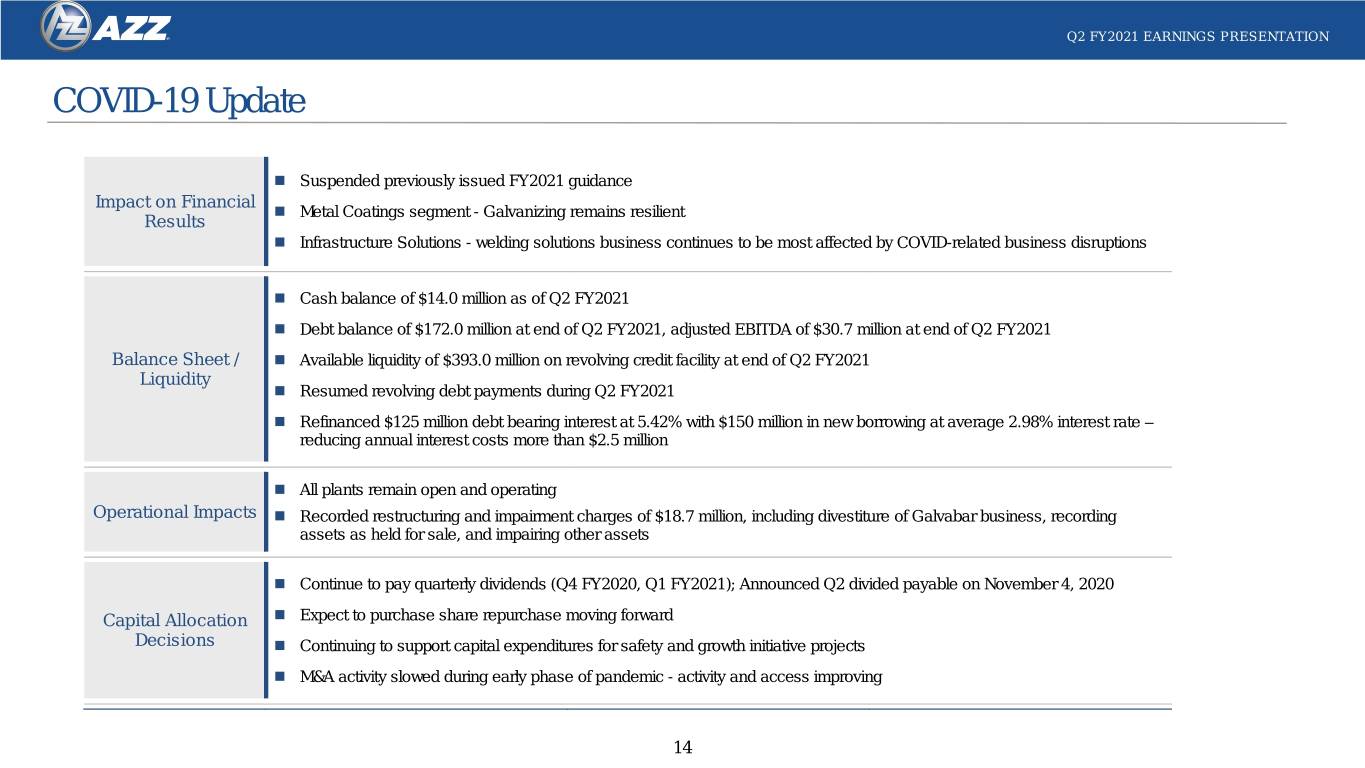
Q2 FY2021 EARNINGS PRESENTATION COVID-19 Update Suspended previously issued FY2021 guidance Impact on Financial Metal Coatings segment - Galvanizing remains resilient Results Infrastructure Solutions - welding solutions business continues to be most affected by COVID-related business disruptions Cash balance of $14.0 million as of Q2 FY 2021 Debt balance of $172.0 million at end of Q2 FY2021, adjusted EBITDA of $30.7 million at end of Q2 FY2021 Balance Sheet / Available liquidity of $393.0 million on revolving credit facility at end of Q2 FY2021 Liquidity Resumed revolving debt payments during Q2 FY2021 Refinanced $125 million debt bearing interest at 5.42% with $150 million in new borrowing at average 2.98% interest rate – reducing annual interest costs more than $2.5 million All plants remain open and operating Operational Impacts Recorded restructuring and impairment charges of $18.7 million, including divestiture of Galvabar business, recording assets as held for sale, and impairing other assets Continue to pay quarterly dividends (Q4 FY2020, Q1 FY2021); Announced Q2 divided payable on November 4, 2020 Capital Allocation Expect to purchase share repurchase moving forward Decisions Continuing to support capital expenditures for safety and growth initiative projects M&A activity slowed during early phase of pandemic - activity and access improving 14
Q2 FY2021 EARNINGS PRESENTATION Non-GAAP Disclosure of EBITDA • In addition to reporting financial results in accordance with Generally Accepted Accounting Principles in the United States ("GAAP"), AZZ has provided EBITDA, which are non-GAAP measures. Management believes that the presentation of these measures provides investors with a greater transparency comparison of operating results across a broad spectrum of companies, which provides a more complete understanding of AZZ’s financial performance, competitive position and prospects for the future. Management also believes that investors regularly rely on non-GAAP financial measures, such as EBITDA, to assess operating performance and that such measures may highlight trends in the Company’s business that may not otherwise be apparent when relying on financial measures calculated in accordance with GAAP. 15
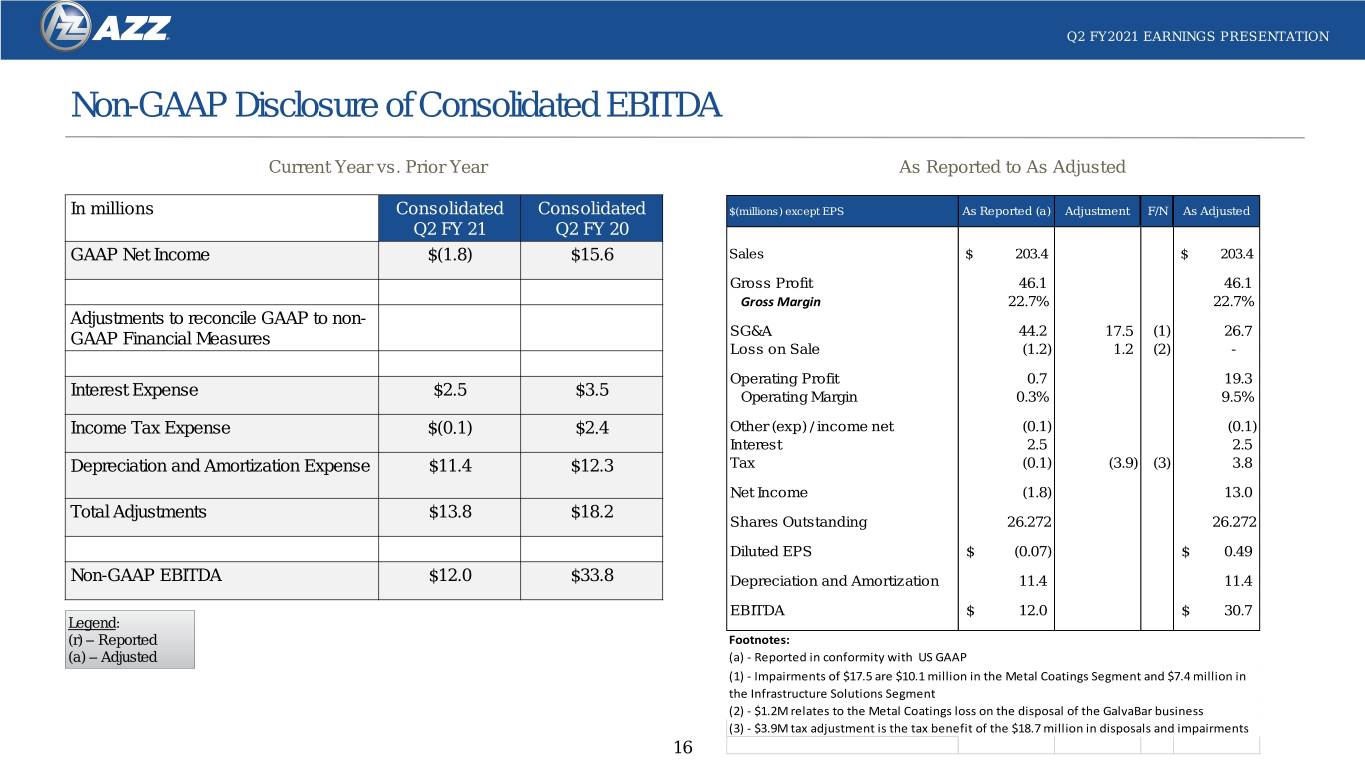
Q2 FY2021 EARNINGS PRESENTATION Non-GAAP Disclosure of Consolidated EBITDA Current Year vs. Prior Year As Reported to As Adjusted In millions Consolidated Consolidated $(millions) except EPS As Reported (a) Adjustment F/N As Adjusted Q2 FY 21 Q2 FY 20 GAAP Net Income $(1.8) $15.6 Sales $ 203.4 $ 203.4 Gross Profit 46.1 46.1 Gross Margin 22.7% 22.7% Adjustments to reconcile GAAP to non- GAAP Financial Measures SG&A 44.2 17.5 (1) 26.7 Loss on Sale (1.2) 1.2 (2) - Operating Profit 0.7 19.3 Interest Expense $2.5 $3.5 Operating Margin 0.3% 9.5% Income Tax Expense $(0.1) $2.4 Other (exp) / income net (0.1) (0.1) Interest 2.5 2.5 Depreciation and Amortization Expense $11.4 $12.3 Tax (0.1) (3.9) (3) 3.8 Net Income (1.8) 13.0 Total Adjustments $13.8 $18.2 Shares Outstanding 26.272 26.272 Diluted EPS $ (0.07) $ 0.49 Non-GAAP EBITDA $12.0 $33.8 Depreciation and Amortization 11.4 11.4 EBITDA $ 12.0 $ 30.7 Legend: (r) – Reported Footnotes: (a) – Adjusted (a) - Reported in conformity with US GAAP (1) - Impairments of $17.5 are $10.1 million in the Metal Coatings Segment and $7.4 million in the Infrastructure Solutions Segment (2) - $1.2M relates to the Metal Coatings loss on the disposal of the GalvaBar business (3) - $3.9M tax adjustment is the tax benefit of the $18.7 million in disposals and impairments 16
