Attached files
| file | filename |
|---|---|
| EX-99.1 - EX-99.1 - COMMERCIAL METALS Co | segmentchangepressrele.htm |
| 8-K - 8-K - COMMERCIAL METALS Co | cmc-20201001.htm |

RESEGMENTATION SUMMARY OCTOBER 2020
TOPICS Summary of Reporting Changes Rationale for Changes Operational Statistics Disclosure Drivers of Operational Statistics Resegmentation Summary | October 2020 2
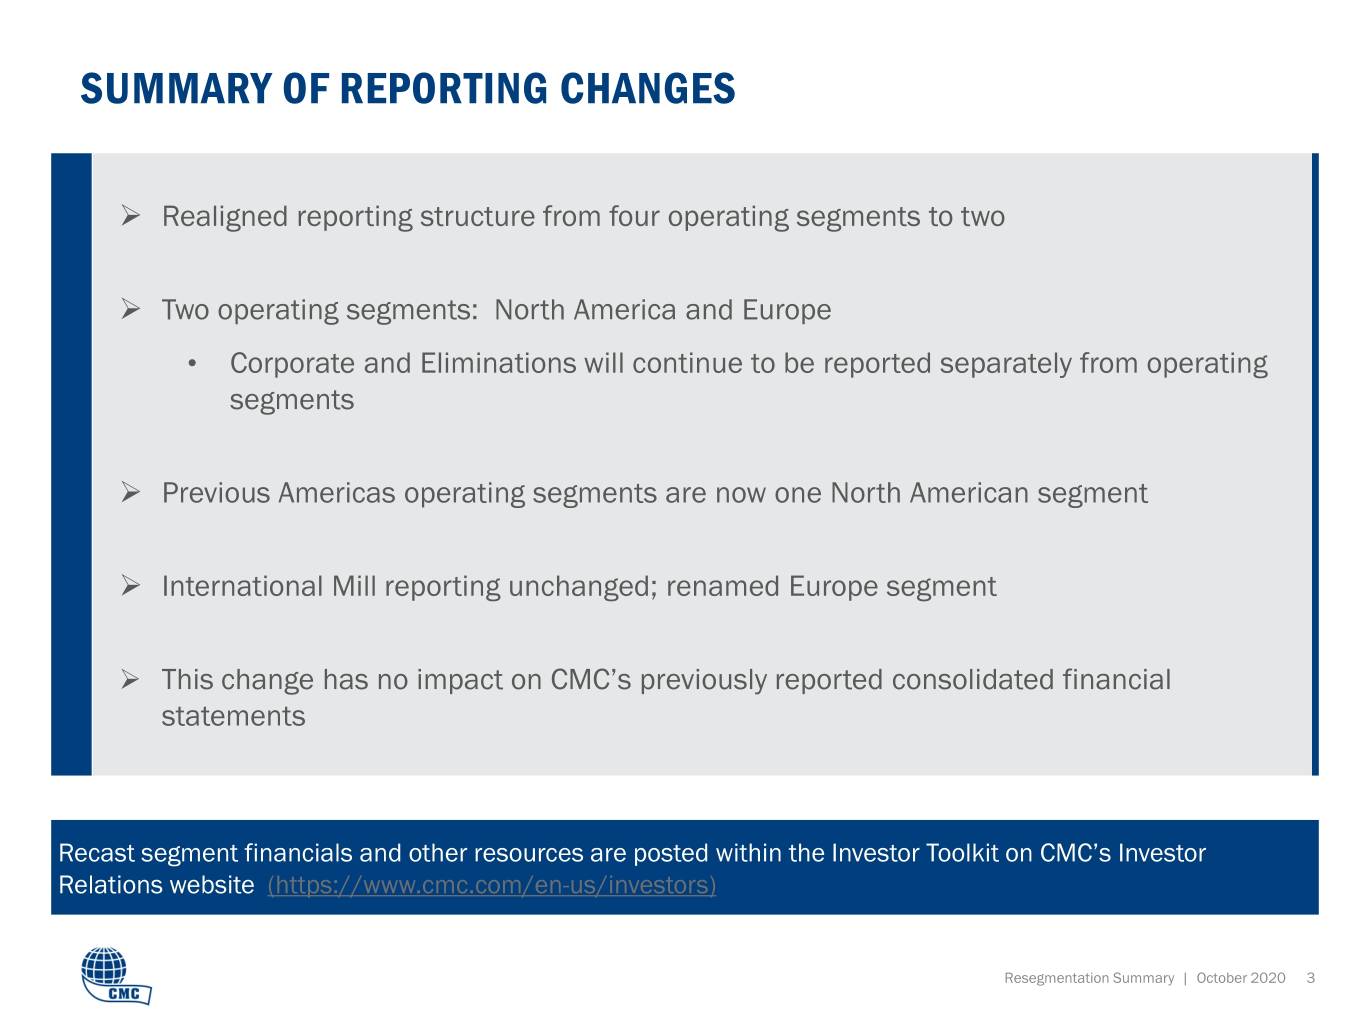
SUMMARY OF REPORTING CHANGES Realigned reporting structure from four operating segments to two Two operating segments: North America and Europe • Corporate and Eliminations will continue to be reported separately from operating segments Previous Americas operating segments are now one North American segment International Mill reporting unchanged; renamed Europe segment This change has no impact on CMC’s previously reported consolidated financial statements Recast segment financials and other resources are posted within the Investor Toolkit on CMC’s Investor Relations website (https://www.cmc.com/en-us/investors) Resegmentation Summary | October 2020 3
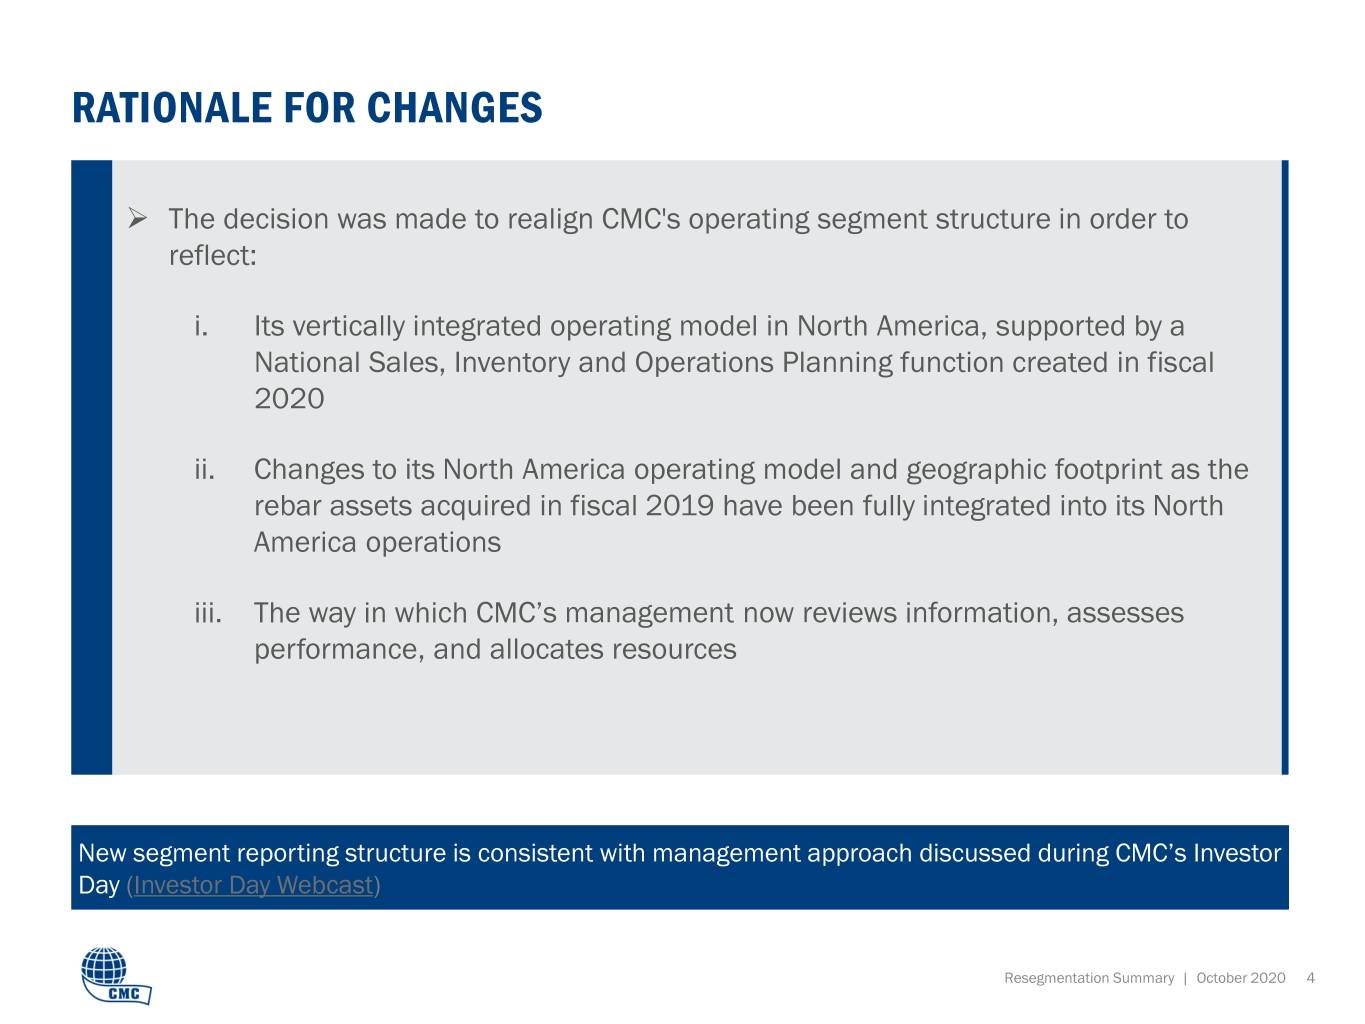
RATIONALE FOR CHANGES The decision was made to realign CMC's operating segment structure in order to reflect: i. Its vertically integrated operating model in North America, supported by a National Sales, Inventory and Operations Planning function created in fiscal 2020 ii. Changes to its North America operating model and geographic footprint as the rebar assets acquired in fiscal 2019 have been fully integrated into its North America operations iii. The way in which CMC’s management now reviews information, assesses performance, and allocates resources New segment reporting structure is consistent with management approach discussed during CMC’s Investor Day (Investor Day Webcast) Resegmentation Summary | October 2020 4
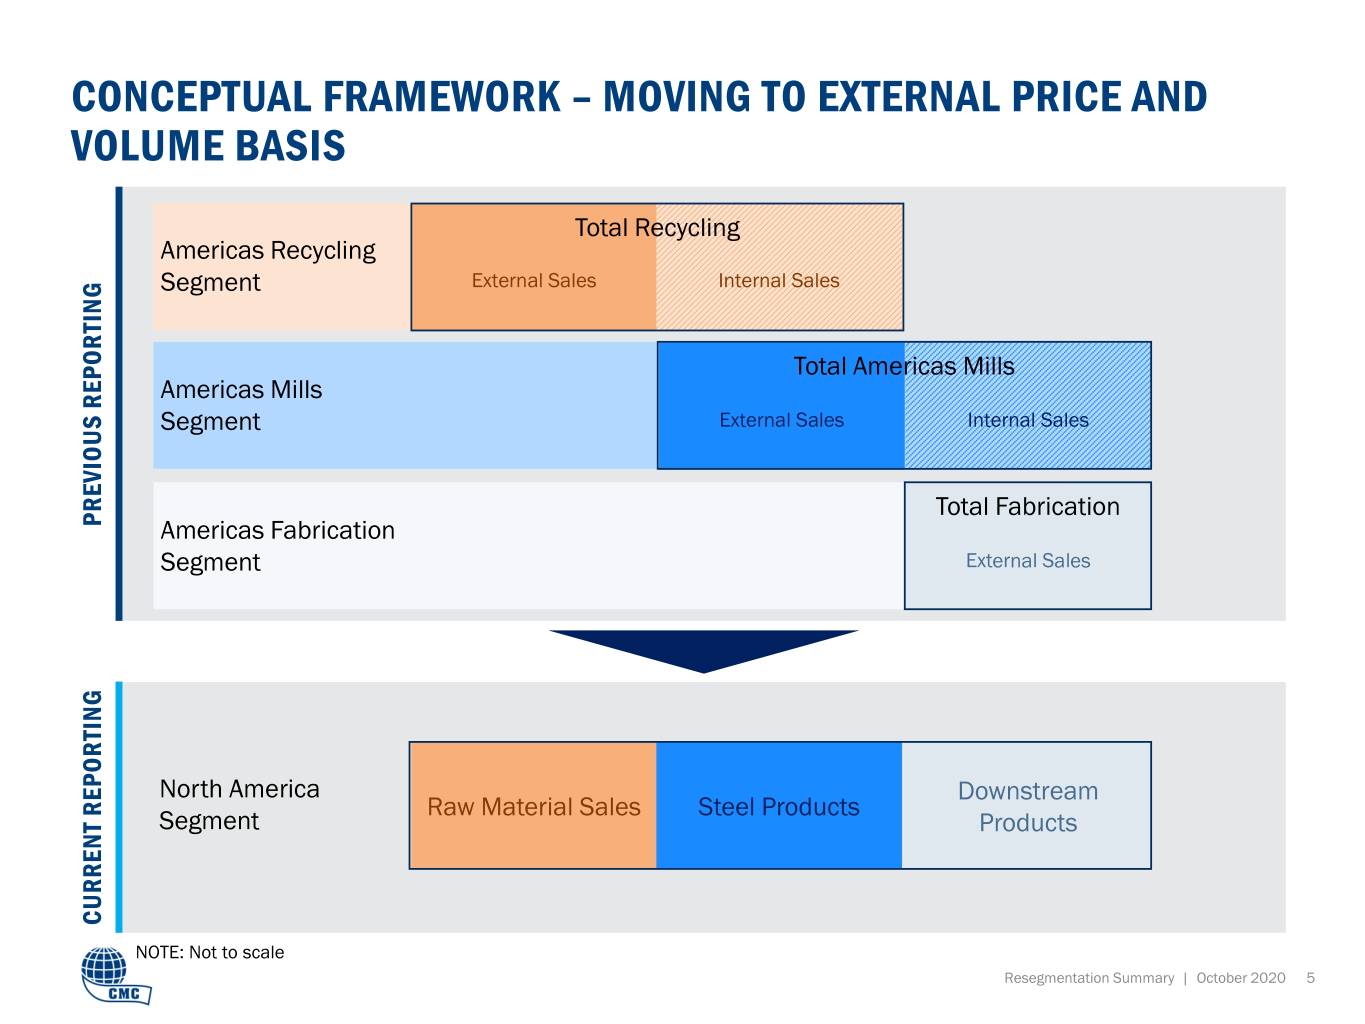
CONCEPTUAL FRAMEWORK – MOVING TO EXTERNAL PRICE AND VOLUME BASIS Total Recycling Americas Recycling Segment External Sales Internal Sales Total Americas Mills Americas Mills Segment External Sales Internal Sales Total Fabrication PREVIOUS REPORTING PREVIOUS Americas Fabrication Segment External Sales North America Downstream Raw Material Sales Steel Products Segment Products CURRENT REPORTING NOTE: Not to scale Resegmentation Summary | October 2020 5
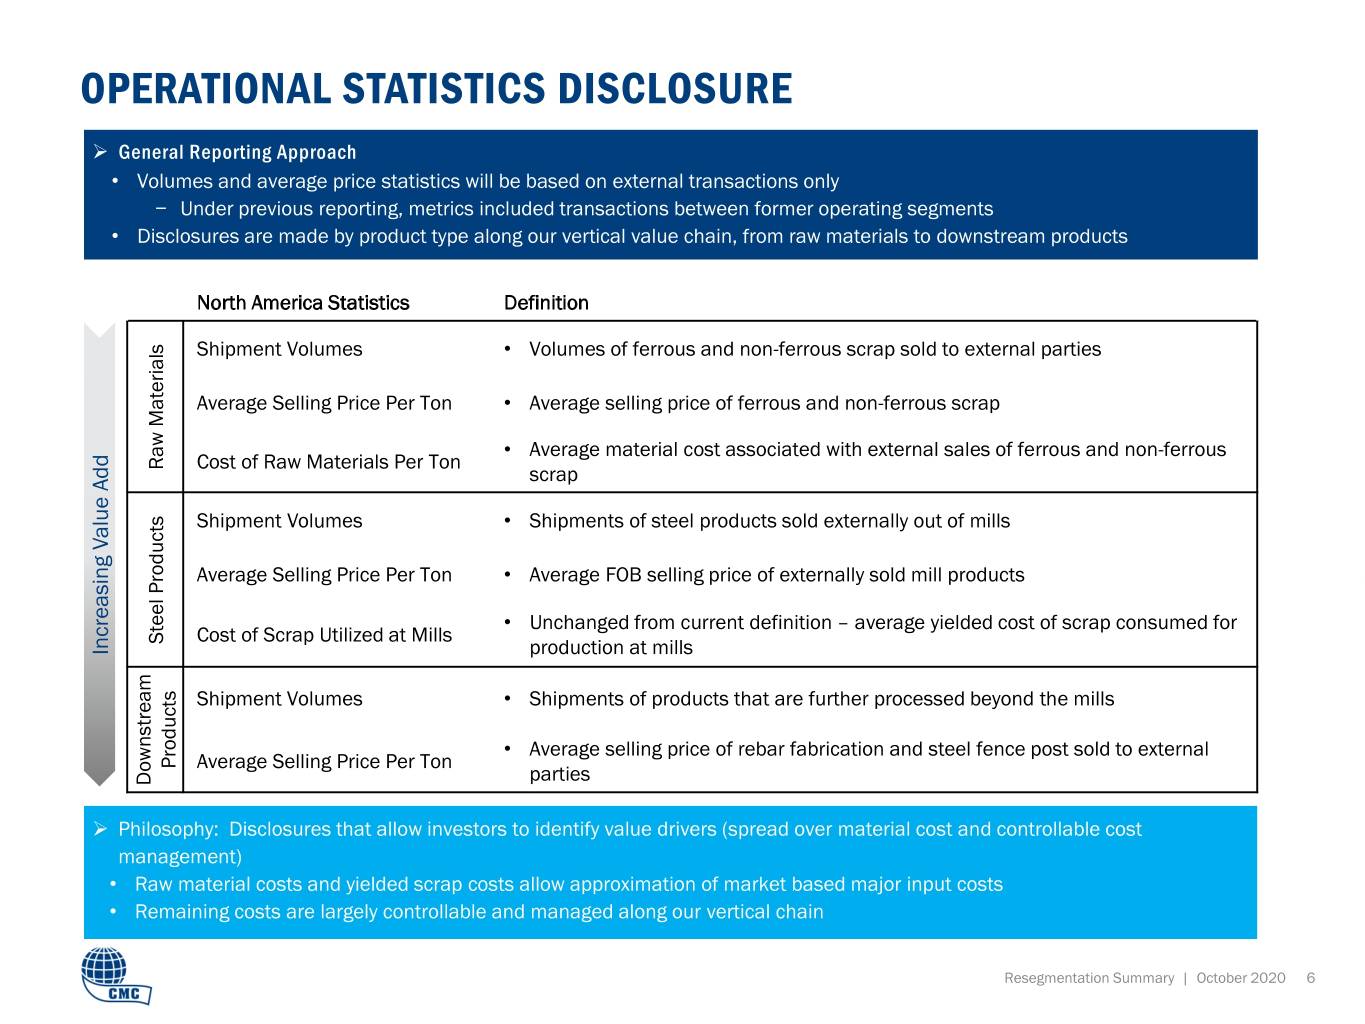
OPERATIONAL STATISTICS DISCLOSURE General Reporting Approach • Volumes and average price statistics will be based on external transactions only − Under previous reporting, metrics included transactions between former operating segments • Disclosures are made by product type along our vertical value chain, from raw materials to downstream products North America Statistics Definition Shipment Volumes • Volumes of ferrous and non-ferrous scrap sold to external parties Average Selling Price Per Ton • Average selling price of ferrous and non-ferrous scrap • Average material cost associated with external sales of ferrous and non-ferrous Raw Materials Raw Cost of Raw Materials Per Ton scrap Shipment Volumes • Shipments of steel products sold externally out of mills Average Selling Price Per Ton • Average FOB selling price of externally sold mill products • Unchanged from current definition – average yielded cost of scrap consumed for Steel Products Steel Cost of Scrap Utilized at Mills Increasing Value Add Increasing Value production at mills Shipment Volumes • Shipments of products that are further processed beyond the mills • Average selling price of rebar fabrication and steel fence post sold to external Products Average Selling Price Per Ton parties Downstream Downstream Philosophy: Disclosures that allow investors to identify value drivers (spread over material cost and controllable cost management) • Raw material costs and yielded scrap costs allow approximation of market based major input costs • Remaining costs are largely controllable and managed along our vertical chain Resegmentation Summary | October 2020 6
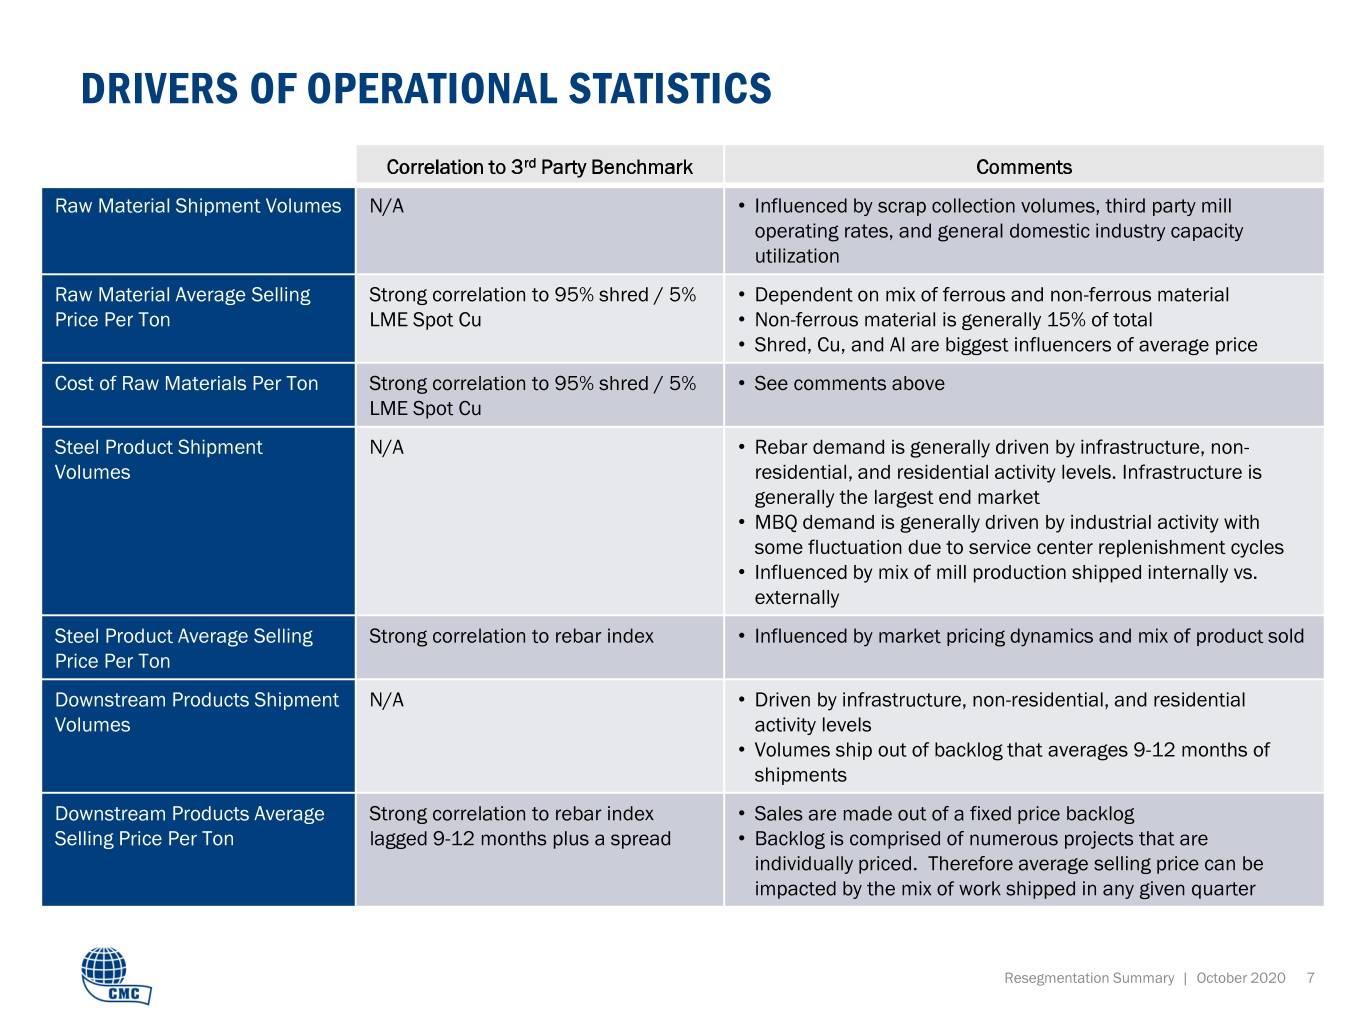
DRIVERS OF OPERATIONAL STATISTICS Correlation to 3rd Party Benchmark Comments Raw Material Shipment Volumes N/A • Influenced by scrap collection volumes, third party mill operating rates, and general domestic industry capacity utilization Raw Material Average Selling Strong correlation to 95% shred / 5% • Dependent on mix of ferrous and non-ferrous material Price Per Ton LME Spot Cu • Non-ferrous material is generally 15% of total • Shred, Cu, and Al are biggest influencers of average price Cost of Raw Materials Per Ton Strong correlation to 95% shred / 5% • See comments above LME Spot Cu Steel Product Shipment N/A • Rebar demand is generally driven by infrastructure, non- Volumes residential, and residential activity levels. Infrastructure is generally the largest end market • MBQ demand is generally driven by industrial activity with some fluctuation due to service center replenishment cycles • Influenced by mix of mill production shipped internally vs. externally Steel Product Average Selling Strong correlation to rebar index • Influenced by market pricing dynamics and mix of product sold Price Per Ton Downstream Products Shipment N/A • Driven by infrastructure, non-residential, and residential Volumes activity levels • Volumes ship out of backlog that averages 9-12 months of shipments Downstream Products Average Strong correlation to rebar index • Sales are made out of a fixed price backlog Selling Price Per Ton lagged 9-12 months plus a spread • Backlog is comprised of numerous projects that are individually priced. Therefore average selling price can be impacted by the mix of work shipped in any given quarter Resegmentation Summary | October 2020 7

THANK YOU CORPORATE OFFICE 6565 N. MacArthur Blvd Suite 800 Irving, TX 75039 Phone: (214) 689.4300 INVESTOR RELATIONS Phone: (972) 308.5349 Fax: (214) 689.4326 IR@cmc.com Resegmentation Summary | October 2020 8
