Attached files
| file | filename |
|---|---|
| EX-99.1 - EX-99.1 - Great Elm Capital Group, Inc. | gec-ex991_6.htm |
| 8-K - 8-K - Great Elm Capital Group, Inc. | gec-8k_20200630.htm |
Great Elm Capital Group, Inc. Investor Presentation – Quarter and Full Year Ended June 30, 2020 September 18, 2020 © 2020 Great Elm Capital Group, Inc. Exhibit 99.2
© 2020 Great Elm Capital Group, Inc. Disclaimer Statements in this press release that are “forward-looking” statements, including statements regarding expected growth, profitability and outlook involve risks and uncertainties that may individually or collectively impact the matters described herein. Investors are cautioned not to place undue reliance on any such forward-looking statements, which speak only as of the date they are made and represent Great Elm’s assumptions and expectations in light of currently available information. These statements involve risks, variables and uncertainties, and Great Elm’s actual performance results may differ from those projected, and any such differences may be material. Among the key factors that could cause actual results to differ materially from those projected in the forward-looking statements are risks associated with the economic impact of the COVID-19 pandemic on Great Elm’s businesses, including DME as well as GECC and its portfolio investments. For information on certain factors that could cause actual events or results to differ materially from Great Elm’s expectations, please see Great Elm’s filings with the SEC, including its most recent annual report on Form 10-K and subsequent reports on Forms 10-Q and 8-K. Additional information relating to Great Elm’s financial position and results of operations is also contained in Great Elm’s annual and quarterly reports filed with the SEC and available for download at its website www.greatelmcap.com or at the SEC website www.sec.gov. Non-GAAP Financial Measures The SEC has adopted rules to regulate the use in filings with the SEC, and in public disclosures, of financial measures that are not in accordance with US GAAP, such as adjusted earnings before interest, taxes, depreciation and amortization (“Adjusted EBITDA”) and free cash flow. See the Appendix for important information regarding the use of non-GAAP financial measures and reconciliations of non-GAAP measures to their most directly comparable GAAP measures. This presentation does not constitute an offer of any securities for sale.
© 2020 Great Elm Capital Group, Inc. SlideSection 4A Note to Shareholders 5Performance Overview 7 Organizational Overview 10Operating Companies: Great Elm DME 13Investment Management 17Real Estate 21General Corporate 23Financial Review 26Summary 28Q&A 29Appendix Table of Contents
A Note to Shareholders We have good momentum in our key business segments: DME and Investment Management DME: fiscal Q4 year-over-year revenue growth of 7.9% despite a significant negative impact from COVID-19 DME: fiscal Q4 net income of $2.8 million and adjusted EBITDA of $7.0 million, up from ($1.0) million and $2.8 million, respectively, during the same period in the prior year DME: After a period of significant investment in the platform to enhance its scalability, DME has resumed its search for attractive, add-on acquisitions Investment Management: GECC’s investment in Prestige Capital Finance, LLC, has exceeded its internal estimates. Building upon this success, GECC has an attractive pipeline of potential investments in the specialty finance sector Investment Management: GECC announced a rights offering on August 31 to capitalize upon this pipeline. If completed, the offering would increase Investment Management’s AUM, revenue and earnings We remain confident in the quality of our businesses and are well positioned to capitalize on new potential opportunities for growth © 2020 Great Elm Capital Group, Inc.
Performance Overview © 2020 Great Elm Capital Group, Inc.
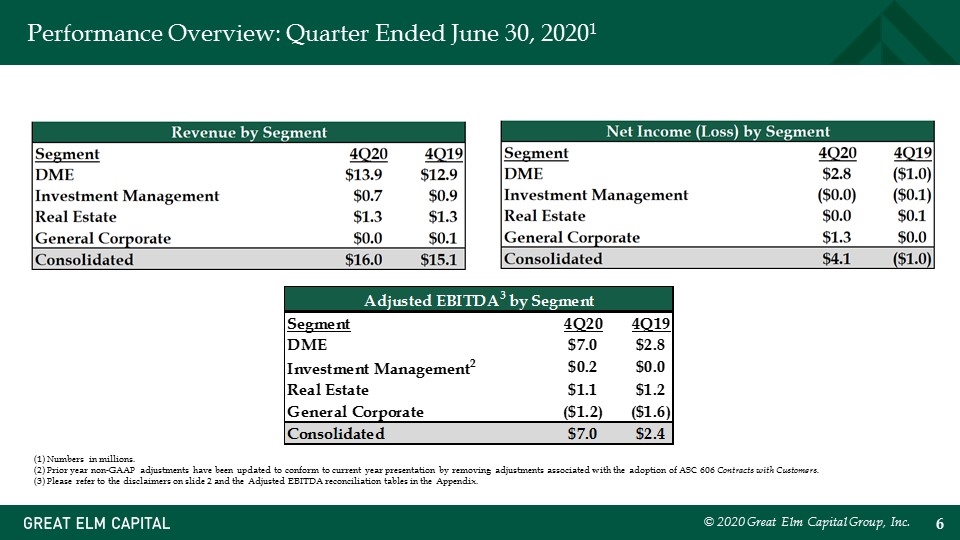
Performance Overview: Quarter Ended June 30, 20201 © 2020 Great Elm Capital Group, Inc. (1) Numbers in millions. (2) Prior year non-GAAP adjustments have been updated to conform to current year presentation by removing adjustments associated with the adoption of ASC 606 Contracts with Customers. (3) Please refer to the disclaimers on slide 2 and the Adjusted EBITDA reconciliation tables in the Appendix.
Organizational Overview © 2020 Great Elm Capital Group, Inc.
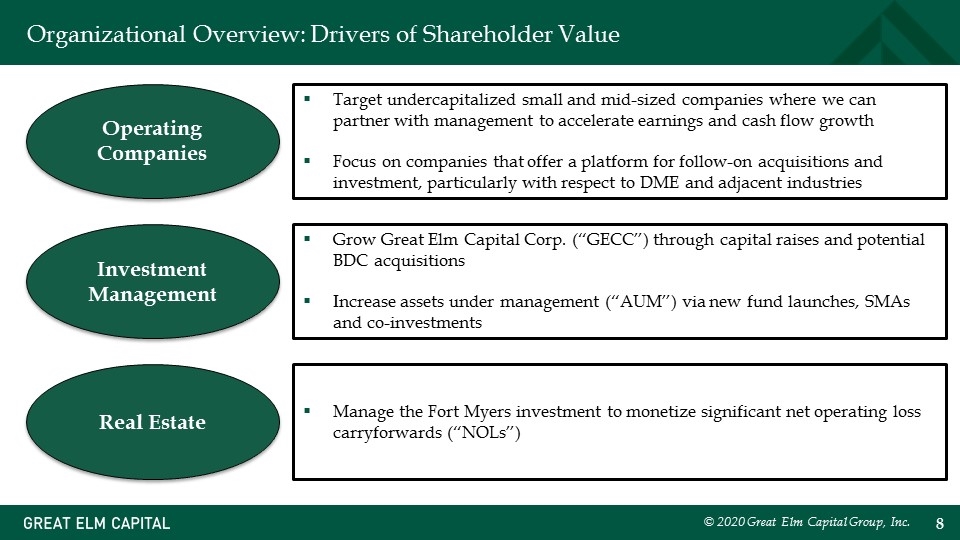
© 2020 Great Elm Capital Group, Inc. Organizational Overview: Drivers of Shareholder Value Operating Companies Real Estate Investment Management Target undercapitalized small and mid-sized companies where we can partner with management to accelerate earnings and cash flow growth Focus on companies that offer a platform for follow-on acquisitions and investment, particularly with respect to DME and adjacent industries Grow Great Elm Capital Corp. (“GECC”) through capital raises and potential BDC acquisitions Increase assets under management (“AUM”) via new fund launches, SMAs and co-investments Manage the Fort Myers investment to monetize significant net operating loss carryforwards (“NOLs”)
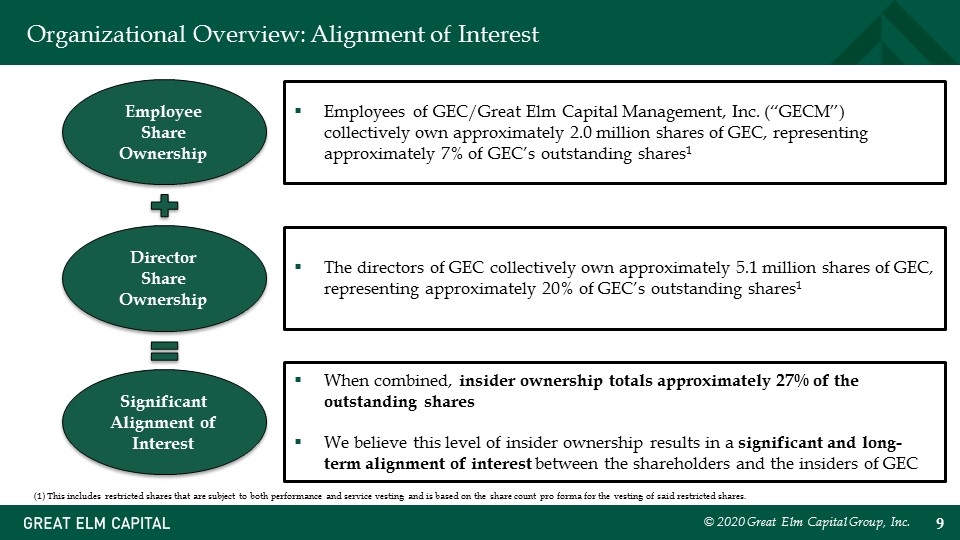
© 2020 Great Elm Capital Group, Inc. Organizational Overview: Alignment of Interest When combined, insider ownership totals approximately 27% of the outstanding shares We believe this level of insider ownership results in a significant and long-term alignment of interest between the shareholders and the insiders of GEC Director Share Ownership Employees of GEC/Great Elm Capital Management, Inc. (“GECM”) collectively own approximately 2.0 million shares of GEC, representing approximately 7% of GEC’s outstanding shares1 The directors of GEC collectively own approximately 5.1 million shares of GEC, representing approximately 20% of GEC’s outstanding shares1 Significant Alignment of Interest Employee Share Ownership (1) This includes restricted shares that are subject to both performance and service vesting and is based on the share count pro forma for the vesting of said restricted shares.
Operating Companies: Great Elm DME © 2020 Great Elm Capital Group, Inc.
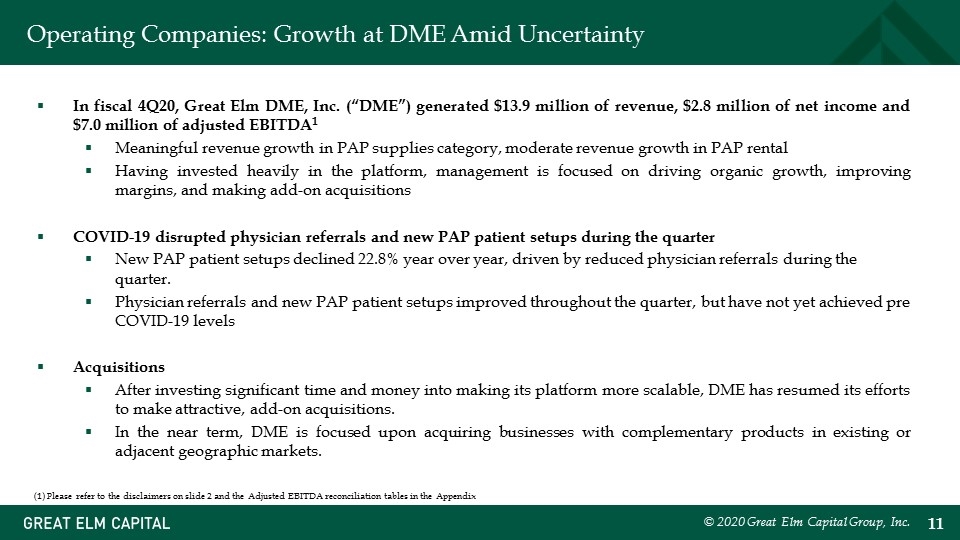
In fiscal 4Q20, Great Elm DME, Inc. (“DME”) generated $13.9 million of revenue, $2.8 million of net income and $7.0 million of adjusted EBITDA1 Meaningful revenue growth in PAP supplies category, moderate revenue growth in PAP rental Having invested heavily in the platform, management is focused on driving organic growth, improving margins, and making add-on acquisitions COVID-19 disrupted physician referrals and new PAP patient setups during the quarter New PAP patient setups declined 22.8% year over year, driven by reduced physician referrals during the quarter. Physician referrals and new PAP patient setups improved throughout the quarter, but have not yet achieved pre COVID-19 levels Acquisitions After investing significant time and money into making its platform more scalable, DME has resumed its efforts to make attractive, add-on acquisitions. In the near term, DME is focused upon acquiring businesses with complementary products in existing or adjacent geographic markets. © 2020 Great Elm Capital Group, Inc. (1) Please refer to the disclaimers on slide 2 and the Adjusted EBITDA reconciliation tables in the Appendix Operating Companies: Growth at DME Amid Uncertainty
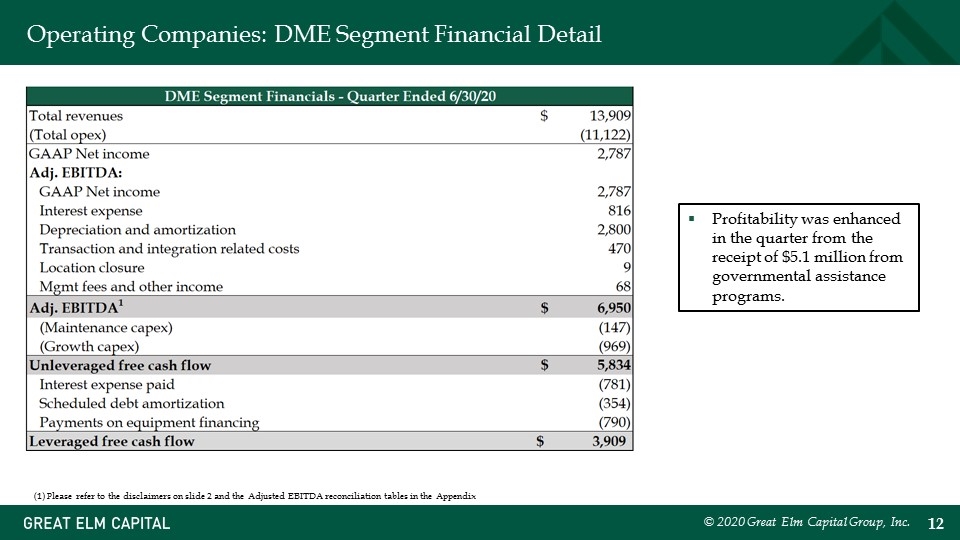
Operating Companies: DME Segment Financial Detail © 2020 Great Elm Capital Group, Inc. (1) Please refer to the disclaimers on slide 2 and the Adjusted EBITDA reconciliation tables in the Appendix Profitability was enhanced in the quarter from the receipt of $5.1 million from governmental assistance programs.
Investment Management © 2020 Great Elm Capital Group, Inc.
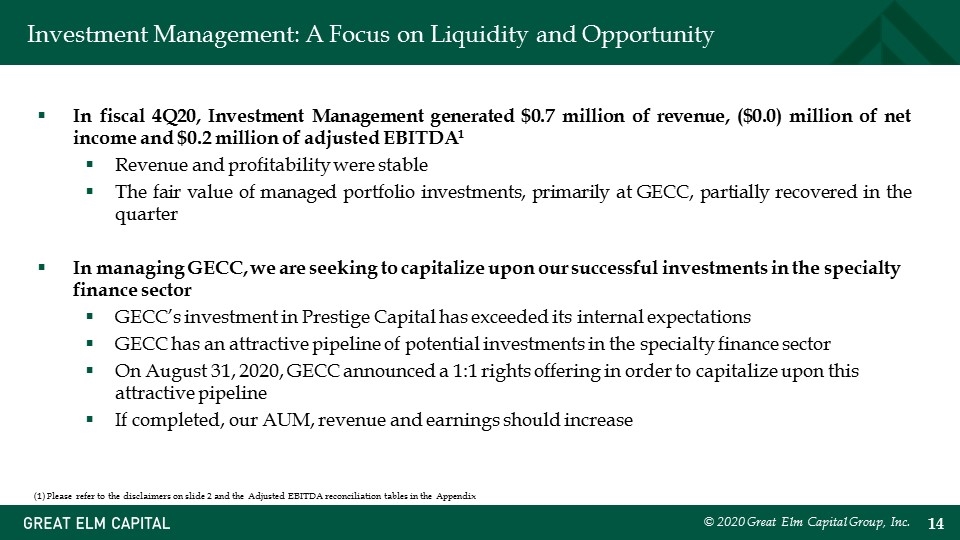
Investment Management: A Focus on Liquidity and Opportunity In fiscal 4Q20, Investment Management generated $0.7 million of revenue, ($0.0) million of net income and $0.2 million of adjusted EBITDA1 Revenue and profitability were stable The fair value of managed portfolio investments, primarily at GECC, partially recovered in the quarter In managing GECC, we are seeking to capitalize upon our successful investments in the specialty finance sector GECC’s investment in Prestige Capital has exceeded its internal expectations GECC has an attractive pipeline of potential investments in the specialty finance sector On August 31, 2020, GECC announced a 1:1 rights offering in order to capitalize upon this attractive pipeline If completed, our AUM, revenue and earnings should increase © 2020 Great Elm Capital Group, Inc. (1) Please refer to the disclaimers on slide 2 and the Adjusted EBITDA reconciliation tables in the Appendix
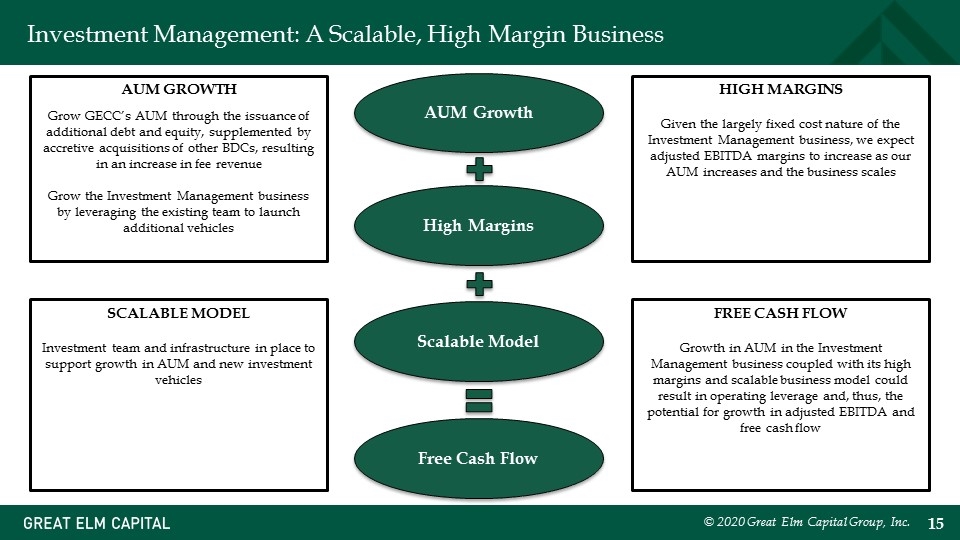
© 2020 Great Elm Capital Group, Inc. Investment Management: A Scalable, High Margin Business AUM Growth High Margins Scalable Model Free Cash Flow AUM GROWTH Grow GECC’s AUM through the issuance of additional debt and equity, supplemented by accretive acquisitions of other BDCs, resulting in an increase in fee revenue Grow the Investment Management business by leveraging the existing team to launch additional vehicles HIGH MARGINS Given the largely fixed cost nature of the Investment Management business, we expect adjusted EBITDA margins to increase as our AUM increases and the business scales SCALABLE MODEL Investment team and infrastructure in place to support growth in AUM and new investment vehicles FREE CASH FLOW Growth in AUM in the Investment Management business coupled with its high margins and scalable business model could result in operating leverage and, thus, the potential for growth in adjusted EBITDA and free cash flow
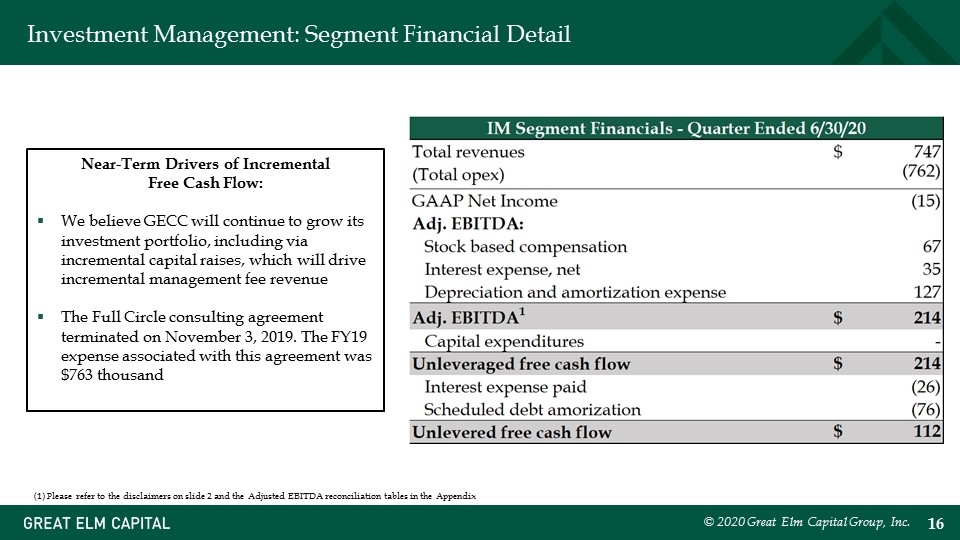
Investment Management: Segment Financial Detail © 2020 Great Elm Capital Group, Inc. Near-Term Drivers of Incremental Free Cash Flow: We believe GECC will continue to grow its investment portfolio, including via incremental capital raises, which will drive incremental management fee revenue The Full Circle consulting agreement terminated on November 3, 2019. The FY19 expense associated with this agreement was $763 thousand (1) Please refer to the disclaimers on slide 2 and the Adjusted EBITDA reconciliation tables in the Appendix

Real Estate © 2020 Great Elm Capital Group, Inc.
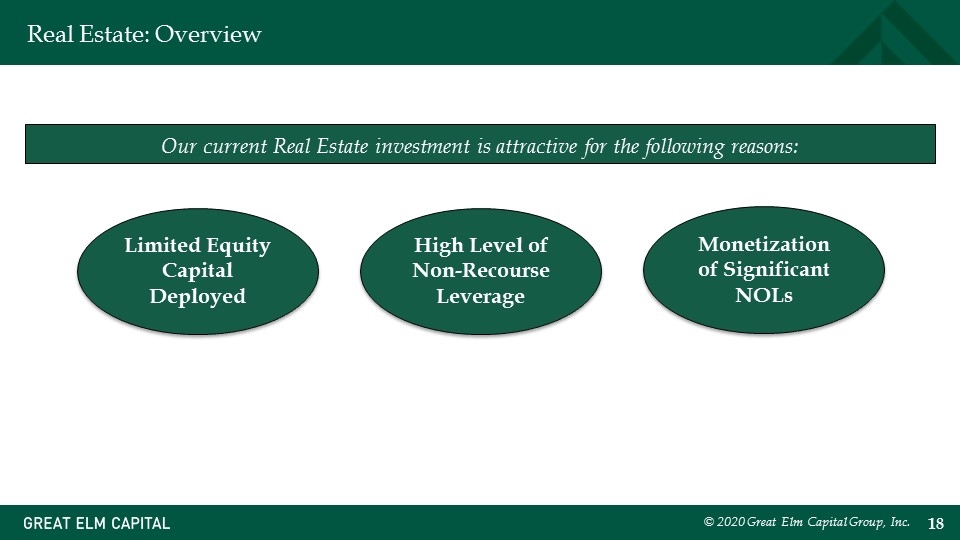
© 2020 Great Elm Capital Group, Inc. Real Estate: Overview Our current Real Estate investment is attractive for the following reasons: Limited Equity Capital Deployed High Level of Non-Recourse Leverage Monetization of Significant NOLs
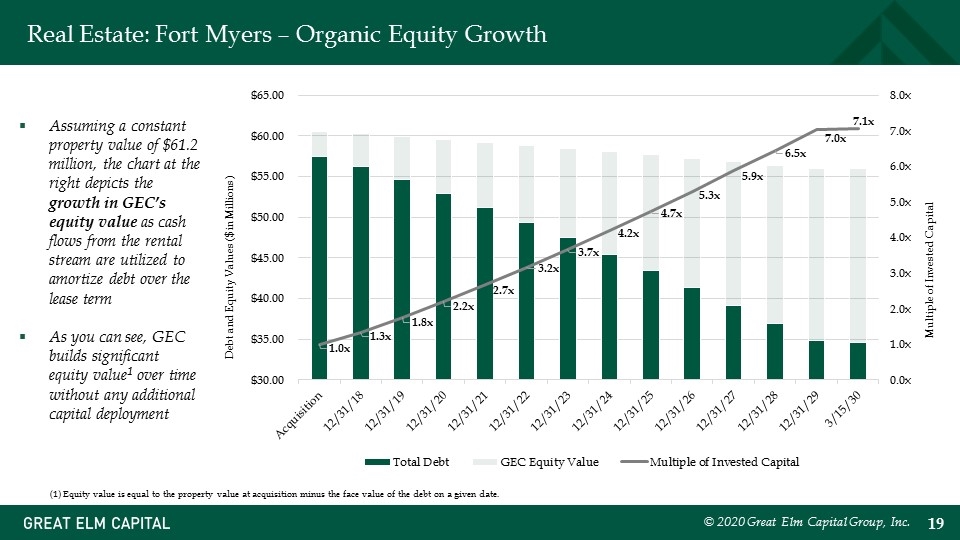
Real Estate: Fort Myers – Organic Equity Growth © 2020 Great Elm Capital Group, Inc. Debt and Equity Values ($ in Millions) Multiple of Invested Capital Assuming a constant property value of $61.2 million, the chart at the right depicts the growth in GEC’s equity value as cash flows from the rental stream are utilized to amortize debt over the lease term As you can see, GEC builds significant equity value1 over time without any additional capital deployment (1) Equity value is equal to the property value at acquisition minus the face value of the debt on a given date.
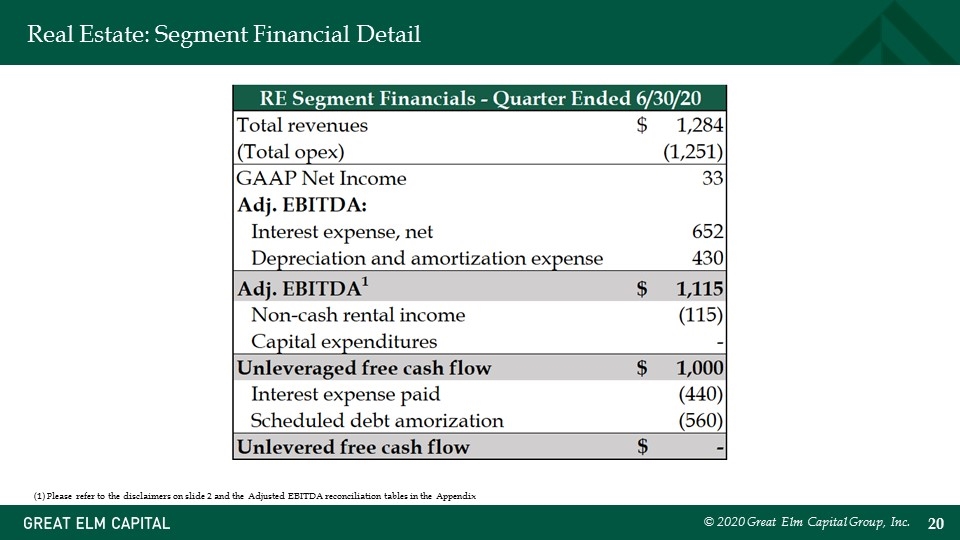
Real Estate: Segment Financial Detail © 2020 Great Elm Capital Group, Inc. (1) Please refer to the disclaimers on slide 2 and the Adjusted EBITDA reconciliation tables in the Appendix
General Corporate © 2020 Great Elm Capital Group, Inc.
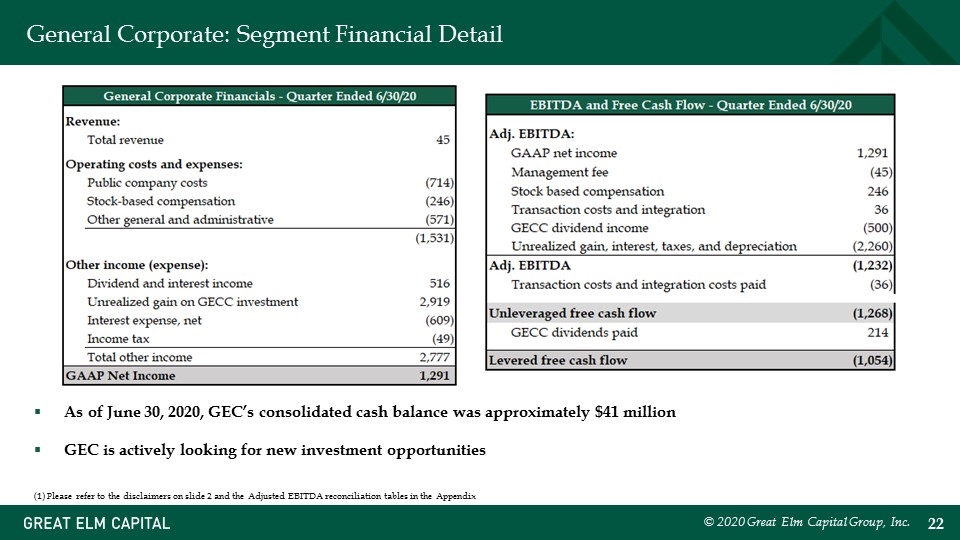
General Corporate: Segment Financial Detail © 2020 Great Elm Capital Group, Inc. (1) Please refer to the disclaimers on slide 2 and the Adjusted EBITDA reconciliation tables in the Appendix As of June 30, 2020, GEC’s consolidated cash balance was approximately $41 million GEC is actively looking for new investment opportunities
© 2020 Great Elm Capital Group, Inc. Financial Review
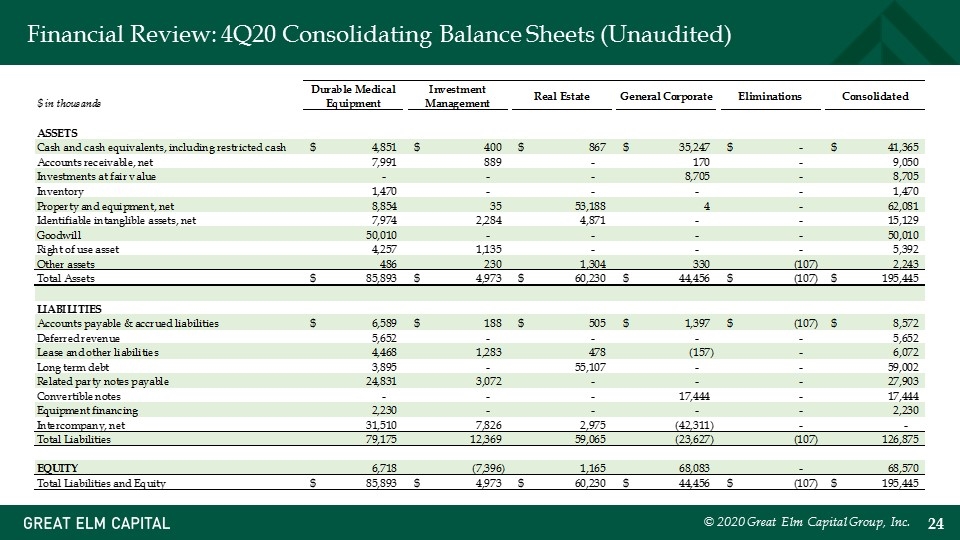
Financial Review: 4Q20 Consolidating Balance Sheets (Unaudited) © 2020 Great Elm Capital Group, Inc. Slide 24 $ in thousands Durable Medical Equipment Investment Management Real Estate General Corporate Eliminations Consolidated ASSETS Cash and cash equivalents, including restricted cash $4,851.2516399999995 $400.02542 $866.59424999999999 $35,247.25821 $0 $41,365.129520000002 Accounts receivable, net 7,990.8112999999967 888.60451 0 169.60594 0 9,050.217499999962 Investments at fair value 0 0 0 8,705.283600000002 0 8,705.283600000002 Inventory 1,469.5188600000001 0 0 0 0 1,469.5188600000001 Property and equipment, net 8,853.580030000001 34.606949999999998 53,187.910540000004 3.5210500000000002 0 62,080.618570000006 Identifiable intanglible assets, net 7,973.9446499999976 2,283.5645600000003 4,871.623100000003 0 0 15,128.571519999998 Goodwill 50,010.17929 0 0 0 0 50,010.17929 18110 - Goodwill Right of use asset 4,256.8836299999994 1,134.9186999999999 0 0 0 5,391.8023299999995 Other assets 486.16240000000005 230.43571999999998 1,304.2843799999998 330.12795 -,106.85266 2,243.1577899999997 Total Assets $85,893.331799999985 $4,973.1558600000008 $60,229.851480000005 $44,455.54151000001 $-,106.85266 $,195,445.2799 LIABILITIES Accounts payable & accrued liabilities $6,589.4560299999994 $187.56914 $505.49454000000003 $1,396.9483899999998 $-,106.85266 $8,571.6154399999996 Deferred revenue 5,651.6383500000002 0 0 0 0 5,651.6383500000002 Lease and other liabilities 4,468.1834200000003 1,283.2115699999999 478.06133 -,156.82465999999999 0 6,071.63166 Long term debt 3,894.7917400000001 0 55,107.458559999999 0 0 59,002.2503 Related party notes payable 24,830.603869999999 3,072 0 0 0 27,902.603869999999 Convertible notes 0 0 0 17,443.646079999999 0 17,443.646079999999 Equipment financing 2,229.8985499999999 0 0 0 0 2,229.8985499999999 Intercompany, net 31,509.849519999996 7,825.9820999999956 2,974.6728900000007 ,-42,310.561099999999 0 0 Total Liabilities 79,175.42147999999 12,368.762809999997 59,064.687319999997 ,-23,626.791290000001 -,106.85266 ,126,875.28425000001 EQUITY 6,717.91032000001 -7,395.6069500000003 1,165.1641600000003 68,083.332600000751 0 68,569.80013000076 Total Liabilities and Equity $85,893.3318 $4,973.1558599999962 $60,229.851479999998 $44,455.54131000075 $-,106.85266 $,195,445.8438000077 $0 $0 $0 $1.99999260075856E-4 $0 $-5.6390000769170001E-2
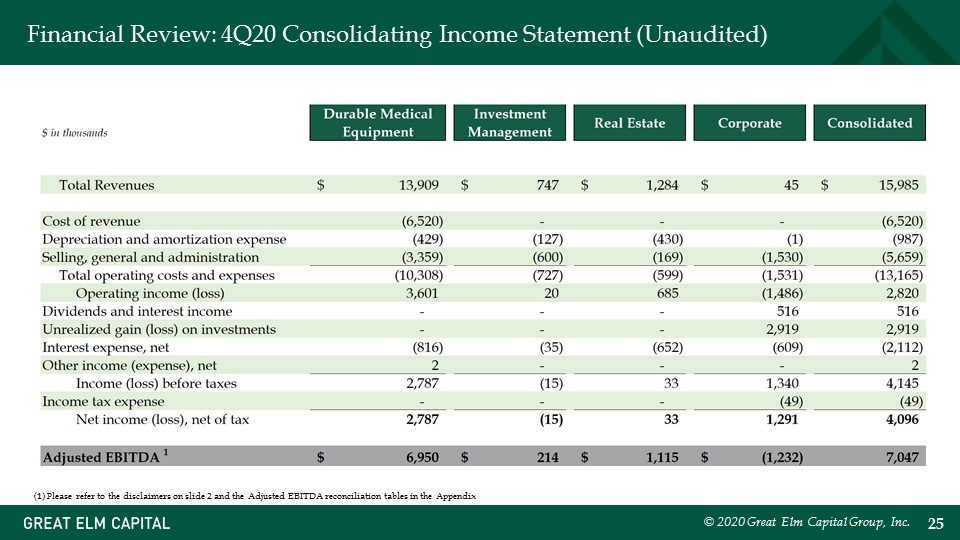
Financial Review: 4Q20 Consolidating Income Statement (Unaudited) © 2020 Great Elm Capital Group, Inc. (1) Please refer to the disclaimers on slide 2 and the Adjusted EBITDA reconciliation tables in the Appendix
Summary © 2020 Great Elm Capital Group, Inc.
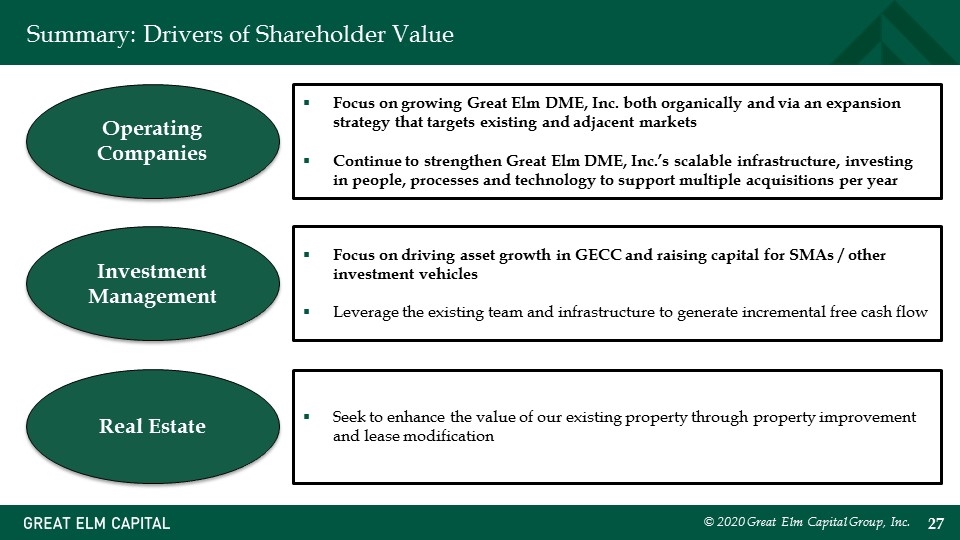
© 2020 Great Elm Capital Group, Inc. Summary: Drivers of Shareholder Value Seek to enhance the value of our existing property through property improvement and lease modification Operating Companies Real Estate Investment Management Focus on growing Great Elm DME, Inc. both organically and via an expansion strategy that targets existing and adjacent markets Continue to strengthen Great Elm DME, Inc.’s scalable infrastructure, investing in people, processes and technology to support multiple acquisitions per year Focus on driving asset growth in GECC and raising capital for SMAs / other investment vehicles Leverage the existing team and infrastructure to generate incremental free cash flow

Q&A © 2020 Great Elm Capital Group, Inc.
Appendix © 2020 Great Elm Capital Group, Inc.
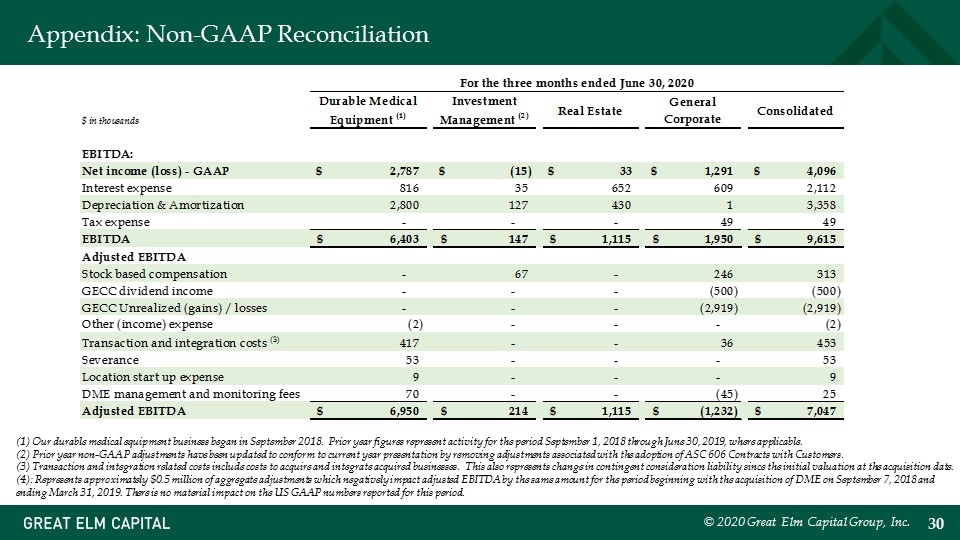
Appendix: Non-GAAP Reconciliation © 2020 Great Elm Capital Group, Inc. (1) Our durable medical equipment business began in September 2018. Prior year figures represent activity for the period September 1, 2018 through June 30, 2019, where applicable. (2) Prior year non-GAAP adjustments have been updated to conform to current year presentation by removing adjustments associated with the adoption of ASC 606 Contracts with Customers. (3) Transaction and integration related costs include costs to acquire and integrate acquired businesses. This also represents change in contingent consideration liability since the initial valuation at the acquisition date. (4): Represents approximately $0.5 million of aggregate adjustments which negatively impact adjusted EBITDA by the same amount for the period beginning with the acquisition of DME on September 7, 2018 and ending March 31, 2019. There is no material impact on the US GAAP numbers reported for this period.
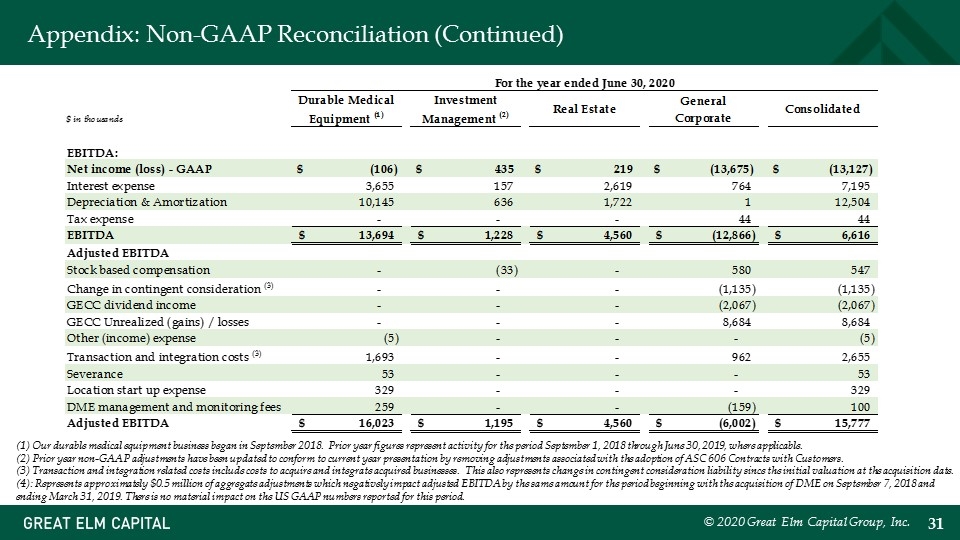
Appendix: Non-GAAP Reconciliation (Continued) © 2020 Great Elm Capital Group, Inc. (1) Our durable medical equipment business began in September 2018. Prior year figures represent activity for the period September 1, 2018 through June 30, 2019, where applicable. (2) Prior year non-GAAP adjustments have been updated to conform to current year presentation by removing adjustments associated with the adoption of ASC 606 Contracts with Customers. (3) Transaction and integration related costs include costs to acquire and integrate acquired businesses. This also represents change in contingent consideration liability since the initial valuation at the acquisition date. (4): Represents approximately $0.5 million of aggregate adjustments which negatively impact adjusted EBITDA by the same amount for the period beginning with the acquisition of DME on September 7, 2018 and ending March 31, 2019. There is no material impact on the US GAAP numbers reported for this period.
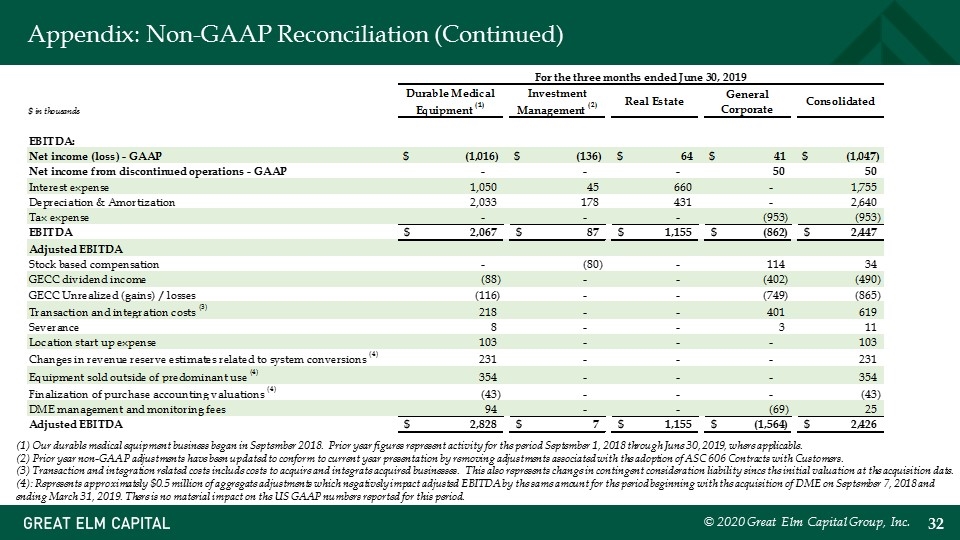
Appendix: Non-GAAP Reconciliation (Continued) © 2020 Great Elm Capital Group, Inc. (1) Our durable medical equipment business began in September 2018. Prior year figures represent activity for the period September 1, 2018 through June 30, 2019, where applicable. (2) Prior year non-GAAP adjustments have been updated to conform to current year presentation by removing adjustments associated with the adoption of ASC 606 Contracts with Customers. (3) Transaction and integration related costs include costs to acquire and integrate acquired businesses. This also represents change in contingent consideration liability since the initial valuation at the acquisition date. (4): Represents approximately $0.5 million of aggregate adjustments which negatively impact adjusted EBITDA by the same amount for the period beginning with the acquisition of DME on September 7, 2018 and ending March 31, 2019. There is no material impact on the US GAAP numbers reported for this period.
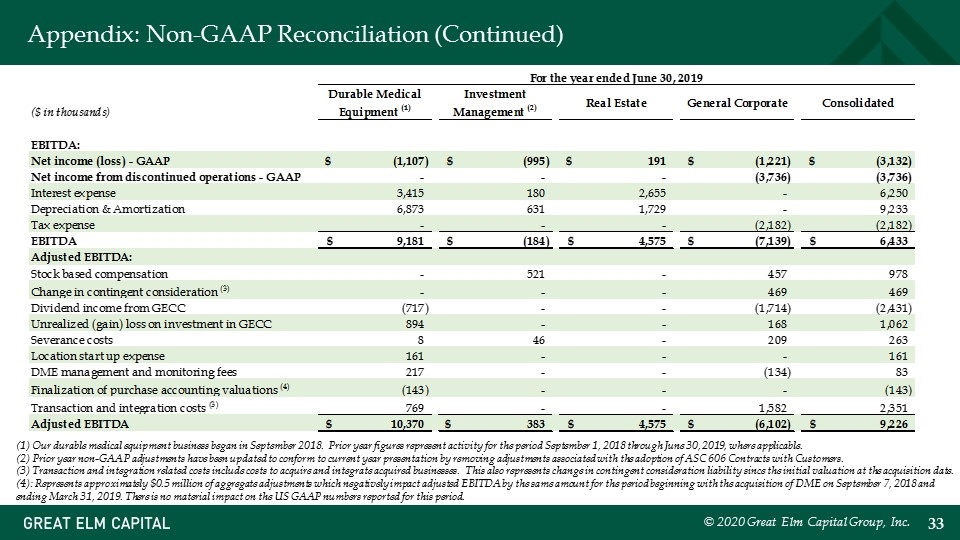
Appendix: Non-GAAP Reconciliation (Continued) © 2020 Great Elm Capital Group, Inc. (1) Our durable medical equipment business began in September 2018. Prior year figures represent activity for the period September 1, 2018 through June 30, 2019, where applicable. (2) Prior year non-GAAP adjustments have been updated to conform to current year presentation by removing adjustments associated with the adoption of ASC 606 Contracts with Customers. (3) Transaction and integration related costs include costs to acquire and integrate acquired businesses. This also represents change in contingent consideration liability since the initial valuation at the acquisition date. (4): Represents approximately $0.5 million of aggregate adjustments which negatively impact adjusted EBITDA by the same amount for the period beginning with the acquisition of DME on September 7, 2018 and ending March 31, 2019. There is no material impact on the US GAAP numbers reported for this period.

Appendix: Contact Information Investor Relations 800 South Street, Suite 230 Waltham, MA 02453 Phone: +1 (617) 375-3006 investorrelations@greatelmcap.com © 2020 Great Elm Capital Group, Inc.
