Attached files
| file | filename |
|---|---|
| 8-K - FORM 8-K - FVCBankcorp, Inc. | tm2031148-1_8k.htm |
Exhibit 99.1

Summer 2020 NASDAQ: FVCB
Forward - Looking Statements; Non - GAAP Information This presentation contains forward - looking statements within the meaning of Section 27 A of the Securities Act of 1933 , as amended, and Section 21 E of the Securities and Exchange Act of 1934 , as amended, including statements of goals, intentions, and expectations as to future trends, plans, events or results of FVCB’s operations and policies and regarding general economic conditions . These forward - looking statements include, but are not limited to, statements about ( i ) FVCB’s plans, obligations, expectations and intentions and (ii) other statements that are not historical facts . In some cases, forward - looking statements can be identified by use of words such as “may,” “will,” “anticipates,” “believes,” “expects,” “plans,” “estimates,” “potential,” “continue,” “should,” and similar words or phrases . These statements are based upon the expectations, beliefs and assumptions of the management of FVCB as to the expected outcomes of future events, current and anticipated economic conditions, nationally and in FVCB’s markets, and their impact on the operations and assets of FVCB, interest rates and interest rate policy, competitive factors and other conditions which by their nature, are not susceptible to accurate forecast and are subject to significant risks and uncertainties . Factors that could cause results and outcomes to differ materially include, among others, the expected growth opportunities or cost savings resulting from the merger, which may not be fully realized or take longer than expected to realize ; the ability of the two companies to avoid customer dislocation or runoff, and employee attrition following the merger ; changes in FVCB’s operating or expansion strategy ; availability of and costs associated with obtaining adequate and timely sources of liquidity, the ability to maintain credit quality, possible adverse rulings, judgments, settlements and other outcomes of pending litigation, the ability of FVCB to collect amounts due under loan agreements, changes in consumer preferences, effectiveness of FVCB’s interest rate risk management strategies, laws and regulations affecting financial institutions in general or relating to taxes, the effect of pending or future legislation, business disruption following the merger with Colombo, changes in interest rates and capital markets, inflation, customer acceptance of FVCB’s products and services, customer borrowing, repayment, investment and deposit practices ; customer disintermediation ; the introduction, withdrawal, success and timing of business initiatives ; competitive conditions and other risk factors described in FVCB’s filings with the SEC . For a discussion of these and other factors, please review the “Cautionary Note Regarding Forward - Looking Statements” and Risk Factors in FVCB’s prospectus filed with the SEC on September 17 , 2018 , pursuant to Rule 424 (b) . Because of these uncertainties and the assumptions on which this discussion and the forward - looking statements are based, actual future operations and results in the future may differ materially from those indicated herein . Readers are cautioned against placing undue reliance on such forward - looking statements . Past results are not necessarily indicative of future performance . FVCB assumes no obligation to revise, update, or clarify forward - looking statements to reflect events or conditions after the date of this release . Use of Non - GAAP Financial Measures This presentation includes certain financial information that is calculated and presented on the basis of methodologies that are not in accordance with U . S . Generally Accepted Accounting Principles (“GAAP”) . These non - GAAP financial measures include core return on average assets, tangible book value, tangible common equity, tangible assets and efficiency ratio . The non - GAAP financial measures included in this presentation do not replace the presentation of FVCB’s GAAP financial results, should not be considered as a substitute for operating results determined in accordance with GAAP and may not be comparable to other similarly titled measures of other companies . These measurements provide supplemental information to assist management, as well as certain investors, in analyzing FVCB’s core business, capital position and results of operations . FVCB has chosen to provide this additional information to investors because it believes that these measures are meaningful in assisting investors to evaluate FVCB’s core ongoing operations, results and financial condition . Reconciliations of the non - GAAP financial measures provided in this presentation to the most directly comparable GAAP measures can be found in the appendix of this presentation . 2

An Attractive Investment Opportunity in the DC and Baltimore MSAs 3 • Sixth largest MSA with favorable demographics, economic trends and business investments • Recent consolidation in local markets has created growth opportunities for remaining firms • Organic CAGRs in excess of 17 % for assets, loans, deposits and pre - tax income since 2015 • Pre - tax pre - provision ROAA and ROAE of 1.41% and 13.49%, respectively, for the most recent quarter • Commercial focused lending portfolio with small average loan balances that further mitigates risk • Emphasis on credit administration and risk management; comprehensive policies and procedures enabling the maintenance of strong asset quality • Strategy of full service relationship banking helps support FVCB’s margin • Treasury management tools allow FVCB to compete against larger competitors and attract sophisticated commercial and government customers • Hands on management team with intimate knowledge of clients, credits, markets and employees • Proven track record of growth at varying institutions within the DC MSA Well positioned in one of the most attractive banking markets in the U.S. Track record of exceptional growth and strong profitability Disciplined, low risk commercial balance sheet Strong core deposit base Experienced leadership team

4 (1) Financial data as of or annualized for the three months ended June 30, 2020, unless otherwise noted (2) Pre - tax pre - provision also excludes branch closure costs of $676,000 recorded during the second quarter of 2020. (3) Nonperforming assets defined as nonaccruals, loans past - due 90 days or more, and other real estate owned Source: S&P Global Market Intelligence; Company documents Company Snapshot FVCB Legacy (5) FVCB Acquired (4) FVCB Branch Closures 4th QTR 2020 (2) 2 6 1 3 5 4 9 7 8 10 11 Address City , State Total Deposits ($000) 5-Year CAGR (%) 1 11325 Random Hills Rd Fairfax, VA 707,801 23.02 2 7900 Sudley Rd Manassas, VA 207,058 9.11 3 11260 Roger Bacon Dr Reston, VA 209,648 15.17 4 2500 Wilson Blvd Arlington, VA 159,144 17.37 5 6975 Springfield Blvd Springfield, VA 67,989 19.35 6 43800 Central Station Dr Ashburn, VA 57,924 – 7 224 Albemarle St Baltimore, MD 21,649 11.44 8 6929 Arlington Rd Bethesda, MD 26,247 8.90 9 1600 E Gude Dr Rockville, MD 19,479 (9.00) 10 7901 Eastern Ave Silver Spring, MD 15,244 2.49 11 1301 9th St NW Washington, DC 34,866 (12.84) Dollar values in thousands, except per share data Financial Highlights ¹ Total Assets $1,781,149 Gross Loans $1,484,928 Total Deposits $1,519,036 Tangible Common Equity $172,127 TCE / TA 9.66% MRQ Pre - tax pre - provision ROAA 2 1.41% MRQ Pre - tax pre - provision ROAE 2 13.49% MRQ Net Interest Margin 3.16% MRQ Efficiency Ratio 2 54.72% NPAs 3 / Assets 0.69% Capitalization Detail ¹ Common Shares Outstanding (actual) 13,459,317 Options Outstanding 1,747,109 Average Weighted Strike Price of Options $8.13 Restricted Stock Units ( Exluded from share count ) 107,603 Basic Tangible Book Value per Share $12.79 MRQ EPS Annualized $0.84 LPO

Well Positioned In One of the Most Attractive Markets in the U.S. 5 Top 10 MSAs By Population Vibrant Economy • Washington D . C . and Baltimore MSAs contain 30 and 7 Fortune 1000 companies, respectively • Over 3 . 3 million private sector employees and nearly 1 million public sector employees in the Washington D . C . and Baltimore MSAs • Virginia was ranked the 4 th best state for business in 2018 by CNBC • Both states have large workforce populations spanning several generational demographic cohorts • 9 of the top 30 wealthiest counties in the nation are located in Washington DC and Baltimore MSAs • Numerous Government Contracting entities support government functions • With over 30 banks acquired in these markets over the past five years, there are limited investment opportunities to invest in community banks in this market Source: S&P Global Market Intelligence; FDIC, Proximityone.com, DC Department of Employment Services, Maryland Department of Labor, Licensing and Regulation, US News and World Report Market Name Population 2025 Proj. Population CAGR (%) Median Household Income 2025 Proj. Income CAGR (%) 5 Yr. Historical Deposit CAGR (%) New York-Newark-Jersey City 19,326,240 0.15 82,805 2.39 2.7 Los Angeles-Long Beach-Anaheim 13,384,797 0.50 76,225 2.58 6.8 Chicago-Naperville-Elgin 9,479,301 0.02 74,285 2.21 2.5 Dallas-Fort Worth-Arlington 7,660,453 1.44 73,009 2.01 7.6 Houston-The Woodlands-Sugar Land 7,170,379 1.46 67,790 0.55 -0.7 Washington-Arlington-Alexandria 6,346,402 0.92 107,029 1.74 5.9 Miami-Fort Lauderdale-Pompano Beach 6,324,937 1.24 60,197 2.20 4.8 Philadelphia-Camden-Wilmington 6,116,324 0.25 74,223 2.15 -2.1 Atlanta-Sandy Springs-Alpharetta 6,073,585 1.20 71,946 2.49 6.4 Phoenix-Mesa-Chandler, AZ 4,991,128 1.39 67,981 2.38 8.9

Colombo contribution (1) Annualized growth over the first six months of 2020 Source : S&P Global Market Intelligence; Company documents 6 Total Assets Total Loans, Net of Fees Total Deposits Organic CAGR: 21.7% Organic CAGR: 21.1% Organic CAGR: 21.7% Organic YOY Growth Rate Organic YOY Growth Rate Organic YOY Growth Rate Organic Growth Track Record of Exceptional Growth and Strong Profitability Relationship Driven Model Continues to Create Balance Sheet Leverage 21.8% 23.3% 15 .8% 9 .5% 24.6 % 15.9 % ¹ 22.4% 23.1% 15 .8% 11.8 % 14.2% 16.3 % ¹ 24.4% 23.8% 19 .6% 10.3% 2 0.3 % 18.0 % ¹ $627 $776 $928 $1,024 $1,286 $1,519 $138 2015 2016 2017 2018 2019 2020Q2 PPP Loans $624 $768 $889 $994 $1,271 $1,309 $143 $169 2015 2016 2017 2018 2019 2020Q2 $737 $909 $1,053 $1,153 $1,537 $1,781 $199 2015 2016 2017 2018 2019 2020Q2

(1) Excludes one - time transaction costs of $3.3 million for 2018 and $0.13 million for 2019 and branch closure costs in 2020 of $0.68 million. (2) Represents YTD 2020Q2 pre - tax pre - provision income Source : S&P Global Market Intelligence; Company documents 7 Pre - Tax Pre - Provision Income ($M) Efficiency Ratio (%) Net Interest Margin (%) Drivers of Earnings Growth : • Continued leverage and upside on Colombo franchise • Continued growth in legacy D . C . and Virginia markets • Deposit cost decreases across customer base to reflect rate environment Track Record of Exceptional Growth and Strong Profitability Stable Margin and Improving Efficiency Produce An Attractive Earnings Stream 3.66% 3.51% 3.43% 3.51% 3.48% 3.26% 2015 2016 2017 2018 2019 YTD Q220 61.3% 58.0% 57.2% 55.7% 57.1% 55.3% 2015 2016 2017 2018 ¹ 2019 ¹ YTD Q220 ¹ $9.4 $12.0 $15.7 $18.4 $21.9 $11.7 2015 2016 2017 2018 ¹ 2019 YTD Q220 ²

Disciplined, Low-Risk Commercial Balance Sheet Well Diversified Commercial Portfolio C&I 30.9% CRE 55.7% Other 13.4% C&I Portfolio Balance % of Portfolio Yield Commercial and Industrial $268,832 18.2% 4.37 % Owner Occupied CRE $187,289 12.7% 4.51 % Total C&I $456,121 30.9% 4.42 % Commercial Real Estate Portfolio Balance % of Portfolio Yield Nonowner Occupied CRE $524,915 35.5% 4.34 % Multifamily $72,288 4.9% 4.21 % Construction & Development $226,824 15.3% 4.87 % Total CRE $824,027 55.7% 4.47 % Other Loans Balance % of Portfolio Yield Residential 1-4 $36,490 2.5% 4.61 % Residential 1-4 Investment Property $77,146 5.2% 4.86 % Home Equity Lines $65,843 4.5% 4.58 % Other Loans $18,493 1.3% 7.26 % Total Loans $1,478,120 4.61 % ($000s) % of Total Loans LTV (Maximum Bank DSC (Minimum CRE Type Balance (excl. PPP Loans) Guidelines) Bank Guidelines) Multi-family $72,493 5.56 % 80% 1.2 Retail $182,425 13.98 % 75% 1.2 Office $97,100 7.44 % 75% 1.2 Hotel $49,536 3.80 % 65% 1.3 Construction $182,293 13.97 % 75% - AD&C $0 0.00 % 65% - Land $44,531 3.41 % 60% - Industrial $103,679 7.95 % 75% 1.2 Mixed Use $56,715 4.35 % 75% 1.2 Special Use $21,960 1.68 % 65% 1.05 - 1.30 Other $13,295 1.02 % 65%-80% 1.2 -1.3Positioning For Future Growth Source: S&P Global Market Intelligence; Company documents • 19 loan officers with deep connections to the markets; average experience of over 20 years • Focused effort on commercial, real estate and small business, including government contracting. • Expanded focus on government contracting provides large source of growth potential • Small average loan balance helps mitigate risk ‒ C&I average loan size: $393,000 ‒ CRE average loan size: $1.4 million
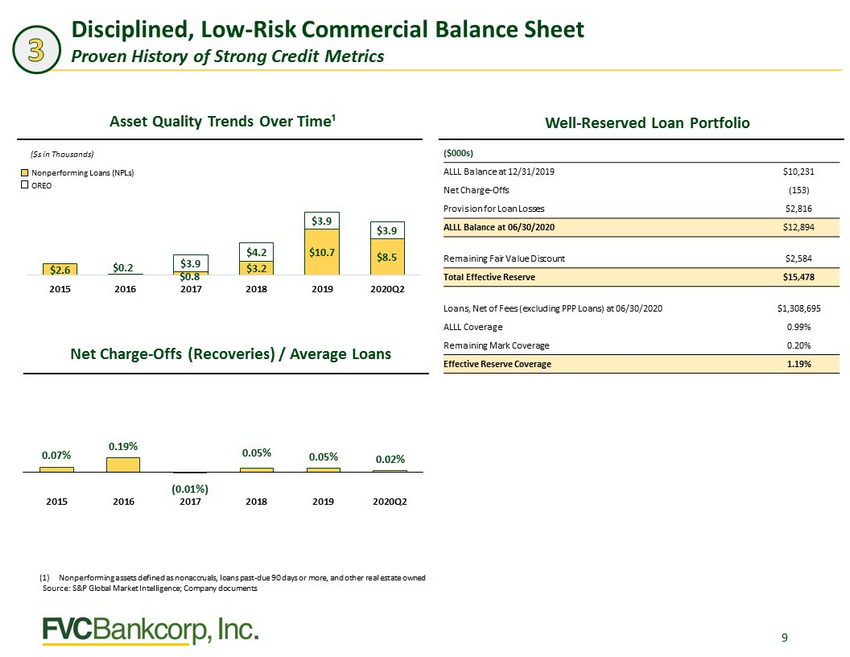
9 Net Charge - Offs (Recoveries) / Average Loans Asset Quality Trends Over Time¹ Well - Reserved Loan Portfolio (1) Nonperforming assets defined as nonaccruals, loans past - due 90 days or more, and other real estate owned Source : S&P Global Market Intelligence; Company documents ($s in Thousands) Nonperforming Loans (NPLs) OREO Disciplined, Low - Risk Commercial Balance Sheet Proven History of Strong Credit Metrics $2.6 $0.2 $0.8 $3.2 $10.7 $8.5 $3.9 $4.2 $3.9 $3.9 2015 2016 2017 2018 2019 2020Q2 0.07% 0.19% (0.01%) 0.05% 0.05% 0.02% 2015 2016 2017 2018 2019 2020Q2 ($000s) ALLL Balance at 12/31/2019 $10,231 Net Charge - Offs (153) Provision for Loan Losses $2,816 ALLL Balance at 06/30/2020 $12,894 Remaining Fair Value Discount $2,584 Total Effective Reserve $15,478 Loans, Net of Fees (excluding PPP Loans) at 06/30/2020 $1,308,695 ALLL Coverage 0.99% Remaining Mark Coverage 0.20% Effective Reserve Coverage 1.19%

Disciplined, Low - Risk Commercial Balance Sheet Payment Deferrals during COVID - 19 Pandemic FVCbank implemented loan payment deferral programs to allow customers who were required to close or reduce business operations as a result of pandemic stay - at - home orders to defer loan principal and interest payments primarily for 90 days. • As of September 15, 2020, $115.4 million in loans are in a payment deferred status: $42.7 million were approved for a second 90 - day deferral period (of which $16.2 million have resumed paying interest only); $72.7 million remain in deferred status from round one modifications (of which $18.2 million are paying interest only); $244.8 million have resumed regular scheduled payments. $3.1 million of payment deferred loans are SBA guaranteed with payments made by the SBA until fourth quarter 2020. • In addition to payment deferral programs, FVCbank participated in the SBA’s Payroll Protection Program, originating over $170 million in loans (net of deferred fees) to existing and new customers. FVCbank has recorded $4.6 million in net deferred fees related to PPP loans which is accreted to interest income over the remaining lives of the PPP loans, or sooner, upon PPP forgiveness or repayment. 10 Asset Class Number of Loans Modified Total Loans Modified ($ in thousands) Total Number of Loans Total Loans ($ in thousands)* Commercial Real Estate - Retail 6 20,005$ 111 201,848$ Commercial Real Estate - Mixed Use 7 9,989 55 86,451 Specialty Use-Hotel/Lodging/Motel 6 45,945 11 59,192 Commercial Real Estate - Office 3 11,404 112 116,055 Multi-Family First Lien 3 7,001 78 99,854 Commercial Real Estate - Industrial 1 1,644 67 97,291 Commercial Real Estate - Special Use/Church 1 1,492 25 46,960 Special Purpose 3 3,563 22 29,493 Other Loan Categories 30 14,338 2,295 589,345 At September 15, 2020 60 115,381$ 2,759 1,326,489$ At July 31, 2020 165 226,683 At June 30, 2020 277 360,177 * Excludes PPP loans COVID Payment Deferrals By Asset Class

Strong Core Deposit Base • Full service relationships continue to drive core deposit growth ‒ Approximately $ 1.03 billion in loans, or 86% of the commercial loan portfolio, retain a deposit relationship with the bank • Growth in commercial accounts provide cross selling opportunities with FVCB’s technology investment ‒ $1.09 b illion in commercial deposits, across 6,900 accounts, with an average rate of 0.43% ‒ Treasury management tools and high - touch service allows FVCB to compete for larger clients • $89.9 million in public funds at an average rate of 1.16% 11 Deposit Portfolio Composition As of 12/31/2015 As of 6/30/2020 Source : S&P Global Market Intelligence; Company documents 12/31/15 Cost of Deposits: 0.65 % Deposit Composition By Delivery Channel MRQ Cost of Deposits: 0.87 % ($s in Thousands) Noninterest bearing 29.1% Interest bearing 43.2% Time 21.1% Wholesale 6.6% Noninterest bearing … Interest bearing 45.6% Time 20.3% Wholesale 13.5% Commercial Retail Public Wholesale Balance Wtd. Cost Balance Wtd. Cost Balance Wtd. Cost Balance Wtd. Cost DDA $ 426,144 0.00 % $ 16,299 0.00 % – – – – Now / Transactions $ 376,788 0.45 % $ 10,795 0.13 % $ 100 0.35 % $ 20,006 0.27 % Savings / MMDA $ 144,504 0.51 % $ 81,909 0.55 % $ 41,863 0.59 % – – Time Deposits $ 141,132 1.56 % $ 131,556 1.78 % $ 47,939 1.67 % $ 80,000 1.23 % Total $ 1,088,568 0.43 % $ 240,560 1.17 % $ 89,902 1.16 % $ 100,006 1.04 % Total Deposits $ 1,519,036 0.87 %

Experienced Leadership Team Management Team With Strong Ties to The Market… 12 FVCB’s executive m ana g e me n t t eam c onsi s t s o f seven o ffice r s with o v e r 185 y e a r s o f c o mbined e xperienc e in the W a shin gt on, D. C . m e t r o poli t an a r ea • D a v i d P ij or w a s the f o u n d i ng Ch a irm an o f the B o a r d o f James M on r o e Bancorp , which o pen e d in J une 1998 in Arli n g t on, V A, a n d w a s in s t rume n t al i n the g r o wth a n d s t r a t e g i c di r ection o f the b ank u n ti l it s s ale t o Me r c a n til e Ban k sha r e s C orp o r a tion i n 200 6 f or $143. 8 m illion Name Current Position Prior Community Bank Experience Years Years at FVCB Experience David W. Pijor Chairman & CEO, Company and Bank James Monroe Bancorp 21 13 Patricia A. Ferrick President, Company and Bank Southern Financial Bancorp, Potomac Bank of Virginia 33 13 B. Todd Dempsey EVP and Chief Operating Officer, Company and Bank United Bank 39 13 William G. Byers EVP and Chief Lending Officer, Company and Bank Middleburg Bank, Century National Bank 26 9 Michael G. Nassy EVP and Chief Credit Officer, Company and Bank City First Bank of DC, National Cooperative Bank 20 8 Sharon L. Jackson EVP and Chief Deposit Officer, Company and Bank MainStreet Bank 34 4 Jennifer L. Deacon EVP and Chief Financial Officer, Company and Bank Cardinal Financial Corp. 23 3
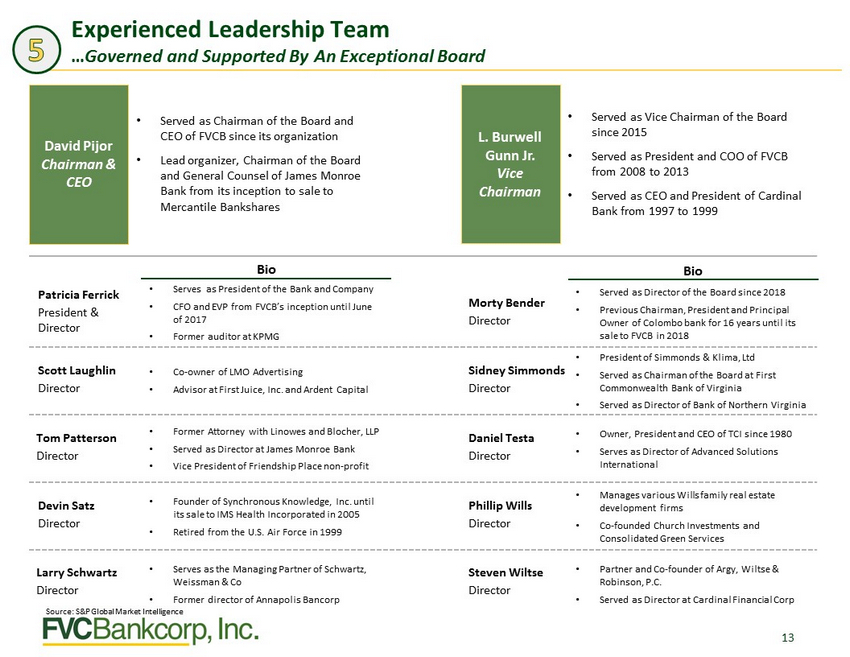
13 David Pijor Chairman & CEO • Served as Chairman of the Board and CEO of FVCB since its organization • Lead organizer, Chairman of the Board and General Counsel of James Monroe Bank from its inception to sale to Mercantile Bankshares L. Burwell Gunn Jr. Vice Chairman • Served as Vice Chairman of the Board since 2015 • Served as President and COO of FVCB from 2008 to 2013 • Served as CEO and President of Cardinal Bank from 1997 to 1999 • Served as Director of the Board since 2018 • Previous Chairman, President and Principal Owner of Colombo bank for 16 years until its sale to FVCB in 2018 Bio Bio Patricia Ferrick President & Director Scott Laughlin Director Tom Patterson Director Devin Satz Director Larry Schwartz Director Morty Bender Director Sidney Simmonds Director Daniel Testa Director Phillip Wills Director Steven Wiltse Director • Manages various Wills family real estate development firms • Co - founded Church Investments and Consolidated Green Services • President of Simmonds & Klima , Ltd • Served as Chairman of the Board at First Commonwealth Bank of Virginia • Served as Director of Bank of Northern Virginia • Owner, President and CEO of TCI since 1980 • Serves as Director of Advanced Solutions International • Partner and Co - founder of Argy , Wiltse & Robinson, P.C. • Served as Director at Cardinal Financial Corp • Serves as President of the Bank and Company • CFO and EVP from FVCB’s inception until June of 2017 • Former auditor at KPMG • Founder of Synchronous Knowledge, Inc. until its sale to IMS Health Incorporated in 2005 • Retired from the U.S. Air Force in 1999 • Co - owner of LMO Advertising • Advisor at First Juice, Inc. and Ardent Capital • Former Attorney with Linowes and Blocher , LLP • Served as Director at James Monroe Bank • Vice President of Friendship Place non - profit • Serves as the Managing Partner of Schwartz, Weissman & Co • Former director of Annapolis Bancorp Source : S&P Global Market Intelligence Experienced Leadership Team … Governed and Supported By An Exceptional Board

Appendix: Additional Materials 14

Financial Highlights 15 (1) Performance ratios presented are calculated using annualized GAAP net income. (2) Nonperforming assets defined as nonaccruals, loans past - due 90 days or more, and other real estate owned (3) Nonperforming loans defined as nonaccruals and 90+ days past due Source : S&P Global Market Intelligence; Company documents Financial Data as of 06/30/20 Dollars in Millions, Except Per Share Amounts 2015 2016 2017 2018 2019 2020Q2 Total Assets $737 $909 $1,053 $1,352 $1,537 $1,781 Total Loans, Net of Fees $624 $768 $889 $1,137 $1,271 $1,478 Total Deposits $627 $776 $928 $1,162 $1,286 $1,519 Total Equity $73 $80 $98 $158 $179 $181 Net Interest Income $22.9 $27.2 $32.1 $39.8 $48.1 $24.9 Non Interest Income $1.2 $1.2 $3.0 $1.7 $2.5 $1.4 Non Interest Expense $14.7 $16.4 $19.3 $26.4 $28.9 $15.2 Net Income $5.4 $6.9 $7.7 $10.9 $15.8 $6.6 Earnings Per Share $0.51 $0.63 $0.67 $0.85 $1.07 $0.46 ROAA 1 0.85% 0.88% 0.80% 0.94% 1.09% 0.67% ROAE 1 7.70% 8.91% 8.63% 9.29% 9.32% 6.41% Efficiency Ratio 61.3% 58.0% 57.2% 55.7% 57.1% 59.8% Net Interest Margin 3.66% 3.51% 3.43% 3.51% 3.48% 3.26% NPAs 2 / Assets 0.35% 0.03% 0.44% 0.57% 0.95% 0.69% Reserves / Loans 1.00% 0.84% 0.87% 0.81% 0.81% 0.87% NPLs 3 / Assets 0.35% 0.03% 0.07% 0.24% 0.70% 0.48% NCO Ratio 0.07% 0.19% (0.01%) 0.05% 0.05% 0.02% Tier 1 Leverage Ratio 10.82% 11.89% 11.79% 12.41% 12.15% 11.05% Income Statement Performance Asset Quality Bank Level Capital Ratios Balance Sheet
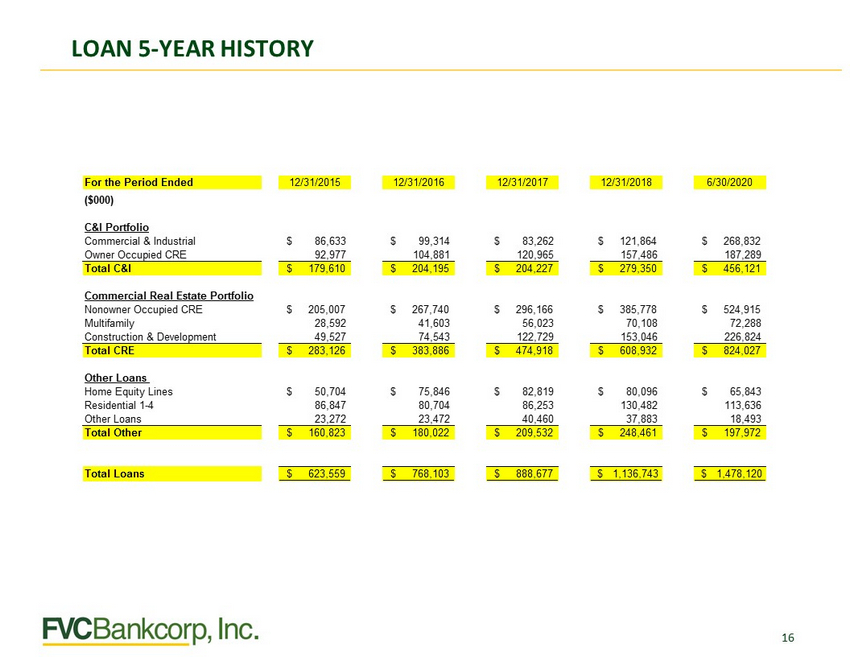
LOAN 5 - YEAR HISTORY 16
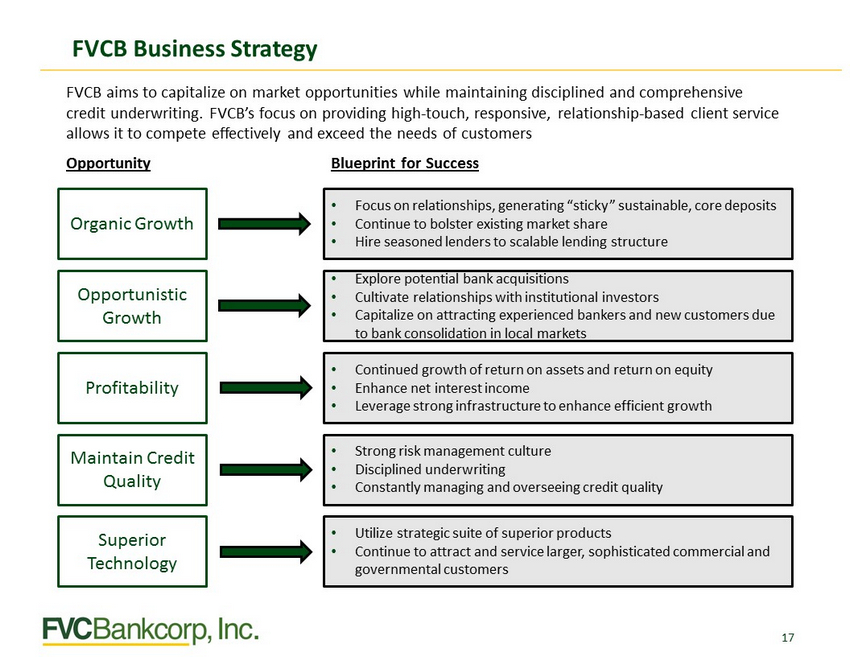
FVCB Business St r a t egy 17 FVCB aims to capitalize on market opportunities while maintaining disciplined and comprehensive credit underwriting. FVCB’s focus on providing high - touch, responsive, relationship - based client service allows it to compete effectively and exceed the needs of customers Opportunity Blueprint for Success Organic Growth • Focus on relationships, generating “sticky” sustainable, core deposits • Continue to bolster existing market share • Hire seasoned lenders to scalable lending structure Opportunistic Growth • Explore potential bank acquisitions • Cultivate relationships with institutional investors • Capitalize on attracting experienced bankers and new customers due to bank consolidation in local markets Maintain Credit Quality • Strong risk management culture • Disciplined underwriting • Constantly managing and overseeing credit quality Superior Technology • Utilize strategic suite of superior products • Continue to attract and service larger, sophisticated commercial and governmental customers Profitability • Continued growth of return on assets and return on equity • Enhance net interest income • Leverage strong infrastructure to enhance efficient growth

F V C B F r anchise History Since inc e p t ion, F V C bank has succes s ful l y e x e cu t e d a s t r at e gic pla n f ocuse d o n o r g anic g ro wth and o p p ortu ni s t ic acquisitions without comp r omisin g ass e t quality o r financial discipline 18 (1) $13.00 for existing shareholders, $13.50 for new shares offered to the public Source : S&P Global Market Intelligence; Company documents June 2013 Follow - On Offering #3 $21.9mm @ $ 13.50 per share ($6.91 per share split adjusted) Q1 2010 Reache d sustained p r ofitability September 2010 Follow- O n Offe r ing #1 $ 6 . 3 m m @ $ 12 . 50 per sh are ($6.40 per share split adjusted) 2010 2011 2013 2014 2015 2016 2017 201 2 2018 May / June 2016 Five for Four Stock S plit June 2016 $25.0 mm 6% Subdebt February 2012 Follow- O n Offe r ing #2 $ 6 . 7m m @ $13.00/$13.50 per share ($6.66/$6.91 per share split adjusted)¹ October 2012 Completed acquisition of 1 st Common w e a lth Bank of Virginia in A r lington, VA April / May 2015 Five for Four Stock Split quoted on OTCQX October 2015 Formed FVCBankcorp Holding Company May 2018 Announced acquisition of Colombo Bank in Rockville, MD September 2018 Initial Public Offering $36.9mm @ $20.00 per share October 2018 Completed acquisition of Colombo Bank in Rockville, MD 20 09 20 08 20 07 November 20 07 FVCbank is established $23mm offering @ $10 per share ($5.12 per share split adjusted) raised in 8 weeks A ugust 2017 Private Reg. D Offering $10.0mm @ $20.00 per share ($16.00 per share split adjusted) September 2017 Five for Four Stock Split 2019

COVID - 19 Update 19 We provide access to financial tools, financial solutions and exceptional service with proactive and responsive relationship banking matched by a commitment to safely and soundly manage bank assets, liquidity and capital. Now more than ever, these priorities have never been more important . Customer outreach and financial Solutions • Regular drive - through hours at all drive - thru locations • Access to all ATMs for deposits and withdrawals • Access to robust and secure mobile and online banking to transact banking with responsive customer support • Providing support to our customers through personal outreach, and temporary solutions such as loan modifications that provide payment deferrals up to 90 days • Participation in the Paycheck Protection Program (PPP loans) to support our customers and businesses in our community Employee and Customer Safety • Our information technology infrastructure has afforded our Bank employees the ability to work remotely as we continue to service the needs of our clients • When in office locations, employees are maintaining safe distances and we have provided more frequent cleaning of our facilities to maintain a safe environment • Provide our customers with financial solutions as well as access to bankers who understand their business and respond quickly
COVID – 19 Update ( continued) 20 Proactive Bank Management • We activated our Emergency Management Team process in February to establish the framework for social distancing protocols and involved management and necessary third parties to allow for a smooth transition given pandemic • Effectively managed liquidity both on balance sheet and with alternative available sources • Diligent monitoring and customer contact with identified credit exposure to high impact asset classes including hotels, churches, and public facilities including retail and other social venues • Provide regular communication on our website and via email communications to our customers • Access to all ATMs for deposits and withdrawals • Management remains connected to employees through frequent departmental calls , bi - weekly company - wide conference calls and regular notifications and updates through both email and the Company’s intranet as warranted. Community Outreach • Reallocated budgeted funds for employee engagement to providing support to community organizations selected by our employees • Contributed to local food banks - Food For Others in Fairfax, Maryland Food Bank, and Capital Area Food Bank in D.C. • Extended Burwell Gunn annual Charity award to three community based client organizations