Attached files
| file | filename |
|---|---|
| EX-99.1 - EX-99.1 - Resource Apartment REIT III, Inc. | d938350dex991.htm |
| EX-10.1 - EX-10.1 - Resource Apartment REIT III, Inc. | d938350dex101.htm |
| EX-2.1 - EX-2.1 - Resource Apartment REIT III, Inc. | d938350dex21.htm |
| 8-K - 8-K - Resource Apartment REIT III, Inc. | d938350d8k.htm |
Resource Real Estate Opportunity REIT (“REIT I”) Resource Real Estate Opportunity REIT II (“REIT II”) Resource Apartment REIT III (“REIT III”) Proposed Merger & Self-administration Transaction September 2020 Exhibit 99.2
Disclosures No Offer or Solicitation This communication shall not constitute an offer to sell or the solicitation of an offer to buy any securities, nor shall there be any sale of securities in any jurisdiction in which such offer, solicitation or sale would be unlawful prior to registration or qualification under the securities laws of any such jurisdiction. No offering of securities shall be made except by means of a prospectus meeting the requirements of Section 10 of the U.S. Securities Act of 1933, as amended. Important Additional Information In connection with the proposed transaction, Resource Real Estate Opportunity REIT II, Inc. (“REIT II”) will file two Registration Statements on Form S-4 with the U.S. Securities and Exchange Commission (the “SEC”). One registration statement will contain a proxy statement of Resource Real Estate Opportunity REIT, Inc. (“REIT I”) and also constitute a prospectus for REIT II. The other registration statement will contain a proxy statement of Resource Apartment REIT III, Inc. (“REIT III”) and also constitute a prospectus of REIT II. The applicable proxy statement/prospectus will be mailed to REIT I’s and REIT III’s respective stockholders. WE URGE INVESTORS TO READ THE APPLICABLE PROXY STATEMENT/PROSPECTUS AND ANY OTHER RELEVANT DOCUMENTS FILED BY REIT I, REIT II AND REIT III, AS APPLICABLE, IN CONNECTION WITH THE PROPOSED MERGER WHEN THEY BECOME AVAILABLE BECAUSE THEY WILL CONTAIN IMPORTANT INFORMATION ABOUT REIT I, REIT II AND REIT III AND THE PROPOSED MERGERS. INVESTORS ARE URGED TO READ THESE DOCUMENTS CAREFULLY AND IN THEIR ENTIRETY. Investors will be able to obtain these materials and other documents filed with the SEC free of charge at the SEC’s website (www.sec.gov). In addition, these materials will also be available free of charge by accessing REIT I’s website (www.resourcereit.com), by accessing REIT II’s website (www.resourcereit2.com), or by accessing REIT III’s website (www.resourcereit3.com). Participants in the Solicitation REIT I, REIT II, REIT III and their respective directors and executive officers and other members of management and employees may be deemed to be participants in the solicitation of proxies in respect of the proposed transaction. Information about REIT I’s directors and executive officers is available in REIT I’s Definitive Proxy Statement on Schedule 14A filed with the SEC on April 29, 2020. Information about REIT II’s directors and executive officers is available in REIT II’s Definitive Proxy Statement on Schedule 14A filed with the SEC on April 29, 2020. Information about REIT III’s directors and executive officers is available in REIT III’s Definitive Proxy Statement on Schedule 14A filed with the SEC on April 29, 2020. Other information regarding the participants in the solicitation and a description of their direct and indirect interests, by security holdings or otherwise, will be contained in the applicable proxy statement/prospectus for REIT I, REIT II and REIT III and other relevant materials to be filed with the SEC regarding the proposed transaction when they become available. Investors should read the applicable proxy statement/prospectus carefully when it becomes available before making any voting or investment decisions. You may obtain free copies of the applicable documents from REIT I, REIT II and REIT III as indicated above. Cautionary Statement Regarding Forward-Looking Statements This communication contains statements that constitute “forward-looking statements,” as such term is defined in Section 27A of the Securities Act of 1933, as amended, and Section 21E of the Securities Exchange Act of 1934, as amended, and such statements are intended to be covered by the safe harbor provided by the same. These statements are based on management’s current expectations and beliefs and are subject to a number of trends and uncertainties that could cause actual results to differ materially from those described in the forward-looking statements. REIT I, REIT II and REIT III can give no assurances that their expectations will be attained. Factors that could cause actual results to differ materially from REIT I’s, REIT II’s and REIT III’s expectations include, but are not limited to, the risk that the proposed mergers will not be consummated within the expected time period or at all; the occurrence of any event, change or other circumstances that could give rise to the termination of the merger agreements; the inability to obtain the stockholder approvals with respect to REIT I and REIT III or the failure to satisfy the other conditions to completion of the proposed mergers; risks related to disruption of management’s attention from the ongoing business operations due to the proposed mergers; availability of suitable investment opportunities; changes in interest rates; the availability and terms of financing; general economic conditions; market conditions; legislative and regulatory changes that could adversely affect the business of REIT I, REIT II and REIT III; and other factors, including those set forth in the Risk Factors section of REIT I’s, REIT II’s and REIT III’s most recent Annual Reports on Form 10-K filed with the SEC, and other reports filed by REIT I, REIT II and REIT III with the SEC, copies of which are available on the SEC’s website, www.sec.gov. REIT I, REIT II and REIT III undertake no obligations to update these statements for revisions or changes after the date of this communication, except as required by law.
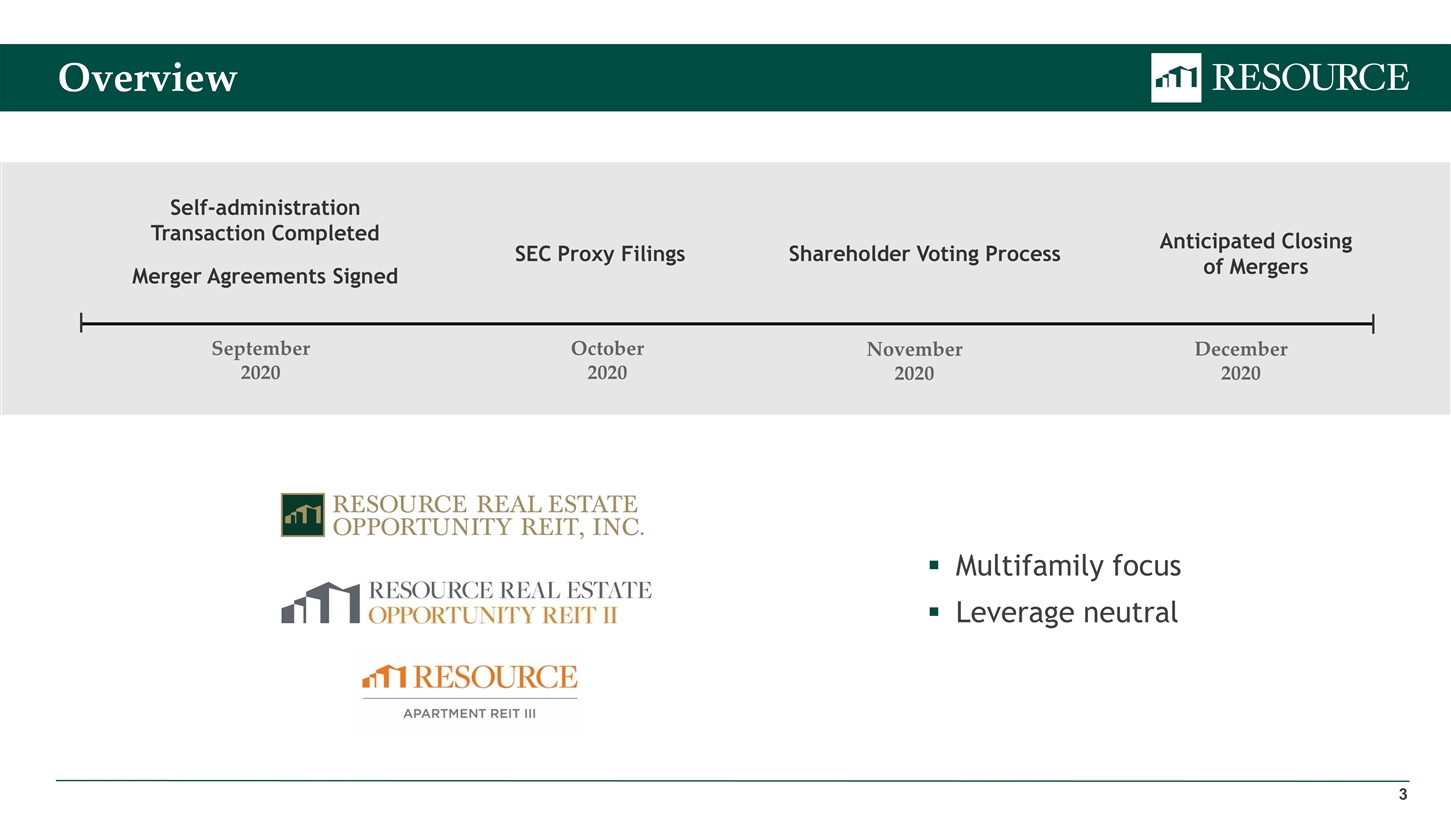
Overview Multifamily focus Leverage neutral Merger Agreements Signed September 2020 October 2020 November 2020 December 2020 Shareholder Voting Process Anticipated Closing of Mergers SEC Proxy Filings Self-administration Transaction Completed
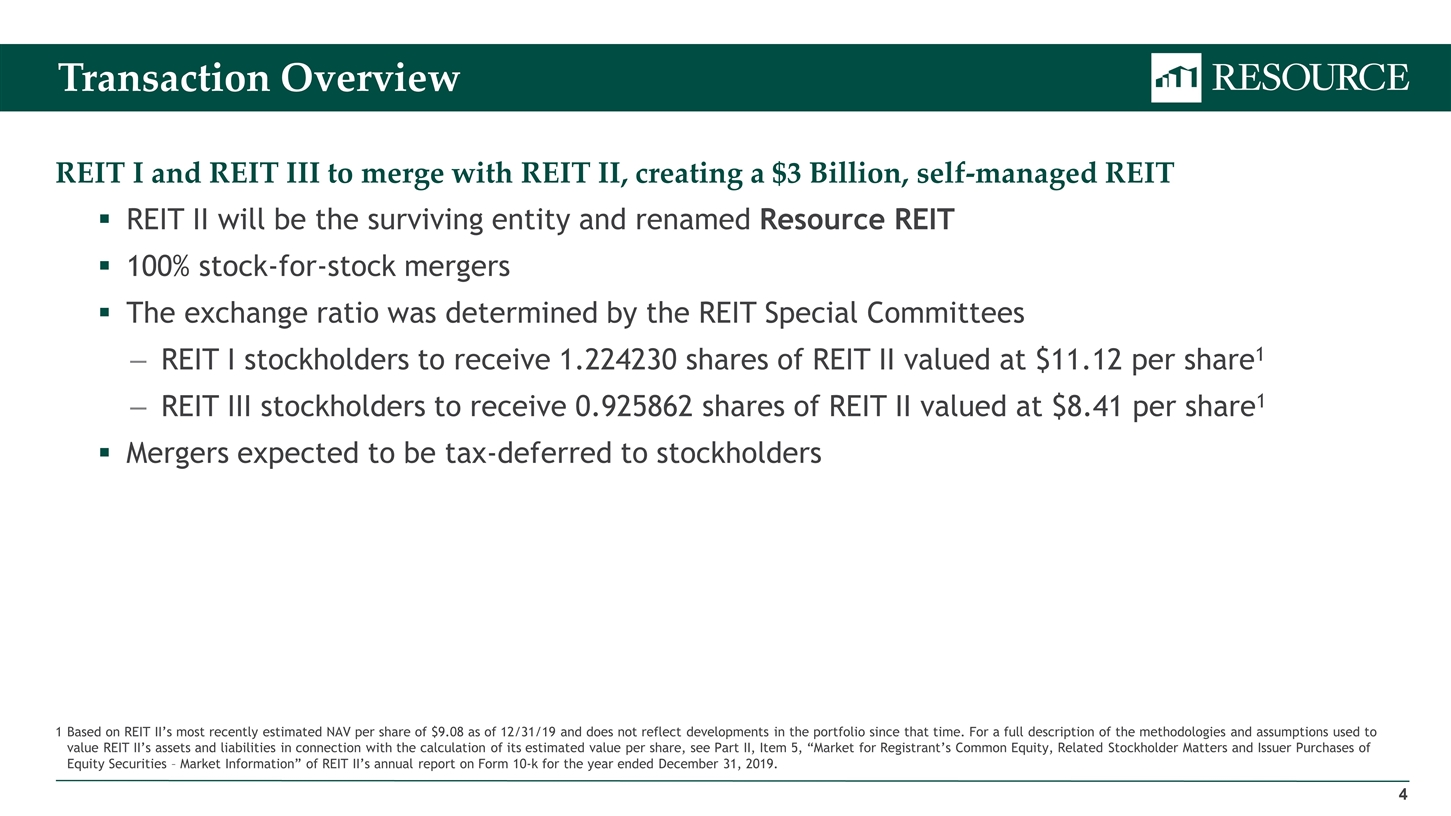
1Based on REIT II’s most recently estimated NAV per share of $9.08 as of 12/31/19 and does not reflect developments in the portfolio since that time. For a full description of the methodologies and assumptions used to value REIT II’s assets and liabilities in connection with the calculation of its estimated value per share, see Part II, Item 5, “Market for Registrant’s Common Equity, Related Stockholder Matters and Issuer Purchases of Equity Securities – Market Information” of REIT II’s annual report on Form 10-k for the year ended December 31, 2019. Transaction Overview REIT I and REIT III to merge with REIT II, creating a $3 Billion, self-managed REIT REIT II will be the surviving entity and renamed Resource REIT 100% stock-for-stock mergers The exchange ratio was determined by the REIT Special Committees REIT I stockholders to receive 1.224230 shares of REIT II valued at $11.12 per share1 REIT III stockholders to receive 0.925862 shares of REIT II valued at $8.41 per share1 Mergers expected to be tax-deferred to stockholders
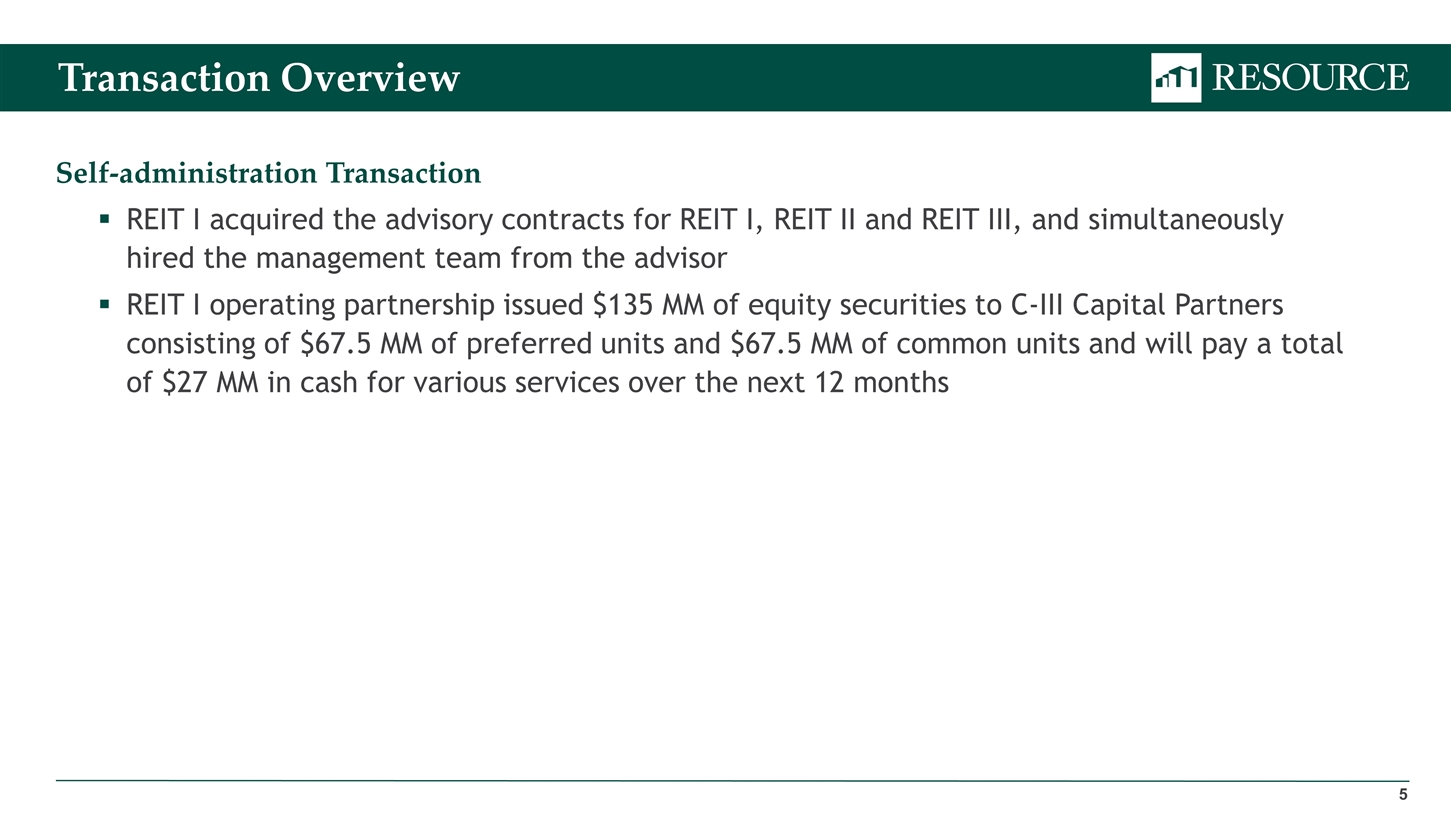
Transaction Overview Self-administration Transaction REIT I acquired the advisory contracts for REIT I, REIT II and REIT III, and simultaneously hired the management team from the advisor REIT I operating partnership issued $135 MM of equity securities to C-III Capital Partners consisting of $67.5 MM of preferred units and $67.5 MM of common units and will pay a total of $27 MM in cash for various services over the next 12 months
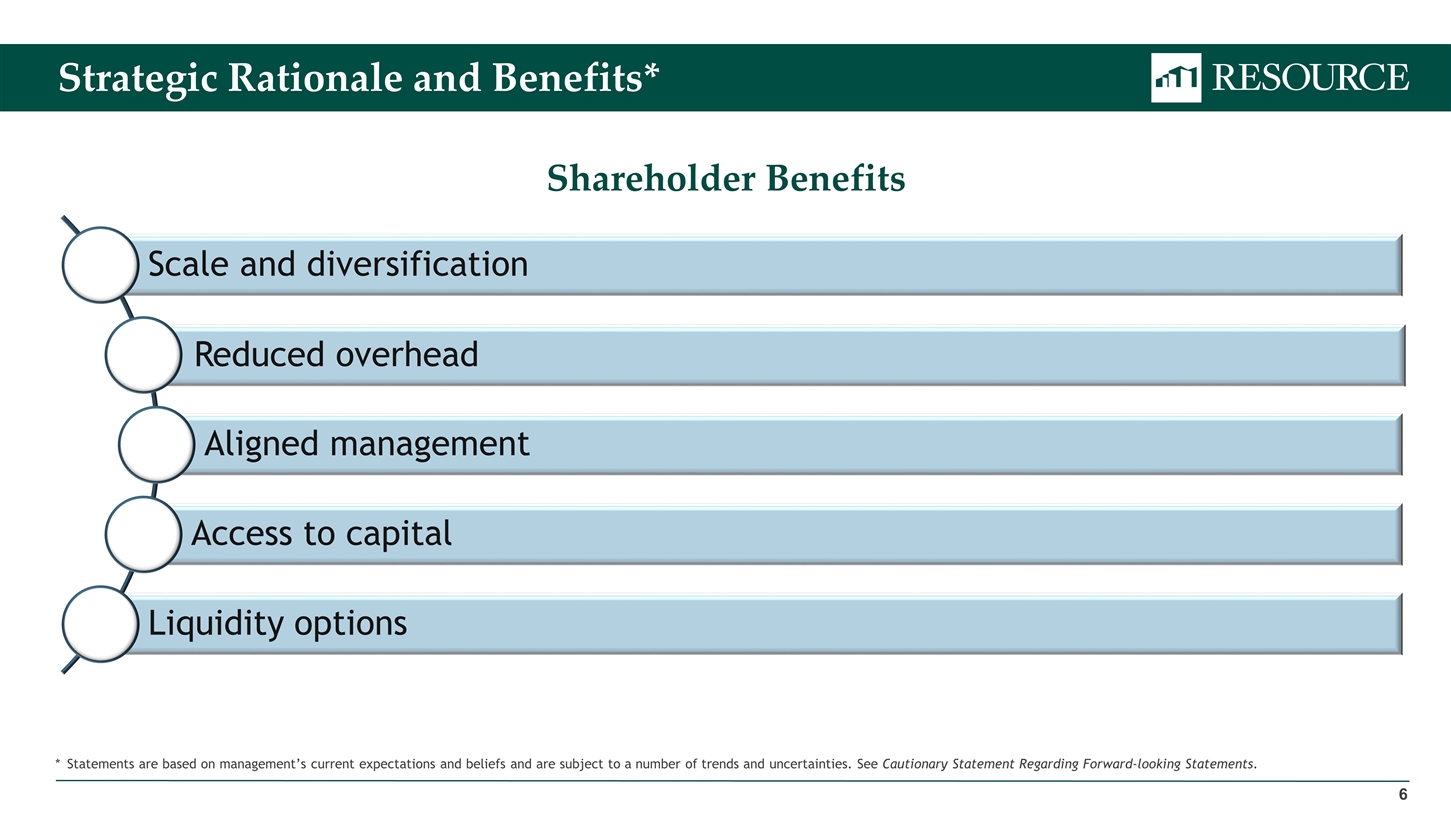
Strategic Rationale and Benefits* Shareholder Benefits *Statements are based on management’s current expectations and beliefs and are subject to a number of trends and uncertainties. See Cautionary Statement Regarding Forward-looking Statements. Scale and diversification Reduced overhead Aligned management Access to capital Liquidity options
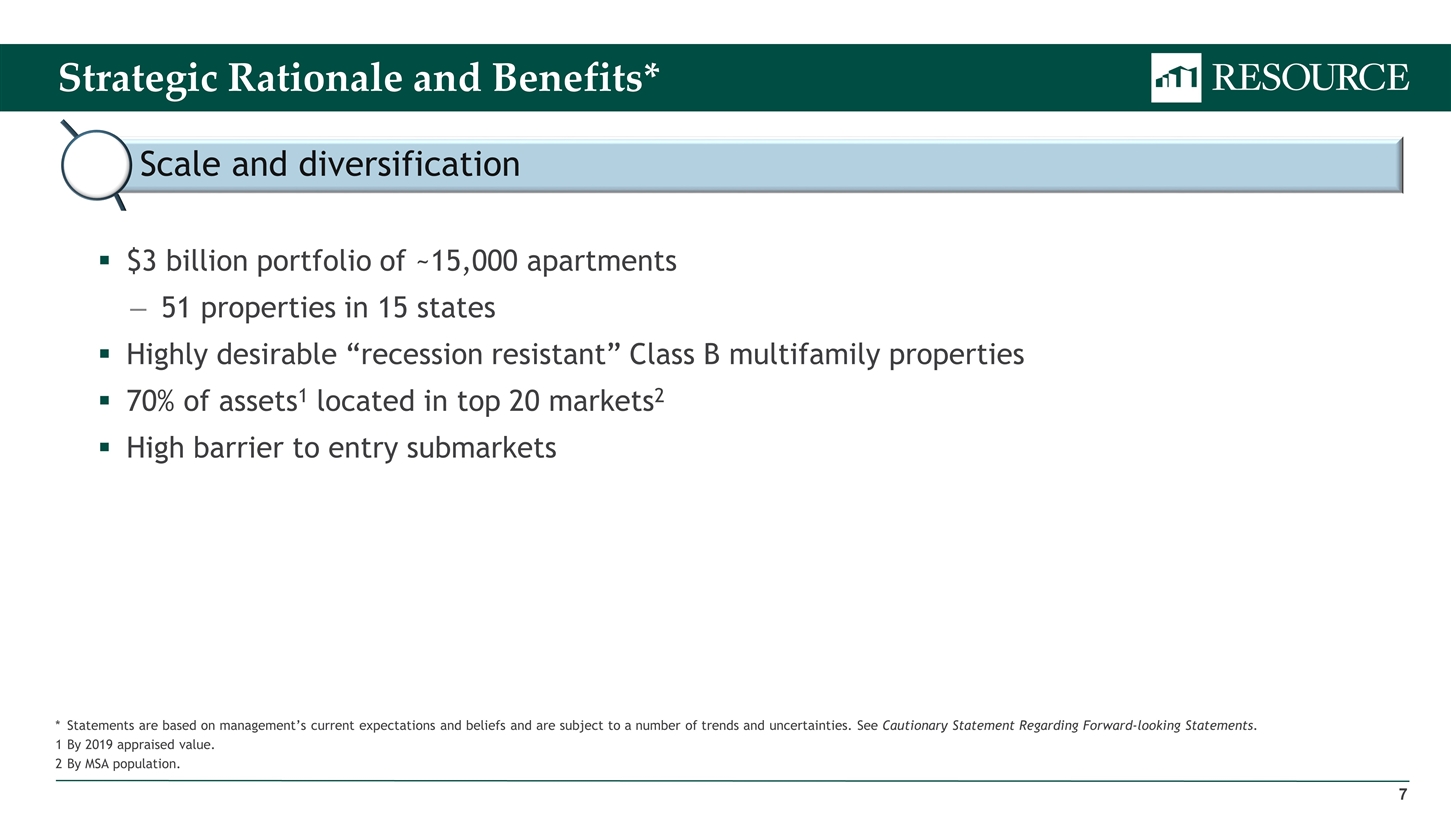
Strategic Rationale and Benefits* *Statements are based on management’s current expectations and beliefs and are subject to a number of trends and uncertainties. See Cautionary Statement Regarding Forward-looking Statements. 1By 2019 appraised value. 2By MSA population. $3 billion portfolio of ~15,000 apartments 51 properties in 15 states Highly desirable “recession resistant” Class B multifamily properties 70% of assets1 located in top 20 markets2 High barrier to entry submarkets Scale and diversification Improves efficiencies by reducing overhead costs Aligns management and shareholder interests Expands access to debt and equity capital Enhances liquidity options for shareholders
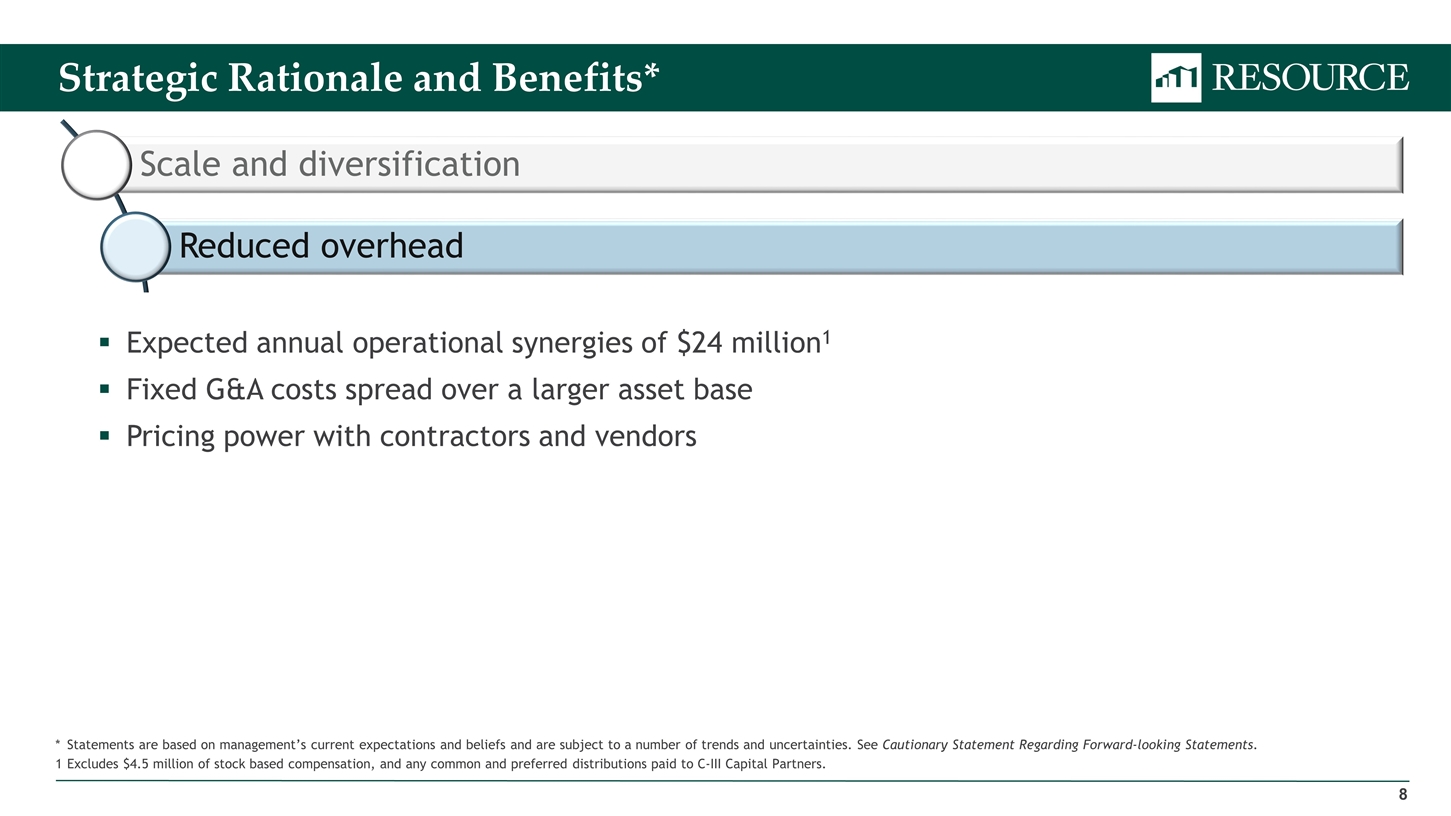
Strategic Rationale and Benefits* *Statements are based on management’s current expectations and beliefs and are subject to a number of trends and uncertainties. See Cautionary Statement Regarding Forward-looking Statements. 1Excludes $4.5 million of stock based compensation, and any common and preferred distributions paid to C-III Capital Partners. Expected annual operational synergies of $24 million1 Fixed G&A costs spread over a larger asset base Pricing power with contractors and vendors Scale and diversification Reduced overhead Aligns management and shareholder interests Expands access to debt and equity capital Enhances liquidity options for shareholders
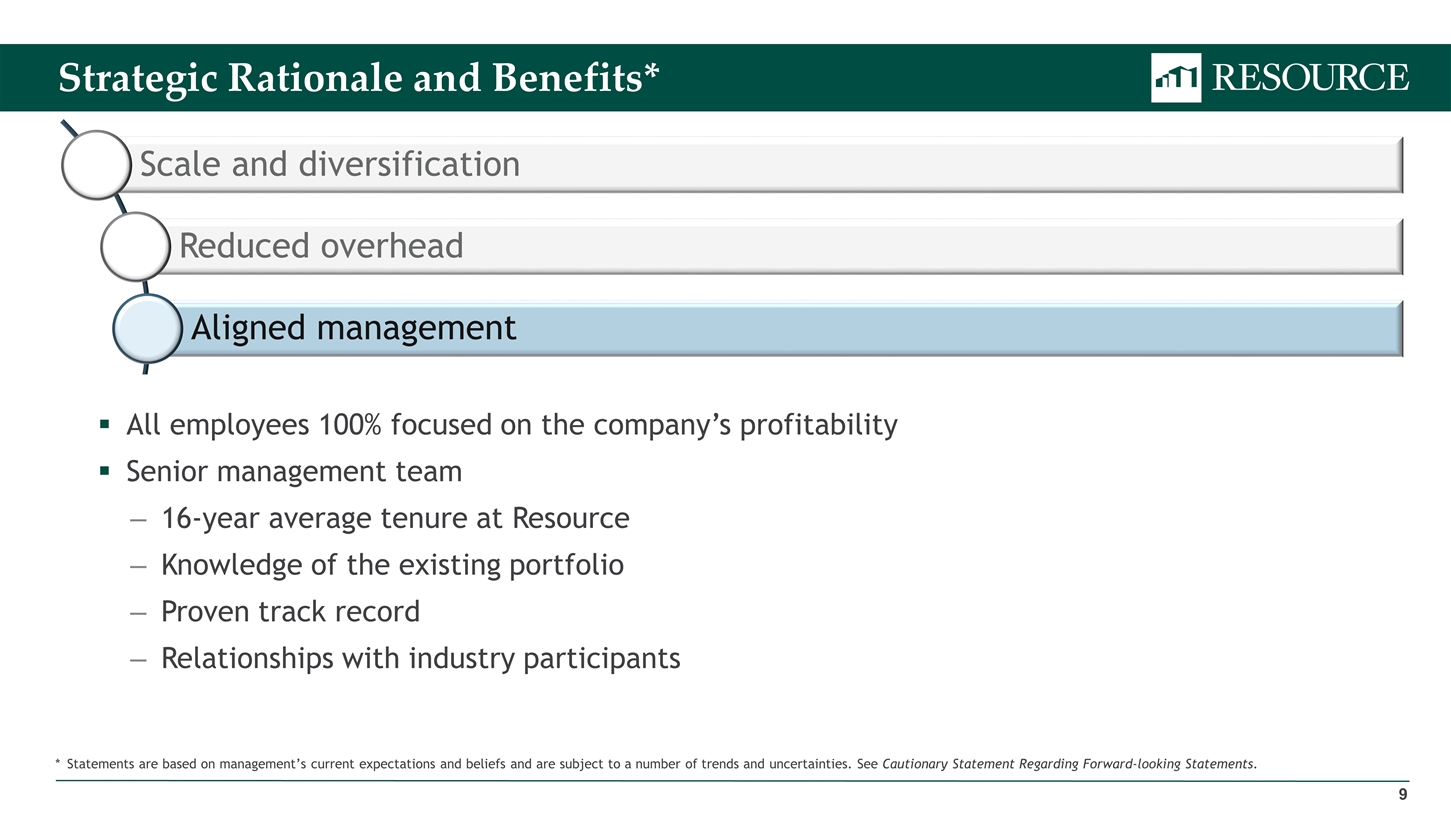
Strategic Rationale and Benefits* *Statements are based on management’s current expectations and beliefs and are subject to a number of trends and uncertainties. See Cautionary Statement Regarding Forward-looking Statements. All employees 100% focused on the company’s profitability Senior management team 16-year average tenure at Resource Knowledge of the existing portfolio Proven track record Relationships with industry participants Scale and diversification Reduced overhead Aligned management Expands access to debt and equity capital Enhances liquidity options for shareholders
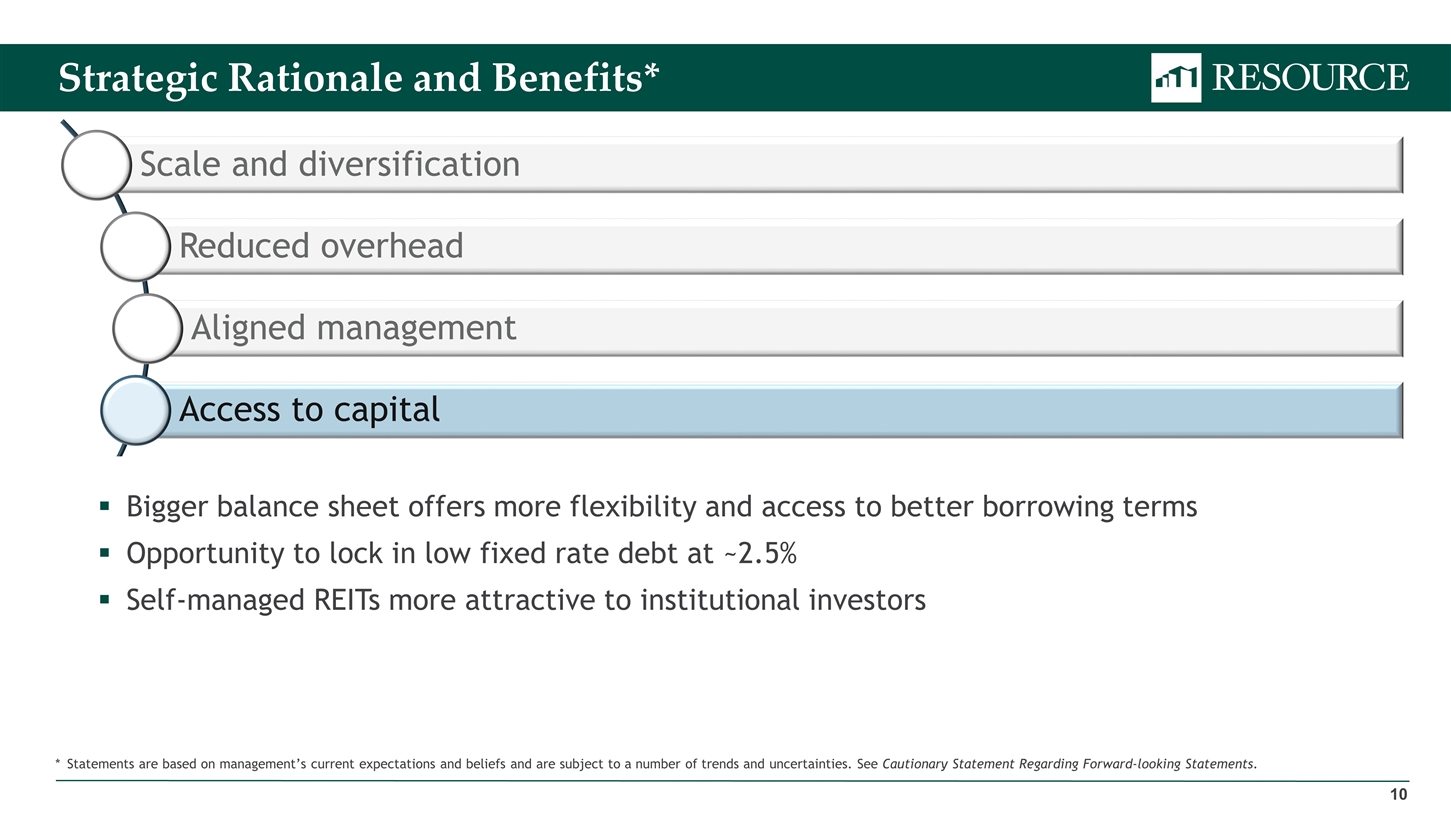
Strategic Rationale and Benefits* *Statements are based on management’s current expectations and beliefs and are subject to a number of trends and uncertainties. See Cautionary Statement Regarding Forward-looking Statements. Bigger balance sheet offers more flexibility and access to better borrowing terms Opportunity to lock in low fixed rate debt at ~2.5% Self-managed REITs more attractive to institutional investors Scale and diversification Reduced overhead Aligned management Access to capital Enhances liquidity options for shareholders
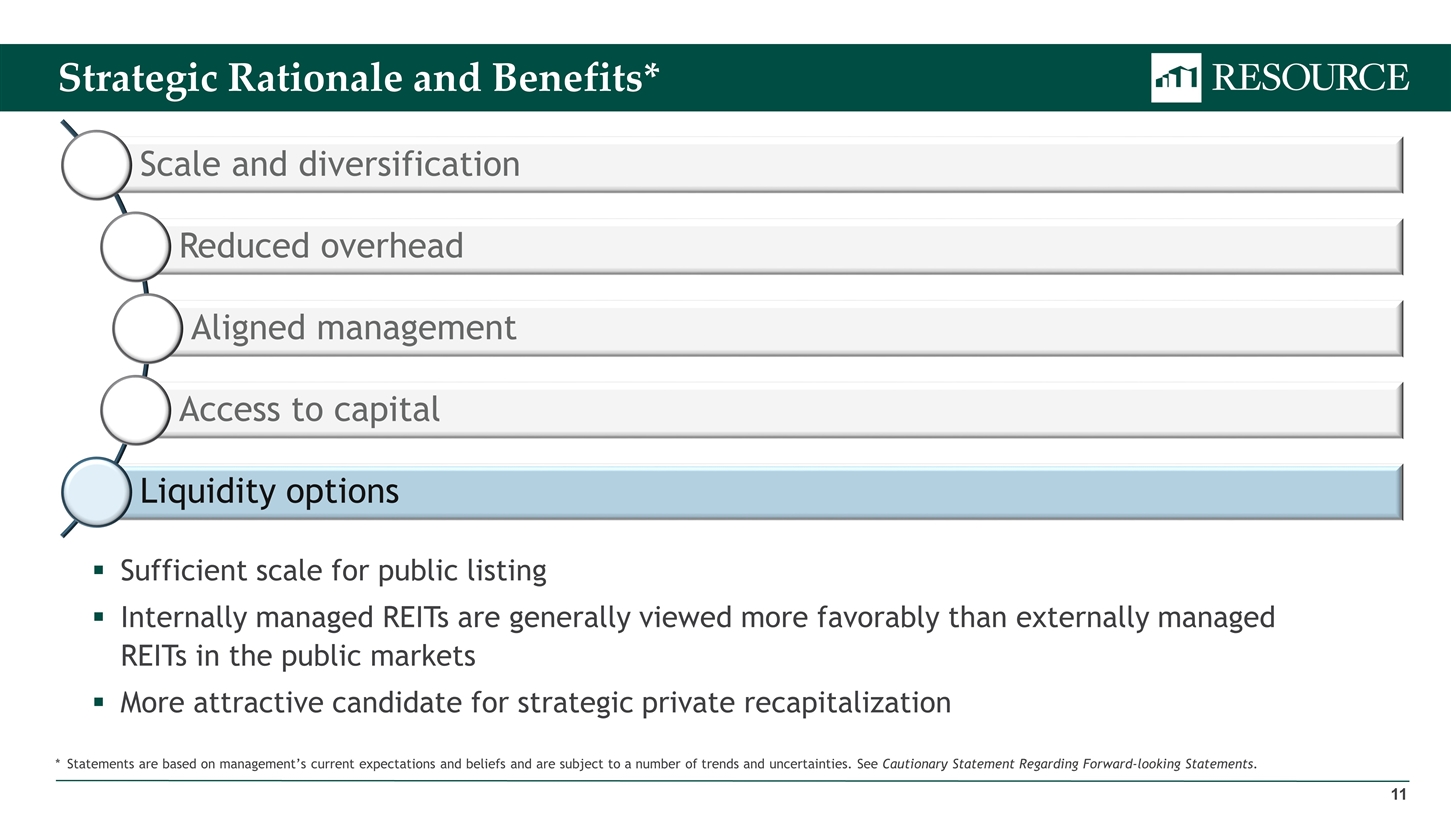
Strategic Rationale and Benefits* *Statements are based on management’s current expectations and beliefs and are subject to a number of trends and uncertainties. See Cautionary Statement Regarding Forward-looking Statements. Sufficient scale for public listing Internally managed REITs are generally viewed more favorably than externally managed REITs in the public markets More attractive candidate for strategic private recapitalization Scale and diversification Reduced overhead Aligned management Access to capital Liquidity options
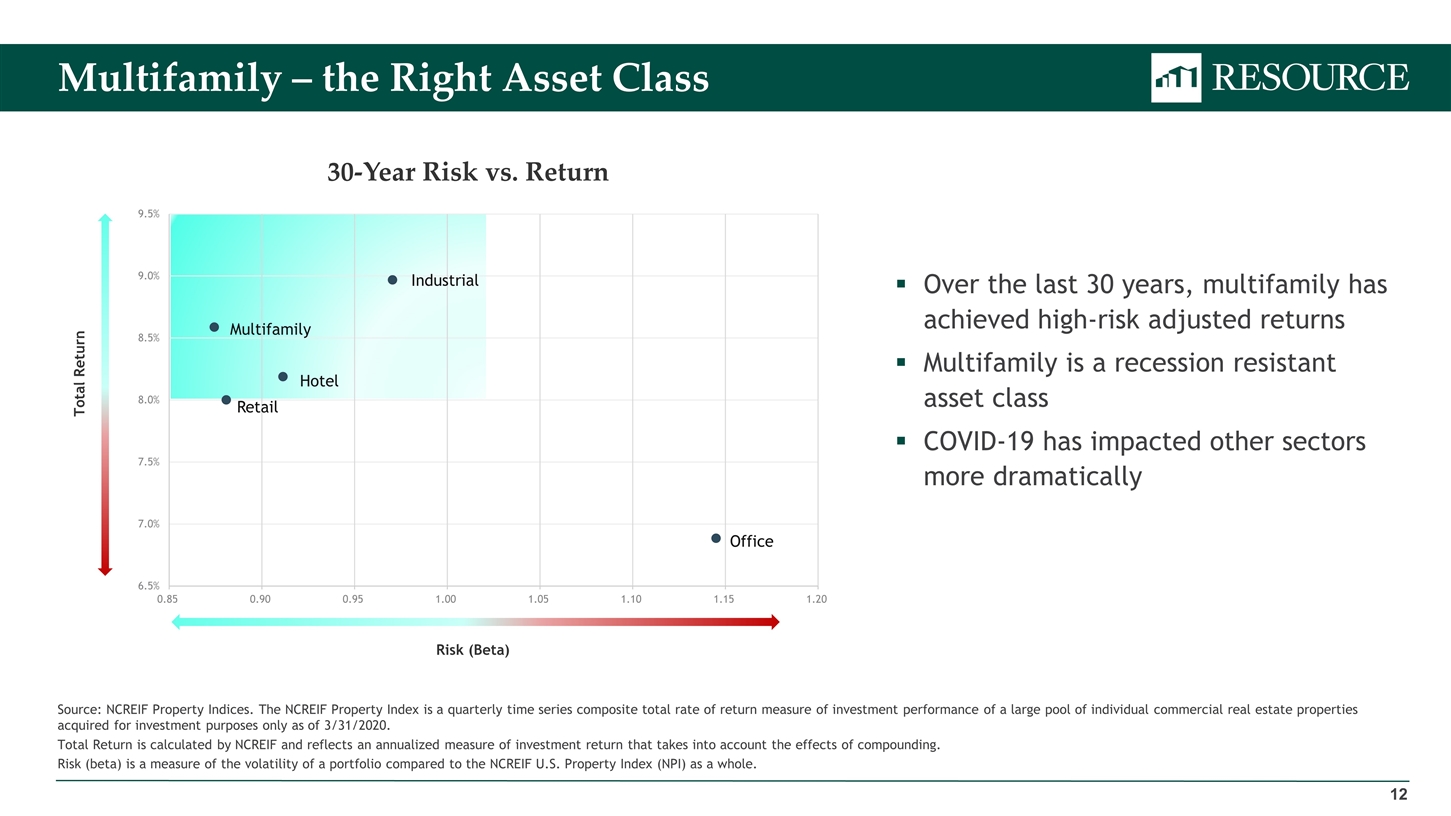
Multifamily – the Right Asset Class Over the last 30 years, multifamily has achieved high-risk adjusted returns Multifamily is a recession resistant asset class COVID-19 has impacted other sectors more dramatically Source: NCREIF Property Indices. The NCREIF Property Index is a quarterly time series composite total rate of return measure of investment performance of a large pool of individual commercial real estate properties acquired for investment purposes only as of 3/31/2020. Total Return is calculated by NCREIF and reflects an annualized measure of investment return that takes into account the effects of compounding. Risk (beta) is a measure of the volatility of a portfolio compared to the NCREIF U.S. Property Index (NPI) as a whole.
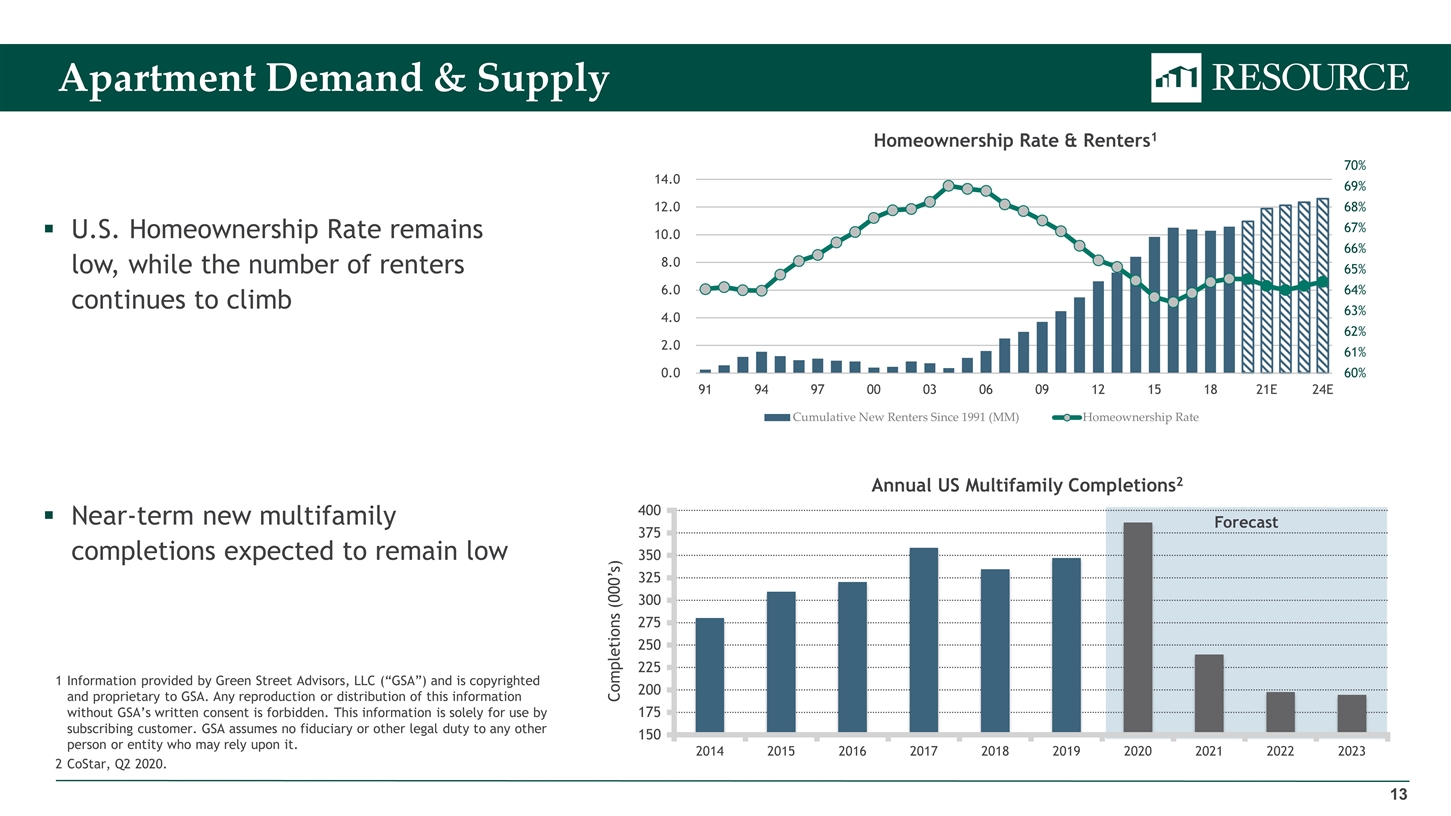
Apartment Demand & Supply 1Information provided by Green Street Advisors, LLC (“GSA”) and is copyrighted and proprietary to GSA. Any reproduction or distribution of this information without GSA’s written consent is forbidden. This information is solely for use by subscribing customer. GSA assumes no fiduciary or other legal duty to any other person or entity who may rely upon it. 2CoStar, Q2 2020. Annual US Multifamily Completions2 Forecast Homeownership Rate & Renters1 U.S. Homeownership Rate remains low, while the number of renters continues to climb Near-term new multifamily completions expected to remain low
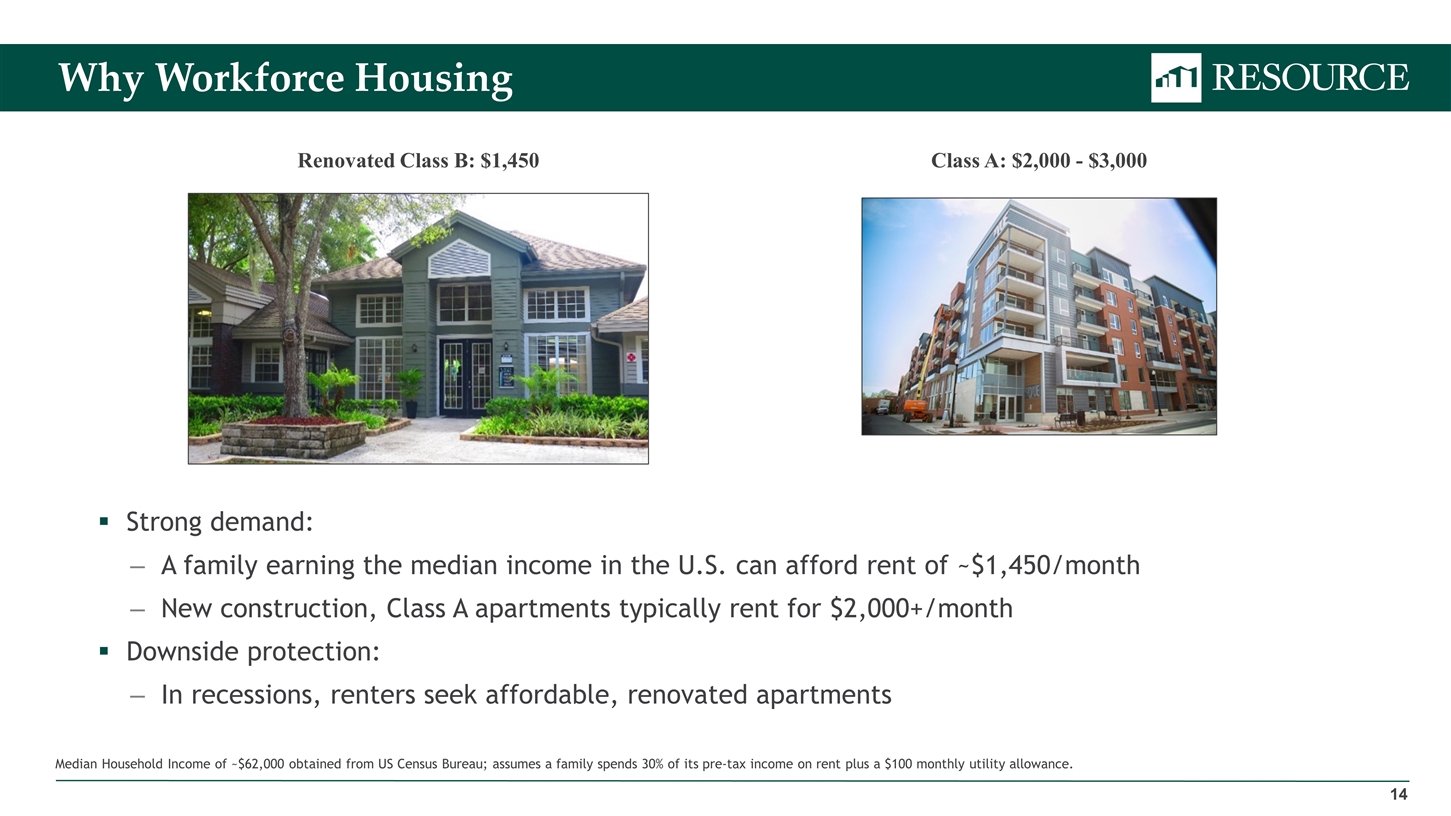
Why Workforce Housing Strong demand: A family earning the median income in the U.S. can afford rent of ~$1,450/month New construction, Class A apartments typically rent for $2,000+/month Downside protection: In recessions, renters seek affordable, renovated apartments Median Household Income of ~$62,000 obtained from US Census Bureau; assumes a family spends 30% of its pre-tax income on rent plus a $100 monthly utility allowance. Renovated Class B: $1,450 Class A: $2,000 - $3,000
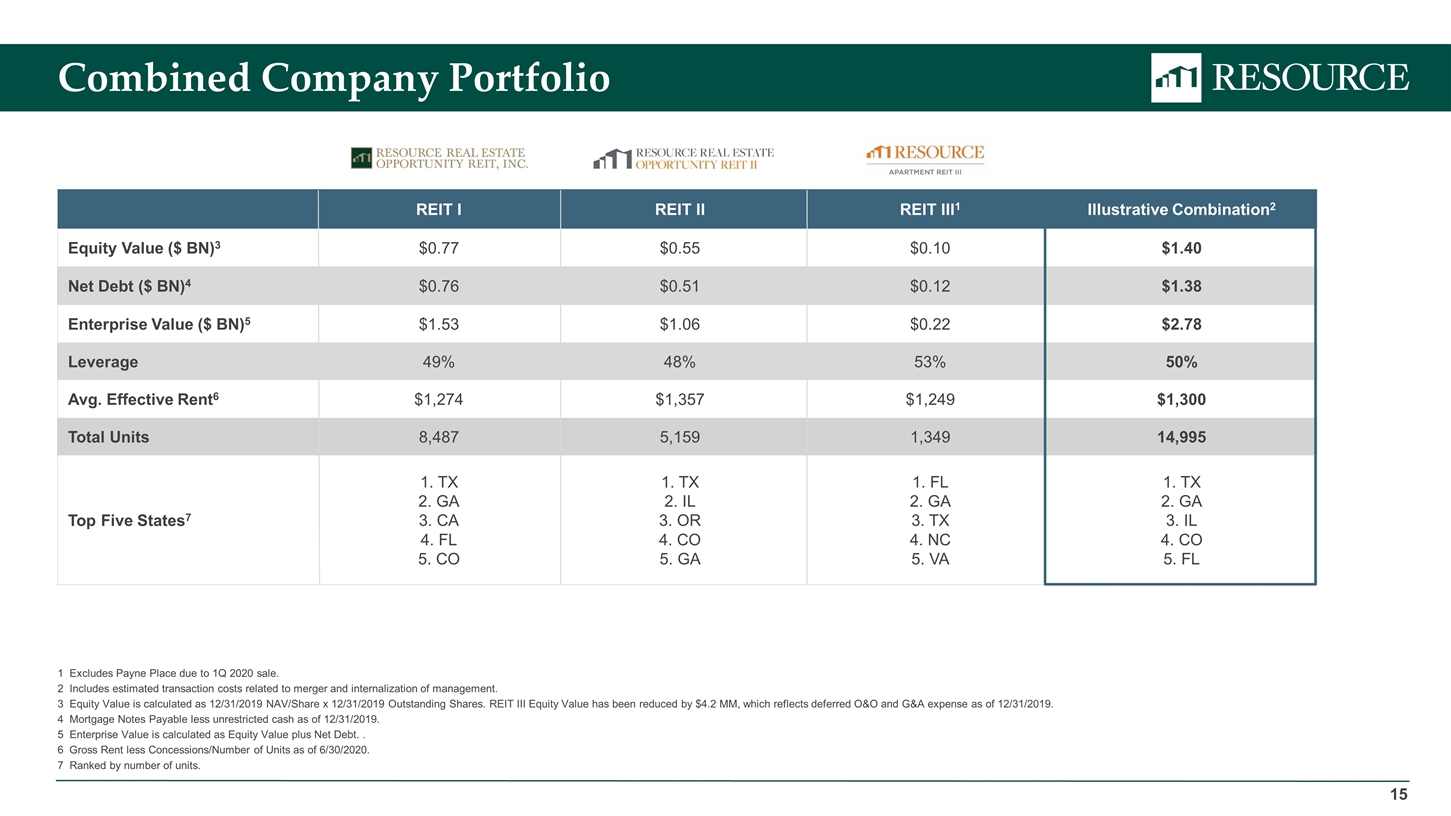
REIT I REIT II REIT III1 Illustrative Combination2 Equity Value ($ BN)3 $0.77 $0.55 $0.10 $1.40 Net Debt ($ BN)4 $0.76 $0.51 $0.12 $1.38 Enterprise Value ($ BN)5 $1.53 $1.06 $0.22 $2.78 Leverage 49% 48% 53% 50% Avg. Effective Rent6 $1,274 $1,357 $1,249 $1,300 Total Units 8,487 5,159 1,349 14,995 Top Five States7 TX GA CA FL CO TX IL OR CO GA FL GA TX NC VA TX GA IL CO FL Combined Company Portfolio 1 Excludes Payne Place due to 1Q 2020 sale. 2 Includes estimated transaction costs related to merger and internalization of management. 3 Equity Value is calculated as 12/31/2019 NAV/Share x 12/31/2019 Outstanding Shares. REIT III Equity Value has been reduced by $4.2 MM, which reflects deferred O&O and G&A expense as of 12/31/2019. 4 Mortgage Notes Payable less unrestricted cash as of 12/31/2019. 5 Enterprise Value is calculated as Equity Value plus Net Debt. . 6Gross Rent less Concessions/Number of Units as of 6/30/2020. 7 Ranked by number of units.
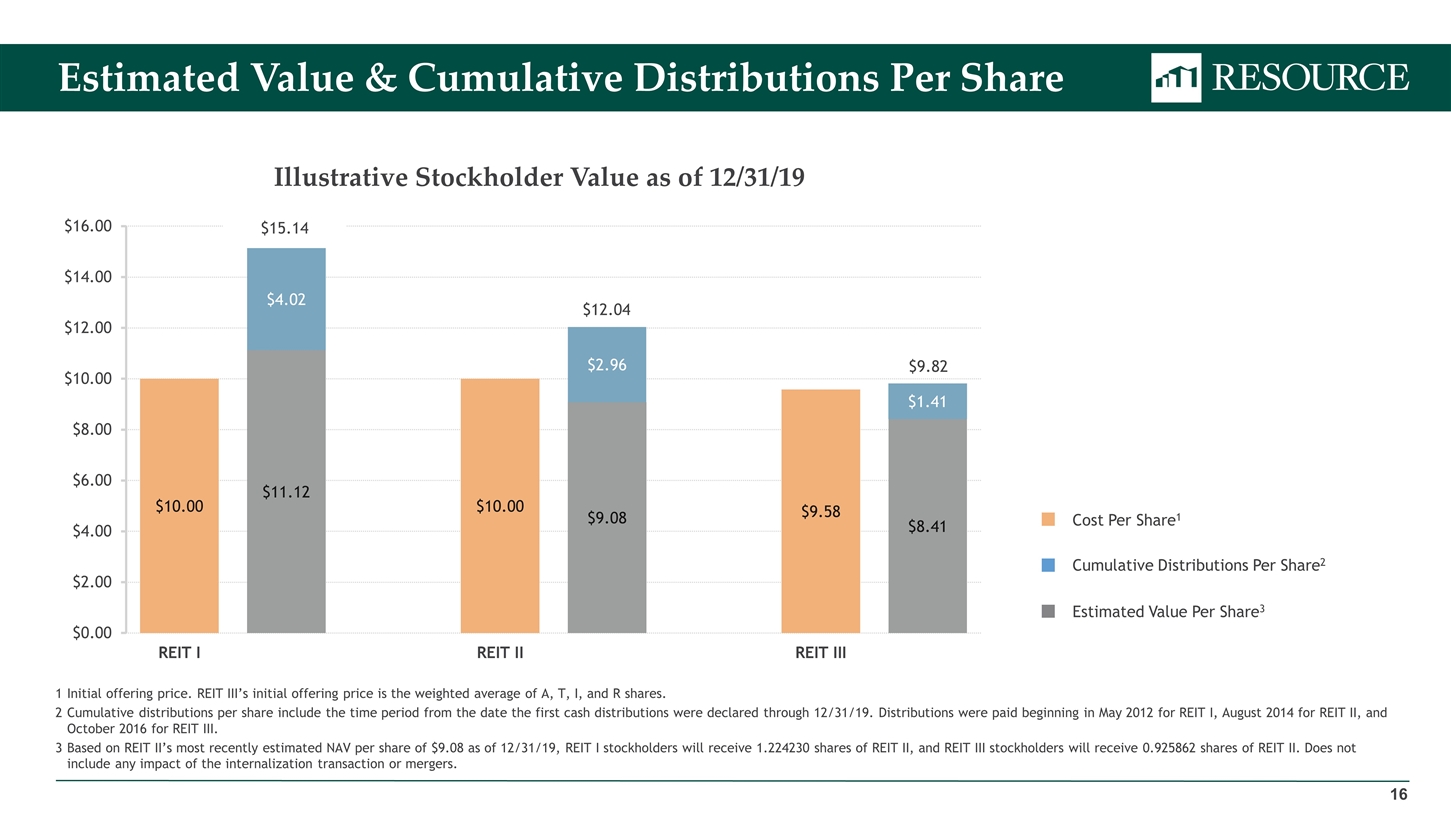
Estimated Value & Cumulative Distributions Per Share Illustrative Stockholder Value as of 12/31/19 1Initial offering price. REIT III’s initial offering price is the weighted average of A, T, I, and R shares. 2Cumulative distributions per share include the time period from the date the first cash distributions were declared through 12/31/19. Distributions were paid beginning in May 2012 for REIT I, August 2014 for REIT II, and October 2016 for REIT III. 3Based on REIT II’s most recently estimated NAV per share of $9.08 as of 12/31/19, REIT I stockholders will receive 1.224230 shares of REIT II, and REIT III stockholders will receive 0.925862 shares of REIT II. Does not include any impact of the internalization transaction or mergers. Estimated Value Per Share3 Cumulative Distributions Per Share2 Cost Per Share1 $15.14 $12.04 $9.82
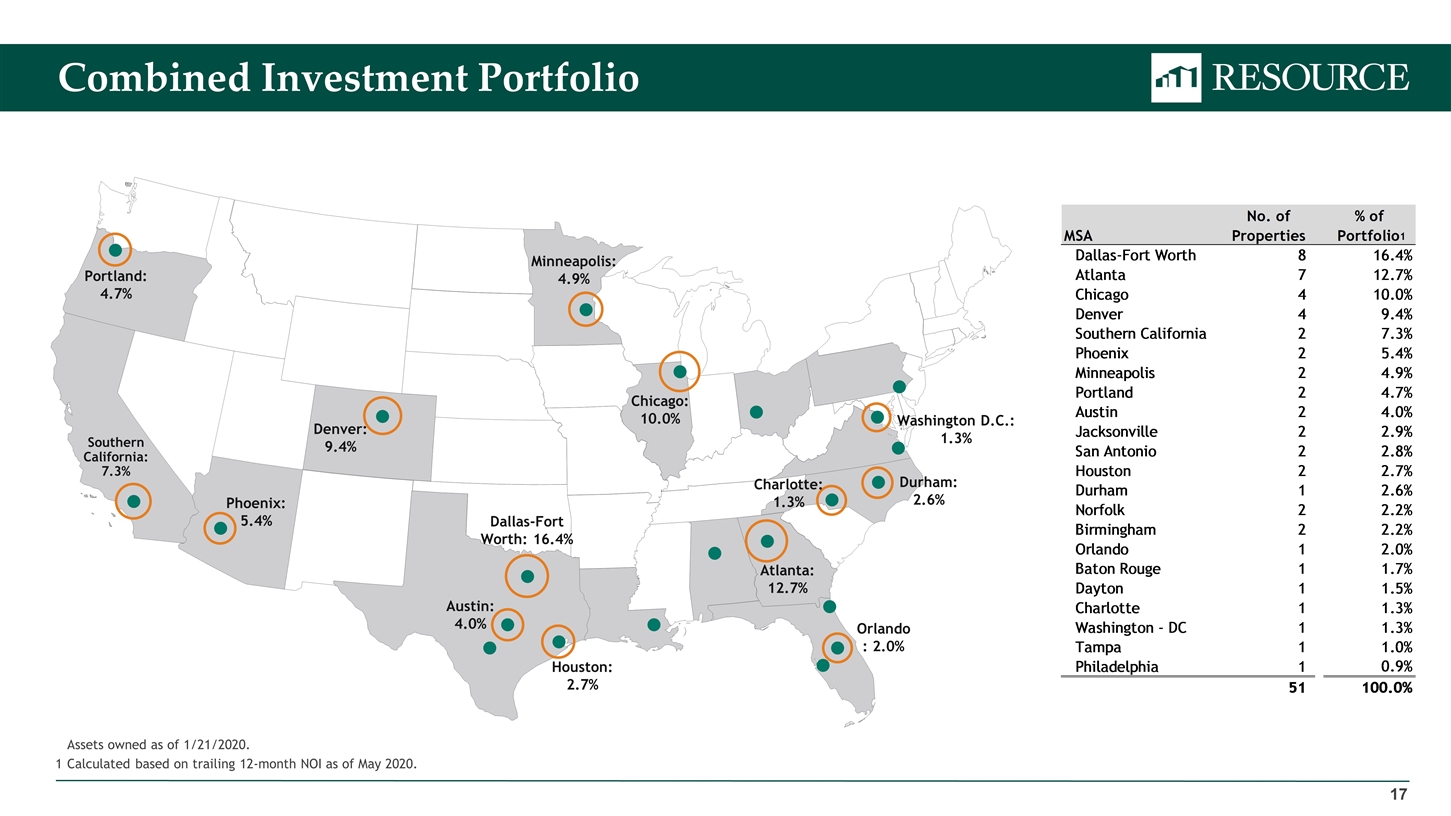
Combined Investment Portfolio Assets owned as of 1/21/2020. 1Calculated based on trailing 12-month NOI as of May 2020. Dallas-Fort Worth: 16.4% Houston: 2.7% Austin: 4.0% Denver: 9.4% Phoenix: 5.4% Southern California: 7.3% Portland: 4.7% Minneapolis: 4.9% Chicago: 10.0% Durham: 2.6% Washington D.C.: 1.3% Orlando: 2.0% Charlotte: 1.3% Atlanta: 12.7%

Management Resource Leadership Team Alan F. Feldman Chief Executive Officer Resource REIT Marshall P. Hayes Managing Director Resource Management, LLC Yvana L. Rizzo Senior Vice President Resource Management, LLC Tom Elliott Chief Financial Officer Resource REIT Shelle Weisbaum Chief Legal Officer Resource REIT Peggy L. Gold Executive Vice President Resource Management, LLC
Special Committee Process Each REIT formed a Special Committee of independent directors which retained its own advisors to assist in the transaction. Robert A. Stanger & Company acted as financial advisor to the REIT I Special Committee and Morris, Manning & Martin, LLP acted as legal advisor to the REIT I Special Committee Houlihan Lokey acted as financial advisor to the REIT II Special Committee and Morrison & Forester LLP and DLA Piper acted as legal advisors to the REIT II Special Committee TRUIST Securities acted as financial advisor to the REIT III Special Committee and Miles & Stockbridge P. C. acted as legal advisor to the REIT III Special Committee The REIT I, REIT II and REIT III Special Committees each approved the Mergers after considering many strategic options over 11 months. Fairness opinions for the transaction were delivered by the financial advisors of each Committee. The Boards of Directors of REITs I, II and III have unanimously determined that the transaction is in the best interests of their shareholders.

