Attached files
| file | filename |
|---|---|
| 8-K - RELIANT BANCORP, INC. 8-K - Reliant Bancorp, Inc. | a52282957.htm |
Exhibit 99.1

Raymond James U.S. Bank Conference September 9-10, 2020

Safe Harbor Statements Forward-Looking StatementsAll statements, other than statements of historical
fact, included in this presentation and any oral statements made regarding the subject of this presentation, that address activities, events or developments that Reliant Bancorp, Inc. (“Reliant” or the “Company”) expects, believes or
anticipates will or may occur in the future are “forward-looking statements” within the meaning of Section 27A of the Securities Act of 1933, as amended, and Section 21E of the Securities Exchange Act of 1934, as amended, and are made
pursuant to the safe harbor provisions of the Private Securities Litigation Reform Act of 1995, including statements relating to the Transactions (as defined below) being accretive to Reliant’s earnings in 2021, Reliant’s response to the
coronavirus (COVID-19) pandemic, and the Company’s 2020 strategies. The words “believe,” “anticipate,” “expect,” “may,” “will,” “assume,” “should,” “predict,” “could,” “would,” “intend,” “targets,” “estimates,” “projects,” “plans,” and
“potential,” and other similar words and expressions of the future, are intended to identify such forward-looking statements, but other statements not based on historical information may also be considered forward-looking, including
statements about the Company’s future financial and operating results and the Company’s plans, objectives, and intentions. All forward-looking statements are subject to risks, uncertainties, and other factors that may cause the actual
results, performance, or achievements of the Company to differ materially from any results, performance, or achievements expressed or implied by such forward-looking statements. Such risks, uncertainties, and other factors include, among
others: (1) the global health and economic crisis precipitated by the coronavirus (COVID-19) pandemic, (2) actions taken by governments, businesses and individuals in response to the coronavirus (COVID-19) pandemic, (3) the pace of recovery
when the coronavirus (COVID-19) pandemic subsides, (4) the possibility that our asset quality could decline or that we experience greater loan losses than anticipated, (5) increased levels of other real estate, primarily as a result of
foreclosures, (6) the impact of liquidity needs on our results of operations and financial condition, (7) competition from financial institutions and other financial service providers, (8) the effect of interest rate increases on the cost of
deposits, (9) unanticipated weakness in loan demand or loan pricing, (10) lack of strategic growth opportunities or our failure to execute on available opportunities, (11) deterioration in the financial condition of borrowers resulting in
significant increases in loan losses and provisions for those losses, (12) economic crises and associated credit issues in industries most impacted by the coronavirus (COVID-19) pandemic, including the restaurant, hospitality and retail
sectors, (13) the ability to grow and retain low-cost core deposits and retain large, uninsured deposits, (14) our ability to effectively manage problem credits, (15) our ability to successfully implement efficiency initiatives on time and
with the results projected, (16) our ability to successfully develop and market new products and technology, (17) the impact of negative developments in the financial industry and United States and global capital and credit markets, (18) our
ability to retain the services of key personnel, (19) our ability to adapt to technological changes, (20) risks associated with litigation, including the applicability of insurance coverage, (21) the vulnerability of Reliant Bank’s (the
“Bank”) network and online banking portals, and the systems of parties with whom the Company and the Bank contract, to unauthorized access, computer viruses, phishing schemes, spam attacks, human error, natural disasters, power loss, and
other security breaches, (22) changes in state and federal laws, rules, regulations, or policies applicable to banks or bank or financial holding companies, including regulatory or legislative developments, (23) adverse results (including
costs, fines, reputational harm, and/or other negative effects) from current or future litigation, regulatory examinations, or other legal and/or regulatory actions, (24) the risk that expected cost savings and revenue synergies from (a) the
merger of the Company and Tennessee Community Bank Holdings, Inc. (“TCB Holdings”) (the “TCB Holdings Transaction”) or (b) the merger of the Company and First Advantage Bancorp (“FABK”) (the “FABK Transaction” and, together with the TCB
Holdings Transaction, collectively, the “Transactions”), may not be realized or may take longer than anticipated to be realized, (25) the effect of the completion of the Transactions on our customer, supplier, or employee relationships and
operating results (including without limitation difficulties in maintaining relationships with employees and customers), as well as on the market price of the Company’s common stock, (26) the risk that the businesses and operations of TCB
Holdings and its subsidiaries and of FABK and its subsidiaries cannot be successfully integrated with the business and operations of the Company and its subsidiaries or that integration will be more costly or difficult than expected, (27) the
amount of costs, fees, expenses, and charges related to the Transactions, including those arising as a result of unexpected factors or events, (28) reputational risk associated with and the reaction of our customers, suppliers, employees, or
other business partners to the Transactions, (29) the risk associated with Company management’s attention being diverted away from the day-to-day business and operations of the Company to the integration of the Transactions, and (30) general
competitive, economic, political, and market conditions, including economic conditions in the local markets where we operate. Additional factors which could affect the forward-looking statements can be found in the Company’s annual report on
Form 10-K, quarterly reports on Form 10-Q, and current reports on Form 8-K filed with the Securities and Exchange Commission (the “SEC”) and available on the SEC’s website at http://www.sec.gov. The Company believes the forward-looking
statements contained herein are reasonable; however, many of such risks, uncertainties, and other factors are beyond the Company’s ability to control or predict and undue reliance should not be placed on any forward-looking statements, which
are based on current expectations and speak only as of the date that they are made. Therefore, the Company can give no assurance that its future results will be as estimated. The Company does not intend to, and disclaims any obligation to,
update or revise any forward-looking statement. Non-GAAP Financial MeasuresThis presentation contains certain financial measures that are not measures recognized under U.S. generally accepted accounting principles (“GAAP”) and, therefore,
are considered non-GAAP financial measures. Members of the Company’s management use these non-GAAP financial measures in their analysis of the Company’s performance, financial condition, and efficiency of operations. Management of the Company
believes that these non-GAAP financial measures provide a greater understanding of ongoing operations, enhance comparability of results with prior periods, and demonstrate the effects of significant gains and charges in the current period.
Management of the Company also believes that investors find these non-GAAP financial measures useful as they assist investors in understanding underlying operating performance and the analysis of ongoing operating trends. However, the
non-GAAP financial measures discussed herein should not be considered in isolation or as a substitute for the most directly comparable or other financial measures calculated in accordance with GAAP. Moreover, the manner in which the non-GAAP
financial measures discussed herein are calculated may differ from that of other companies reporting measures with similar names. You should understand how such other banking organizations calculate their financial measures similar to, or
with names similar to, the non-GAAP financial measures we have discussed herein when comparing such non-GAAP financial measures.The non-GAAP financial measures contained in this presentation include, without limitation, adjusted net income
attributable to common shareholders, adjusted return on average assets (adjusted ROAA), adjusted return on average equity (adjusted ROAE), adjusted return on average tangible common equity (adjusted ROATCE), ROATCE, adjusted quarterly
earnings per share, adjusted net interest rate spread, adjusted net interest margin, tangible assets, tangible common equity, tangible book value per share (TBVPS), tangible common equity to tangible assets (TCE/TA), adjusted non-interest
expense, core bank efficiency ratio, core bank pre-tax, pre-provision income, and allowance for loan losses plus unamortized loan accretion to total loans. 1

Why Reliant? High Growth, Desirable MarketsFocused, Balanced Business ModelOpportunistic
AcquisitionsOrganic, In-Market Loan & Deposit Growth Balanced, Sustainable GrowthDisciplined Approach to PricingMargin OptimizationFocus on Expense Management Strong Corporate GovernanceExperienced, Consistent LeadershipStable, Diverse
WorkforceClient Focused Service Scalability of ModelDisciplined Credit CultureConservative Loan Reserves and Purchase DiscountsWell Capitalized Strategic Focus Company Culture Profitability and Growth Financial Strength 2

Experienced, Committed Leadership Team 3 Source: S&P Global Market Intelligence DeVan Ard, Jr.
Chairman and CEO Former Area Executive in Middle Tennessee at AmSouth Bank Founder of Reliant Bank in 2006 39 years of banking experience / 15 years at RBNC / 21 years in Middle TN Jerry CookseyEVP, Chief Financial
Officer 30 years of banking experience / 8 years at FABK/RNBC / 8 years in Middle TN Alan MimsEVP, Chief Credit Officer Bill FitzgeraldEVP, Chief Risk Officer Kim YorkEVP, Chief Strategy Officer John R.
WilsonPresident Executive Vice President – Chief Credit Officer since December 2017Former Senior Examiner and Case Manager for the Federal Reserve Bank of Atlanta 30 years of banking experience / 3 years at RBNC / 3 years in Middle
TN Former Banking Group Audit Partner for Carr, Riggs & Ingram, LLCHolds CPA, CRMA & CFSA Professional Designations 35 Years of accounting and risk experience / 35 Years in Middle TN 31 years of banking experience / 15
years at RBNC / 30 years in Middle TN Executive Vice President – Chief Strategy Officer since March 2017Former Senior Vice President and Chief Marketing Officer at Ascend Federal Credit Union 24 years of banking experience / 3 years
at RBNC / 24 years in Middle TN Former Chief Lending Officer of Reliant BankFormer Spring Hill Market President for Cumberland Bank Mark RymanEVP, Chief Lending Officer Former CFO of First Advantage Bancorp and First
Advantage BankTransitioned to Reliant Bank as Chief Administrative Officer prior to assuming CFO role. 34 years of banking experience / 15 years at RNBC / 34 years in Middle TN Former Davidson & Williamson Counties Market President of
Reliant BankHeld various roles with First American Bank, Bank of Nashville & Premier Bank of Brentwood
Pandemic - Our Response to COVID-19 EmployeesEnsuring Health and Safety of our Team
Members CommunitiesHelping the Communities we Serve PromiseMeet needs through actions tailored after the bank’s core values MissionMaintain Banking ServicesPreserve Capital Control Expenses CommunitiesHelping the Communities
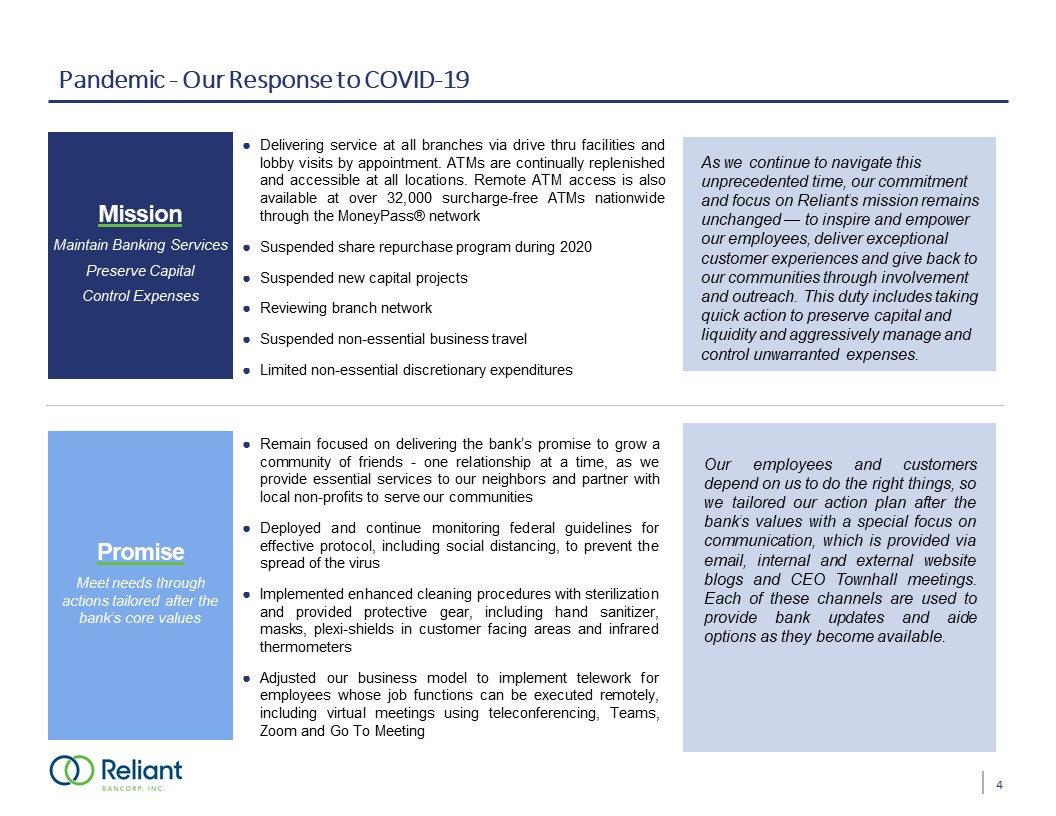
we Serve CommunitiesHelping the Communities we Serve Remain focused on delivering the bank’s promise to grow a community of friends - one relationship at a time, as we provide essential services to our neighbors and partner with
local non-profits to serve our communitiesDeployed and continue monitoring federal guidelines for effective protocol, including social distancing, to prevent the spread of the virusImplemented enhanced cleaning procedures with sterilization
and provided protective gear, including hand sanitizer, masks, plexi-shields in customer facing areas and infrared thermometersAdjusted our business model to implement telework for employees whose job functions can be executed remotely,
including virtual meetings using teleconferencing, Teams, Zoom and Go To Meeting Delivering service at all branches via drive thru facilities and lobby visits by appointment. ATMs are continually replenished and accessible at all locations.
Remote ATM access is also available at over 32,000 surcharge-free ATMs nationwide through the MoneyPass® networkSuspended share repurchase program during 2020Suspended new capital projectsReviewing branch networkSuspended non-essential
business travelLimited non-essential discretionary expenditures As we continue to navigate this unprecedented time, our commitment and focus on Reliant’s mission remains unchanged — to inspire and empower our employees, deliver exceptional
customer experiences and give back to our communities through involvement and outreach. This duty includes taking quick action to preserve capital and liquidity and aggressively manage and control unwarranted expenses. Our employees and
customers depend on us to do the right things, so we tailored our action plan after the bank’s values with a special focus on communication, which is provided via email, internal and external website blogs and CEO Townhall meetings. Each of
these channels are used to provide bank updates and aide options as they become available. 4
Pandemic - Our Response to COVID-19 (Cont’d) EmployeesEnsuring Health and Safety of our Team
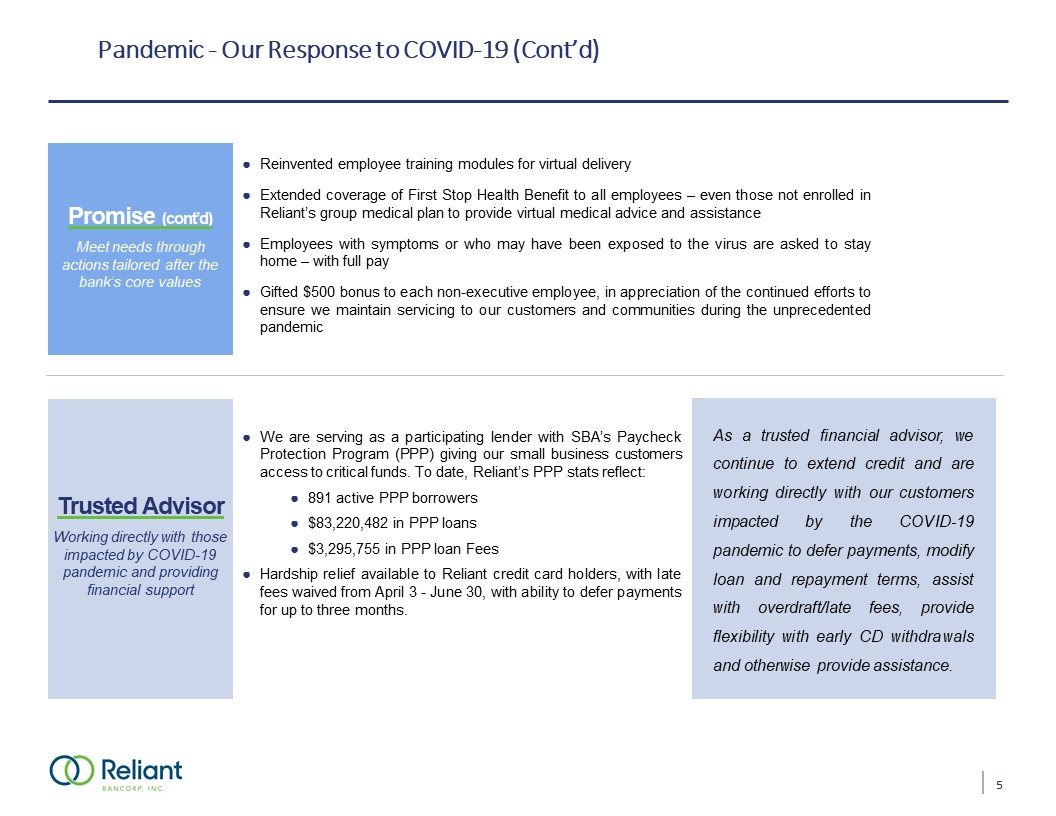
Members CommunitiesHelping the Communities we Serve CommunitiesHelping the Communities we Serve CommunitiesHelping the Communities we Serve Reinvented employee training modules for virtual deliveryExtended coverage of
First Stop Health Benefit to all employees – even those not enrolled in Reliant’s group medical plan to provide virtual medical advice and assistanceEmployees with symptoms or who may have been exposed to the virus are asked to stay home –
with full payGifted $500 bonus to each non-executive employee, in appreciation of the continued efforts to ensure we maintain servicing to our customers and communities during the unprecedented pandemic As a trusted financial advisor, we
continue to extend credit and are working directly with our customers impacted by the COVID-19 pandemic to defer payments, modify loan and repayment terms, assist with overdraft/late fees, provide flexibility with early CD withdrawals and
otherwise provide assistance. Promise (cont’d)Meet needs through actions tailored after the bank’s core values We are serving as a participating lender with SBA’s Paycheck Protection Program (PPP) giving our small business customers access
to critical funds. To date, Reliant’s PPP stats reflect: 891 active PPP borrowers$83,220,482 in PPP loans$3,295,755 in PPP loan FeesHardship relief available to Reliant credit card holders, with late fees waived from April 3 - June 30, with
ability to defer payments for up to three months. Trusted AdvisorWorking directly with those impacted by COVID-19 pandemic and providing financial support 24/7 Mobile App Online Banking/Bill Pay 24/7 ATMs Tap-To Pay 24/7 Telephone
Banking Debit & Credit Cards 5
Pandemic - Our Response to COVID-19 (Cont’d) EmployeesEnsuring Health and Safety of our Team
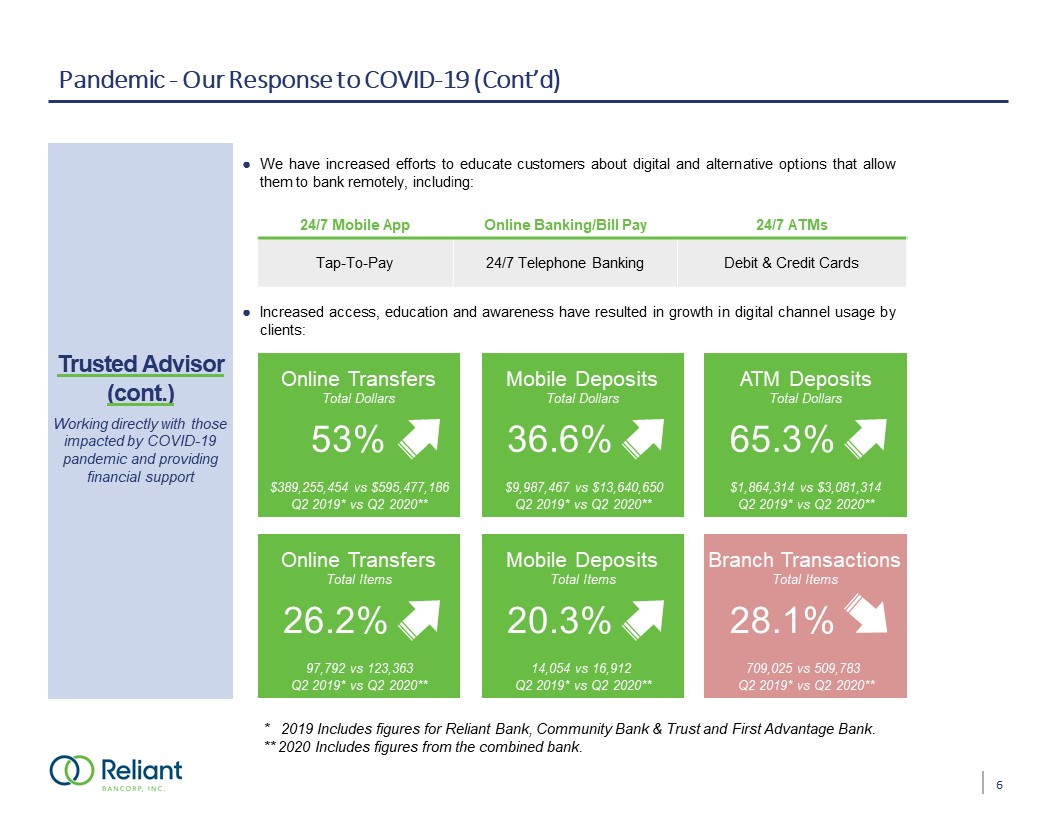
Members CommunitiesHelping the Communities we Serve CommunitiesHelping the Communities we Serve CommunitiesHelping the Communities we Serve We have increased efforts to educate customers about digital and alternative
options that allow them to bank remotely, including: Trusted Advisor (cont.)Working directly with those impacted by COVID-19 pandemic and providing financial support 24/7 Mobile App Online Banking/Bill Pay 24/7 ATMs Tap-To-Pay 24/7
Telephone Banking Debit & Credit Cards Increased access, education and awareness have resulted in growth in digital channel usage by clients: Mobile Deposits 36.6% Q2 2019* vs Q2 2020** Total Dollars $9,987,467 vs
$13,640,650 Online Transfers 53% Q2 2019* vs Q2 2020** Total Dollars $389,255,454 vs $595,477,186 ATM Deposits 65.3% Q2 2019* vs Q2 2020** Total Dollars $1,864,314 vs $3,081,314 Online Transfers 26.2% Q2 2019* vs Q2
2020** Total Items 97,792 vs 123,363 Mobile Deposits 20.3% Q2 2019* vs Q2 2020** Total Items 14,054 vs 16,912 Branch Transactions 28.1% Q2 2019* vs Q2 2020** Total Items 709,025 vs 509,783 * 2019 Includes figures for
Reliant Bank, Community Bank & Trust and First Advantage Bank.** 2020 Includes figures from the combined bank. 6

Reliant Bank Franchise Overview Commercially-oriented bank headquartered in Brentwood, Tennessee
Focused on fast-growing Middle Tennessee markets coupled with recent de novo expansion into Murfreesboro and Chattanooga, Tennessee, and the acquisitions of Tennessee Community Bank Holdings, Inc and First Advantage Bancorp(1)2nd largest
community bank(2) by deposits headquartered in the Nashville MSA and 10th largest bank by deposits in TennesseeConcentrated on building in-market banking relationships; 80% of top 50 loan relationships have related deposits at the
bankExperienced management team with extensive local market knowledge8.2% insider ownership amongst management and the board of directors Q2 ‘20 Financial Summary Key Franchise Highlights Source: S&P Global Market Intelligence, Factset
Financial data as of or for the three months ended 6/30/20; ownership data as of 7/21/20; pricing data as of 7/21/20Completed on January 1, 2020 and April 1, 2020 respectivelyCommunity bank defined as institutions with total assets less than
$10 billionNon-GAAP figures. Refer to appendix for “reconciliation of non-GAAP financial measures” Pro Forma Branch Network RBNC Branches (27) 7 (3) (3) RBNC LPO (1)

Source: S&P Global Market Intelligence; Company Filings 2006 Our History Total
Assets($mm) RBNC Commerce Union Bank 1/9/2006Reliant Bank established 4/28/2014Commerce Union and Reliant announce merger of equals 7/7/2015Stock (ticker symbol CUBN) begins trading on
Nasdaq 2006 2014 2017 2018 8/14/2006Commerce Union Bank established 4/1/2015Commerce Union and Reliant close merger. $791 million in assets 6/30/2017Surpassed$1 billion inassets 12/31/2017Officially rebranded as Reliant Bancorp,
Inc. 2006 2015 2019 1/1/2018Completed acquisition of Community First 10/22/2018Opened Chattanooga branch 9/16/2019Announced acquisition of Tennessee Community Bank Holdings 10/23/2019Announcedacquisition ofFirst Advantage
Bancorp 8/23/2017Announced acquisition of Community First & $25 million Private
Placement 2007 2008 2009 2010 2011 2012 2013 2014 2015 2016 2017 2018 2019 $111 $205 $317 $382 $379 $363 $385 $385 $450 $35 $98 $133 $148 $187 $209 $232 $253 $296 $876 $912 $1,125 $1,724 $1,898 2020 1/1/2020Completed
acquisition of Tennessee Community Bank Holdings 04/01/2020Completed acquisition of First Advantage Bancorp Q2’20 $2,992 8

Financial Highlights & Results Quarterly Highlights for Q2 2020 Financial Results Note: Core
figures exclude mortgage subsidiary financials and one-time merger expensesAdjusted for merger expensesNon-GAAP figures. Refer to appendix for “reconciliation of non-GAAP financial measures”Gross figureBank segment excluded results from
Reliant Mortgage Ventures. (3) (2) (2) (1) (1) (1) (1) (2) (2) (2) (2) (2) (2) (2) 9 Reported EPS for the second quarter of 2020 was $0.48 per diluted common share on net income of $7.9 million. Second quarter 2020 net
income was impacted by, among other items, $5.2 million of purchase accounting accretion ($0.23 increase to EPS) and $2.6 million of merger expense ($0.12 decrease to EPS).Pre-tax, pre-provision income (excluding merger costs) was $15.2
million for the second quarter of 2020. Real income was $12.2 million or $0.74 per common diluted share for the second quarter of 2020.Net interest margin increased 97 bps from March 31, 2020 to 4.58% at June 30, 2020, helping generate
record-level net interest income of $30.0 million. When $5.2 million of purchase accounting accretion and tax credits are excluded, adjusted net interest margin is 3.70%, up 26 bps from March 31, 2020.Loan provision expense for the second
quarter of 2020 was $3.0 million, all of which can be attributed to increased risk factors related to the COVID-19 pandemic. A loan fair value mark of $21.8 million was recorded for the loan portfolio purchased from First Advantage Bank.
Allowance for loan loss and unamortized purchase loan discounts comprised 1.73% of gross loans held for investment at June 30, 2020.Core deposits totaled approximately $2.0 billion at June 30, 2020, an increase of $715.9 million since March
31, 2020, from both acquisition and organic growth, helping reduce cost of funds to 91 basis points, a 39-bps decline from the linked quarter.Bank-segment non-interest expense was $16.4 million for the second quarter of 2020, an increase of
$4.0 million from the first quarter of 2020. The increase was primarily due to the addition of former First Advantage Bank employees and facilities and approximately $811 thousand of restructuring and non-recurring miscellaneous
charges. (2) (2) (2) (2) (4) (1) (2) (1) (2) (1)
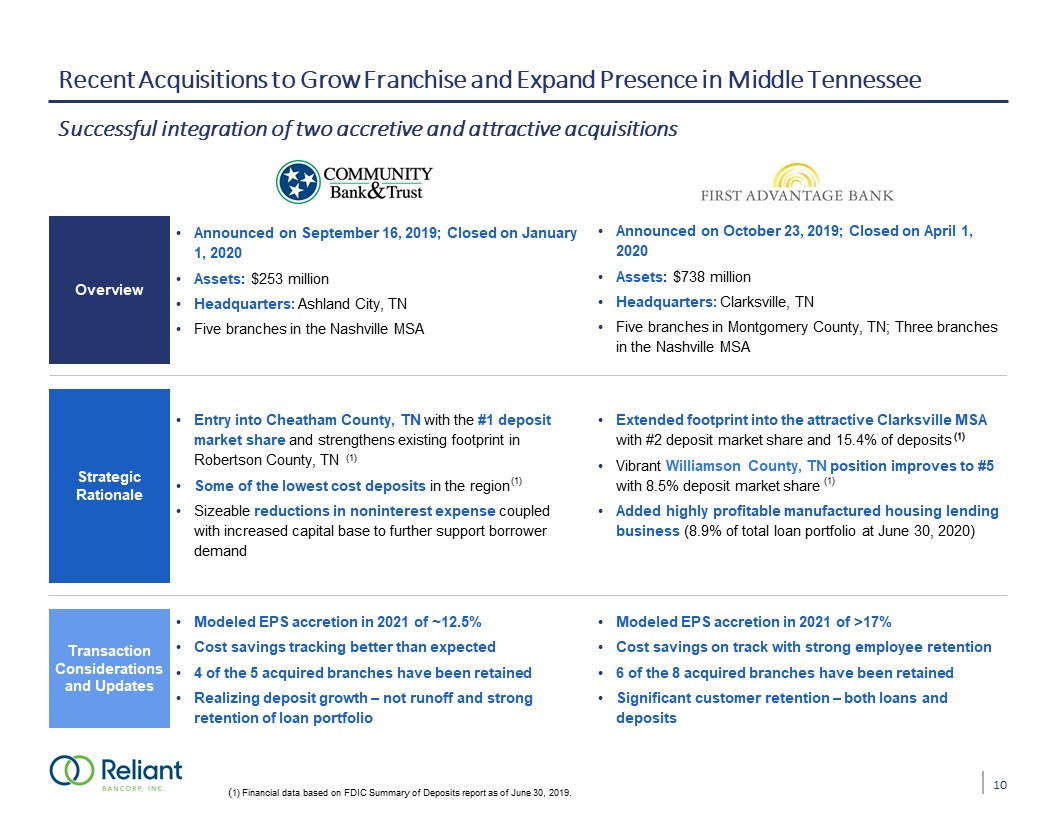
Recent Acquisitions to Grow Franchise and Expand Presence in Middle Tennessee Announced on September
16, 2019; Closed on January 1, 2020Assets: $253 millionHeadquarters: Ashland City, TN Five branches in the Nashville MSA Announced on October 23, 2019; Closed on April 1, 2020Assets: $738 millionHeadquarters: Clarksville, TN Five branches in
Montgomery County, TN; Three branches in the Nashville MSA Entry into Cheatham County, TN with the #1 deposit market share and strengthens existing footprint in Robertson County, TNSome of the lowest cost deposits in the regionSizeable
reductions in noninterest expense coupled with increased capital base to further support borrower demand Extended footprint into the attractive Clarksville MSA with #2 deposit market share and 15.4% of depositsVibrant Williamson County, TN
position improves to #5 with 8.5% deposit market share Added highly profitable manufactured housing lending business (8.9% of total loan portfolio at June 30, 2020) Modeled EPS accretion in 2021 of ~12.5%Cost savings tracking better than
expected4 of the 5 acquired branches have been retainedRealizing deposit growth – not runoff and strong retention of loan portfolio Modeled EPS accretion in 2021 of >17%Cost savings on track with strong employee retention6 of the 8
acquired branches have been retainedSignificant customer retention – both loans and deposits Overview Strategic Rationale Transaction Considerations and Updates Successful integration of two accretive and attractive
acquisitions 10 (1) (1) (1) (1) Financial data based on FDIC Summary of Deposits report as of June 30, 2019. (1) (1)

Nashville Deposit Market Share Top 25 Deposit Market Share Note: Dollars in millions; Deposit market
share data as of 12/31/19Source: S&P Global Market IntelligenceCommunity bank defined as an institution with less than $10 billion in total assetsReliant data shown pro forma for recently announced acquisitions of Tennessee Community Bank
Holdings, Inc. and First Advantage Bancorp (1) (2) (2) 11
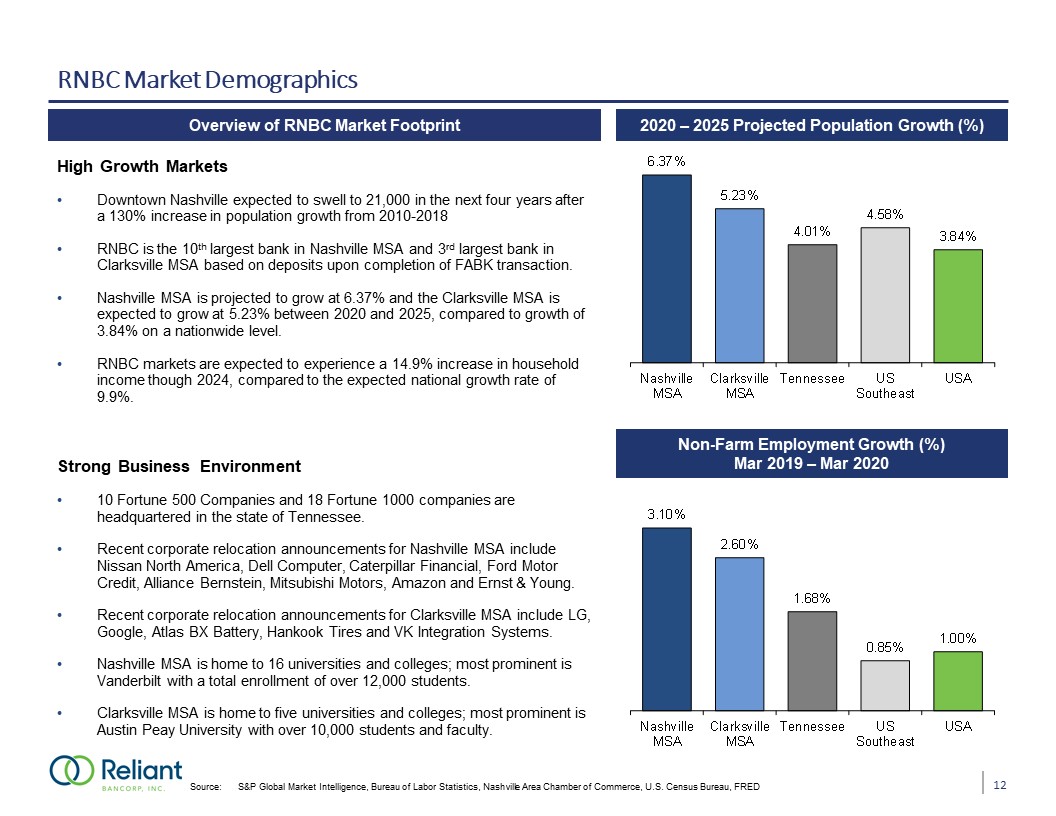
RNBC Market Demographics Overview of RNBC Market Footprint High Growth MarketsDowntown Nashville
expected to swell to 21,000 in the next four years after a 130% increase in population growth from 2010-2018RNBC is the 10th largest bank in Nashville MSA and 3rd largest bank in Clarksville MSA based on deposits upon completion of FABK
transaction.Nashville MSA is projected to grow at 6.37% and the Clarksville MSA is expected to grow at 5.23% between 2020 and 2025, compared to growth of 3.84% on a nationwide level.RNBC markets are expected to experience a 14.9% increase in
household income though 2024, compared to the expected national growth rate of 9.9%.Strong Business Environment10 Fortune 500 Companies and 18 Fortune 1000 companies are headquartered in the state of Tennessee.Recent corporate relocation
announcements for Nashville MSA include Nissan North America, Dell Computer, Caterpillar Financial, Ford Motor Credit, Alliance Bernstein, Mitsubishi Motors, Amazon and Ernst & Young. Recent corporate relocation announcements for
Clarksville MSA include LG, Google, Atlas BX Battery, Hankook Tires and VK Integration Systems.Nashville MSA is home to 16 universities and colleges; most prominent is Vanderbilt with a total enrollment of over 12,000 students.Clarksville MSA
is home to five universities and colleges; most prominent is Austin Peay University with over 10,000 students and faculty. 2020 – 2025 Projected Population Growth (%) Source: S&P Global Market Intelligence, Bureau of Labor Statistics,
Nashville Area Chamber of Commerce, U.S. Census Bureau, FRED Non-Farm Employment Growth (%)Mar 2019 – Mar 2020 12
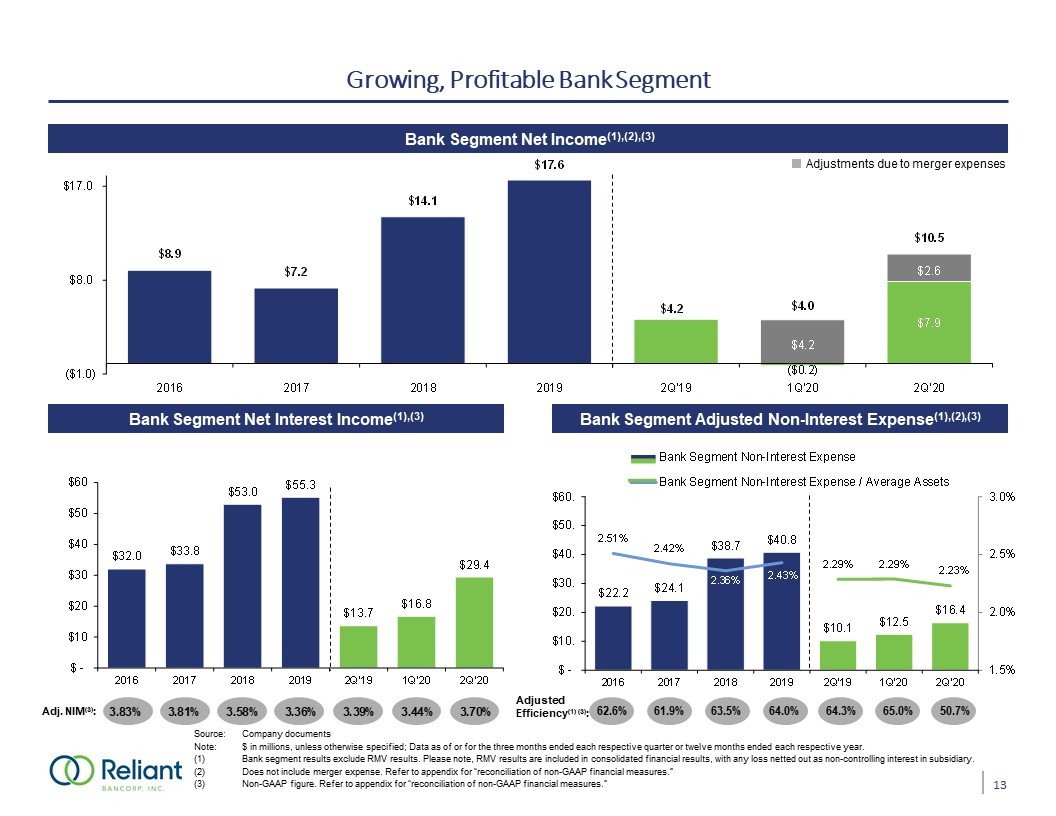
Growing, Profitable Bank Segment Bank Segment Net Income(1),(2),(3) Source: Company
documentsNote: $ in millions, unless otherwise specified; Data as of or for the three months ended each respective quarter or twelve months ended each respective year. Bank segment results exclude RMV results. Please note, RMV results are
included in consolidated financial results, with any loss netted out as non-controlling interest in subsidiary.Does not include merger expense. Refer to appendix for “reconciliation of non-GAAP financial measures.”Non-GAAP figure. Refer to
appendix for “reconciliation of non-GAAP financial measures.” Bank Segment Net Interest Income(1),(3) Bank Segment Adjusted Non-Interest Expense(1),(2),(3) Adj. NIM(3): Adjusted Efficiency(1) (3): 13 Adjustments due to
merger expenses

Growing Bank Segment Pre-Tax, Pre-Provision Income Q4 19 NII impacted by 1.1 million gain
on sale of securities$166 thousand gain on sale of OREQ1 19 NII impacted by$131 thousand gain on sale of securities Note: $ in thousands, unless otherwise specified. Data as of or for the three months ended each respective quarter or twelve
months ended each respective year, adjusted figures exclude RMV results and merger expense. Excludes gain on sales of securities and ORENon-GAAP figures. Refer to appendix for “reconciliation of non-GAAP financial measures” (2) 14 Q2 20
NII increase by –$793.3 million of acquired loans and $5.2 million of purchase accounting accretionQ2 20 NIR increased by –$338 thousand gain on sale of securities and OREOQ2 19 NIR increased by –$175 thousand gain on sale of
securities Excludes merger expense of –$2.6 million in Q2 20$4.2 million in Q1 20Q2 20 NIE increased by FABK acquisition increasing salary expense, occupancy and IT costs (2) (1), (2)
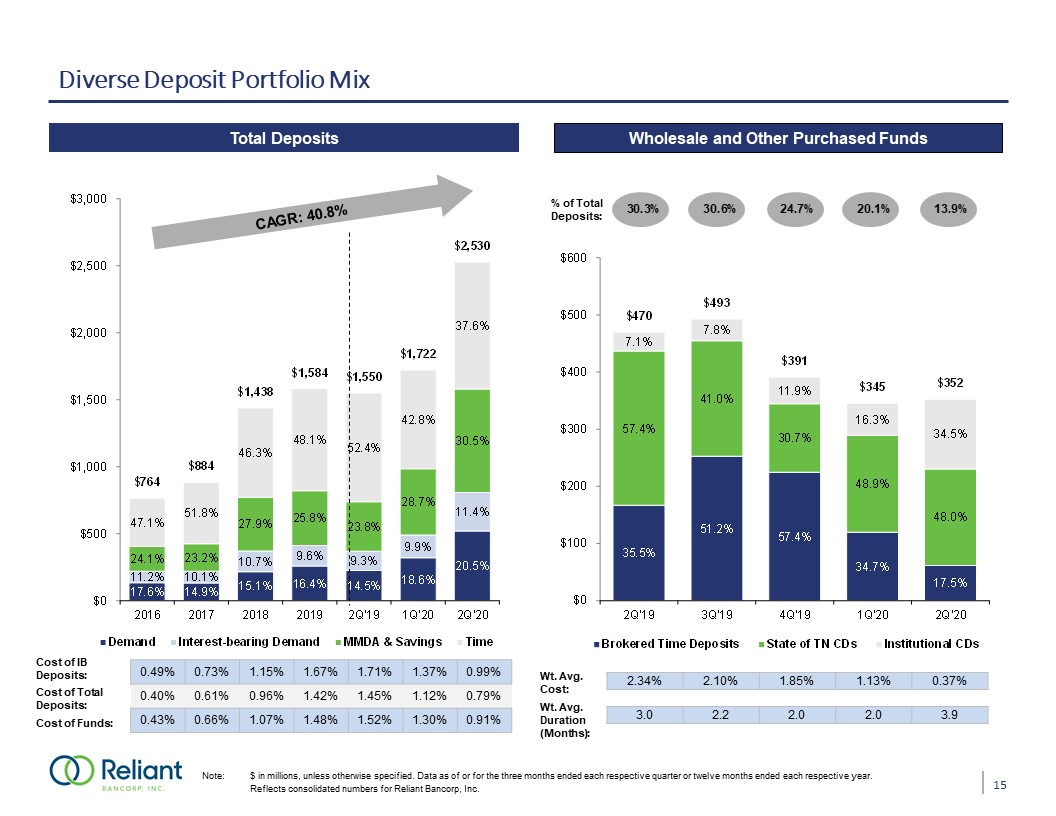
Diverse Deposit Portfolio Mix Cost of IB Deposits: Cost of Funds: Note: $ in millions, unless
otherwise specified. Data as of or for the three months ended each respective quarter or twelve months ended each respective year. Reflects consolidated numbers for Reliant Bancorp, Inc. Wholesale and Other Purchased Funds 0.49% 0.73%
1.15% 1.67% 1.71% 1.37% 0.99% 0.40% 0.61% 0.96% 1.42% 1.45% 1.12% 0.79% 0.43% 0.66% 1.07% 1.48% 1.52% 1.30% 0.91% Total Deposits CAGR: 40.8% % of Total Deposits: Wt. Avg. Cost: Wt. Avg.
Duration (Months): 2.34% 2.10% 1.85% 1.13% 0.37% 3.0 2.2 2.0 2.0 3.9 Cost of Total Deposits: 15

Balancing Growth and Profitability Coupon + Fees: Loan Portfolio(1) Notes:$ in
millions, unless otherwise specified. Data as of or for the three months ended each respective quarter or twelve months ended each respective year. Does not include loans held for sale.Increase in Consumer & Other loans at June 30, 2020
due to acquisition of $177.0 million of Manufactured Housing – Chattel loans from First Advantage Bank. CAGR: 42.7% Loan Yields 16 (2)

Well Capitalized and Strong Liquidity Position Source: Company documents, SNL FinancialNote: Data as
of or for the three months ended each respective quarter; Chart and table reflect numbers for Reliant Bank (excludes holding company)Estimated figures only as Regulatory Call report has not been finalized Non-GAAP figure. Refer to appendix
for “reconciliation of non-GAAP financial measures”.Cash balance adjusted by transit items.Net of current advances. (1) (2) 17 (4) (3)

Delivering Shareholder Value Reported and Adjusted Quarterly Diluted EPS(1) Tangible Book Value per
Share(1) Reported and Adjusted ROAA(1) Reported and Adjusted ROATCE(1) Source: Company documentsNote: Data as of or for the three months ended each respective quarter. (1) Non-GAAP figures. Refer to appendix for “reconciliation of non-GAAP
financial measures”. 18 Reported Metrics Adjustments due to merger expenses
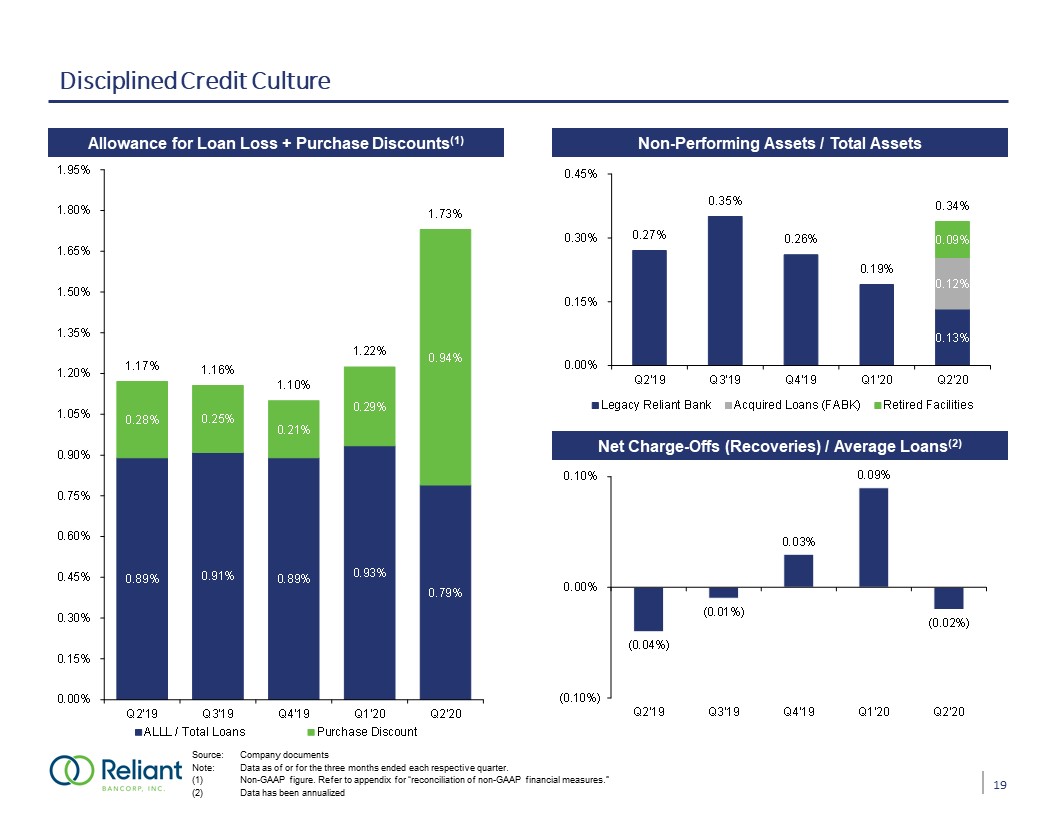
Disciplined Credit Culture Allowance for Loan Loss + Purchase Discounts(1) Net Charge-Offs
(Recoveries) / Average Loans(2) Non-Performing Assets / Total Assets Source: Company documentsNote: Data as of or for the three months ended each respective quarter.Non-GAAP figure. Refer to appendix for “reconciliation of non-GAAP
financial measures.”Data has been annualized 19
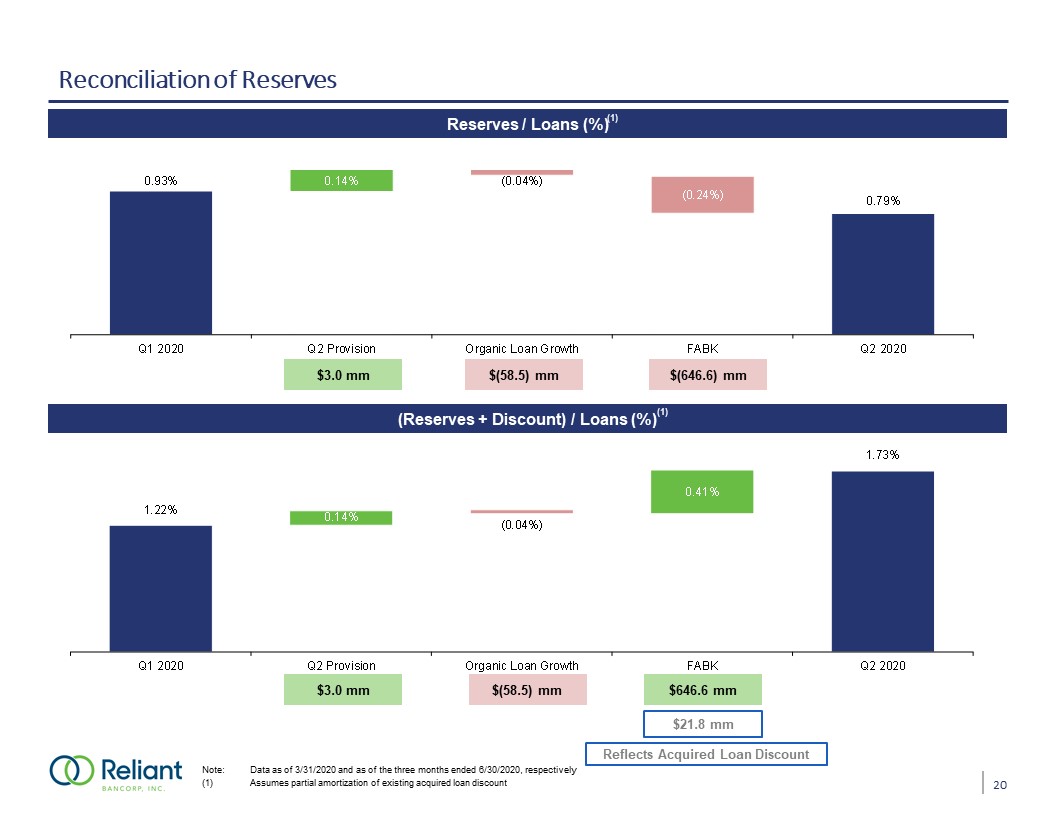
Reconciliation of Reserves Reserves / Loans (%) (Reserves + Discount) / Loans (%) Note: Data as of
3/31/2020 and as of the three months ended 6/30/2020, respectively(1) Assumes partial amortization of existing acquired loan discount $3.0 mm $(58.5) mm $(646.6) mm $3.0 mm $(58.5) mm $646.6 mm $21.8 mm Reflects Acquired Loan
Discount A B C D E F G H I J K L M N (1) (1) 20

Diversified Lending Platform C&D Portfolio Commercial Real Estate Portfolio Source: S&P
Global Market Intelligence, Company documentsNote: $ in millions, unless otherwise specified. Data as of or for the three months ended each respective quarter. Outstanding balance as a % of Total Capital 21
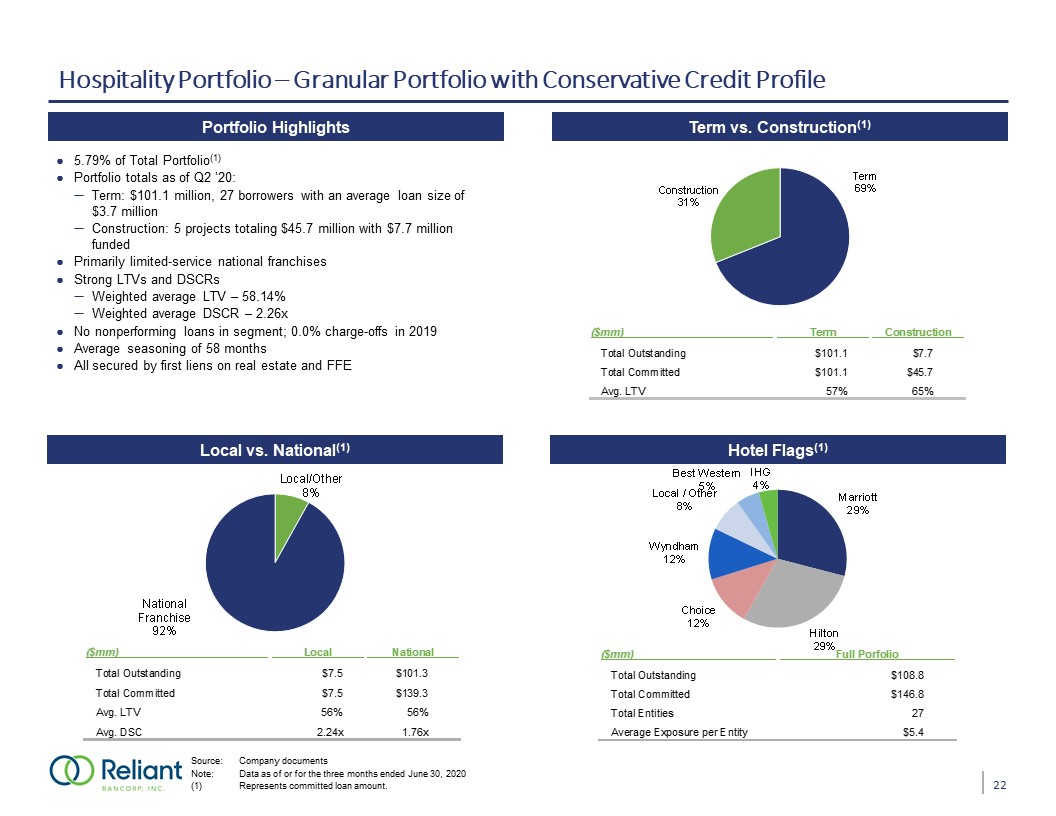
Hospitality Portfolio – Granular Portfolio with Conservative Credit Profile Source: Company
documentsNote: Data as of or for the three months ended June 30, 2020 (1) Represents committed loan amount. Local vs. National(1) Term vs. Construction(1) Portfolio Highlights Hotel Flags(1) 5.79% of Total Portfolio(1)Portfolio totals as
of Q2 ’20: Term: $101.1 million, 27 borrowers with an average loan size of $3.7 millionConstruction: 5 projects totaling $45.7 million with $7.7 million fundedPrimarily limited-service national franchisesStrong LTVs and DSCRsWeighted average
LTV – 58.14% Weighted average DSCR – 2.26xNo nonperforming loans in segment; 0.0% charge-offs in 2019Average seasoning of 58 monthsAll secured by first liens on real estate and FFE (Pre-Covid-19) 22

Restaurant Portfolio – Diversified with Low Average Loan Size Source: Company documentsNote: Data as
of or for the three months ended June 30, 2020(1) Represents committed loan amount.(2) Other Includes, without limitation, Dairy Queen, Gigi’s Cupcakes, Captain D’s, Jet’s Pizza, Zaxbys, Wendy’s and Starbucks Total $93.7 million Total
$124.4 million Portfolio Statistics Burger King Local vs. National(1) Secured by Real Estate(1) Portfolio Highlights Brands(1) 5.21% of Total Portfolio(1)Outstanding balances as of Q2 ’20: $96.3 millionQuick-Service (QSR) national
franchises: 83.1 million 86% of total Dine-in Facilities: $16.5 million 14% of totalMajority of borrowers have been with Reliant for 5+ yearsWeighted average DSCR: 1.65x No nonperforming loans in segment; 0.0% charge-offs in 202039% of
outstanding loans secured by real estate DSCR and ‘Other’ brand numbers under progress Show % of total Show % of total TBU TBU – Restaurant Data 23 (2)

Retail CRE Portfolio Source: Company documentsNote: Data as of or for the three months ended June 30,
2020 Represents committed loan amounts. Total $93.7 million Total $124.4 million Portfolio Statistics Burger King Non Owner-Occupied by Property Type(1) Non Owner-Occupied vs. Construction(1) Portfolio Highlights Construction by
Property Type(1) No past dues in categories at 6/30/2020No charge-offs in categories in 2019 or YTD 2020All loans in categories are Pass-ratedRetail Anchored Tenants (Primarily Publix, CVS, Large National Retailers) Avg. Loan Size - $3.5
million Committed Balance - $28.3 millionAvg. DSC – 1.42xAvg. LTV – 56.36%Retail Non-Anchored Tenants - 107 CustomersAvg. Loan Size - $1.1 million Committed Balance - $134.6 millionAvg. DSC – 2.03xAvg. LTV – 64.68%Retail Single Credit Tenant
(Largest Concentration – Dollar General, AT&T)Committed Balance - $40.4 million Avg. DSC – 1.37xAvg. LTV – 62.35% DSCR and ‘Other’ brand numbers under progress Show % of total Show % of total TBU TBU – Restaurant Data 24
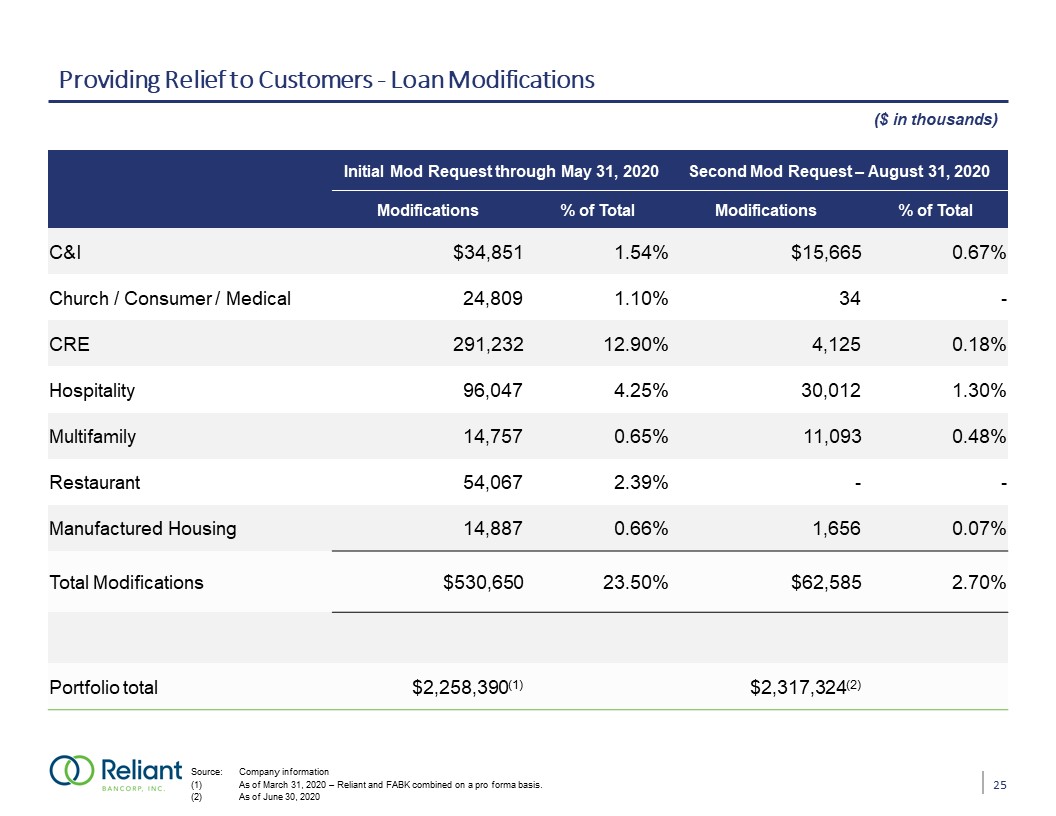
Providing Relief to Customers - Loan Modifications Q4 19 NII impacted by 1.1 million gain on sale
of securities$166 thousand gain on sale of OREQ1 19 NII impacted by$131 thousand gain on sale of securities Initial Mod Request through May 31, 2020 Second Mod Request – August 31, 2020 Modifications % of
Total Modifications % of Total C&I $34,851 1.54% $15,665 0.67% Church / Consumer / Medical 24,809 1.10% 34 - CRE 291,232 12.90% 4,125 0.18% Hospitality 96,047 4.25% 30,012 1.30% Multifamily
14,757 0.65% 11,093 0.48% Restaurant 54,067 2.39% - - Manufactured Housing 14,887 0.66% 1,656 0.07% Total Modifications $530,650 23.50% $62,585 2.70% Portfolio total $2,258,390(1)
$2,317,324(2) ($ in thousands) Source: Company information(1) As of March 31, 2020 – Reliant and FABK combined on a pro forma basis.(2) As of June 30, 2020 25

Our Strategy for 2020 COVID-19 response:Focus on employees, customers and communitiesPrudently
monitor credit environment and capital ratiosCapital preservation – share repurchase and dividendsRigorous review of non-interest expenseReview branch networkPursue coveted M&A opportunitiesOn-going focus on organic earning-asset
generation and improved funding mixFully integrate Community Bank & Trust and First Advantage Bank acquisitions and leverage presence in new marketsHire selectively to prepare for future growthBuild out and optimize digital channelAlign
management structure for $3-5 billion company 26

Appendix

Reconciliation of Non-GAAP Financial Measures Reliant Bancorp, Inc. Adjusted Net Income, Adjusted
Return on Average Assets, Average Tangible Common Equity, Adjusted Return on Average Tangible Common Equity, Adjusted Earnings Per Share and Adjusted Return on Average Equity 27
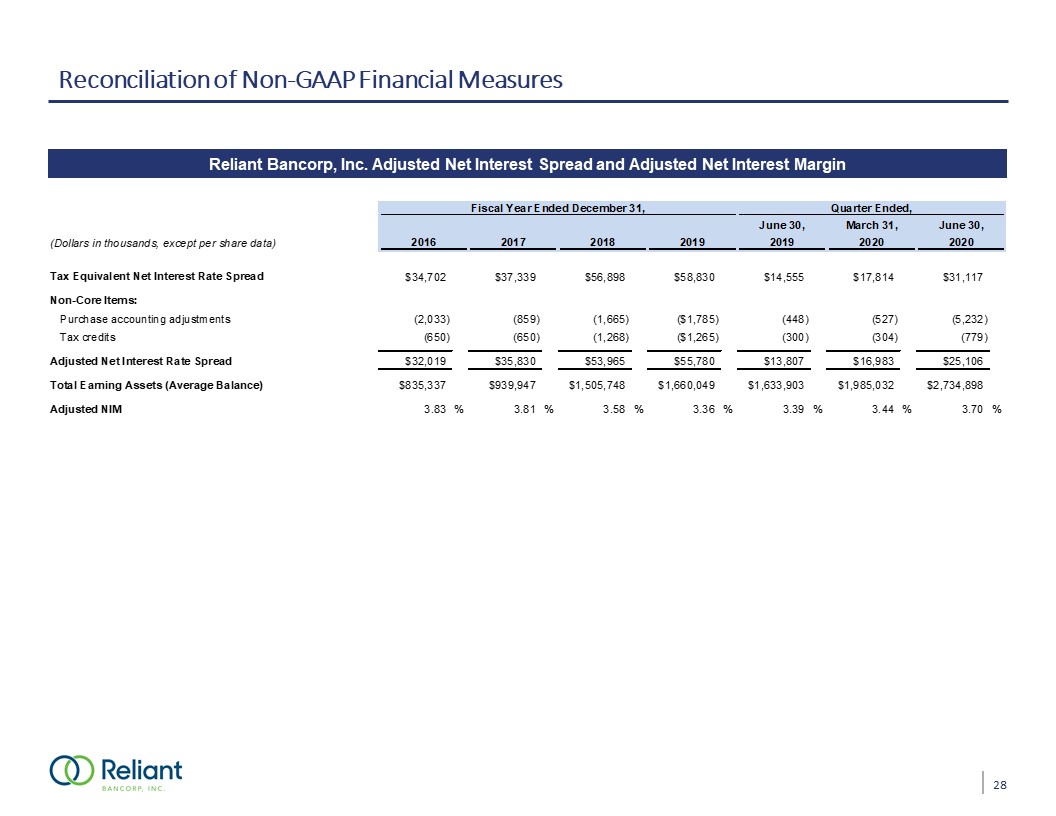
Reconciliation of Non-GAAP Financial Measures Reliant Bancorp, Inc. Adjusted Net Interest Spread and
Adjusted Net Interest Margin 28

Reconciliation of Non-GAAP Financial Measures Reliant Bancorp, Inc. Tangible Common Equity to Tangible
Assets, Tangible Book Value per Share, Return on Average Tangible Common Equity 29

Reconciliation of Non-GAAP Financial Measures Reliant Bancorp, Inc. Core Profitability Note: Core
figures exclude mortgage subsidiary financials and one-time merger expenses 30

Reconciliation of Non-GAAP Financial Measures Reliant Bancorp, Inc. Bank Segment Pre-tax Pre-Provision
Net Income and Real Income Note: Core figures exclude mortgage subsidiary financials and one-time merger expenses 31

Reconciliation of Non-GAAP Financial Measures Reliant Bancorp, Inc. Adjusted Efficiency Ratio Note:
Adjusted figures exclude RMV results and merger expense. 32

Reconciliation of Non-GAAP Financial Measures Reliant Bancorp, Inc. ALLL + Unamortized Loan
Accretion 33