Attached files
| file | filename |
|---|---|
| EX-99.2 - EXHIBIT 99.2 - Service Properties Trust | tm2029347d1_ex99-2.htm |
| 8-K - FORM 8-K - Service Properties Trust | tm2029347d1_8k.htm |
Exhibit 99.1
 |
Service Properties Trust (Nasdaq: SVC) Investor Presentation August 2020 |
 |
This presentation contains statements that constitute forward-looking statements within the meaning of the Private Securities Litigation Reform Act of 1995 and other securities laws. Also, whenever we use words such as “believe,” “expect,” “anticipate,” “intend,” “plan,” “estimate,” “will,” “may” and negatives or derivatives of these or similar expressions, we are making forward-looking statements. These forward-looking statements are based upon our present intent, beliefs or expectations, but forward-looking statements are not guaranteed to occur and may not occur. Forward-looking statements in this presentation relate to various aspects of our business, including the duration and severity of the economic downturn resulting from the COVID-19 pandemic and its impact on us and our hotel operators and net lease tenants, our expectations about our ability and the ability of our hotel operators and net lease tenants to operate throughout the COVID-19 pandemic and withstand the resulting economic downturn, the likelihood and extent to which our hotel operators and net lease tenants will be negatively impacted by the COVID-19 pandemic and its aftermath and be able and willing to pay us the contractual amounts of returns, rents or other obligations due to us, potential defaults on, or non-renewal of, leases by our tenants, decreased rental rates or increased vacancies, our sales and acquisitions of properties, our ability to compete for acquisitions effectively, our policies and plans regarding investments, financings and dispositions, our ability to pay distributions to our shareholders and to increase the amount of such distributions, our ability to raise debt or equity capital, our ability to appropriately balance our use of debt and equity capital, our intent to make improvements to certain of our properties and the success of our renovations, our ability to engage and retain qualified hotel operators and net lease tenants on satisfactory terms, our ability to diversify our sources of rents and returns that improve the security of our cash flows, the future availability of borrowings under our revolving credit facility, our ability to pay interest on and principal of our debt, our ability to maintain sufficient liquidity during the duration of the COVID-19 pandemic and resulting economic downturn, our credit ratings, our expectation that we benefit from our relationships with The RMR Group, Inc., or RMR, our qualification for taxation as a REIT, changes in federal or state tax laws, and other matters. Our actual results may differ materially from those contained in or implied by our forward-looking statements as a result of various factors, such as the impact of conditions in the economy, including the COVID-19 pandemic and the resulting economic downturn, and the capital markets on us and our hotel operators and net lease tenants, competition within the real estate, hotel, transportation, travel center and other industries in which our hotel operators and net lease tenants operate, particularly in those markets in which our properties are located, compliance with, and changes to applicable laws, regulations, rules and similar matters, limitations imposed on our business and our ability to satisfy complex rules in order for us to maintain our qualification for taxation as a REIT for U.S. federal income tax purposes, acts of terrorism, outbreaks of pandemics, including the COVID-19 pandemic, or other man-made or natural disasters beyond our control and actual and potential conflicts of interest with our related parties. Our Annual Report on Form 10-K for the year ended December 31, 2019, our Quarterly Report on Form 10-Q for the quarter ended June 30, 2020 and our other filings with the Securities and Exchange Commission, or SEC, identify other important factors that could cause differences from our forward-looking statements. Our filings with the SEC are available on the SEC’s website at www.SEC.gov. You should not place undue reliance upon our forward-looking statements. Except as required by law, we do not intend to update or change any forward-looking statements as a result of new information, future events or otherwise. Non-GAAP Financial Measures This presentation contains Non-GAAP financial measures including, among others, “EBITDA” and “Adjusted EBITDA” in the exhibits section. Reconciliations for those metrics to the most directly comparable financial measure calculated in accordance with U.S generally accepted accounting principles, or GAAP, are included herein. Unless otherwise noted, all data presented is as of and for the three months ended June 30, 2020. Please refer to page 28 for certain definitions of terms used throughout this presentation. SERVICE PROPERTIES TRUST (Nasdaq: SVC) | August 20202 |
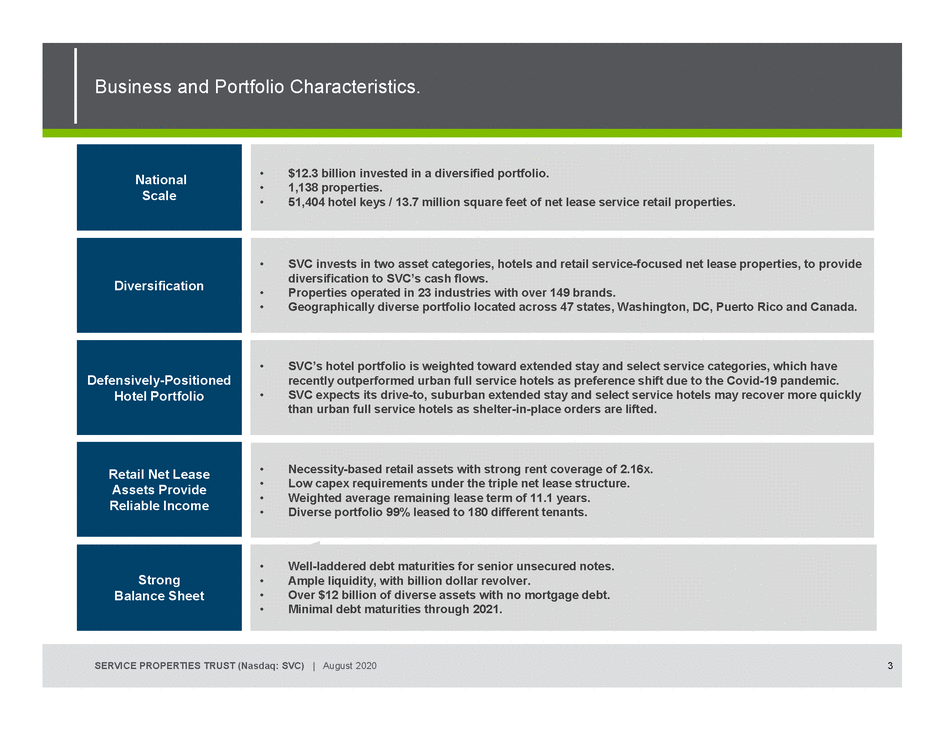 |
National Scale •$12.3 billion invested in a diversified portfolio. •1,138 properties. •51,404 hotel keys / 13.7 million square feet of net lease service retail properties. Diversification •SVC invests in two asset categories, hotels and retail service-focused net lease properties, to provide diversification to SVC’s cash flows. •Properties operated in 23 industries with over 149 brands. •Geographically diverse portfolio located across 47 states, Washington, DC, Puerto Rico and Canada. Defensively-Positioned Hotel Portfolio •SVC’s hotel portfolio is weighted toward extended stay and select service categories, which have recently outperformed urban full service hotels as preference shift due to the Covid-19 pandemic. •SVC expects its drive-to, suburban extended stay and select service hotels may recover more quickly than urban full service hotels as shelter-in-place orders are lifted. Retail Net Lease Assets Provide Reliable Income •Necessity-based retail assets with strong rent coverage of 2.16x. •Low capex requirements under the triple net lease structure. •Weighted average remaining lease term of 11.1 years. •Diverse portfolio 99% leased to 180 different tenants. Strong Balance Sheet •Well-laddered debt maturities for senior unsecured notes. •Ample liquidity, with billion dollar revolver. •Over $12 billion of diverse assets with no mortgage debt. •Minimal debt maturities through 2021. SERVICE PROPERTIES TRUST (Nasdaq: SVC) | August 20203 |
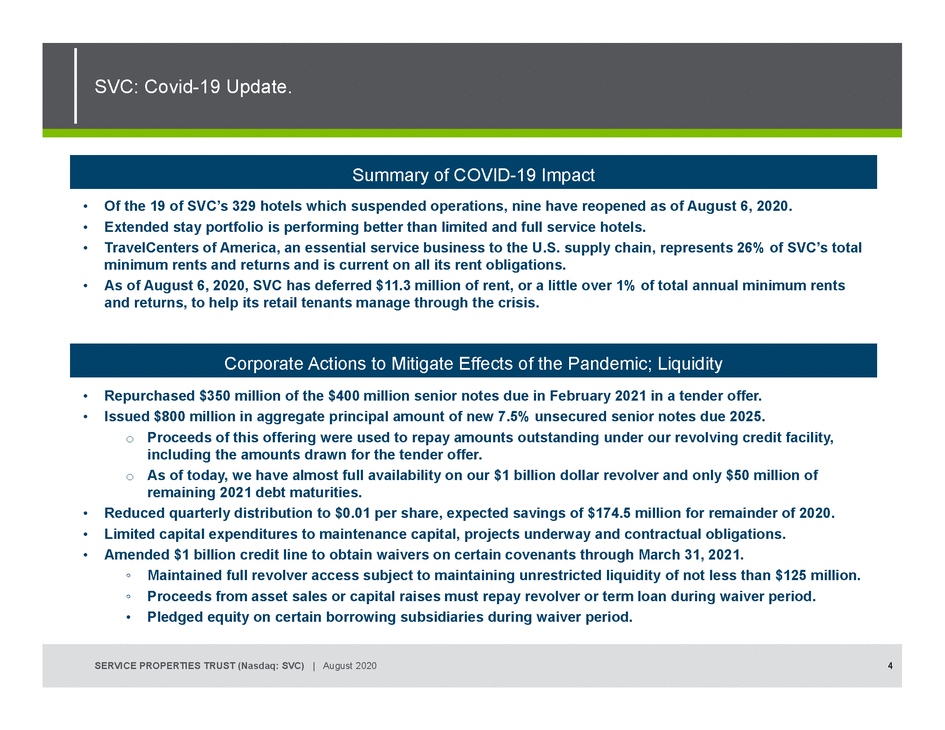 |
Summary of COVID-19 Impact •Of the 19 of SVC’s 329 hotels which suspended operations, nine have reopened as of August 6, 2020. •Extended stay portfolio is performing better than limited and full service hotels. •TravelCenters of America, an essential service business to the U.S. supply chain, represents 26% of SVC’s total minimum rents and returns and is current on all its rent obligations. •As of August 6, 2020, SVC has deferred $11.3 million of rent, or a little over 1% of total annual minimum rents and returns, to help its retail tenants manage through the crisis. Corporate Actions to Mitigate Effects of the Pandemic; Liquidity •Repurchased $350 million of the $400 million senior notes due in February 2021 in a tender offer. •Issued $800 million in aggregate principal amount of new 7.5% unsecured senior notes due 2025. o Proceeds of this offering were used to repay amounts outstanding under our revolving credit facility, including the amounts drawn for the tender offer. o As of today, we have almost full availability on our $1 billion dollar revolver and only $50 million of remaining 2021 debt maturities. •Reduced quarterly distribution to $0.01 per share, expected savings of $174.5 million for remainder of 2020. •Limited capital expenditures to maintenance capital, projects underway and contractual obligations. •Amended $1 billion credit line to obtain waivers on certain covenants through March 31, 2021. ◦Maintained full revolver access subject to maintaining unrestricted liquidity of not less than $125 million. ◦Proceeds from asset sales or capital raises must repay revolver or term loan during waiver period. •Pledged equity on certain borrowing subsidiaries during waiver period. SERVICE PROPERTIES TRUST (Nasdaq: SVC) | August 20204 |
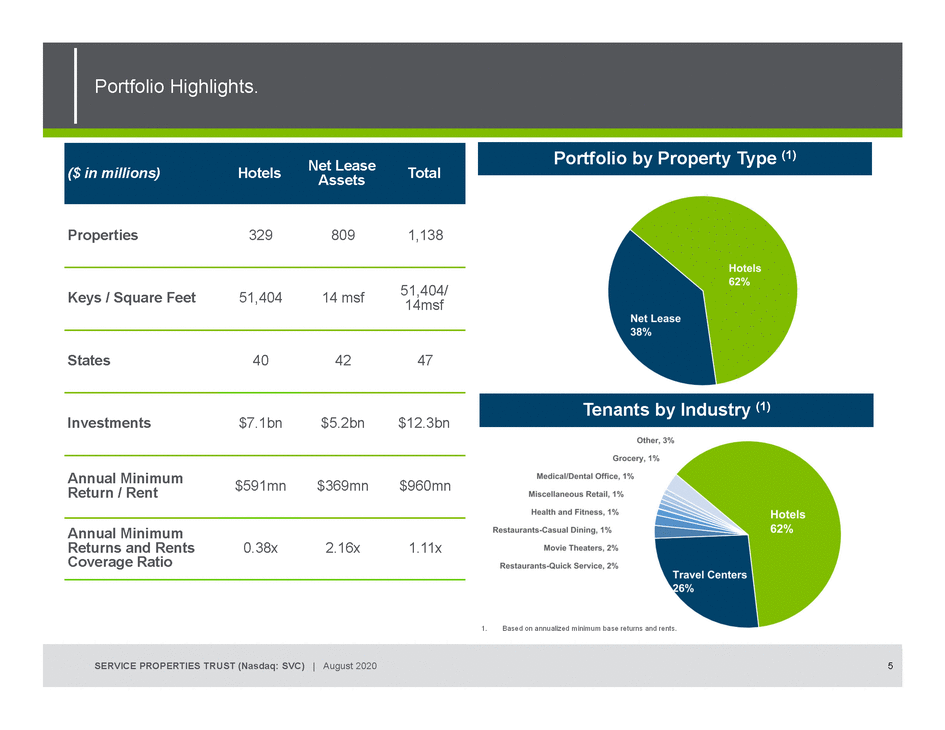 |
Assets Total Portfolio by Property Type (1) Properties3298091,138 14msf States404247 Investments$7.1bn$5.2bn$12.3bn Annual Minimum Return / Rent$591mn$369mn$960mn Tenants by Industry (1) Annual Minimum Returns and Rents Coverage Ratio 1.Based on annualized minimum base returns and rents. SERVICE PROPERTIES TRUST (Nasdaq: SVC) | August 20205 |
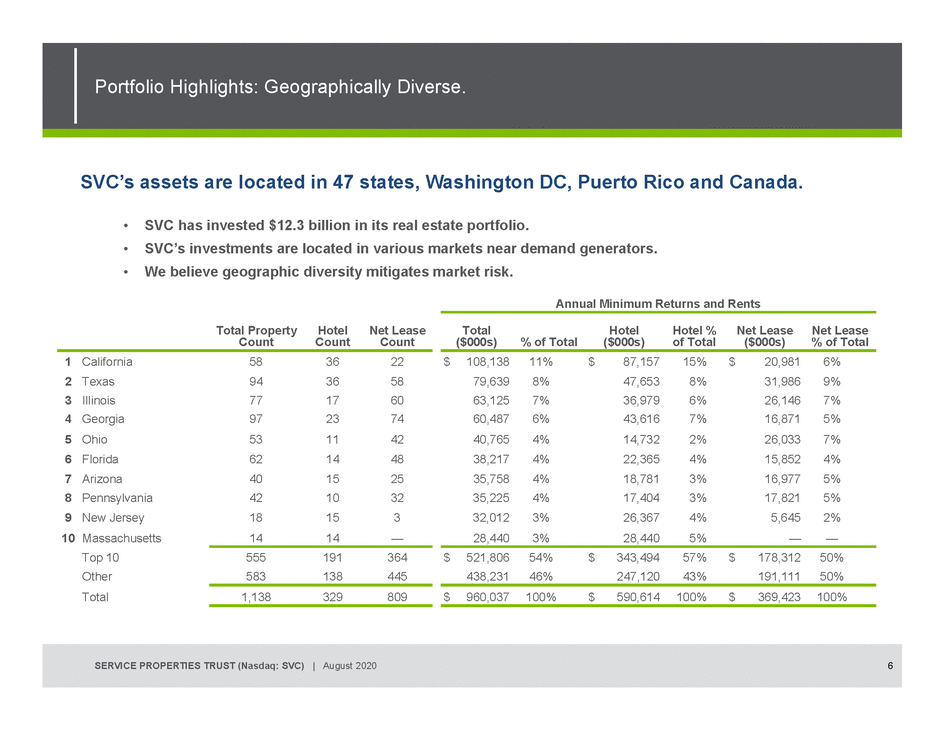 |
SVC’s assets are located in 47 states, Washington DC, Puerto Rico and Canada. •SVC has invested $12.3 billion in its real estate portfolio. •SVC’s investments are located in various markets near demand generators. •We believe geographic diversity mitigates market risk. Annual Minimum Returns and Rents SERVICE PROPERTIES TRUST (Nasdaq: SVC) | August 20206 |
 |
Hotel Portfolio SERVICE PROPERTIES TRUST (Nasdaq: SVC) | August 2020 |
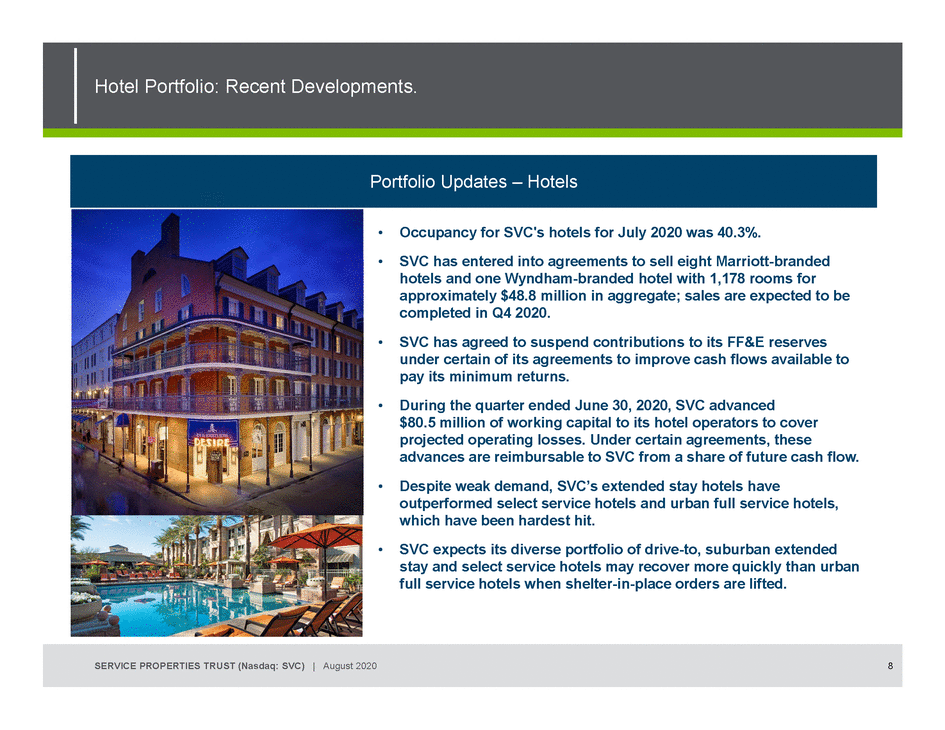 |
Portfolio Updates – Hotels •Occupancy for SVC's hotels for July 2020 was 40.3%. •SVC has entered into agreements to sell eight Marriott-branded hotels and one Wyndham-branded hotel with 1,178 rooms for approximately $48.8 million in aggregate; sales are expected to be completed in Q4 2020. •SVC has agreed to suspend contributions to its FF&E reserves under certain of its agreements to improve cash flows available to pay its minimum returns. •During the quarter ended June 30, 2020, SVC advanced $80.5 million of working capital to its hotel operators to cover projected operating losses. Under certain agreements, these advances are reimbursable to SVC from a share of future cash flow. •Despite weak demand, SVC’s extended stay hotels have outperformed select service hotels and urban full service hotels, which have been hardest hit. •SVC expects its diverse portfolio of drive-to, suburban extended stay and select service hotels may recover more quickly than urban full service hotels when shelter-in-place orders are lifted. SERVICE PROPERTIES TRUST (Nasdaq: SVC) | August 20208 |
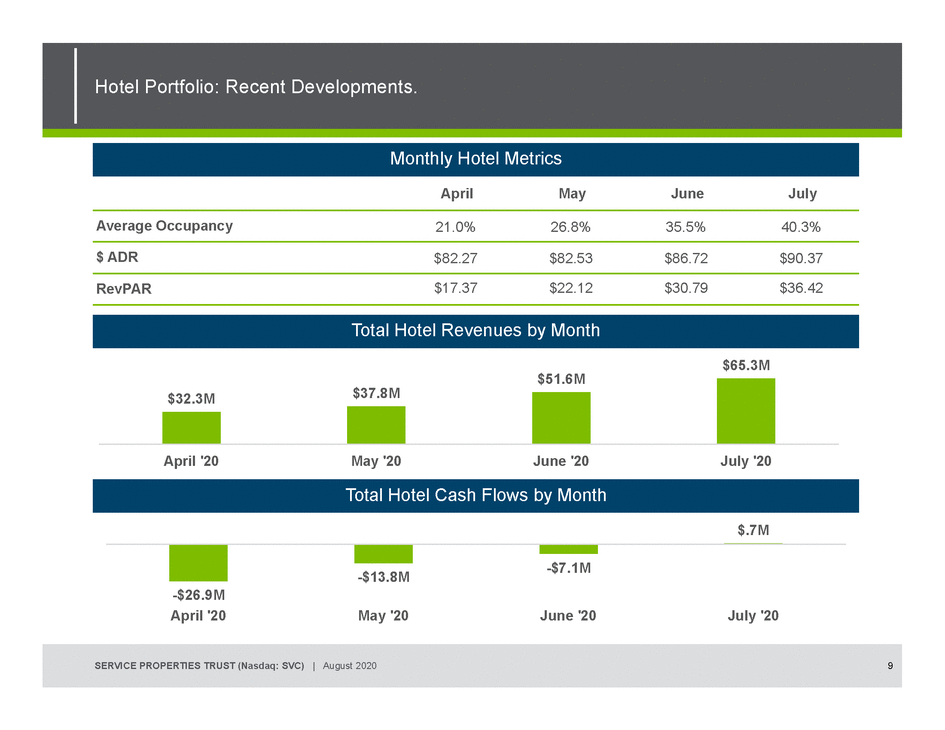 |
Monthly Hotel Metrics Total Hotel Revenues by Month $32.3M$37.8M $51.6M $65.3M April '20May '20June '20July '20 Total Hotel Cash Flows by Month $.7M -$26.9M -$13.8M-$7.1M April '20May '20June '20July '20 SERVICE PROPERTIES TRUST (Nasdaq: SVC) | August 20209 |
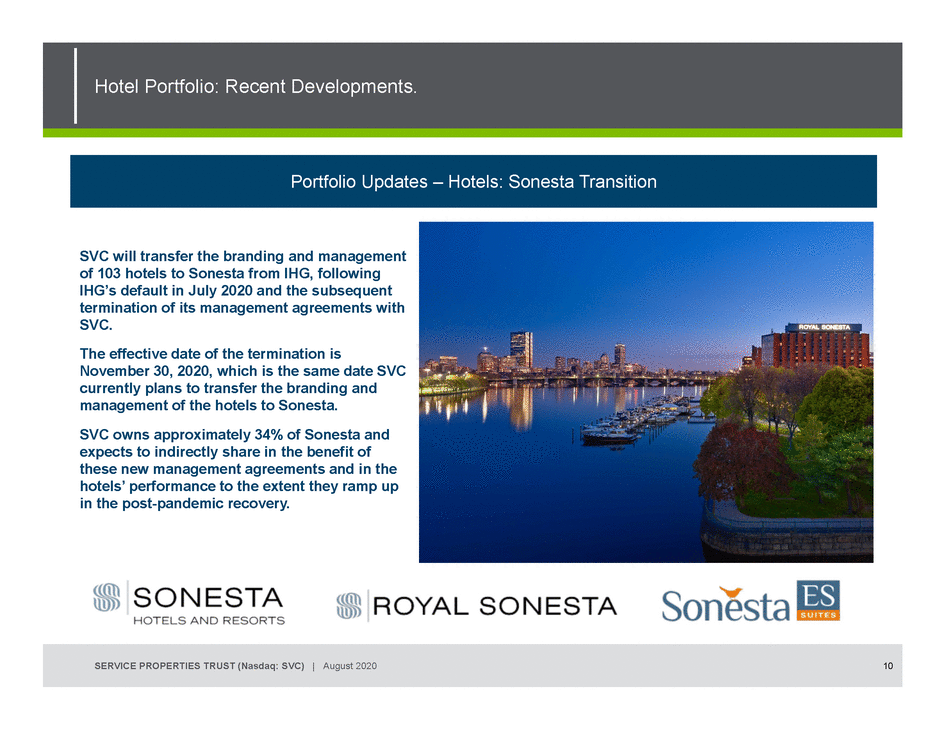 |
Portfolio Updates – Hotels: Sonesta Transition SVC will transfer the branding and management of 103 hotels to Sonesta from IHG, following IHG’s default in July 2020 and the subsequent termination of its management agreements with SVC. The effective date of the termination is November 30, 2020, which is the same date SVC currently plans to transfer the branding and management of the hotels to Sonesta. SVC owns approximately 34% of Sonesta and expects to indirectly share in the benefit of these new management agreements and in the hotels’ performance to the extent they ramp up in the post-pandemic recovery. SERVICE PROPERTIES TRUST (Nasdaq: SVC) | August 202010 |
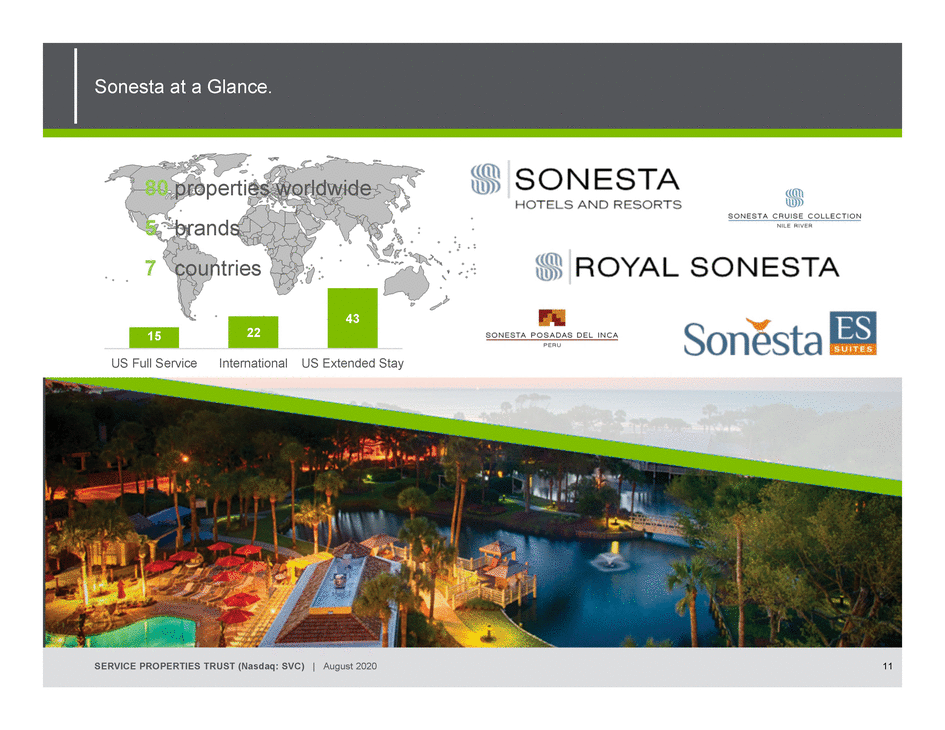 |
80 properties worldwide 5brands 7countries 43 1522 US Full ServiceInternationalUS Extended Stay SERVICE PROPERTIES TRUST (Nasdaq: SVC) | August 202011 |
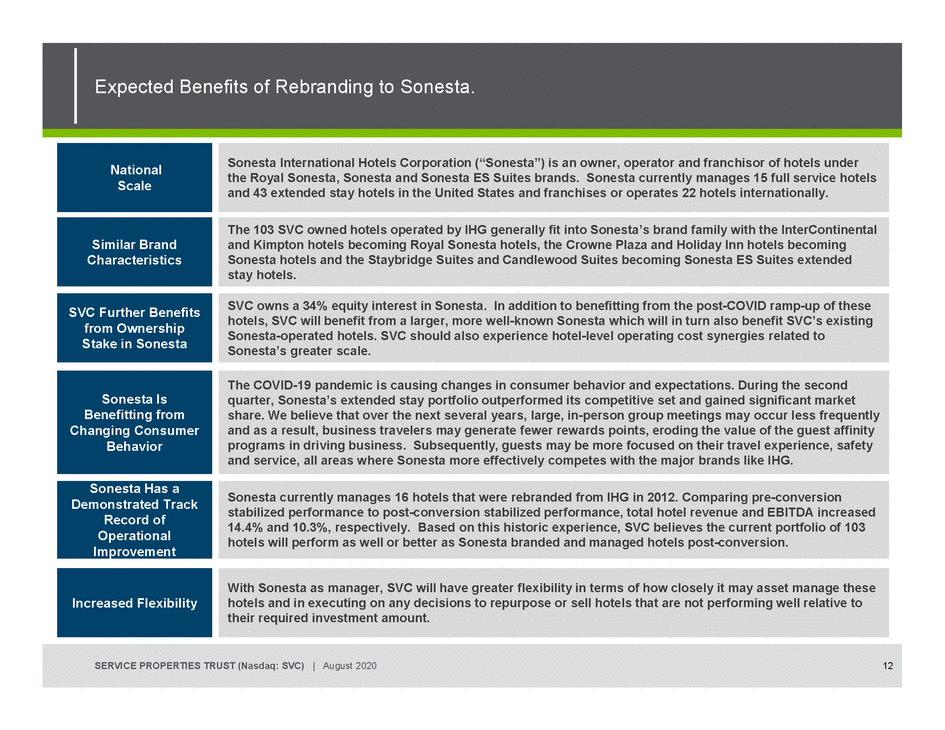 |
National Scale Sonesta International Hotels Corporation (“Sonesta”) is an owner, operator and franchisor of hotels under the Royal Sonesta, Sonesta and Sonesta ES Suites brands. Sonesta currently manages 15 full service hotels and 43 extended stay hotels in the United States and franchises or operates 22 hotels internationally. Similar Brand Characteristics SVC Further Benefits from Ownership Stake in Sonesta The 103 SVC owned hotels operated by IHG generally fit into Sonesta’s brand family with the InterContinental and Kimpton hotels becoming Royal Sonesta hotels, the Crowne Plaza and Holiday Inn hotels becoming Sonesta hotels and the Staybridge Suites and Candlewood Suites becoming Sonesta ES Suites extended stay hotels. SVC owns a 34% equity interest in Sonesta. In addition to benefitting from the post-COVID ramp-up of these hotels, SVC will benefit from a larger, more well-known Sonesta which will in turn also benefit SVC’s existing Sonesta-operated hotels. SVC should also experience hotel-level operating cost synergies related to Sonesta’s greater scale. Sonesta Is Benefitting from Changing Consumer Behavior The COVID-19 pandemic is causing changes in consumer behavior and expectations. During the second quarter, Sonesta’s extended stay portfolio outperformed its competitive set and gained significant market share. We believe that over the next several years, large, in-person group meetings may occur less frequently and as a result, business travelers may generate fewer rewards points, eroding the value of the guest affinity programs in driving business. Subsequently, guests may be more focused on their travel experience, safety and service, all areas where Sonesta more effectively competes with the major brands like IHG. Sonesta Has a Demonstrated Track Record of Operational Improvement Sonesta currently manages 16 hotels that were rebranded from IHG in 2012. Comparing pre-conversion stabilized performance to post-conversion stabilized performance, total hotel revenue and EBITDA increased 14.4% and 10.3%, respectively. Based on this historic experience, SVC believes the current portfolio of 103 hotels will perform as well or better as Sonesta branded and managed hotels post-conversion. Increased Flexibility With Sonesta as manager, SVC will have greater flexibility in terms of how closely it may asset manage these hotels and in executing on any decisions to repurpose or sell hotels that are not performing well relative to their required investment amount. SERVICE PROPERTIES TRUST (Nasdaq: SVC) | August 202012 |
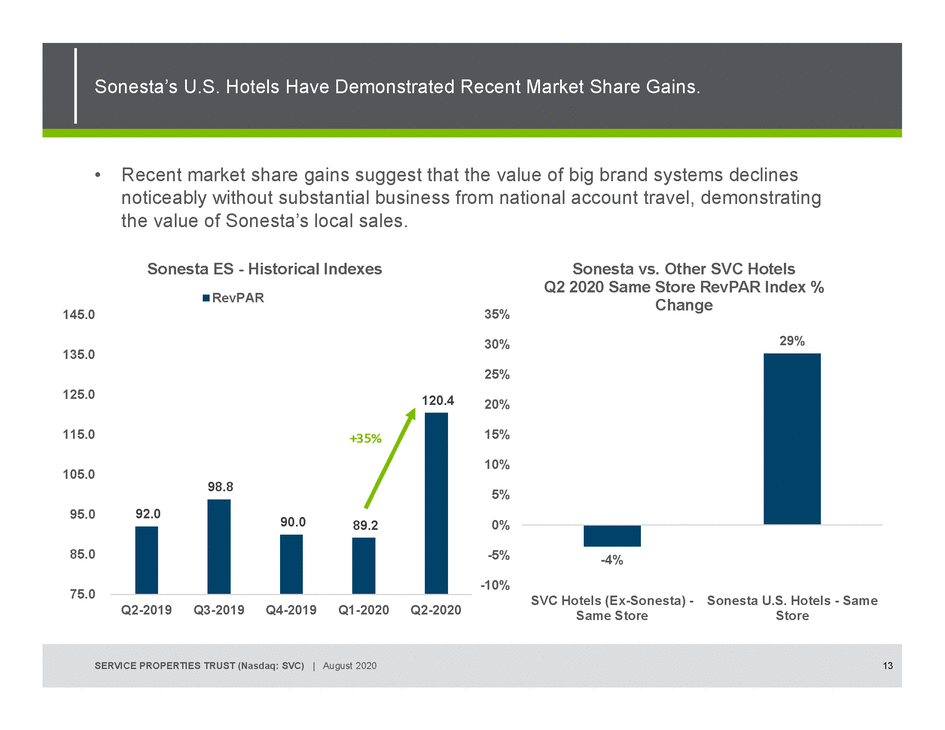 |
•Recent market share gains suggest that the value of big brand systems declines noticeably without substantial business from national account travel, demonstrating the value of Sonesta’s local sales. 145.0 135.0 125.0 115.0 105.0 Sonesta ES - Historical Indexes RevPAR +35% 98.8 120.4 35% 30% 25% 20% 15% 10% 5% Sonesta vs. Other SVC Hotels Q2 2020 Same Store RevPAR Index % Change 95.0 85.0 75.0 92.0 90.089.2 0% -5% -10% -4% SVC Hotels (Ex-Sonesta) - Sonesta U.S. Hotels - Same Q2-2019Q3-2019Q4-2019Q1-2020Q2-2020 Same Store Store SERVICE PROPERTIES TRUST (Nasdaq: SVC) | August 202013 |
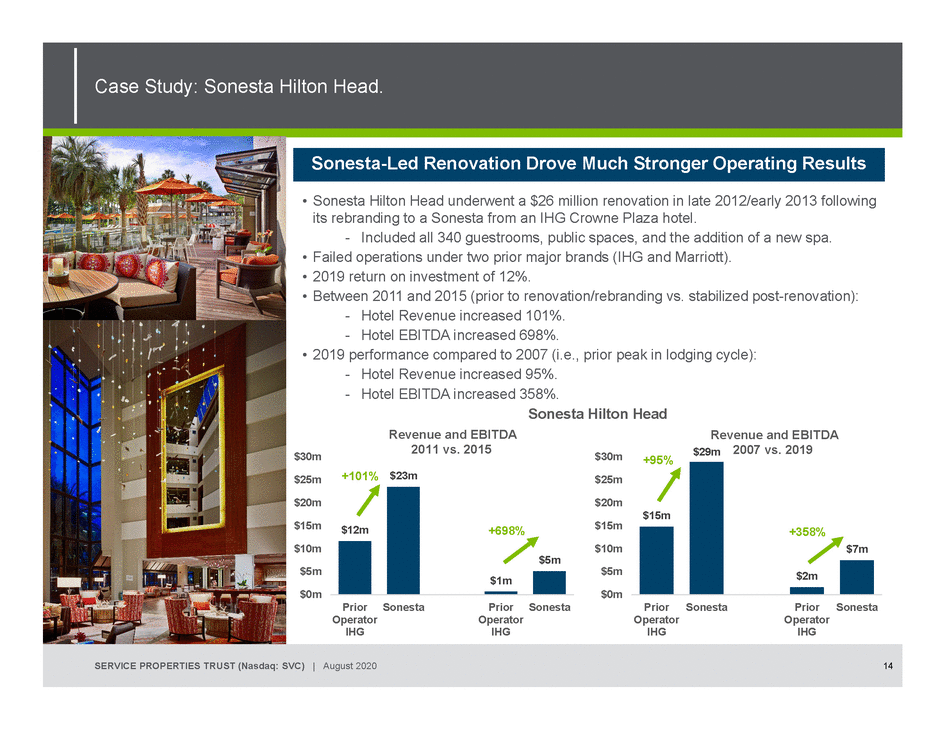 |
Case Study: Sonesta Hilton Head. Sonesta-Led Renovation Drove Much Stronger Operating Results • Sonesta Hilton Head underwent a $26 million renovation in late 2012/early 2013 following its rebranding to a Sonesta from an IHG Crowne Plaza hotel. - Included all 340 guestrooms, public spaces, and the addition of a new spa. • Failed operations under two prior major brands (IHG and Marriott). • 2019 return on investment of 12%. • Between 2011 and 2015 (prior to renovation/rebranding vs. stabilized post-renovation): - Hotel Revenue increased 101%. - Hotel EBITDA increased 698%. • 2019 performance compared to 2007 (i.e., prior peak in lodging cycle): - Hotel Revenue increased 95%. - Hotel EBITDA increased 358%. Sonesta Hilton Head Revenue and EBITDA Revenue and EBITDA $30m $25m +101% 2011 vs. 2015 $23m $30m $25m +95% $29m 2007 vs. 2019 $20m $15m $10m $5m $0m $12m Prior Operator IHG +698% $1m SonestaPrior Operator IHG $5m Sonesta $20m $15m $10m $5m $0m $15m Prior Operator IHG +358% $2m SonestaPrior Operator IHG $7m Sonesta SERVICE PROPERTIES TRUST (Nasdaq: SVC) | August 202014 |
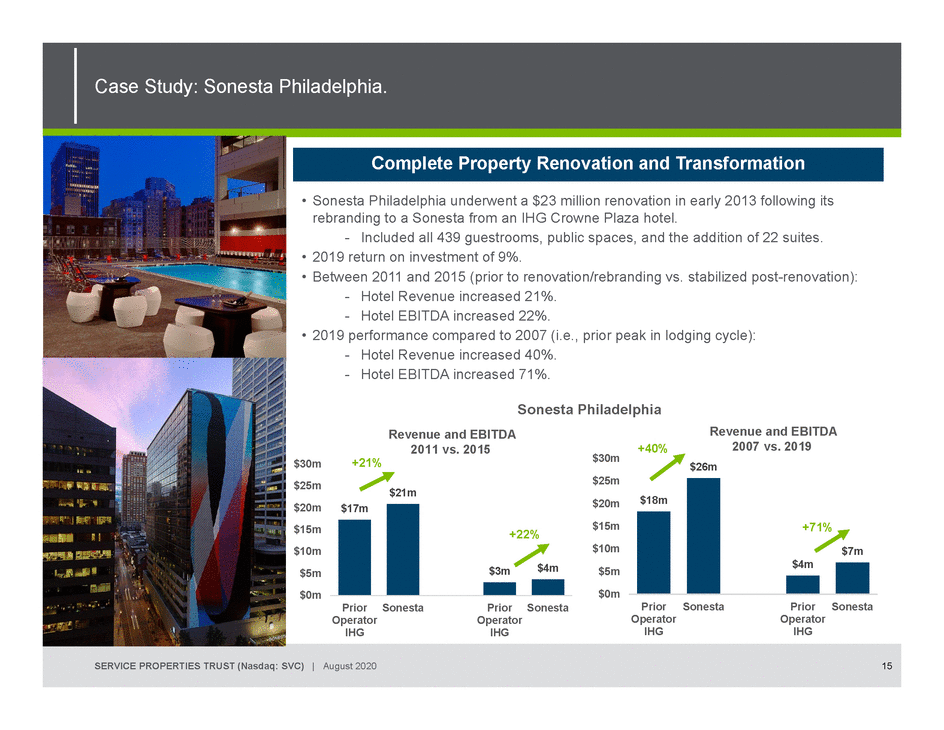 |
Case Study: Sonesta Philadelphia. Complete Property Renovation and Transformation • Sonesta Philadelphia underwent a $23 million renovation in early 2013 following its rebranding to a Sonesta from an IHG Crowne Plaza hotel. - Included all 439 guestrooms, public spaces, and the addition of 22 suites. • 2019 return on investment of 9%. • Between 2011 and 2015 (prior to renovation/rebranding vs. stabilized post-renovation): - Hotel Revenue increased 21%. - Hotel EBITDA increased 22%. • 2019 performance compared to 2007 (i.e., prior peak in lodging cycle): - Hotel Revenue increased 40%. - Hotel EBITDA increased 71%. $30m $25m +21% Revenue and EBITDA 2011 vs. 2015 $21m Sonesta Philadelphia +40% $30m $25m Revenue and EBITDA 2007 vs. 2019 $26m $20m $15m $10m $5m $0m $17m +22% $3m$4m $20m $15m $10m $5m $0m $18m +71% $4m $7m Prior Operator IHG SonestaPrior Operator IHG Sonesta Prior Operator IHG SonestaPrior Operator IHG Sonesta SERVICE PROPERTIES TRUST (Nasdaq: SVC) | August 202015 |
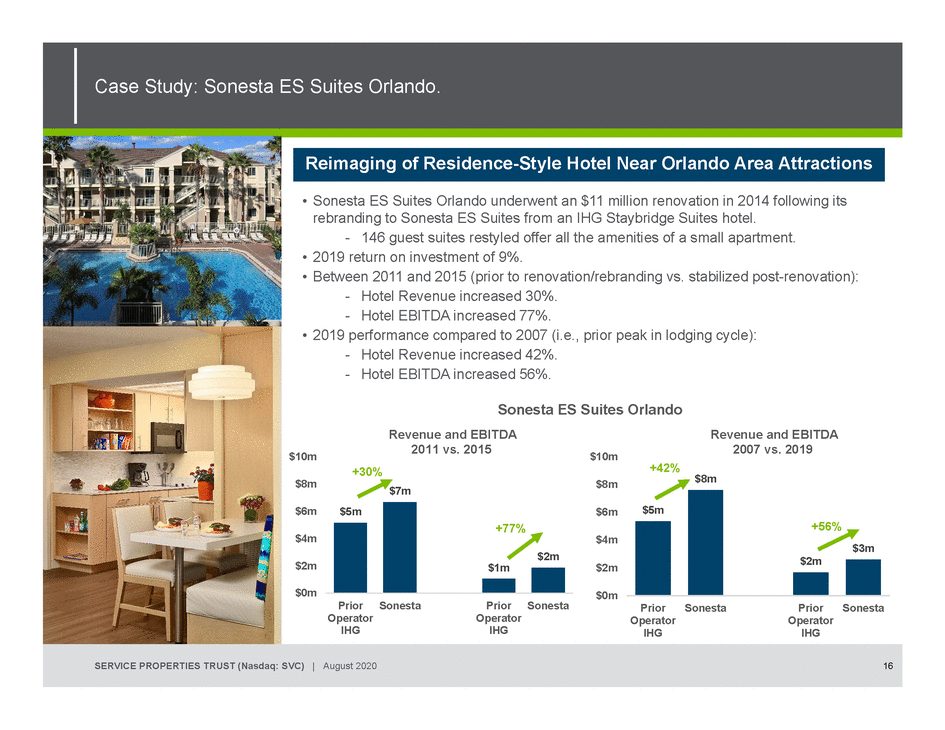 |
Case Study: Sonesta ES Suites Orlando. Reimaging of Residence-Style Hotel Near Orlando Area Attractions • Sonesta ES Suites Orlando underwent an $11 million renovation in 2014 following its rebranding to Sonesta ES Suites from an IHG Staybridge Suites hotel. - 146 guest suites restyled offer all the amenities of a small apartment. • 2019 return on investment of 9%. • Between 2011 and 2015 (prior to renovation/rebranding vs. stabilized post-renovation): - Hotel Revenue increased 30%. - Hotel EBITDA increased 77%. • 2019 performance compared to 2007 (i.e., prior peak in lodging cycle): - Hotel Revenue increased 42%. - Hotel EBITDA increased 56%. Sonesta ES Suites Orlando Revenue and EBITDA Revenue and EBITDA $10m $8m $6m $4m +30% $5m $7m 2011 vs. 2015 +77% $2m $10m $8m $6m $4m +42% $5m $8m 2007 vs. 2019 +56% $3m $2m $1m $2m $2m $0m Prior Operator IHG SonestaPrior Operator IHG Sonesta $0m Prior Operator IHG SonestaPrior Operator IHG Sonesta SERVICE PROPERTIES TRUST (Nasdaq: SVC) | August 202016 |
 |
Net Lease Portfolio SERVICE PROPERTIES TRUST (Nasdaq: SVC) | August 2020 |
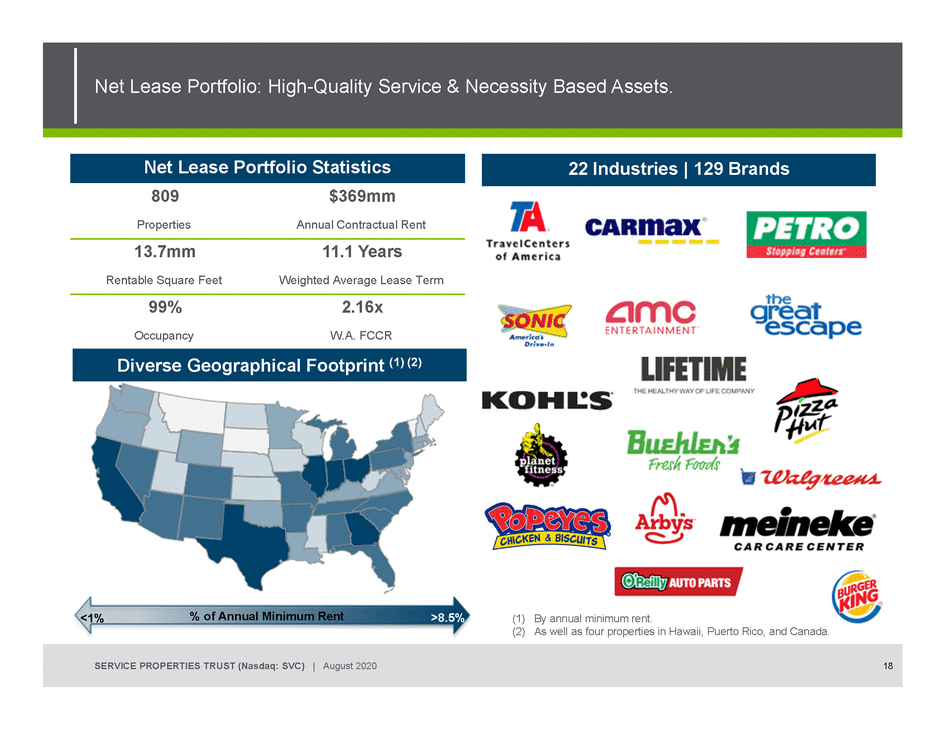 |
Net Lease Portfolio Statistics 809$369mm PropertiesAnnual Contractual Rent 13.7mm11.1 Years Rentable Square FeetWeighted Average Lease Term 99%2.16x OccupancyW.A. FCCR Diverse Geographical Footprint (1) (2) 22 Industries | 129 Brands <1% % of Annual Minimum Rent >8.5% (1) By annual minimum rent. (2) As well as four properties in Hawaii, Puerto Rico, and Canada. SERVICE PROPERTIES TRUST (Nasdaq: SVC) | August 202018 |
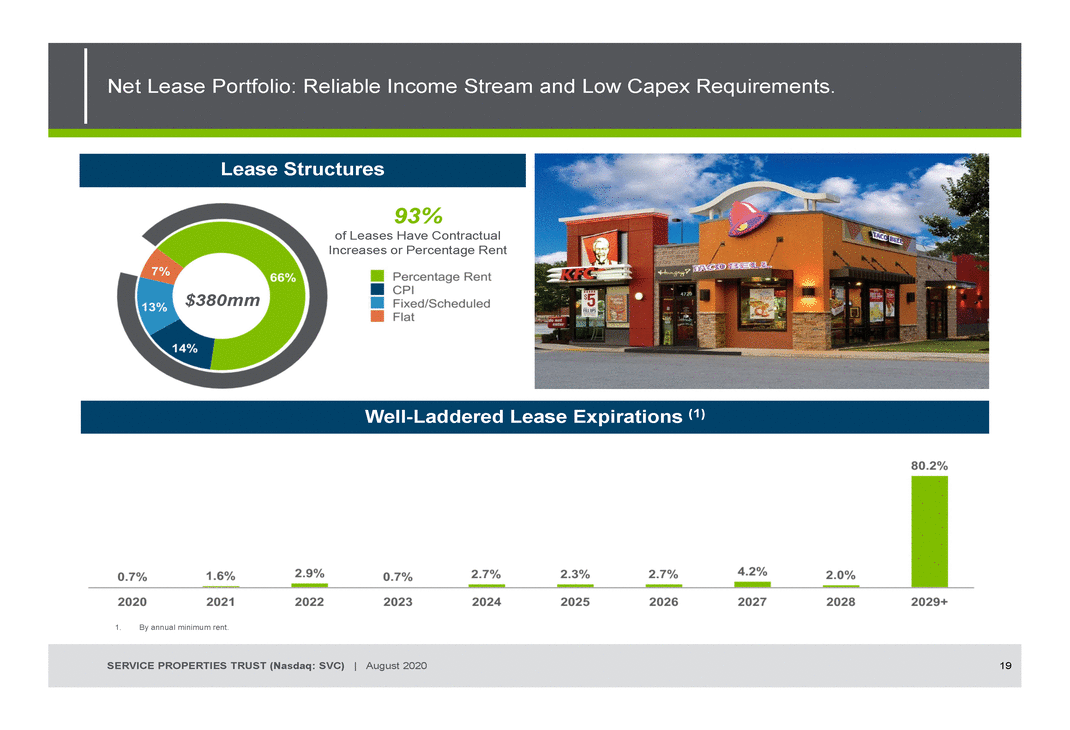 |
Lease Structures 93% of Leases Have Contractual Increases or Percentage Rent $380mm Well-Laddered Lease Expirations (1) 1.By annual minimum rent. SERVICE PROPERTIES TRUST (Nasdaq: SVC) | August 202019 |
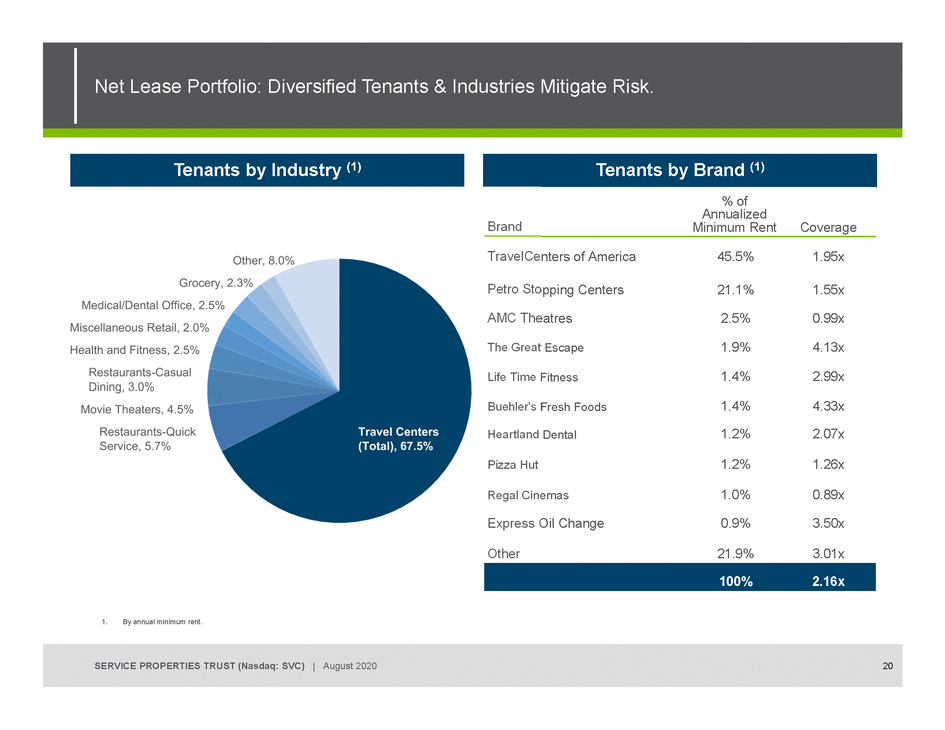 |
Brand TravelCe Petro Sto AMC The The Great Life Time Buehler's Heartland Pizza Hut Regal Cin Express O Other Tenants by Brand (1) SERVICE PROPERTIES TRUST (Nasdaq: SVC) | August 202020 |
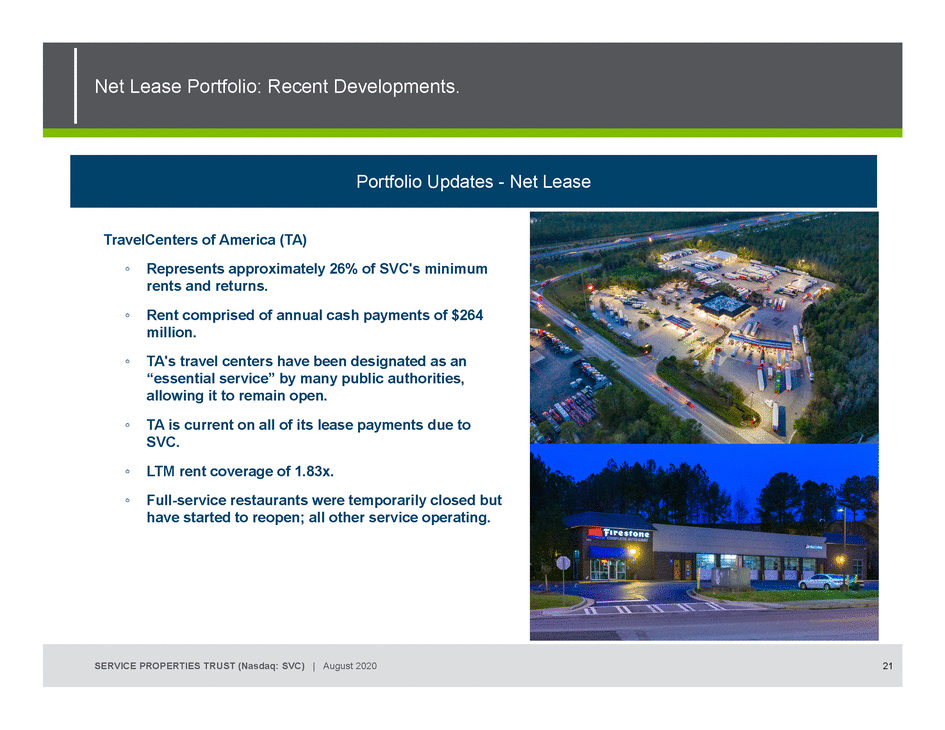 |
Portfolio Updates - Net Lease TravelCenters of America (TA) ◦Represents approximately 26% of SVC's minimum rents and returns. ◦Rent comprised of annual cash payments of $264 million. ◦TA's travel centers have been designated as an “essential service” by many public authorities, allowing it to remain open. ◦TA is current on all of its lease payments due to SVC. ◦LTM rent coverage of 1.83x. ◦Full-service restaurants were temporarily closed but have started to reopen; all other service operating. SERVICE PROPERTIES TRUST (Nasdaq: SVC) | August 202021 |
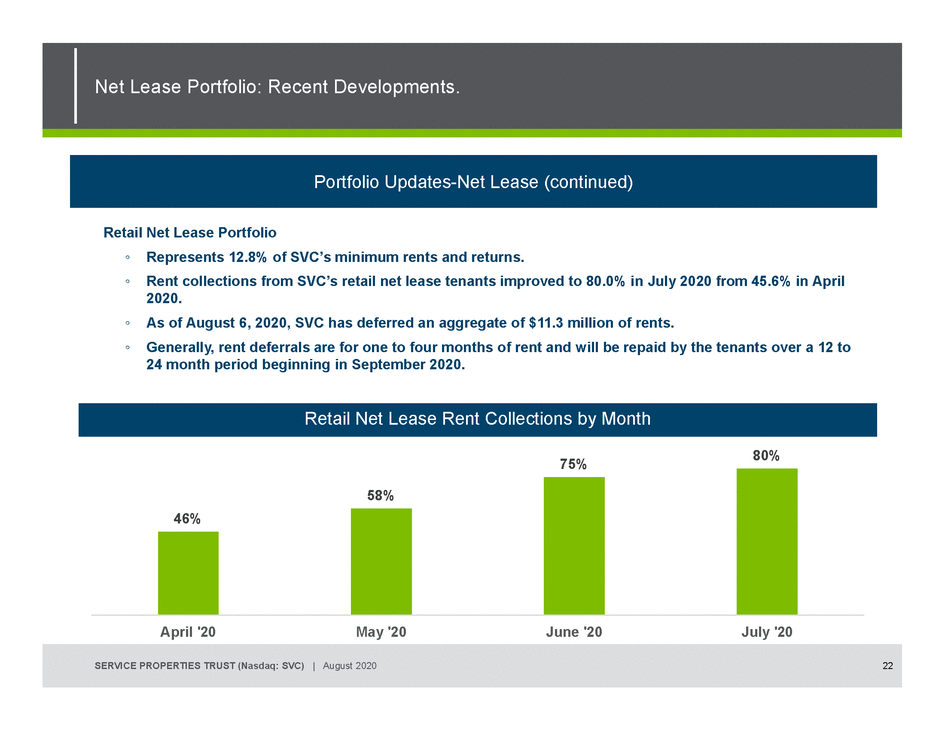 |
Portfolio Updates-Net Lease (continued) Retail Net Lease Portfolio ◦Represents 12.8% of SVC’s minimum rents and returns. ◦Rent collections from SVC’s retail net lease tenants improved to 80.0% in July 2020 from 45.6% in April 2020. ◦As of August 6, 2020, SVC has deferred an aggregate of $11.3 million of rents. ◦Generally, rent deferrals are for one to four months of rent and will be repaid by the tenants over a 12 to 24 month period beginning in September 2020. Retail Net Lease Rent Collections by Month 75%80% 46% 58% April '20May '20June '20July '20 SERVICE PROPERTIES TRUST (Nasdaq: SVC) | August 202022 |
 |
Financial Information SERVICE PROPERTIES TRUST (Nasdaq: SVC) | August 2020 |
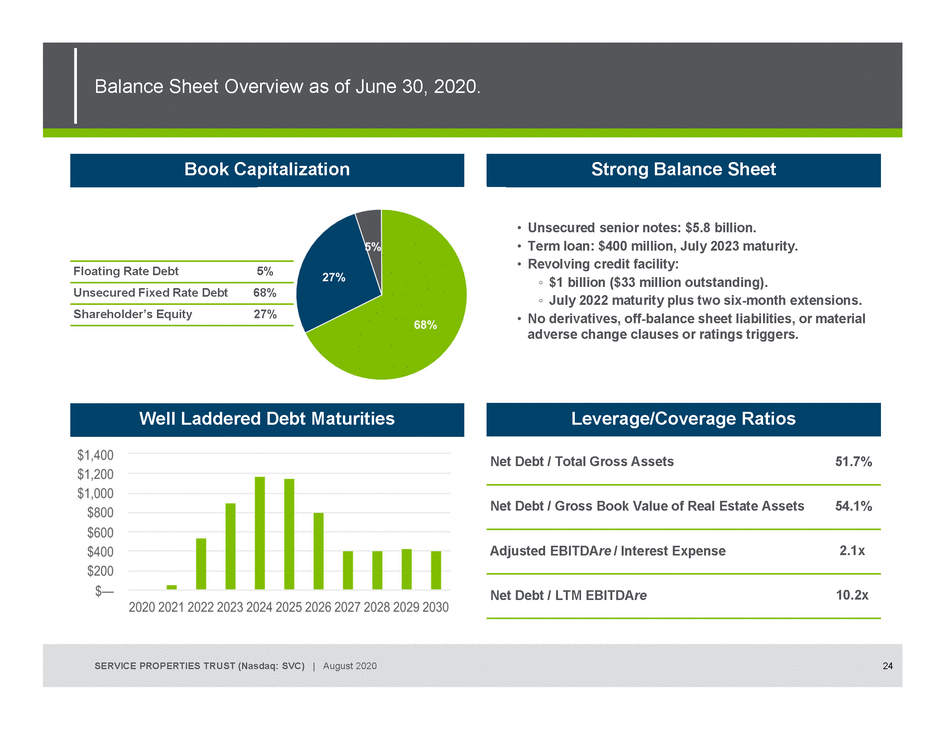 |
Book Capitalization Floating Rate Debt 5% Unsecured Fixed Rate Debt 68% Shareholder’s Equity 27% Strong Balance Sheet • Unsecured senior notes: $5.8 billion. • Term loan: $400 million, July 2023 maturity. • Revolving credit facility: ◦ $1 billion ($33 million outstanding). ◦ July 2022 maturity plus two six-month extensions. • No derivatives, off-balance sheet liabilities, or material adverse change clauses or ratings triggers. Well Laddered Debt Maturities Leverage/Coverage Ratios Net Debt / Total Gross Assets 51.7% Net Debt / Gross Book Value of Real Estate Assets 54.1% Adjusted EBITDAre / Interest Expense 2.1x Net Debt / LTM EBITDAre 10.2x SERVICE PROPERTIES TRUST (Nasdaq: SVC) | August 202024 |
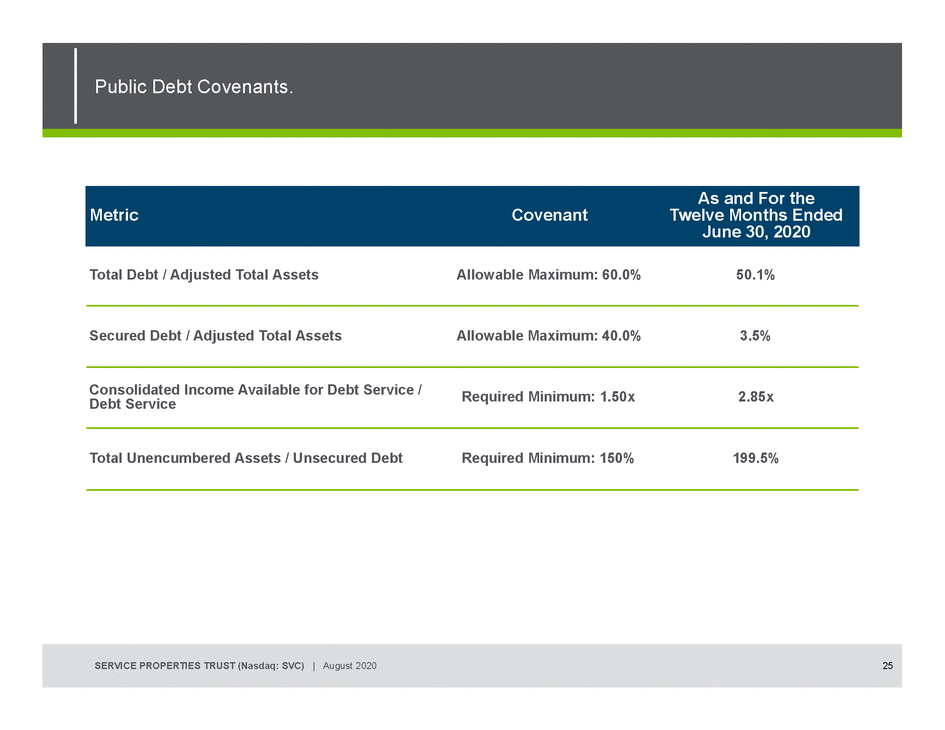 |
MetricCovenant As and For the Twelve Months Ended June 30, 2020 Total Debt / Adjusted Total AssetsAllowable Maximum: 60.0%50.1% Required Minimum: 1.50x2.85x Debt Service Total Unencumbered Assets / Unsecured DebtRequired Minimum: 150%199.5% SERVICE PROPERTIES TRUST (Nasdaq: SVC) | August 202025 |
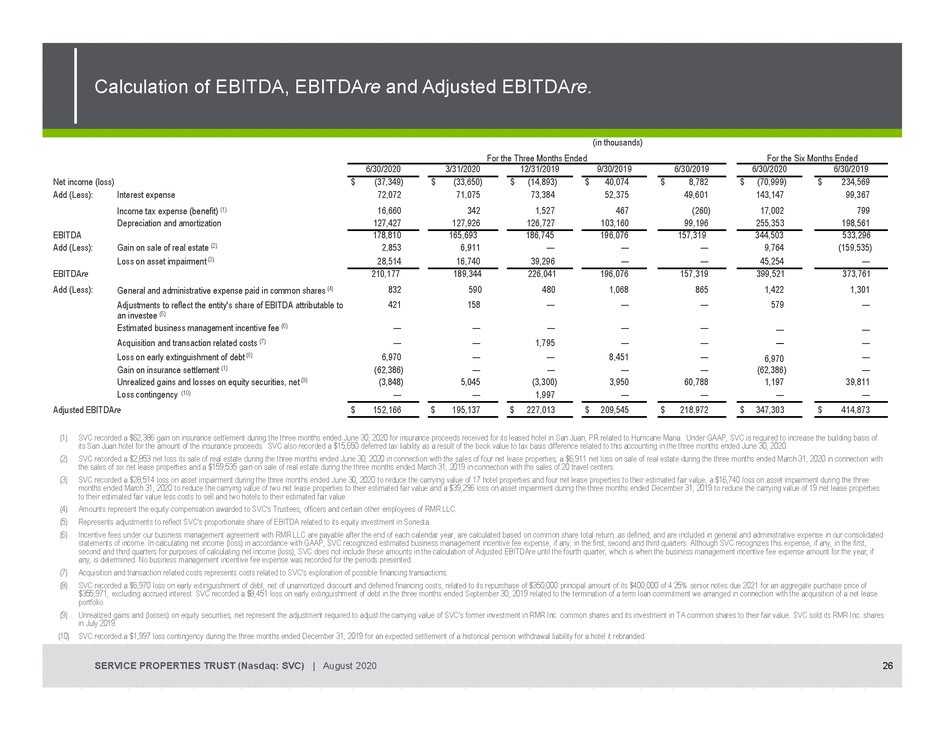 |
(in thousands) For the Three Months EndedFor the Six Months Ended 6/30/20203/31/202012/31/20199/30/20196/30/20196/30/20206/30/2019 Add (Less): Interest expense 72,072 71,075 73,384 52,375 49,601 143,147 99,367 Income tax expense (benefit) (1) 16,660 342 1,527 467 (260) 17,002 799 Depreciation and amortization 127,427 127,926 126,727 103,160 99,196 255,353 198,561 EBITDA 178,810 165,693 186,745 196,076 157,319 344,503 533,296 Add (Less): Gain on sale of real estate (2) 2,853 6,911 — — — 9,764 (159,535) Loss on asset impairment (3) 28,514 16,740 39,296 — — 45,254 — EBITDAre 210,177 189,344 226,041 196,076 157,319 399,521 373,761 Add (Less): General and administrative expense paid in common shares (4) 832 590 480 1,068 865 1,422 1,301 Adjustments to reflect the entity's share of EBITDA attributable to an investee (5) 421 158 — — — 579 — Estimated business management incentive fee (6) — — — — — — — Acquisition and transaction related costs (7) — — 1,795 — — — — Loss on early extinguishment of debt (8) 6,970 — — 8,451 — 6,970 — Gain on insurance settlement (1) (62,386) — — — — (62,386) — Unrealized gains and losses on equity securities, net (9) (3,848) 5,045 (3,300) 3,950 60,788 1,197 39,811 Loss contingency (10) — — 1,997 — — — — Adjusted EBIT Are $152,166 $195,137 $227,013 $ 209,545 $218,972 $ 347,303 $414,873 D (1) SVC recorded a $62,386 gain on insurance settlement during the three months ended June 30, 2020 for insurance proceeds received for its leased hotel in San Juan, PR related to Hurricane Maria. Under GAAP, SVC is required to increase the building basis of its San Juan hotel for the amount of the insurance proceeds. SVC also recorded a $15,650 deferred tax liability as a result of the book value to tax basis difference related to this accounting in the three months ended June 30, 2020. (2) SVC recorded a $2,853 net loss its sale of real estate during the three months ended June 30, 2020 in connection with the sales of four net lease properties, a $6,911 net loss on sale of real estate during the three months ended March 31, 2020 in connection with the sales of six net lease properties and a $159,535 gain on sale of real estate during the three months ended March 31, 2019 in connection with the sales of 20 travel centers. (3) SVC recorded a $28,514 loss on asset impairment during the three months ended June 30, 2020 to reduce the carrying value of 17 hotel properties and four net lease properties to their estimated fair value, a $16,740 loss on asset impairment during the three months ended March 31, 2020 to reduce the carrying value of two net lease properties to their estimated fair value and a $39,296 loss on asset impairment during the three months ended December 31, 2019 to reduce the carrying value of 19 net lease properties to their estimated fair value less costs to sell and two hotels to their estimated fair value. (4) Amounts represent the equity compensation awarded to SVC's Trustees, officers and certain other employees of RMR LLC. (5) Represents adjustments to reflect SVC's proportionate share of EBITDA related to its equity investment in Sonesta. (6) Incentive fees under our business management agreement with RMR LLC are payable after the end of each calendar year, are calculated based on common share total return, as defined, and are included in general and administrative expense in our consolidated statements of income. In calculating net income (loss) in accordance with GAAP, SVC recognized estimated business management incentive fee expense, if any, in the first, second and third quarters. Although SVC recognizes this expense, if any, in the first, second and third quarters for purposes of calculating net income (loss), SVC does not include these amounts in the calculation of Adjusted EBITDAre until the fourth quarter, which is when the business management incentive fee expense amount for the year, if any, is determined. No business management incentive fee expense was recorded for the periods presented. (7) Acquisition and transaction related costs represents costs related to SVC's exploration of possible financing transactions. (8) SVC recorded a $6,970 loss on early extinguishment of debt, net of unamortized discount and deferred financing costs, related to its repurchase of $350,000 principal amount of its $400,000 of 4.25% senior notes due 2021 for an aggregate purchase price of $355,971, excluding accrued interest. SVC recorded a $8,451 loss on early extinguishment of debt in the three months ended September 30, 2019 related to the termination of a term loan commitment we arranged in connection with the acquisition of a net lease portfolio. (9) Unrealized gains and (losses) on equity securities, net represent the adjustment required to adjust the carrying value of SVC's former investment in RMR Inc. common shares and its investment in TA common shares to their fair value. SVC sold its RMR Inc. shares in July 2019. (10) SVC recorded a $1,997 loss contingency during the three months ended December 31, 2019 for an expected settlement of a historical pension withdrawal liability for a hotel it rebranded. SERVICE PROPERTIES TRUST (Nasdaq: SVC) | August 202026 |
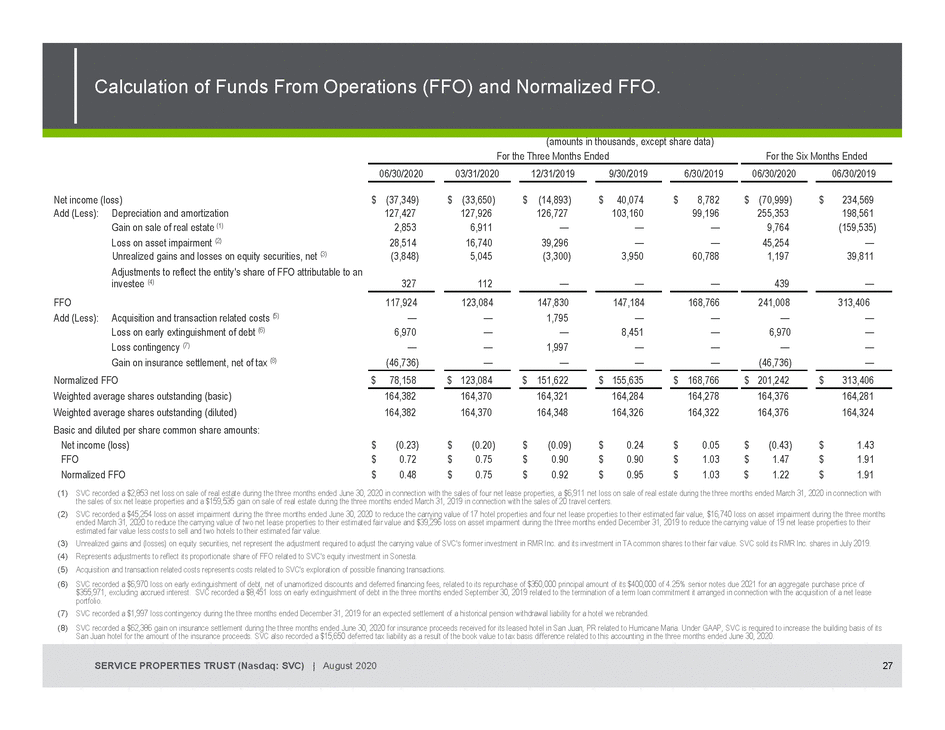 |
(amounts in thousands, except share data) For the Three Months EndedFor the Six Months Ended 06/30/202003/31/202012/31/20199/30/20196/30/201906/30/202006/30/2019 Net income (loss)$ (37,349)$ (33,650)$ (14,893)$40,074$8,782$ (70,999)$234,569 Add (Less):Depreciation and amortization127,427127,926126,727103,16099,196255,353198,561 Gain on sale of real estate (1) 2,853 6,911 — — — 9,764 (159,535) Loss on asset impairment (2) 28,514 16,740 39,296 — — 45,254 — Unrealized gains and losses on equity securities, net (3) (3,848) 5,045 (3,300) 3,950 60,788 1,197 39,811 Adjustments to reflect the entity's share of FFO attributable to an investee (4) 327 112 — — — 439 — FFO117,924123,084147,830147,184168,766241,008313,406 Add (Less): Acquisition and transaction related costs (5) — — 1,795 — — — — Loss on early extinguishment of debt (6) 6,970 — — 8,451 — 6,970 — Loss contingency (7) — — 1,997 — — — — Gain on insurance settlement, net of tax (8) (46,736) — — — — (46,736) — Normalized FFO$78,158$ 123,084$ 151,622$ 155,635$ 168,766$ 201,242$313,406 Weighted average shares outstanding (basic)164,382164,370164,321164,284164,278164,376164,281 Weighted average shares outstanding (diluted)164,382164,370164,348164,326164,322164,376164,324 Basic and diluted per share common share amounts: Net income (loss)$(0.23)$(0.20)$(0.09)$0.24$0.05$(0.43)$1.43 FFO$0.72$0.75$0.90$0.90$1.03$1.47$1.91 Normalized FFO$0.48$0.75$0.92$0.95$1.03$1.22$1.91 (1) SVC recorded a $2,853 net loss on sale of real estate during the three months ended June 30, 2020 in connection with the sales of four net lease properties, a $6,911 net loss on sale of real estate during the three months ended March 31, 2020 in connection with the sales of six net lease properties and a $159,535 gain on sale of real estate during the three months ended March 31, 2019 in connection with the sales of 20 travel centers. (2) SVC recorded a $45,254 loss on asset impairment during the three months ended June 30, 2020 to reduce the carrying value of 17 hotel properties and four net lease properties to their estimated fair value, $16,740 loss on asset impairment during the three months ended March 31, 2020 to reduce the carrying value of two net lease properties to their estimated fair value and $39,296 loss on asset impairment during the three months ended December 31, 2019 to reduce the carrying value of 19 net lease properties to their estimated fair value less costs to sell and two hotels to their estimated fair value. (3) Unrealized gains and (losses) on equity securities, net represent the adjustment required to adjust the carrying value of SVC's former investment in RMR Inc. and its investment in TA common shares to their fair value. SVC sold its RMR Inc. shares in July 2019. (4) Represents adjustments to reflect its proportionate share of FFO related to SVC's equity investment in Sonesta. (5) Acquisition and transaction related costs represents costs related to SVC's exploration of possible financing transactions. (6) SVC recorded a $6,970 loss on early extinguishment of debt, net of unamortized discounts and deferred financing fees, related to its repurchase of $350,000 principal amount of its $400,000 of 4.25% senior notes due 2021 for an aggregate purchase price of $355,971, excluding accrued interest. SVC recorded a $8,451 loss on early extinguishment of debt in the three months ended September 30, 2019 related to the termination of a term loan commitment it arranged in connection with the acquisition of a net lease portfolio. (7) SVC recorded a $1,997 loss contingency during the three months ended December 31, 2019 for an expected settlement of a historical pension withdrawal liability for a hotel we rebranded. (8) SVC recorded a $62,386 gain on insurance settlement during the three months ended June 30, 2020 for insurance proceeds received for its leased hotel in San Juan, PR related to Hurricane Maria. Under GAAP, SVC is required to increase the building basis of its San Juan hotel for the amount of the insurance proceeds. SVC also recorded a $15,650 deferred tax liability as a result of the book value to tax basis difference related to this accounting in the three months ended June 30, 2020. SERVICE PROPERTIES TRUST (Nasdaq: SVC) | August 202027 |
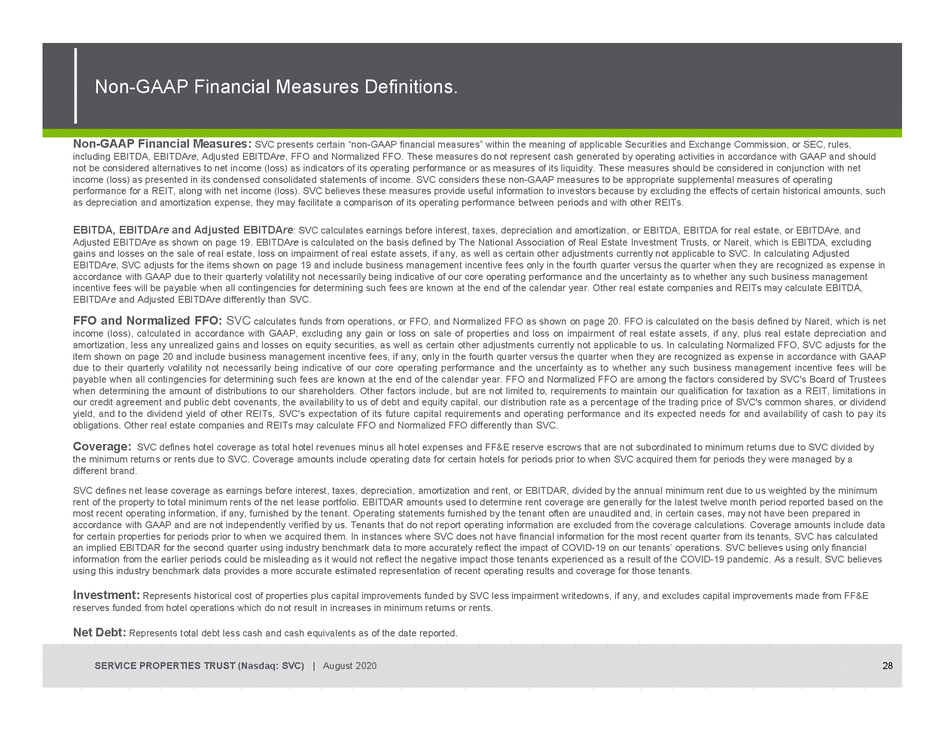 |
Non-GAAP Financial Measures: SVC presents certain “non-GAAP financial measures” within the meaning of applicable Securities and Exchange Commission, or SEC, rules, including EBITDA, EBITDAre, Adjusted EBITDAre, FFO and Normalized FFO. These measures do not represent cash generated by operating activities in accordance with GAAP and should not be considered alternatives to net income (loss) as indicators of its operating performance or as measures of its liquidity. These measures should be considered in conjunction with net income (loss) as presented in its condensed consolidated statements of income. SVC considers these non-GAAP measures to be appropriate supplemental measures of operating performance for a REIT, along with net income (loss). SVC believes these measures provide useful information to investors because by excluding the effects of certain historical amounts, such as depreciation and amortization expense, they may facilitate a comparison of its operating performance between periods and with other REITs. EBITDA, EBITDAre and Adjusted EBITDAre: SVC calculates earnings before interest, taxes, depreciation and amortization, or EBITDA, EBITDA for real estate, or EBITDAre, and Adjusted EBITDAre as shown on page 19. EBITDAre is calculated on the basis defined by The National Association of Real Estate Investment Trusts, or Nareit, which is EBITDA, excluding gains and losses on the sale of real estate, loss on impairment of real estate assets, if any, as well as certain other adjustments currently not applicable to SVC. In calculating Adjusted EBITDAre, SVC adjusts for the items shown on page 19 and include business management incentive fees only in the fourth quarter versus the quarter when they are recognized as expense in accordance with GAAP due to their quarterly volatility not necessarily being indicative of our core operating performance and the uncertainty as to whether any such business management incentive fees will be payable when all contingencies for determining such fees are known at the end of the calendar year. Other real estate companies and REITs may calculate EBITDA, EBITDAre and Adjusted EBITDAre differently than SVC. FFO and Normalized FFO: SVC calculates funds from operations, or FFO, and Normalized FFO as shown on page 20. FFO is calculated on the basis defined by Nareit, which is net income (loss), calculated in accordance with GAAP, excluding any gain or loss on sale of properties and loss on impairment of real estate assets, if any, plus real estate depreciation and amortization, less any unrealized gains and losses on equity securities, as well as certain other adjustments currently not applicable to us. In calculating Normalized FFO, SVC adjusts for the item shown on page 20 and include business management incentive fees, if any, only in the fourth quarter versus the quarter when they are recognized as expense in accordance with GAAP due to their quarterly volatility not necessarily being indicative of our core operating performance and the uncertainty as to whether any such business management incentive fees will be payable when all contingencies for determining such fees are known at the end of the calendar year. FFO and Normalized FFO are among the factors considered by SVC's Board of Trustees when determining the amount of distributions to our shareholders. Other factors include, but are not limited to, requirements to maintain our qualification for taxation as a REIT, limitations in our credit agreement and public debt covenants, the availability to us of debt and equity capital, our distribution rate as a percentage of the trading price of SVC's common shares, or dividend yield, and to the dividend yield of other REITs, SVC's expectation of its future capital requirements and operating performance and its expected needs for and availability of cash to pay its obligations. Other real estate companies and REITs may calculate FFO and Normalized FFO differently than SVC. Coverage: SVC defines hotel coverage as total hotel revenues minus all hotel expenses and FF&E reserve escrows that are not subordinated to minimum returns due to SVC divided by the minimum returns or rents due to SVC. Coverage amounts include operating data for certain hotels for periods prior to when SVC acquired them for periods they were managed by a different brand. SVC defines net lease coverage as earnings before interest, taxes, depreciation, amortization and rent, or EBITDAR, divided by the annual minimum rent due to us weighted by the minimum rent of the property to total minimum rents of the net lease portfolio. EBITDAR amounts used to determine rent coverage are generally for the latest twelve month period reported based on the most recent operating information, if any, furnished by the tenant. Operating statements furnished by the tenant often are unaudited and, in certain cases, may not have been prepared in accordance with GAAP and are not independently verified by us. Tenants that do not report operating information are excluded from the coverage calculations. Coverage amounts include data for certain properties for periods prior to when we acquired them. In instances where SVC does not have financial information for the most recent quarter from its tenants, SVC has calculated an implied EBITDAR for the second quarter using industry benchmark data to more accurately reflect the impact of COVID-19 on our tenants’ operations. SVC believes using only financial information from the earlier periods could be misleading as it would not reflect the negative impact those tenants experienced as a result of the COVID-19 pandemic. As a result, SVC believes using this industry benchmark data provides a more accurate estimated representation of recent operating results and coverage for those tenants. Investment: Represents historical cost of properties plus capital improvements funded by SVC less impairment writedowns, if any, and excludes capital improvements made from FF&E reserves funded from hotel operations which do not result in increases in minimum returns or rents. Net Debt: Represents total debt less cash and cash equivalents as of the date reported. SERVICE PROPERTIES TRUST (Nasdaq: SVC) | August 2020 2828 |
 |
Management Platform SERVICE PROPERTIES TRUST (Nasdaq: SVC) | August 2020 |
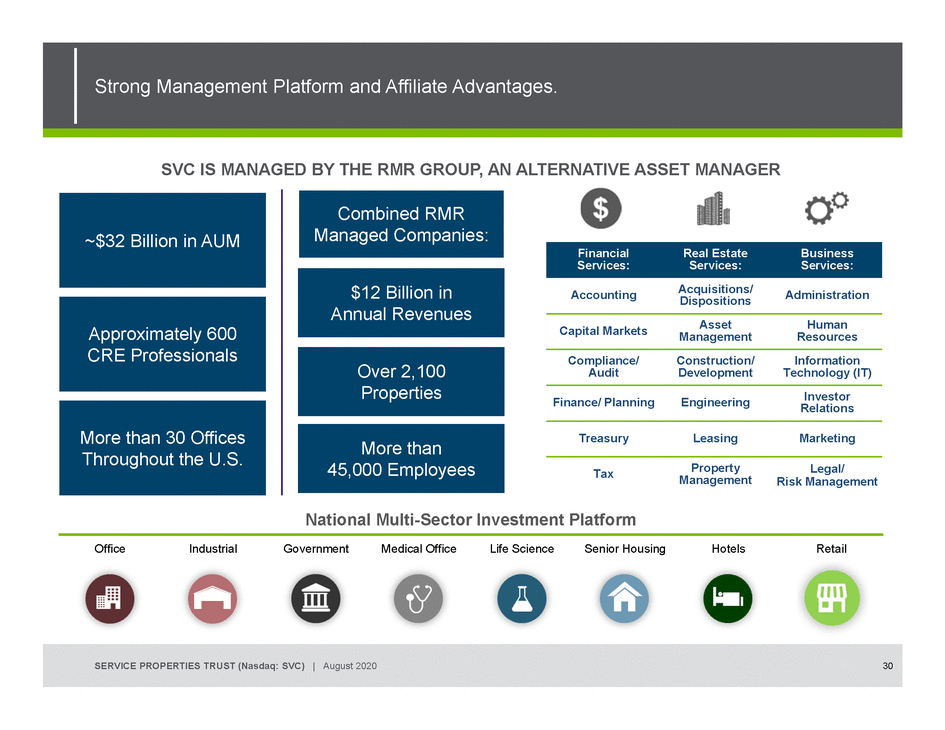 |
SVC IS MANAGED BY THE RMR GROUP, AN ALTERNATIVE ASSET MANAGER ~$32 Billion in AUM Financial Services: Real Estate Services: Business Services: $12 Billion in Annual Revenues AccountingAcquisitions/ Management Capital MarketsAsset Human Resources CRE Professionals Over 2,100 Compliance/ Audit Construction/ Development Information Technology (IT) More than 30 Offices Properties More than Relations TreasuryLeasingMarketing Throughout the U.S. 45,000 Employees Tax Management Legal/ Risk Management National Multi-Sector Investment Platform OfficeIndustrialGovernmentMedical OfficeLife ScienceSenior HousingHotelsRetail SERVICE PROPERTIES TRUST (Nasdaq: SVC) | August 2020 3030 |
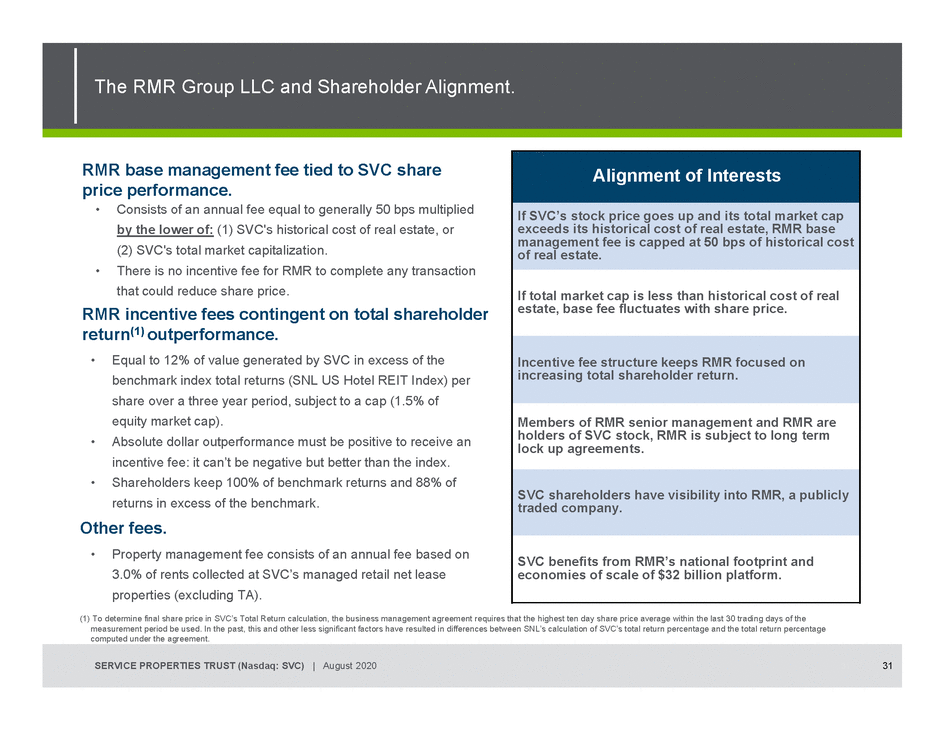 |
Alignment of Interests If SVC’s stock price goes up and its total market cap exceeds its historical cost of real estate, RMR base management fee is capped at 50 bps of historical cost of real estate. If total market cap is less than historical cost of real estate, base fee fluctuates with share price. Incentive fee structure keeps RMR focused on increasing total shareholder return. Members of RMR senior management and RMR are holders of SVC stock, RMR is subject to long term lock up agreements. SVC shareholders have visibility into RMR, a publicly traded company. SVC benefits from RMR’s national footprint and economies of scale of $32 billion platform. •Consists of an annual fee equal to generally 50 bps multiplied by the lower of: (1) SVC's historical cost of real estate, or (2) SVC's total market capitalization. •There is no incentive fee for RMR to complete any transaction that could reduce share price. RMR incentive fees contingent on total shareholder return(1) outperformance. •Equal to 12% of value generated by SVC in excess of the benchmark index total returns (SNL US Hotel REIT Index) per share over a three year period, subject to a cap (1.5% of equity market cap). •Absolute dollar outperformance must be positive to receive an incentive fee: it can’t be negative but better than the index. •Shareholders keep 100% of benchmark returns and 88% of returns in excess of the benchmark. Other fees. •Property management fee consists of an annual fee based on 3.0% of rents collected at SVC’s managed retail net lease properties (excluding TA). (1) To determine final share price in SVC’s Total Return calculation, the business management agreement requires that the highest ten day share price average within the last 30 trading days of the measurement period be used. In the past, this and other less significant factors have resulted in differences between SNL’s calculation of SVC’s total return percentage and the total return percentage computed under the agreement. SERVICE PROPERTIES TRUST (Nasdaq: SVC) | August 2020 3131 |
