Attached files
| file | filename |
|---|---|
| 8-K - 8-K - PROGENITY, INC. | prog-8k_20200813.htm |
| EX-99.1 - EX-99.1 - PROGENITY, INC. | prog-ex991_39.htm |

Business Update and Second Quarter 2020 Financial Results August 13, 2020 Exhibit 99.2
Forward Looking Statements This presentation contains “forward-looking statements” within the meaning of the federal securities laws, which statements are subject to substantial risks and uncertainties and are based on estimates and assumptions. All statements, other than statements of historical facts included in this presentation, including statements concerning our plans, objectives, goals, strategies, future events, future revenues, volumes, margins or performance, financing needs, plans or intentions relating to product candidates, estimates of market size, estimates of volume growth, business trends, the anticipated timing, costs, design and conduct of the development of our product candidates, including our planned clinical trials, the timing and likelihood of regulatory filings and approvals for our product candidates, our ability to commercialize our product candidates, if approved, the pricing and reimbursement of our product candidates, if approved, the potential to develop future product candidates, our ability to enter into partnerships and strategic collaborations, the potential benefits of strategic collaborations and our intent to enter into any strategic arrangements, the timing and likelihood of success, plans and objectives of management for future operations and sales force growth, potential overpayment obligations, and future results of anticipated product development efforts, are forward-looking statements. In some cases, you can identify forward-looking statements by terms such as “may,” “might,” “will,” “objective,” “intend,” “should,” “could,” “can,” “would,” “expect,” “believe,” “design,” “estimate,” “predict,” “potential,” “plan” or the negative of these terms, and similar expressions intended to identify forward-looking statements. These statements involve known and unknown risks, uncertainties and other factors that could cause our actual results to differ materially from the forward-looking statements expressed or implied in this presentation, including those described in “Risk Factors” and “Management’s Discussion and Analysis of Financial Condition and Results of Operations” in our Registration Statement on Form S-1 (File No. 333-238738), as amended, our Quarterly Report on Form 10-Q for the quarter ended June 30, 2020, and elsewhere in such filings and in other subsequent disclosure documents filed with the U.S. Securities and Exchange Commission (SEC). We cannot assure you that we will realize the results, benefits or developments that we expect or anticipate or, even if substantially realized, that they will result in the consequences or affect us or our business in the way expected. Forward-looking statements are not historical facts and reflect our current views with respect to future events. Given the significant uncertainties, you should evaluate all forward-looking statements made in this presentation in the context of these risks and uncertainties and not place undue reliance on these forward-looking statements as predictions of future events. All forward-looking statements in this presentation apply only as of the date made and are expressly qualified in their entirety by the cautionary statements included in this presentation. We disclaim any intent to publicly update or revise any forward-looking statements to reflect subsequent events or circumstances, except as required by law. Industry and Market Data: We obtained the industry, market, and competitive position data used throughout this presentation from our own internal estimates and research, as well as from industry and general publications, and research, surveys, and studies conducted by third parties. Internal estimates are derived from publicly available information released by industry analysts and third-party sources, our internal research and our industry experience, and are based on assumptions made by us based on such data and our knowledge of the industry and market, which we believe to be reasonable. In addition, while we believe the industry, market, and competitive position data included in this presentation is reliable and based on reasonable assumptions, we have not independently verified any third-party information, and all such data involve risks and uncertainties and are subject to change based on various factors. These and other factors could cause results to differ materially from those expressed in the estimates made by the independent parties and by us.
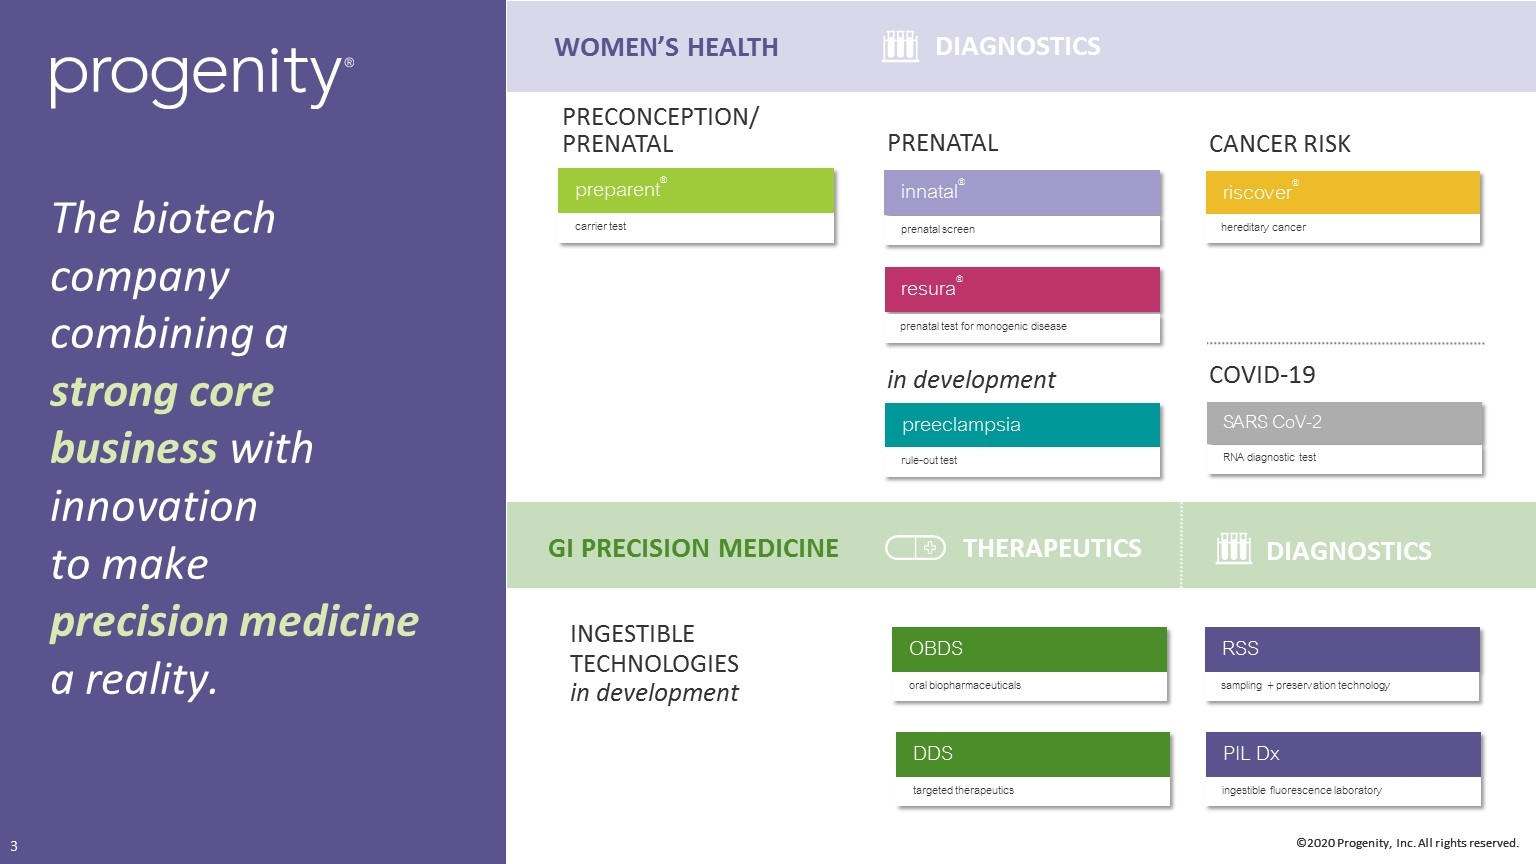
©2020 Progenity, Inc. All rights reserved. WOMEN’S HEALTH GI PRECISION MEDICINE INGESTIBLE TECHNOLOGIES in development in development PRECONCEPTION/PRENATAL innatal® prenatal screen preparent® carrier test resura® prenatal test for monogenic disease riscover® hereditary cancer SARS CoV-2 RNA diagnostic test preeclampsia rule-out test RSS sampling + preservation technology PIL Dx ingestible fluorescence laboratory DDS targeted therapeutics OBDS oral biopharmaceuticals THERAPEUTICS The biotech company combining a strong core business with innovation to make precision medicine a reality. DIAGNOSTICS DIAGNOSTICS PRENATAL CANCER RISK COVID-19
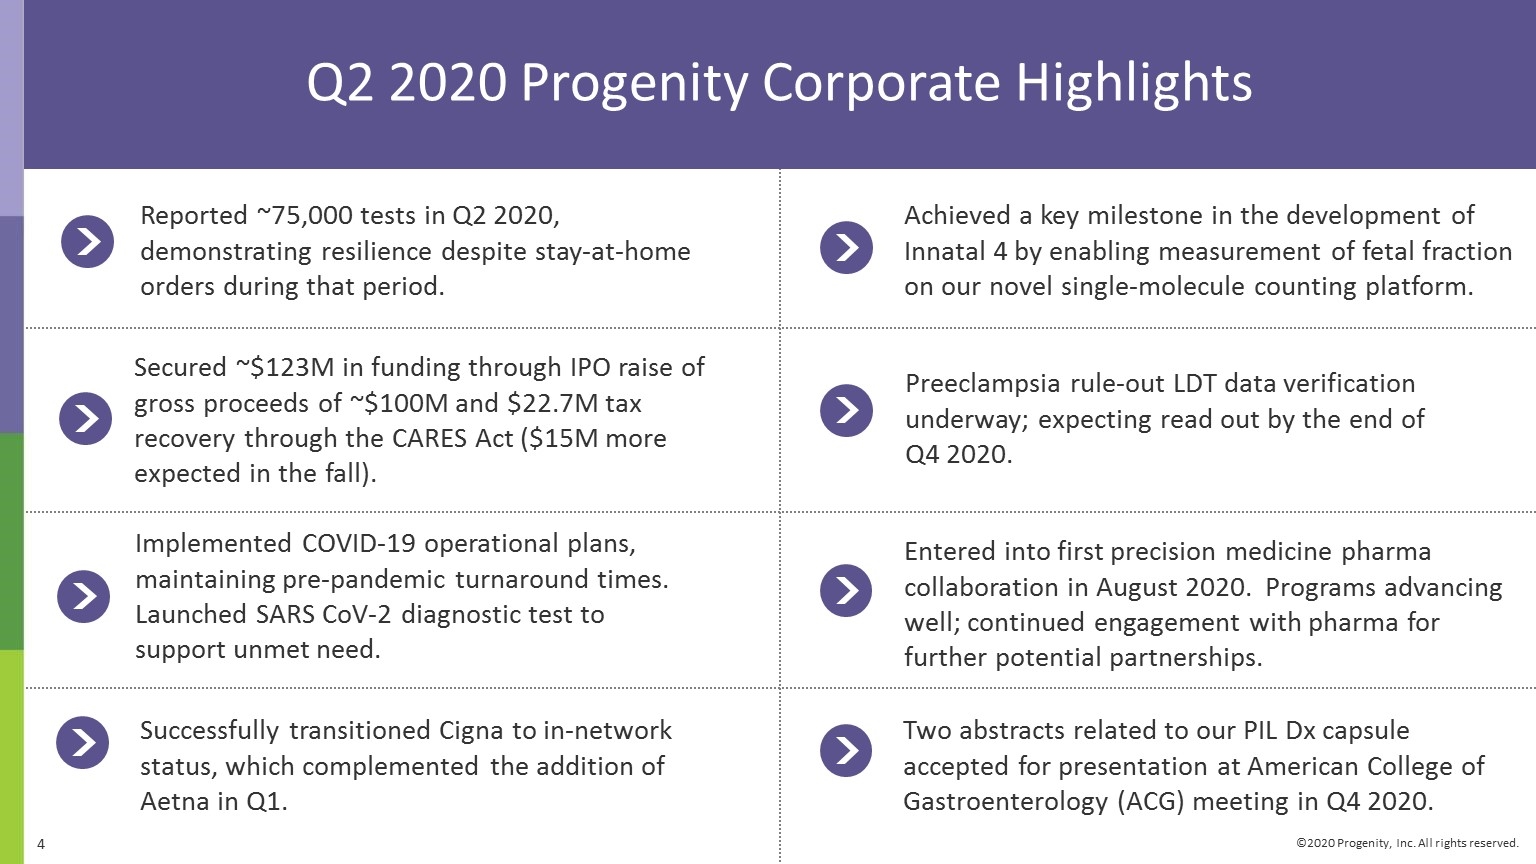
Q2 2020 Progenity Corporate Highlights Reported ~75,000 tests in Q2 2020, demonstrating resilience despite stay-at-home orders during that period. Implemented COVID-19 operational plans, maintaining pre-pandemic turnaround times. Launched SARS CoV-2 diagnostic test to support unmet need. Secured ~$123M in funding through IPO raise of gross proceeds of ~$100M and $22.7M tax recovery through the CARES Act ($15M more expected in the fall). Preeclampsia rule-out LDT data verification underway; expecting read out by the end of Q4 2020. Entered into first precision medicine pharma collaboration in August 2020. Programs advancing well; continued engagement with pharma for further potential partnerships. Achieved a key milestone in the development of Innatal 4 by enabling measurement of fetal fraction on our novel single-molecule counting platform. Successfully transitioned Cigna to in-network status, which complemented the addition of Aetna in Q1. Two abstracts related to our PIL Dx capsule accepted for presentation at American College of Gastroenterology (ACG) meeting in Q4 2020.
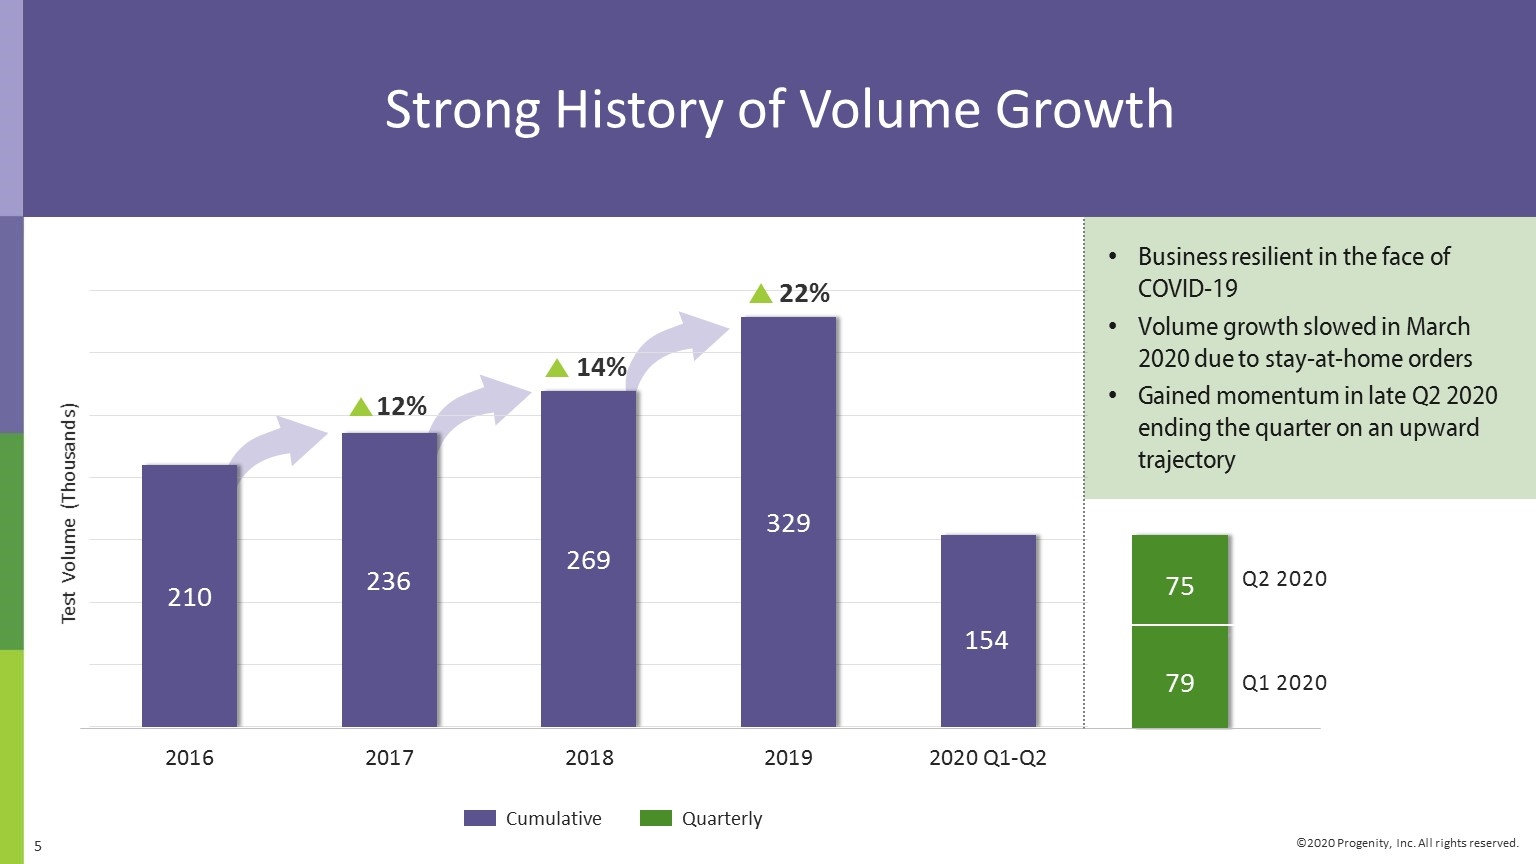
Strong History of Volume Growth Strong History of Volume Growth Cumulative Quarterly Test Volume (Thousands) Business resilient in the face of COVID-19 Volume growth slowed in March 2020 due to stay-at-home orders Gained momentum in late Q2 2020 ending the quarter on an upward trajectory Q2 2020 Q1 2020 14% 22% 12%
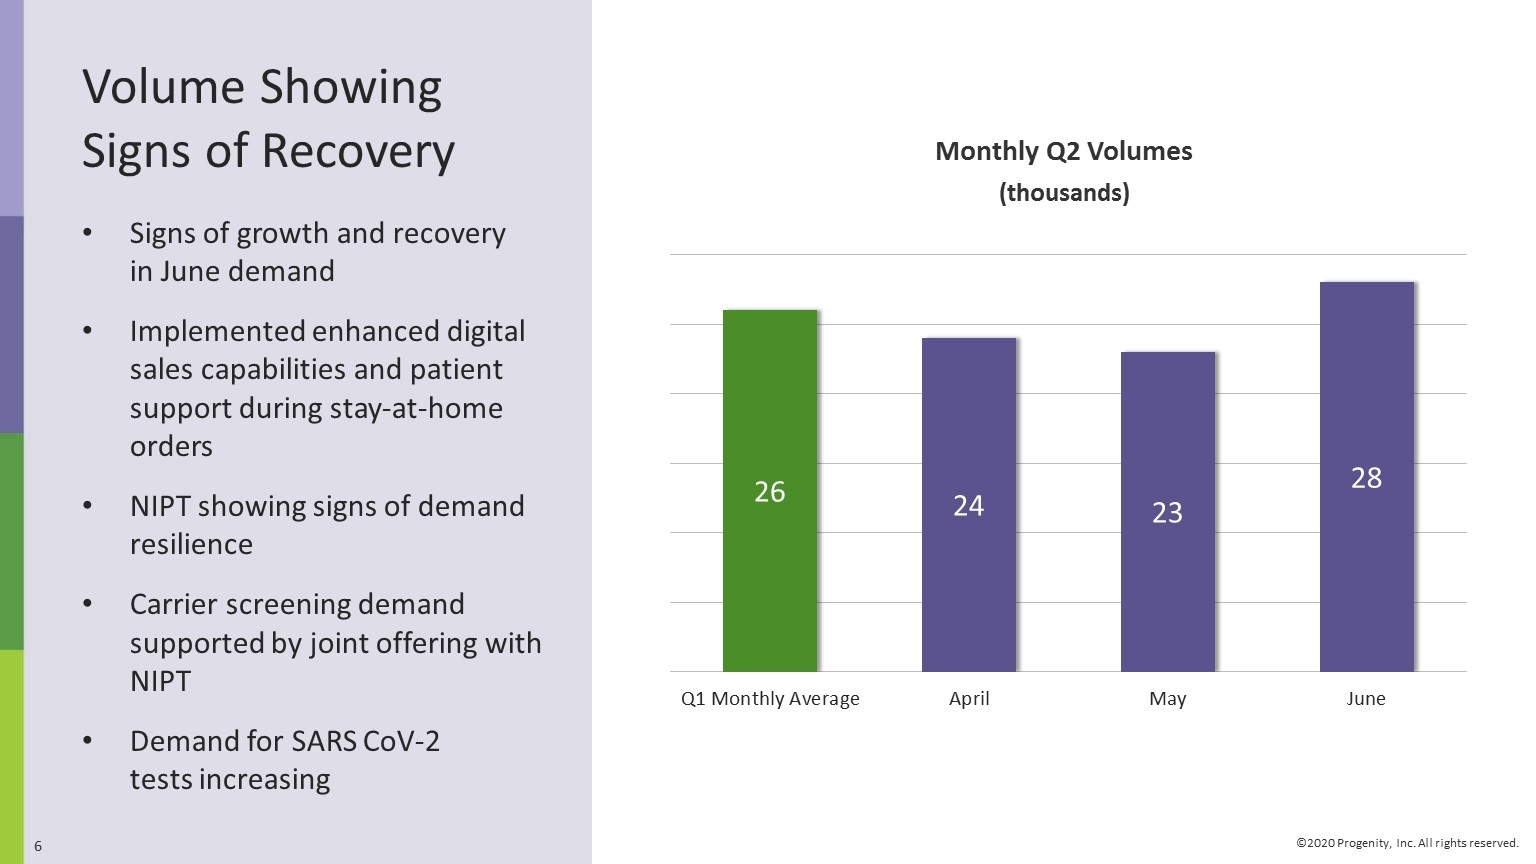
Volume Showing Signs of Recovery Signs of growth and recovery in June demand Implemented enhanced digital sales capabilities and patient support during stay-at-home orders NIPT showing signs of demand resilience Carrier screening demand supported by joint offering with NIPT Demand for SARS CoV-2 tests increasing Monthly Q2 Volumes (thousands)
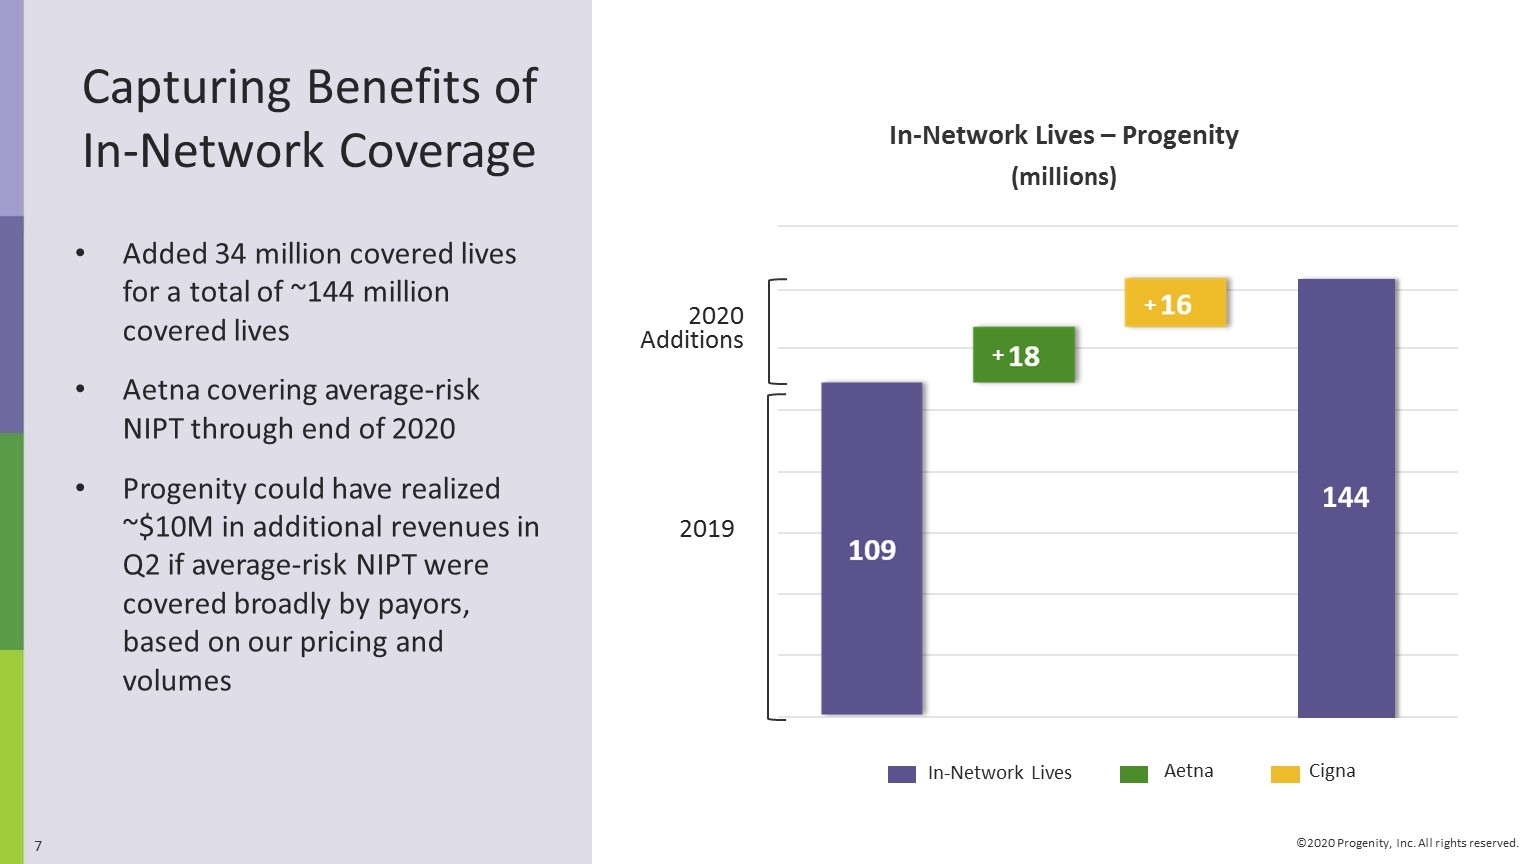
Capturing Benefits of In-Network Coverage Added 34 million covered lives for a total of ~144 million covered lives Aetna covering average-risk NIPT through end of 2020 Progenity could have realized ~$10M in additional revenues in Q2 if average-risk NIPT were covered broadly by payors, based on our pricing and volumes In-Network Lives – Progenity (millions) 2019 2020 Additions In-Network Lives Aetna Cigna + + + +

R&D Pipeline Update
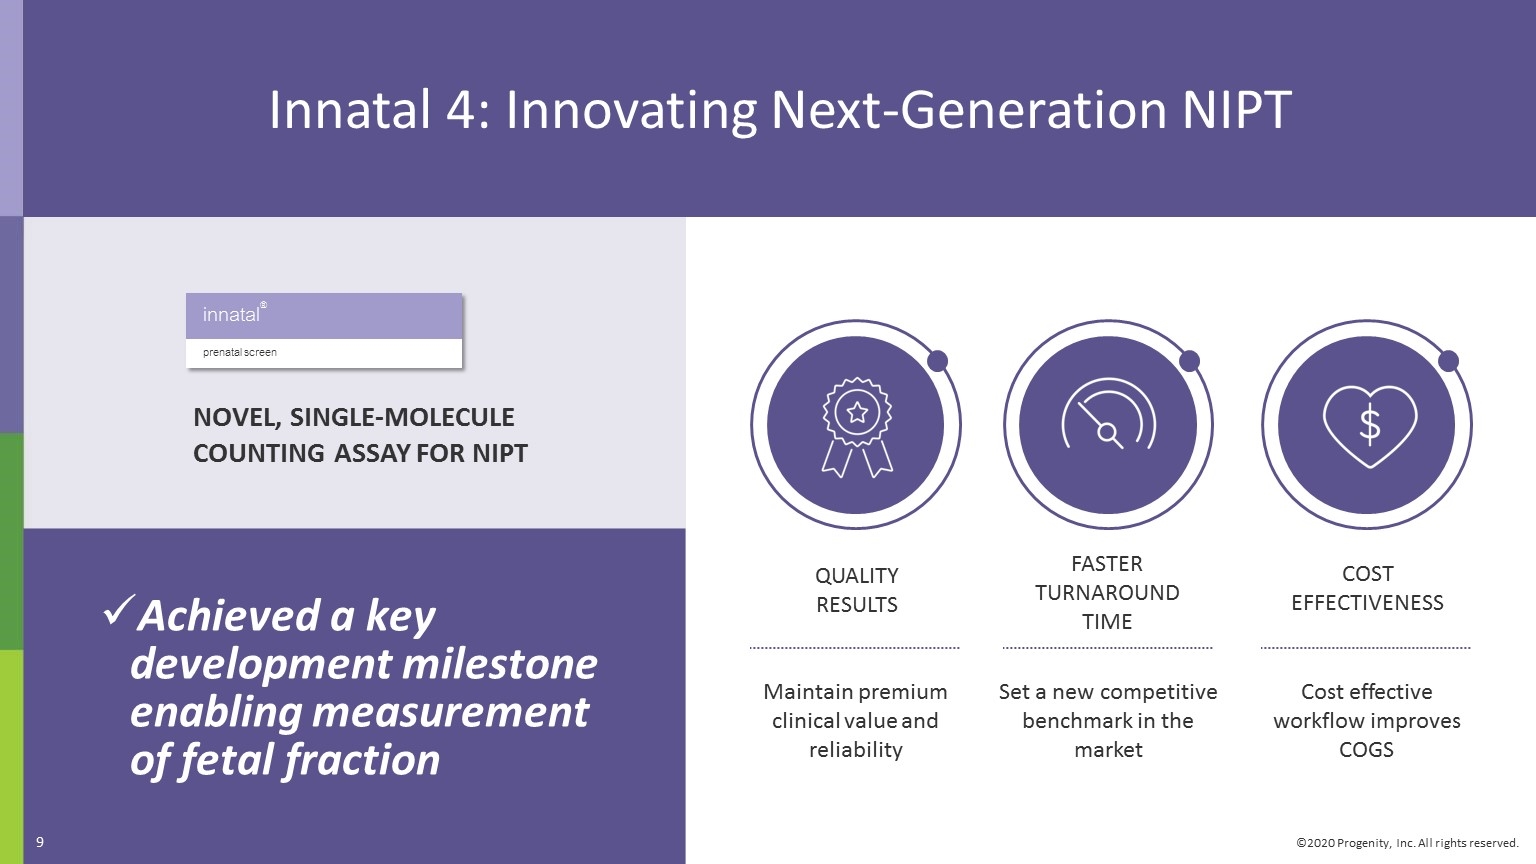
Innatal 4: Innovating Next-Generation NIPT COST EFFECTIVENESS QUALITY RESULTS Maintain premium clinical value and reliability FASTER TURNAROUND TIME Set a new competitive benchmark in the market Cost effective workflow improves COGS Achieved a key development milestone enabling measurement of fetal fraction NOVEL, SINGLE-MOLECULE COUNTING ASSAY FOR NIPT innatal® prenatal screen 9
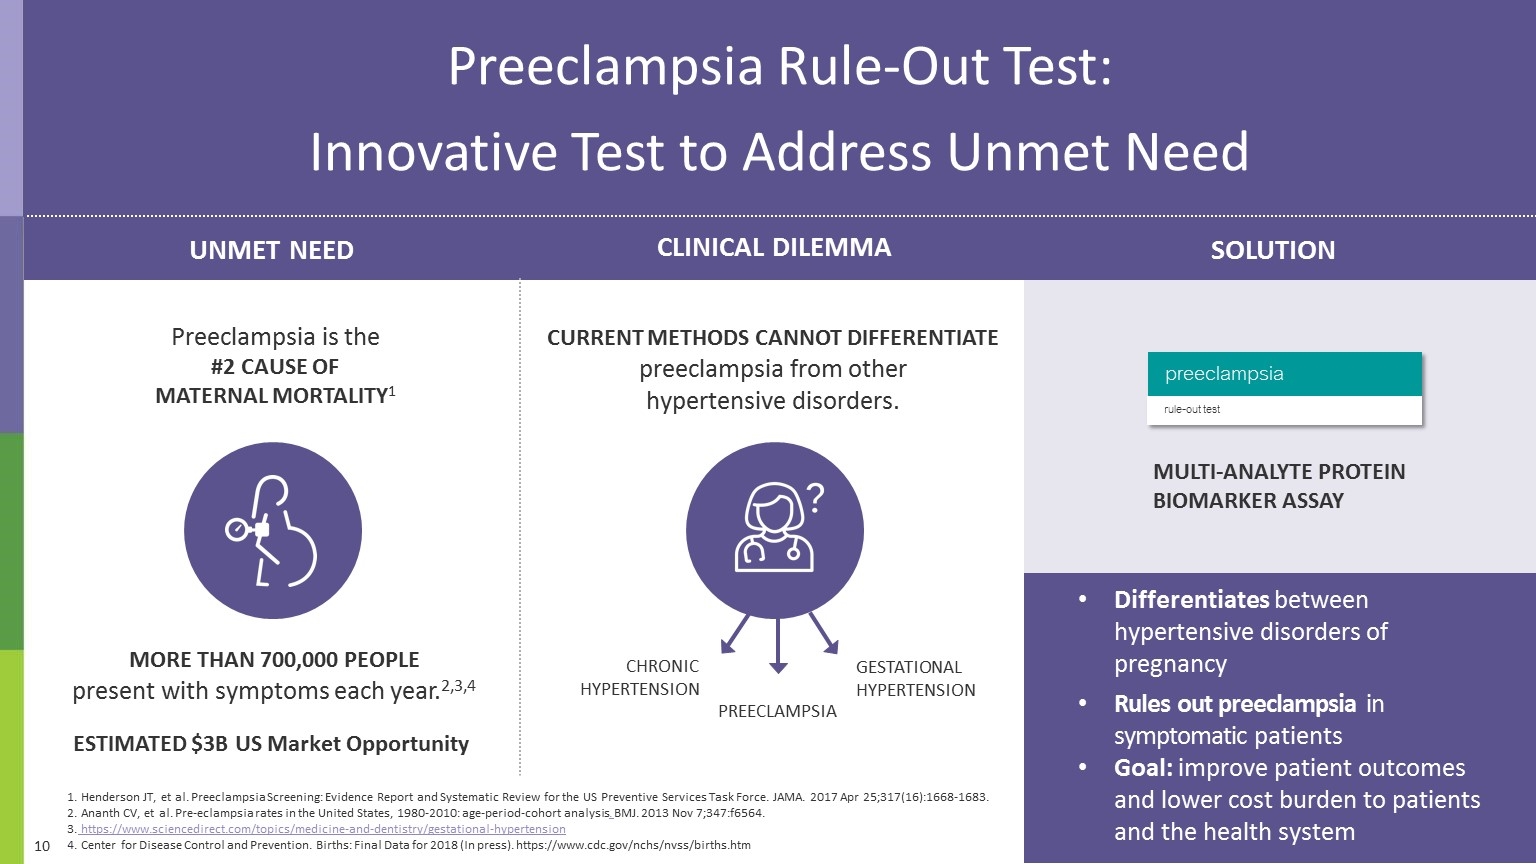
Preeclampsia Rule-Out Test: Innovative Test to Address Unmet Need Differentiates between hypertensive disorders of pregnancy Rules out preeclampsia in symptomatic patients Goal: improve patient outcomes and lower cost burden to patients and the health system Henderson JT, et al. Preeclampsia Screening: Evidence Report and Systematic Review for the US Preventive Services Task Force. JAMA. 2017 Apr 25;317(16):1668-1683. Ananth CV, et al. Pre-eclampsia rates in the United States, 1980-2010: age-period-cohort analysis. BMJ. 2013 Nov 7;347:f6564. https://www.sciencedirect.com/topics/medicine-and-dentistry/gestational-hypertension Center for Disease Control and Prevention. Births: Final Data for 2018 (In press). https://www.cdc.gov/nchs/nvss/births.htm Preeclampsia is the #2 CAUSE OF MATERNAL MORTALITY1 CURRENT METHODS CANNOT DIFFERENTIATE preeclampsia from other hypertensive disorders. MORE THAN 700,000 PEOPLE present with symptoms each year.2,3,4 CHRONIC HYPERTENSION GESTATIONAL HYPERTENSION PREECLAMPSIA preeclampsia rule-out test UNMET NEED CLINICAL DILEMMA SOLUTION MULTI-ANALYTE PROTEIN BIOMARKER ASSAY ESTIMATED $3B US Market Opportunity
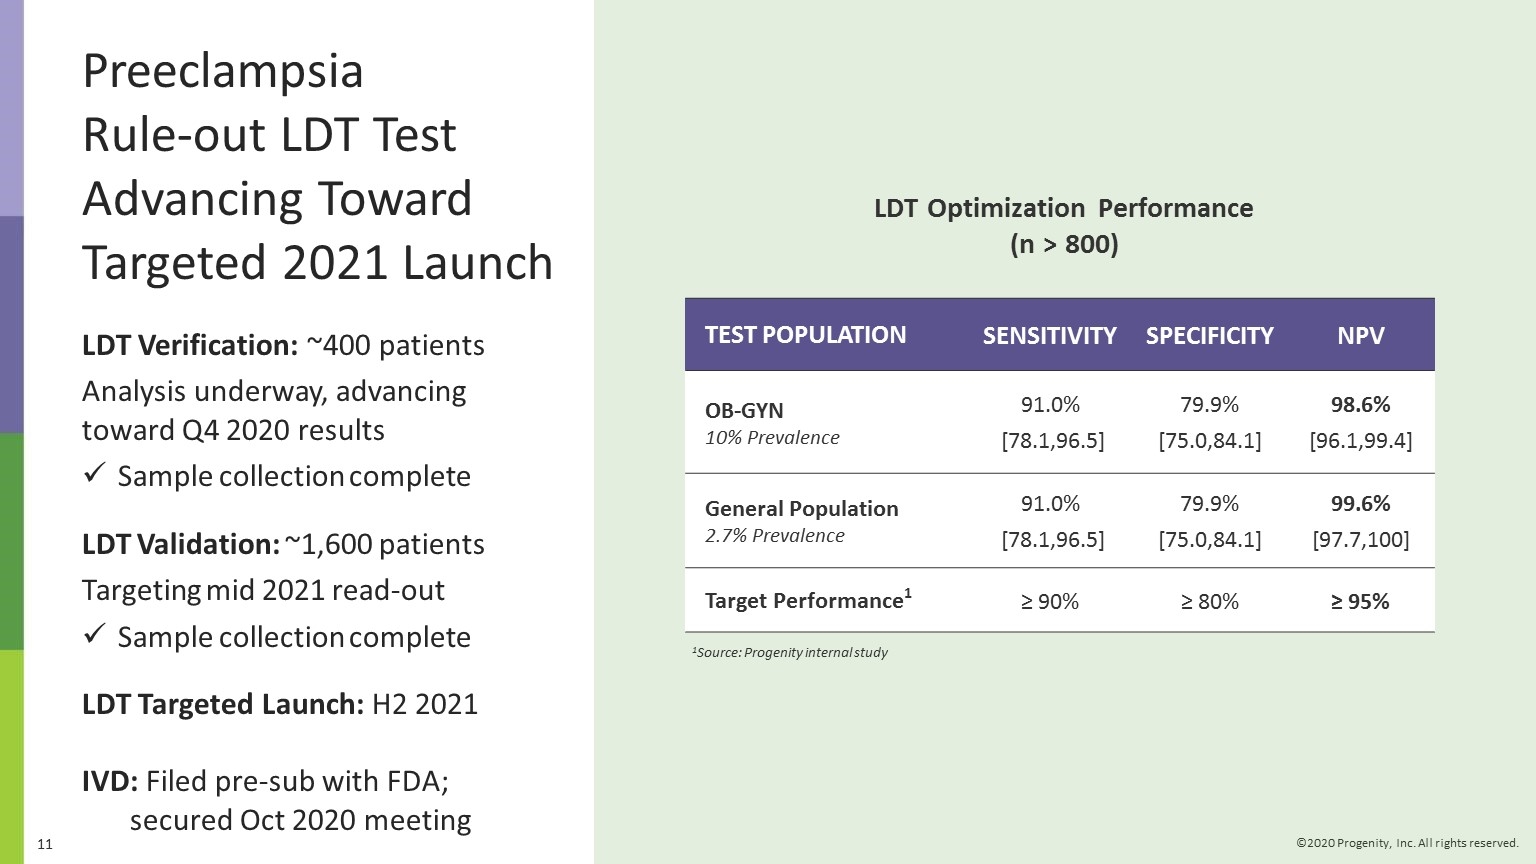
LDT Verification: ~400 patients Analysis underway, advancing toward Q4 2020 results Sample collection complete LDT Validation: ~1,600 patients Targeting mid 2021 read-out Sample collection complete LDT Targeted Launch: H2 2021 IVD: Filed pre-sub with FDA; secured Oct 2020 meeting LDT Optimization Performance (n > 800) TEST POPULATION SENSITIVITY SPECIFICITY NPV OB-GYN 10% Prevalence 91.0% [78.1,96.5] 79.9% [75.0,84.1] 98.6% [96.1,99.4] General Population 2.7% Prevalence 91.0% [78.1,96.5] 79.9% [75.0,84.1] 99.6% [97.7,100] Target Performance1 ≥ 90% ≥ 80% ≥ 95% 1Source: Progenity internal study Preeclampsia Rule-out LDT Test Advancing Toward Targeted 2021 Launch
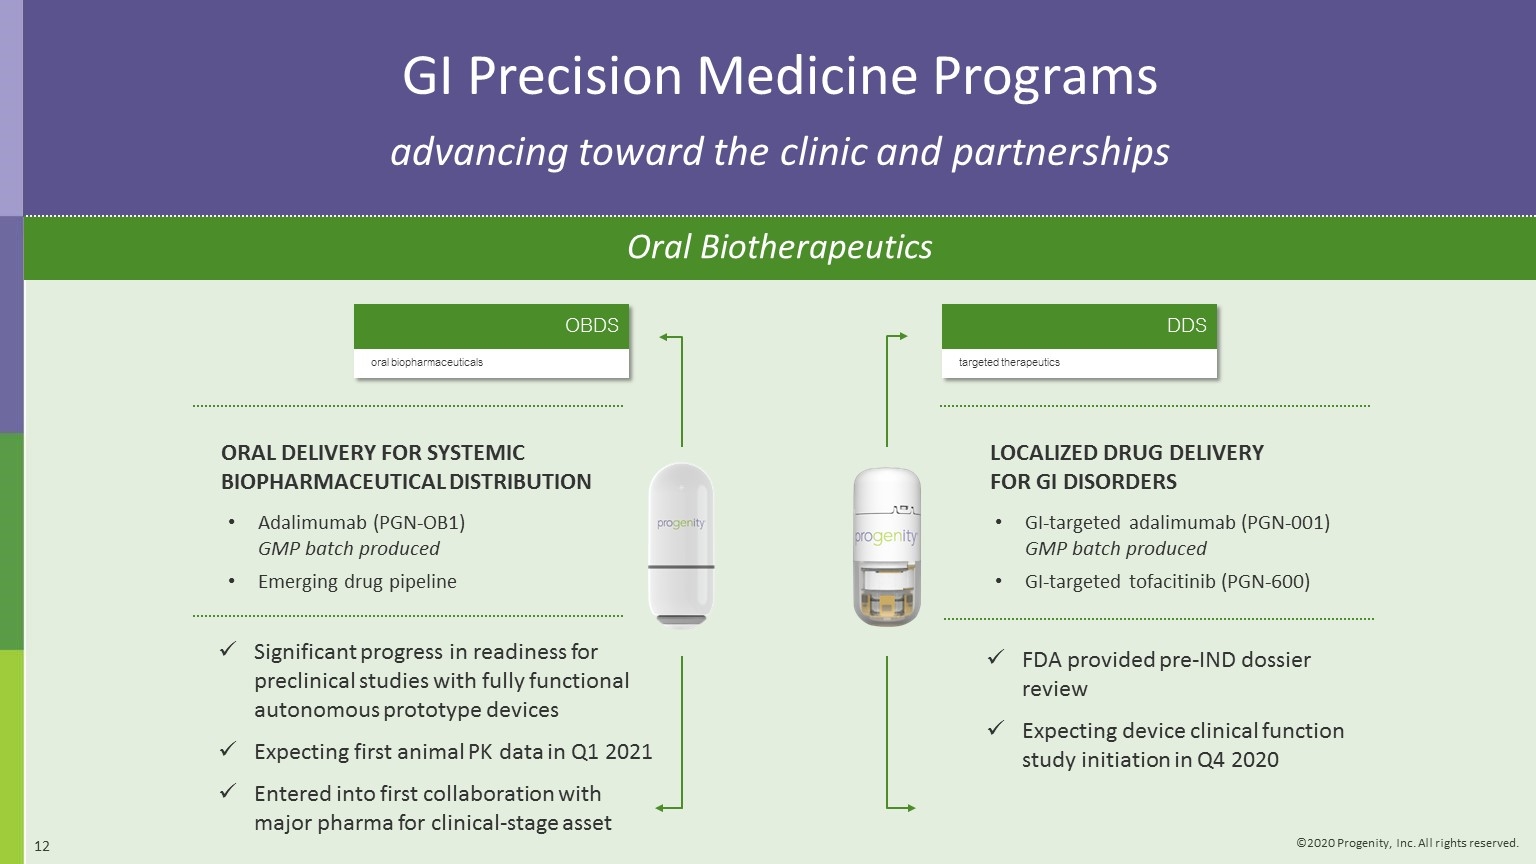
Significant progress in readiness for preclinical studies with fully functional autonomous prototype devices Expecting first animal PK data in Q1 2021 Entered into first collaboration with major pharma for clinical-stage asset OBDS oral biopharmaceuticals ORAL DELIVERY FOR SYSTEMIC BIOPHARMACEUTICAL DISTRIBUTION Adalimumab (PGN-OB1) GMP batch produced Emerging drug pipeline FDA provided pre-IND dossier review Expecting device clinical function study initiation in Q4 2020 DDS targeted therapeutics LOCALIZED DRUG DELIVERY FOR GI DISORDERS GI-targeted adalimumab (PGN-001) GMP batch produced GI-targeted tofacitinib (PGN-600) GI Precision Medicine Programs advancing toward the clinic and partnerships Oral Biotherapeutics
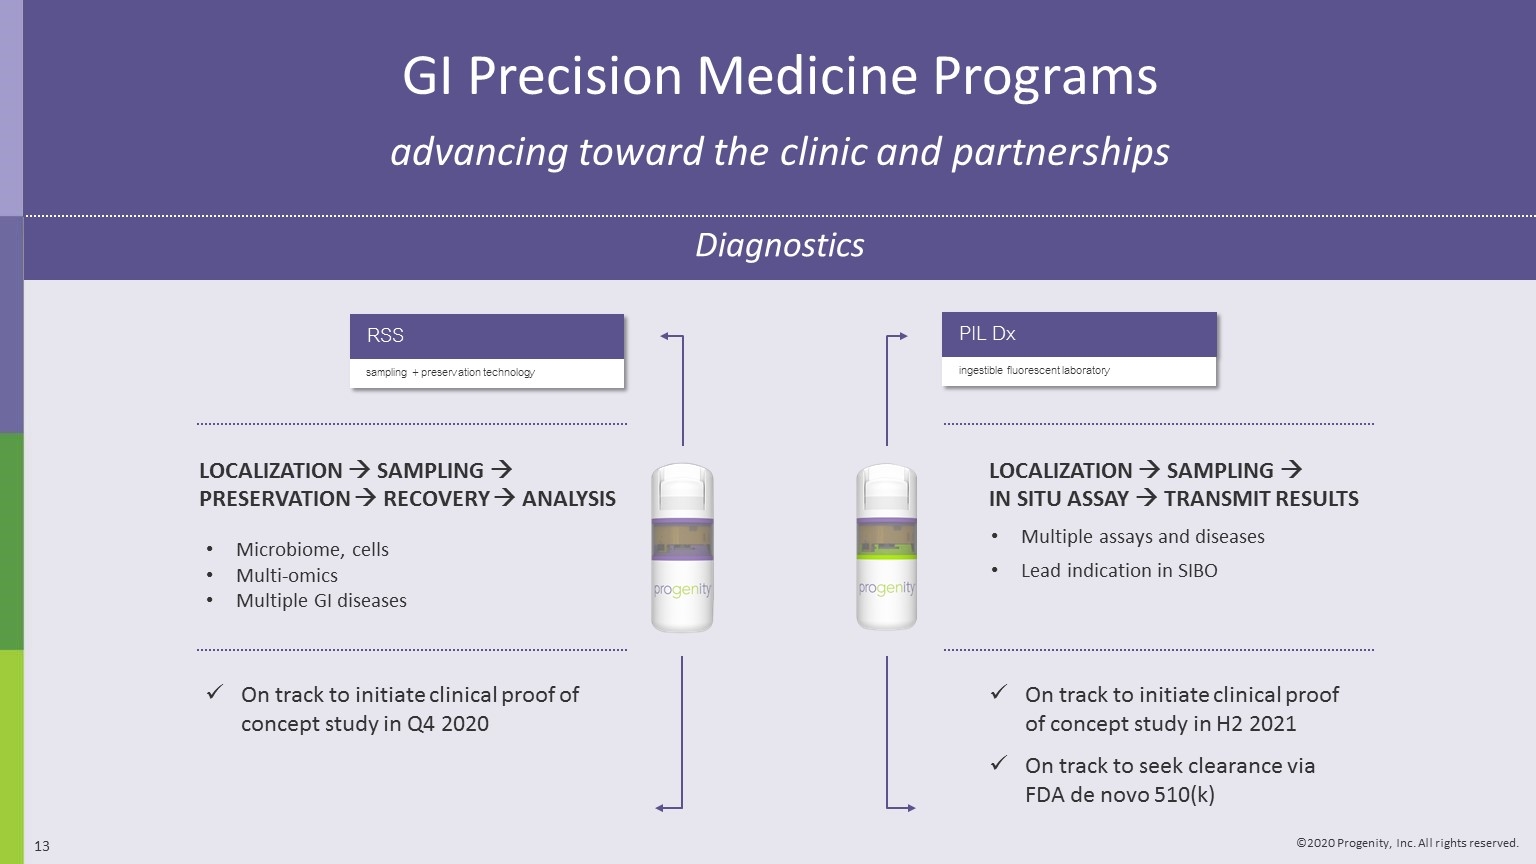
PIL Dx ingestible fluorescent laboratory On track to initiate clinical proof of concept study in Q4 2020 LOCALIZATION à SAMPLING à PRESERVATION à RECOVERY à ANALYSIS Microbiome, cells Multi-omics Multiple GI diseases On track to initiate clinical proof of concept study in H2 2021 On track to seek clearance via FDA de novo 510(k) LOCALIZATION à SAMPLING à IN SITU ASSAY à TRANSMIT RESULTS GI Precision Medicine Programs advancing toward the clinic and partnerships Diagnostics RSS sampling + preservation technology Multiple assays and diseases Lead indication in SIBO
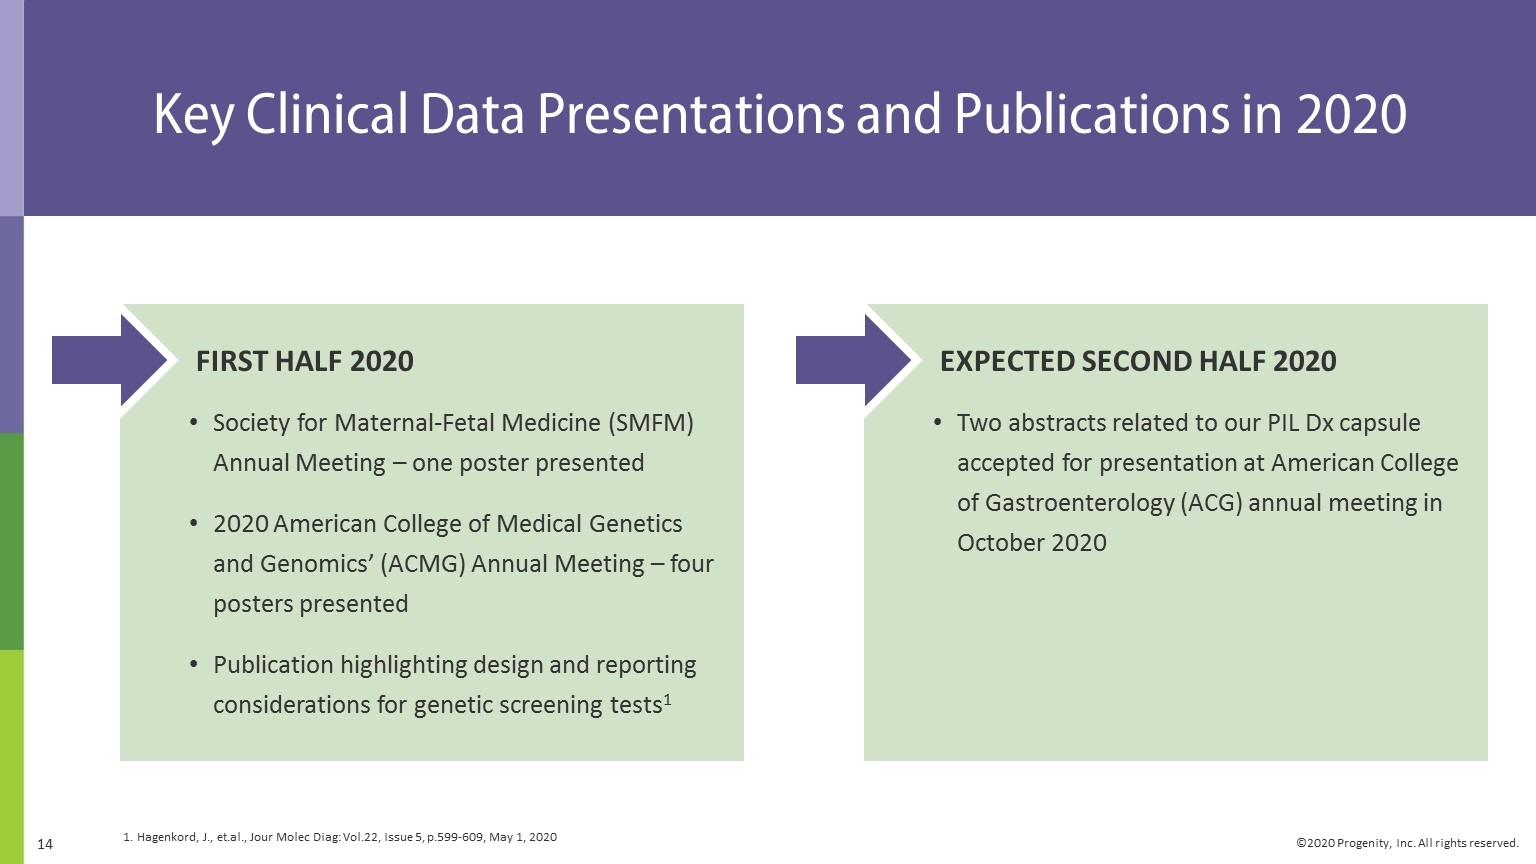
FIRST HALF 2020 Society for Maternal-Fetal Medicine (SMFM) Annual Meeting – one poster presented 2020 American College of Medical Genetics and Genomics’ (ACMG) Annual Meeting – four posters presented Publication highlighting design and reporting considerations for genetic screening tests1 EXPECTED SECOND HALF 2020 Two abstracts related to our PIL Dx capsule accepted for presentation at American College of Gastroenterology (ACG) annual meeting in October 2020 Key Clinical Data Presentations and Publications in 2020 Hagenkord, J., et.al., Jour Molec Diag: Vol.22, Issue 5, p.599-609, May 1, 2020

Second Quarter Financial Details
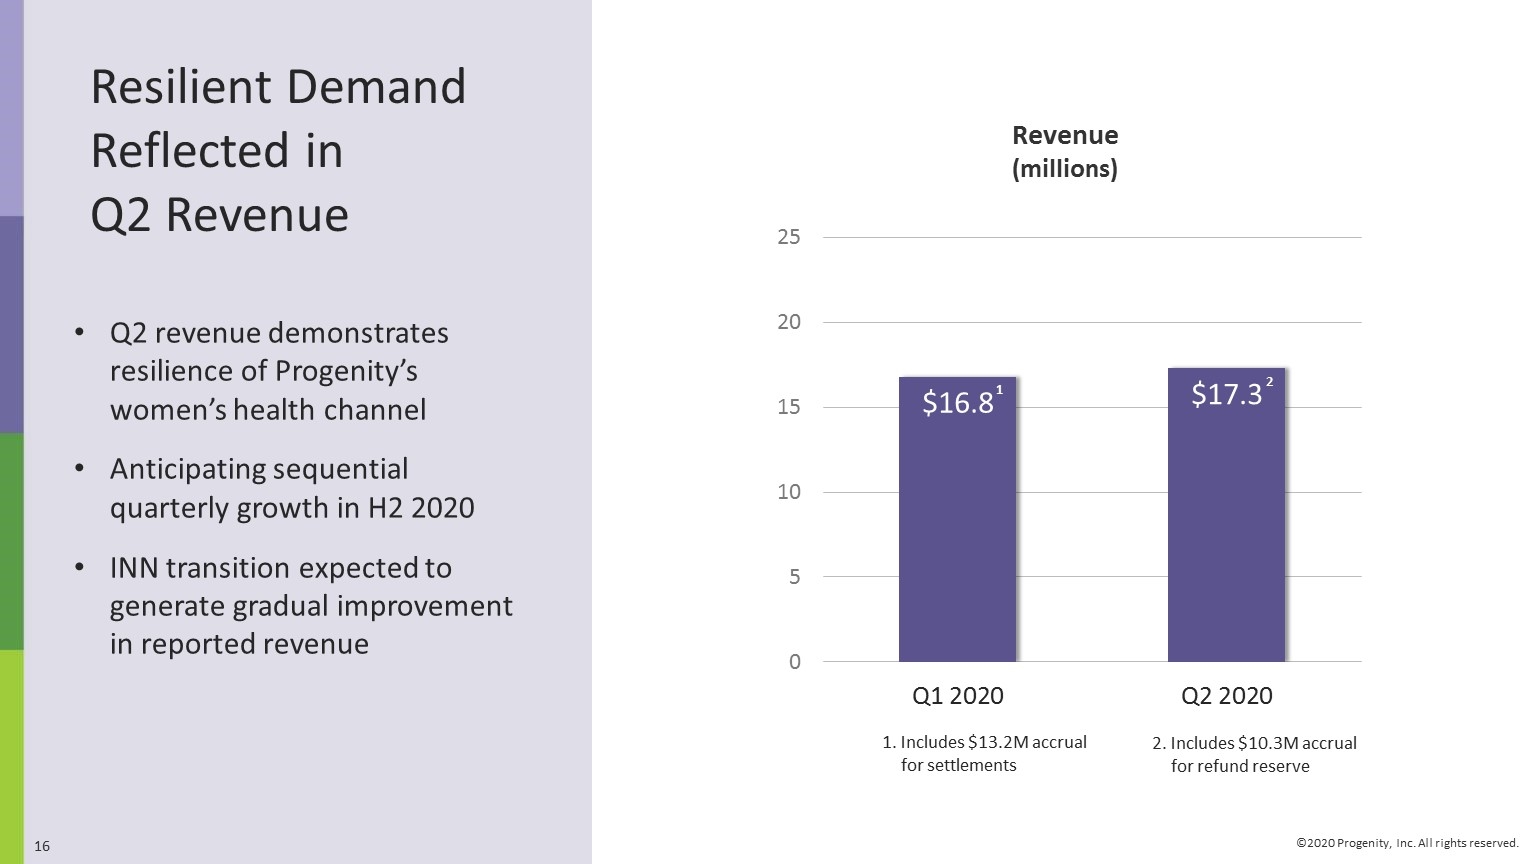
Resilient Demand Reflected in Q2 Revenue Q2 revenue demonstrates resilience of Progenity’s women’s health channel Anticipating sequential quarterly growth in H2 2020 INN transition expected to generate gradual improvement in reported revenue 1. Includes $13.2M accrual for settlements Revenue (millions) 2 2 2. Includes $10.3M accrual for refund reserve
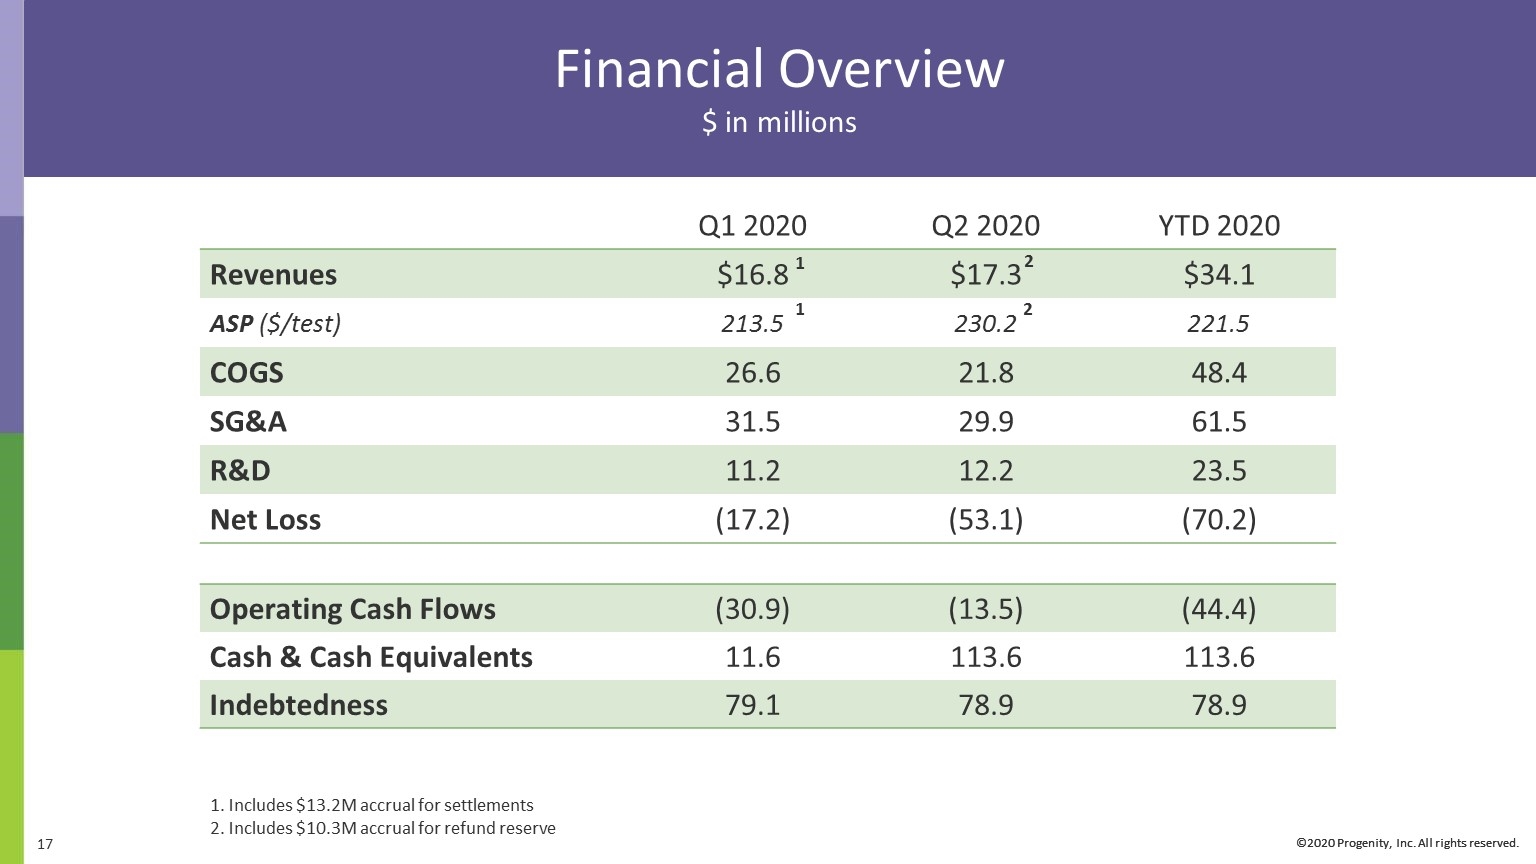
Financial Overview $ in millions ©2020 Progenity, Inc. All rights reserved. Q1 2020 Q2 2020 YTD 2020 Revenues $16.8 $17.3 $34.1 ASP ($/test) 213.5 230.2 221.5 COGS 26.6 21.8 48.4 SG&A 31.5 29.9 61.5 R&D 11.2 12.2 23.5 Net Loss (17.2) (53.1) (70.2) Operating Cash Flows (30.9) (13.5) (44.4) Cash & Cash Equivalents 11.6 113.6 113.6 Indebtedness 79.1 78.9 78.9 Includes $13.2M accrual for settlements Includes $10.3M accrual for refund reserve 1 1 2 2
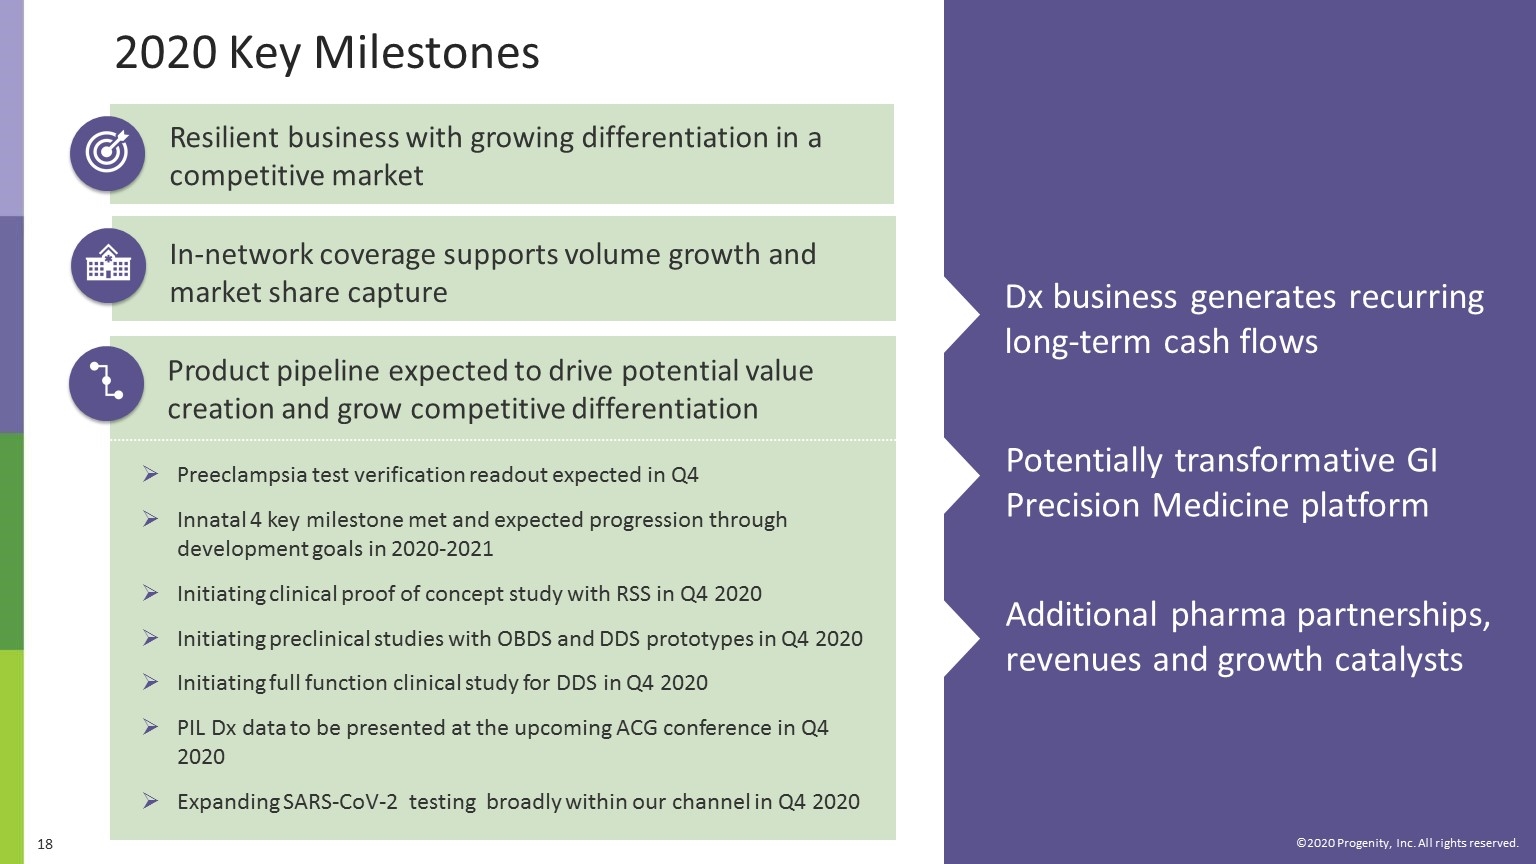
©2020 Progenity, Inc. All rights reserved. 2020 Key Milestones Dx business generates recurring long-term cash flows Resilient business with growing differentiation in a competitive market Product pipeline expected to drive potential value creation and grow competitive differentiation In-network coverage supports volume growth and market share capture Potentially transformative GI Precision Medicine platform Additional pharma partnerships, revenues and growth catalysts Preeclampsia test verification readout expected in Q4 Innatal 4 key milestone met and expected progression through development goals in 2020-2021 Initiating clinical proof of concept study with RSS in Q4 2020 Initiating preclinical studies with OBDS and DDS prototypes in Q4 2020 Initiating full function clinical study for DDS in Q4 2020 PIL Dx data to be presented at the upcoming ACG conference in Q4 2020 Expanding SARS-CoV-2 testing broadly within our channel in Q4 2020

Q&A Session
