Attached files
| file | filename |
|---|---|
| 8-K - 8-K - Conifer Holdings, Inc. | cnfr-8k_20200813.htm |

NASDAQ: CNFR Fulfilling the Unique Needs of Specialty Insurance Markets as a Long-Term Partner August 13th, 2020 Exhibit 99.1
Safe Harbor Statement This presentation contains “forward-looking” statements within the meaning of Section 27A of the Securities Act of 1933, as amended, and Section 21E of the Securities Exchange Act of 1934, as amended, that are based on our management’s beliefs and assumptions and on information currently available to management. These forward-looking statements include, without limitation, statements regarding our industry, business strategy, plans, goals and expectations concerning our market position, product expansion, future operations, margins, profitability, future efficiencies, and other financial and operating information. When used in this discussion, the words “may,” “believes,” “intends,” “seeks,” “anticipates,” “plans,” “estimates,” “expects,” “should,” “assumes,” “continues,” “potential,” “could,” “will,” “future” and the negative of these or similar terms and phrases are intended to identify forward-looking statements. Forward-looking statements involve known and unknown risks, uncertainties, inherent risks and other factors that may cause our actual results, performance or achievements to be materially different from any future results, performance or achievements expressed or implied by the forward-looking statements. Forward-looking statements represent our management’s beliefs and assumptions only as of the date of this presentation. Our actual future results may be materially different from what we expect due to factors largely outside our control, including the occurrence of severe weather conditions and other catastrophes, the cyclical nature of the insurance industry, future actions by regulators, our ability to obtain reinsurance coverage at reasonable rates and the effects of competition. These and other risks and uncertainties associated with our business are described under the heading “Risk Factors” in our most recently filed Annual Report on Form 10-K and our Quarterly Report on Form 10-Q for the quarter ended June 30, 2020, which should be read in conjunction with this presentation. The company and subsidiaries operate in a dynamic business environment, and therefore the risks identified are not meant to be exhaustive. Risk factors change and new risks emerge frequently. Except as required by law, we assume no obligation to update these forward-looking statements publicly, or to update the reasons actual results could differ materially from those anticipated in the forward-looking statements, even if new information becomes available in the future.
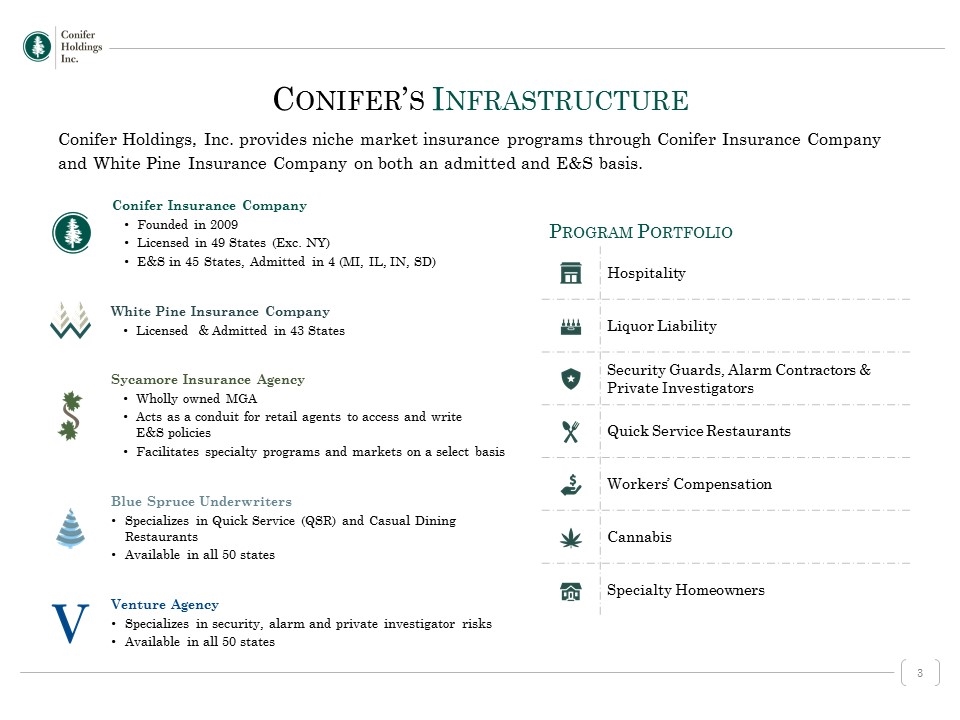
Conifer Holdings, Inc. provides niche market insurance programs through Conifer Insurance Company and White Pine Insurance Company on both an admitted and E&S basis. Program Portfolio Hospitality Liquor Liability Security Guards, Alarm Contractors & Private Investigators Quick Service Restaurants Workers’ Compensation Cannabis Specialty Homeowners Conifer’s Infrastructure Conifer Insurance Company Founded in 2009 Licensed in 49 States (Exc. NY) E&S in 45 States, Admitted in 4 (MI, IL, IN, SD) Sycamore Insurance Agency Wholly owned MGA Acts as a conduit for retail agents to access and write E&S policies Facilitates specialty programs and markets on a select basis Venture Agency Specializes in security, alarm and private investigator risks Available in all 50 states White Pine Insurance Company Licensed & Admitted in 43 States Blue Spruce Underwriters Specializes in Quick Service (QSR) and Casual Dining Restaurants Available in all 50 states
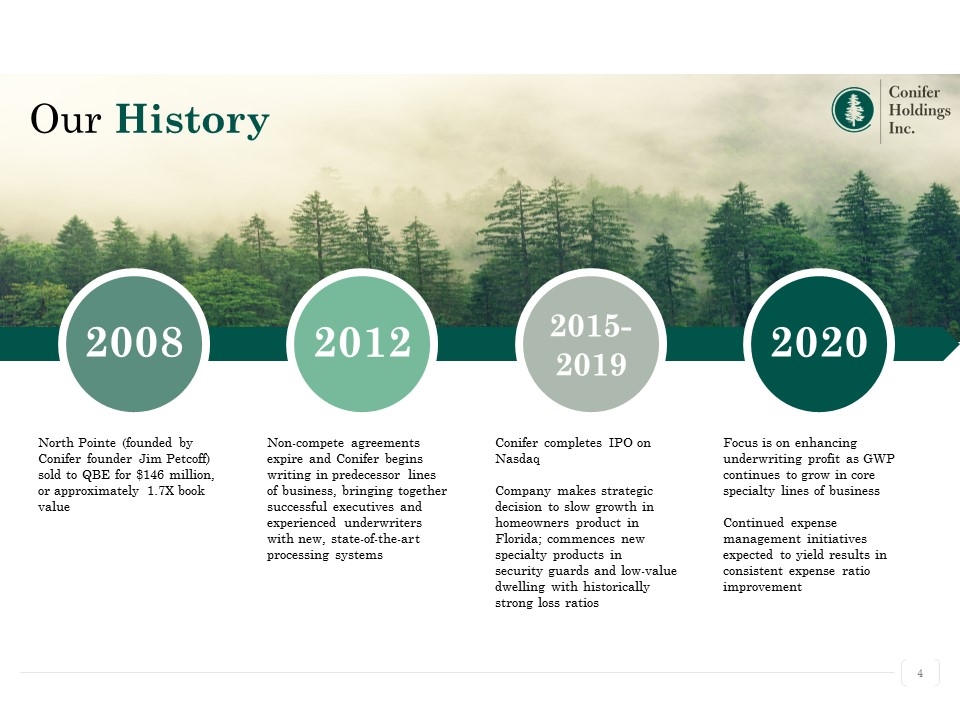
Our History 2020 Focus is on enhancing underwriting profit as GWP continues to grow in core specialty lines of business Continued expense management initiatives expected to yield results in consistent expense ratio improvement Conifer completes IPO on Nasdaq Company makes strategic decision to slow growth in homeowners product in Florida; commences new specialty products in security guards and low-value dwelling with historically strong loss ratios 2015-2019 Non-compete agreements expire and Conifer begins writing in predecessor lines of business, bringing together successful executives and experienced underwriters with new, state-of-the-art processing systems 2012 North Pointe (founded by Conifer founder Jim Petcoff) sold to QBE for $146 million, or approximately 1.7X book value 2008
Conifer Response: COVID-19 COVID-19 Conifer is proactively managing the challenges created by the onset of the novel coronavirus (COVID-19). Our primary concern has been the health and welfare of employees, families, associates, agents and insureds. From late March to present, our entire team has worked from home. The transition took place without disrupting our operations or our ability to serve our business partners. This is a strong indicator of our resilience and capacity to manage remote operations as long as necessary. As of August 2020 Robust business continuity plan and significant investments in technology infrastructure have paid off. While Conifer does focus on hospitality and small business commercial accounts, its policy coverages are largely limited to property and general liability. Minimal exposure to workers’ compensation.
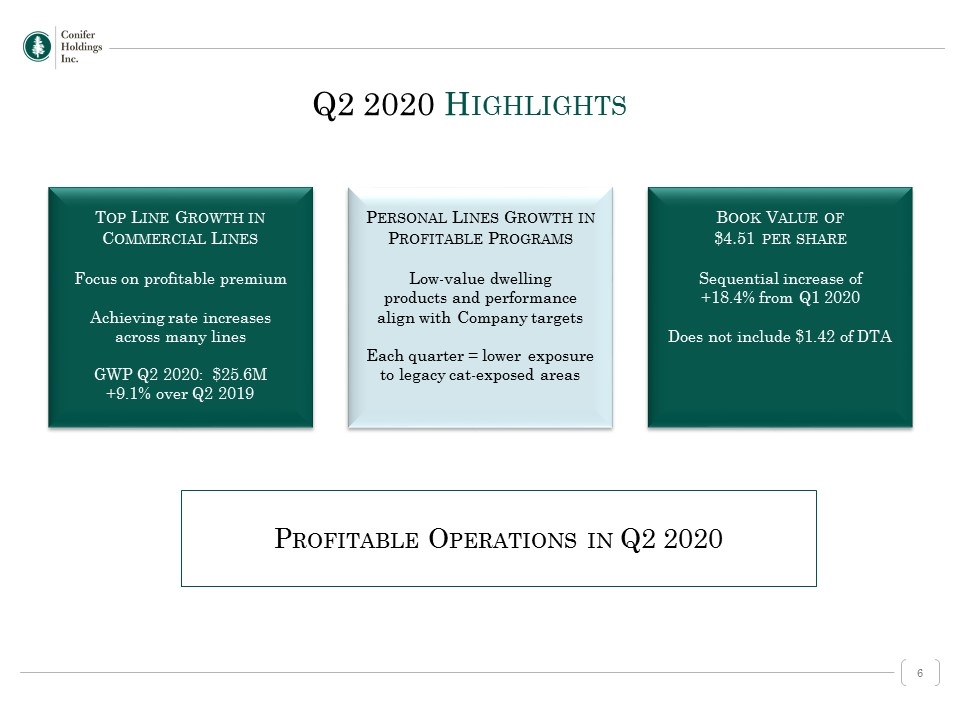
Q2 2020 Highlights Top Line Growth in Commercial Lines Focus on profitable premium Achieving rate increases across many lines GWP Q2 2020: $25.6M +9.1% over Q2 2019 Personal Lines Growth in Profitable Programs Low-value dwelling products and performance align with Company targets Each quarter = lower exposure to legacy cat-exposed areas Book Value of $4.51 per share Sequential increase of +18.4% from Q1 2020 Does not include $1.42 of DTA Profitable Operations in Q2 2020

Investment Thesis Focused Expertise in Niche Specialty Insurance Markets Operating Trends Moving in the Right Direction 2 Attractive Entry Point Valuation Based on Operating Trajectory 3 1
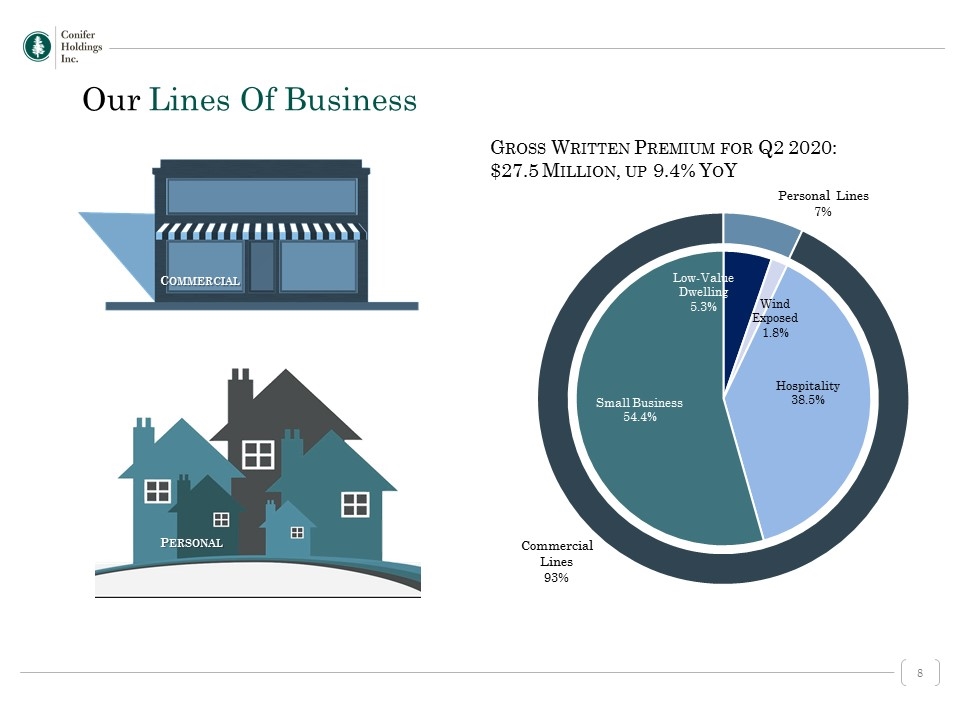
Our Lines Of Business Commercial Personal Gross Written Premium for Q2 2020: $27.5 Million, up 9.4% YoY
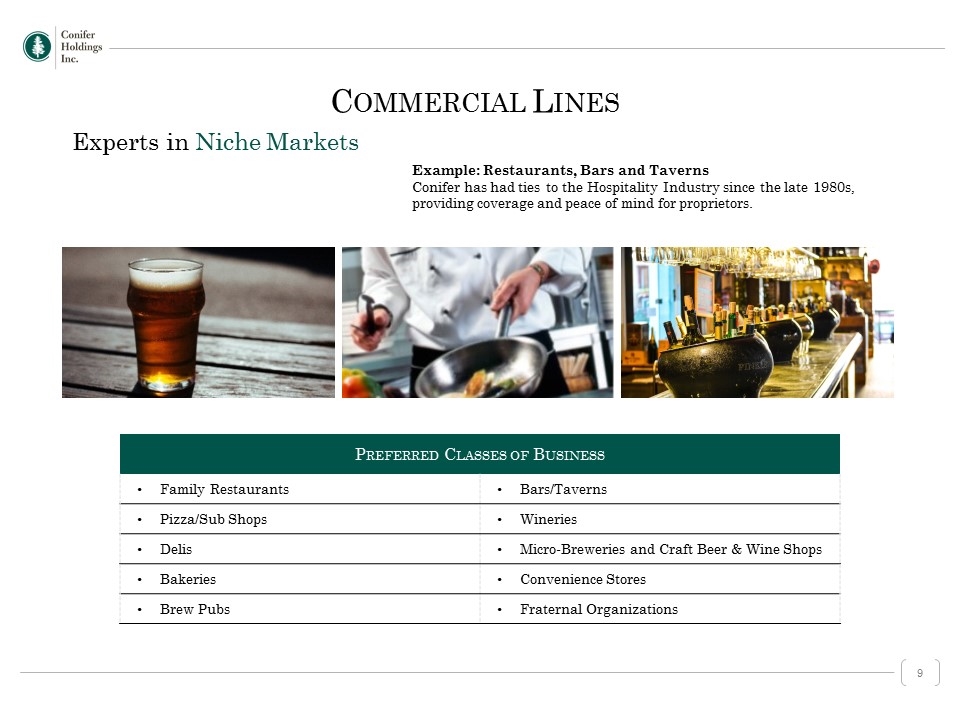
Example: Restaurants, Bars and Taverns Conifer has had ties to the Hospitality Industry since the late 1980s, providing coverage and peace of mind for proprietors. Experts in Niche Markets Preferred Classes of Business Family Restaurants Bars/Taverns Pizza/Sub Shops Wineries Delis Micro-Breweries and Craft Beer & Wine Shops Bakeries Convenience Stores Brew Pubs Fraternal Organizations Commercial Lines
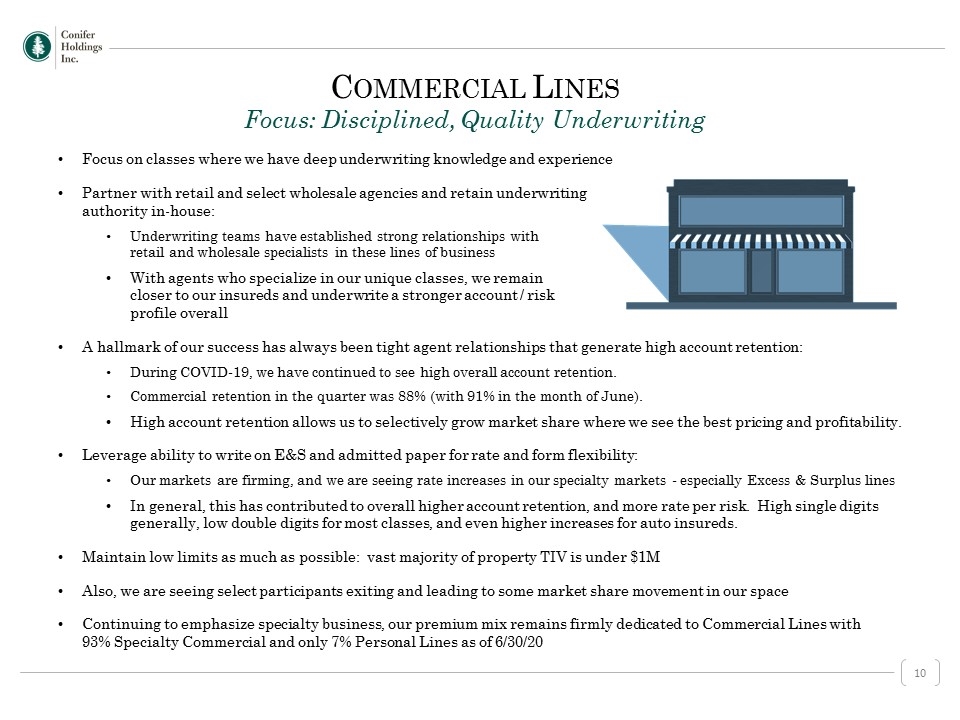
Focus on classes where we have deep underwriting knowledge and experience Partner with retail and select wholesale agencies and retain underwriting authority in-house: Underwriting teams have established strong relationships with retail and wholesale specialists in these lines of business With agents who specialize in our unique classes, we remain closer to our insureds and underwrite a stronger account / risk profile overall A hallmark of our success has always been tight agent relationships that generate high account retention: During COVID-19, we have continued to see high overall account retention. Commercial retention in the quarter was 88% (with 91% in the month of June). High account retention allows us to selectively grow market share where we see the best pricing and profitability. Leverage ability to write on E&S and admitted paper for rate and form flexibility: Our markets are firming, and we are seeing rate increases in our specialty markets - especially Excess & Surplus lines In general, this has contributed to overall higher account retention, and more rate per risk. High single digits generally, low double digits for most classes, and even higher increases for auto insureds. Maintain low limits as much as possible: vast majority of property TIV is under $1M Also, we are seeing select participants exiting and leading to some market share movement in our space Continuing to emphasize specialty business, our premium mix remains firmly dedicated to Commercial Lines with 93% Specialty Commercial and only 7% Personal Lines as of 6/30/20 Commercial Lines Focus: Disciplined, Quality Underwriting
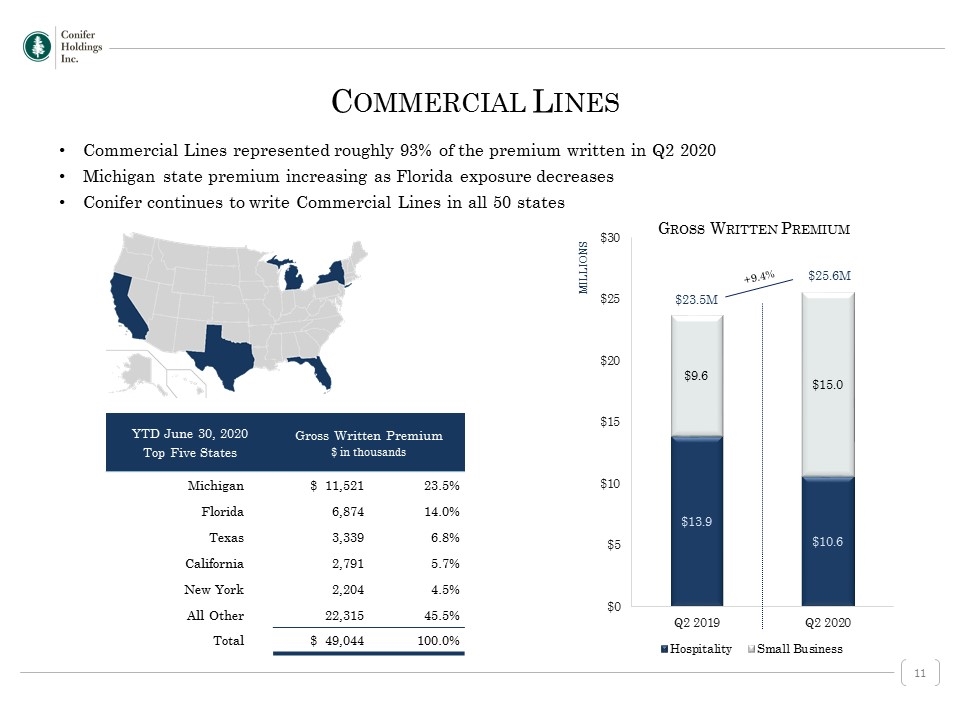
$23.5M $25.6M MILLIONS +9.4% Gross Written Premium Commercial Lines represented roughly 93% of the premium written in Q2 2020 Michigan state premium increasing as Florida exposure decreases Conifer continues to write Commercial Lines in all 50 states Commercial Lines YTD June 30, 2020 Top Five States Gross Written Premium $ in thousands Michigan $ 11,521 23.5% Florida 6,874 14.0% Texas 3,339 6.8% California 2,791 5.7% New York 2,204 4.5% All Other 22,315 45.5% Total $ 49,044 100.0%
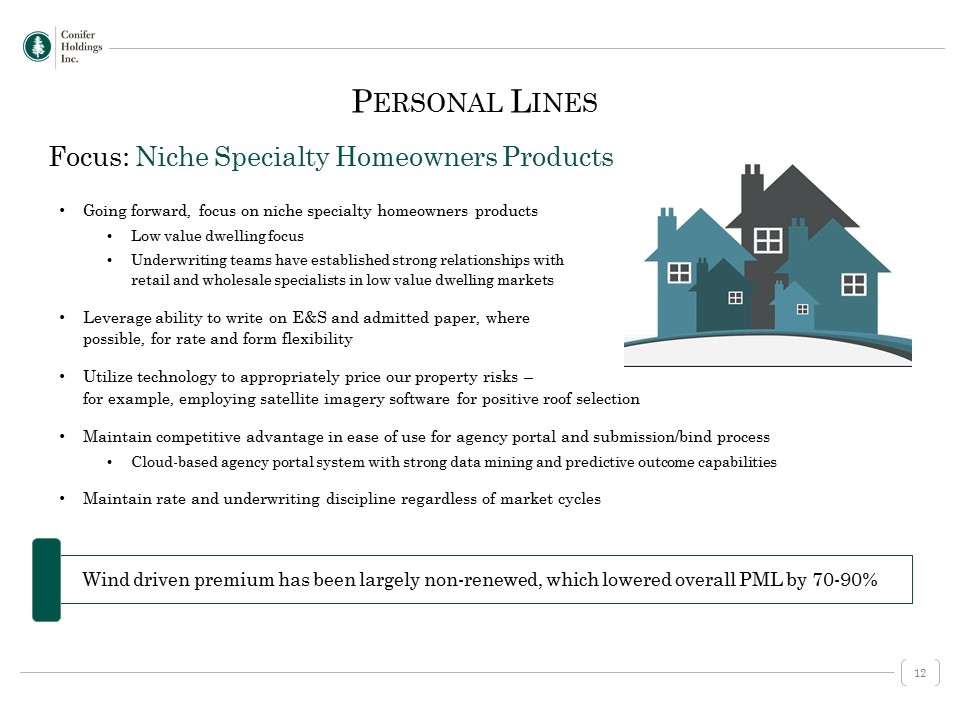
Going forward, focus on niche specialty homeowners products Low value dwelling focus Underwriting teams have established strong relationships with retail and wholesale specialists in low value dwelling markets Leverage ability to write on E&S and admitted paper, where possible, for rate and form flexibility Utilize technology to appropriately price our property risks – for example, employing satellite imagery software for positive roof selection Maintain competitive advantage in ease of use for agency portal and submission/bind process Cloud-based agency portal system with strong data mining and predictive outcome capabilities Maintain rate and underwriting discipline regardless of market cycles Wind driven premium has been largely non-renewed, which lowered overall PML by 70-90% Focus: Niche Specialty Homeowners Products Personal Lines
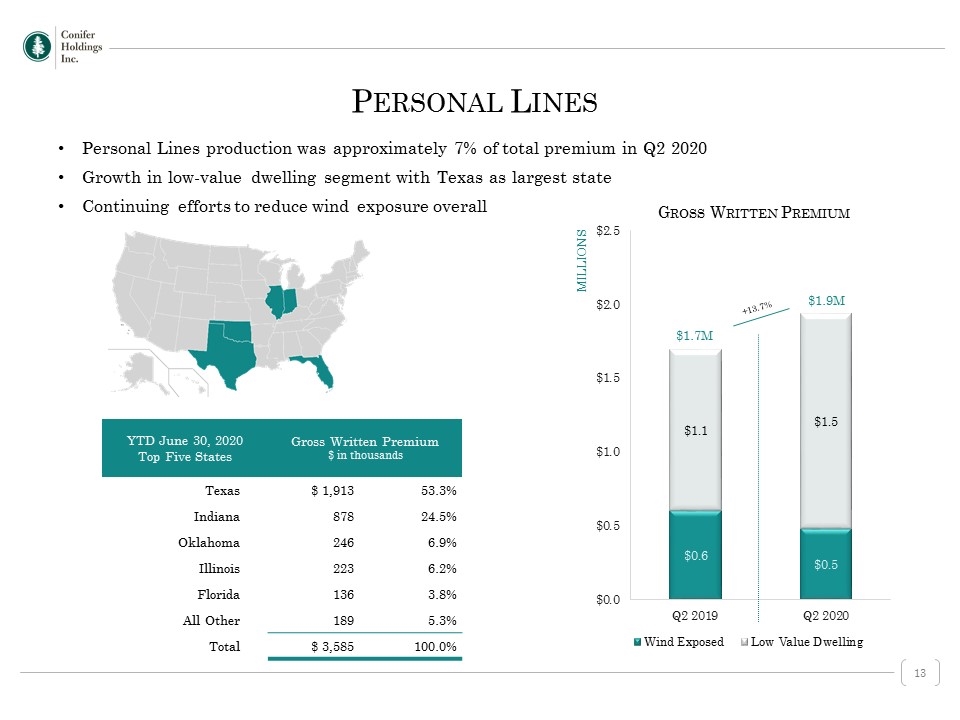
$1.7M $1.9M MILLIONS Gross Written Premium Personal Lines production was approximately 7% of total premium in Q2 2020 Growth in low-value dwelling segment with Texas as largest state Continuing efforts to reduce wind exposure overall +13.7% Personal Lines YTD June 30, 2020 Top Five States Gross Written Premium $ in thousands Texas $ 1,913 53.3% Indiana 878 24.5% Oklahoma 246 6.9% Illinois 223 6.2% Florida 136 3.8% All Other 189 5.3% Total $ 3,585 100.0%

Sycamore Insurance Agency, Inc. Acts as a wholesaler / surplus lines broker / retail agent recording non-risk revenue on business we place with other companies. Can pay E&S taxes and fees on behalf of retail agents, giving greater access to see more tailored risks in total from a wider distribution pool. We expect that Sycamore’s revenue opportunities will continue to grow: Total Commission Revenue from third party or affiliated sources is expected to be over $7M in 2020 SMALL BUSINESS PERSONAL LINES HOSPITALITY CANNABIS & HEMP Agency: Upside Benefits Fee-based Business / Risk-free Revenue

Operating Trends Moving in the Right Direction Attractive Entry Point Valuation Based on Operating Trajectory Focused Expertise in Niche Specialty Insurance Markets 2 3 1 Investment Thesis
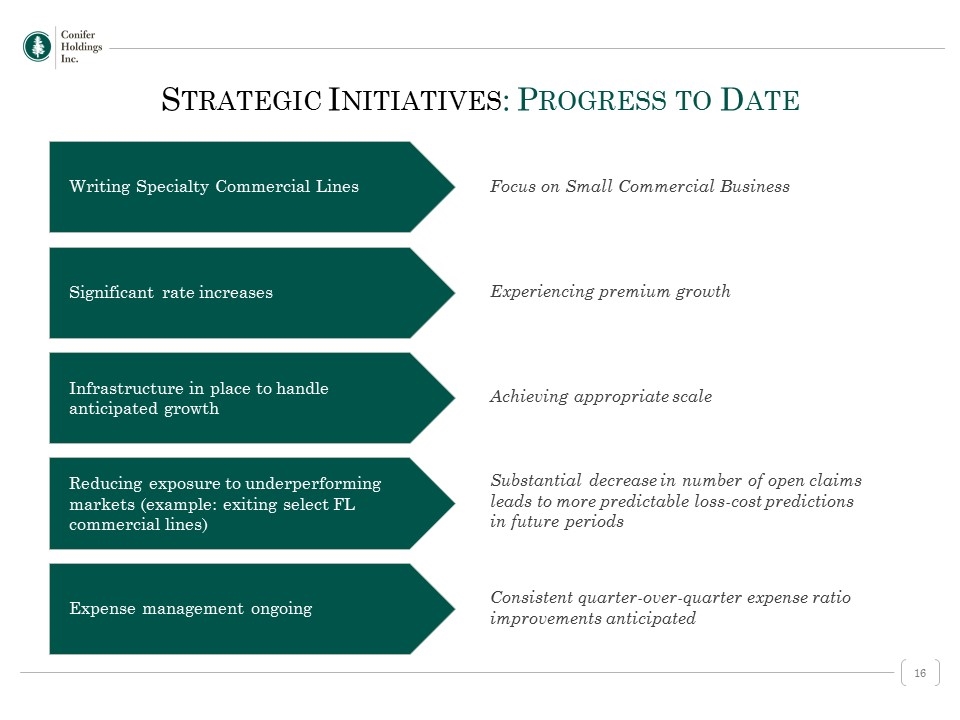
Strategic Initiatives: Progress to Date Writing Specialty Commercial Lines Significant rate increases Infrastructure in place to handle anticipated growth Reducing exposure to underperforming markets (example: exiting select FL commercial lines) Expense management ongoing Focus on Small Commercial Business Experiencing premium growth Achieving appropriate scale Substantial decrease in number of open claims leads to more predictable loss-cost predictions in future periods Consistent quarter-over-quarter expense ratio improvements anticipated
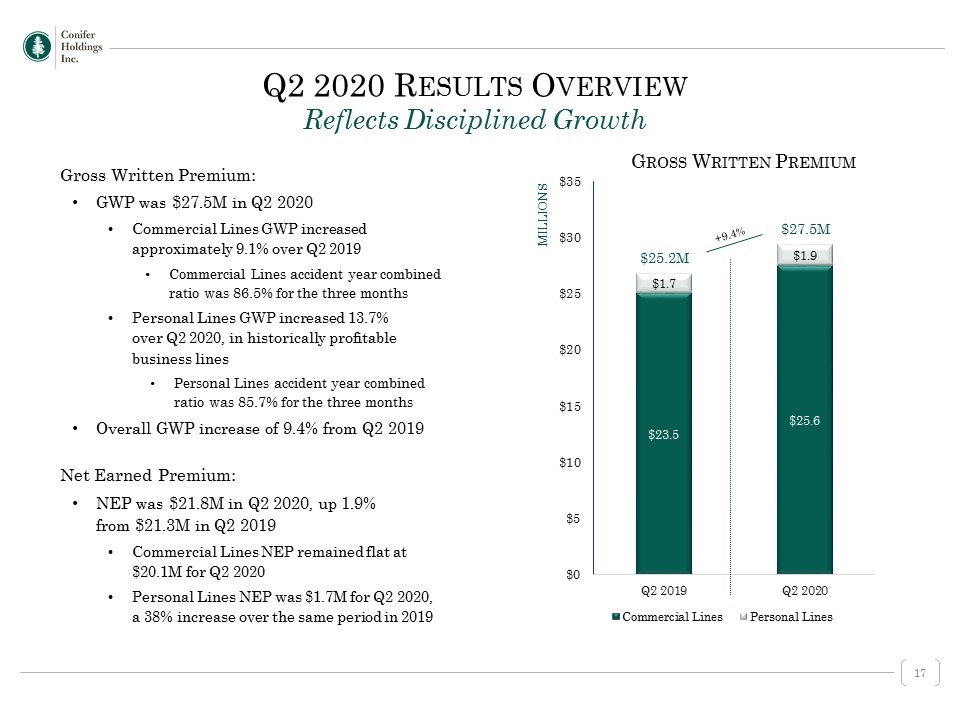
Q2 2020 Results Overview Reflects Disciplined Growth Gross Written Premium: GWP was $27.5M in Q2 2020 Commercial Lines GWP increased approximately 9.1% over Q2 2019 Commercial Lines accident year combined ratio was 86.5% for the three months Personal Lines GWP increased 13.7% over Q2 2020, in historically profitable business lines Personal Lines accident year combined ratio was 85.7% for the three months Overall GWP increase of 9.4% from Q2 2019 Net Earned Premium: NEP was $21.8M in Q2 2020, up 1.9% from $21.3M in Q2 2019 Commercial Lines NEP remained flat at $20.1M for Q2 2020 Personal Lines NEP was $1.7M for Q2 2020, a 38% increase over the same period in 2019 Gross Written Premium $25.2M $27.5M MILLIONS +9.4%
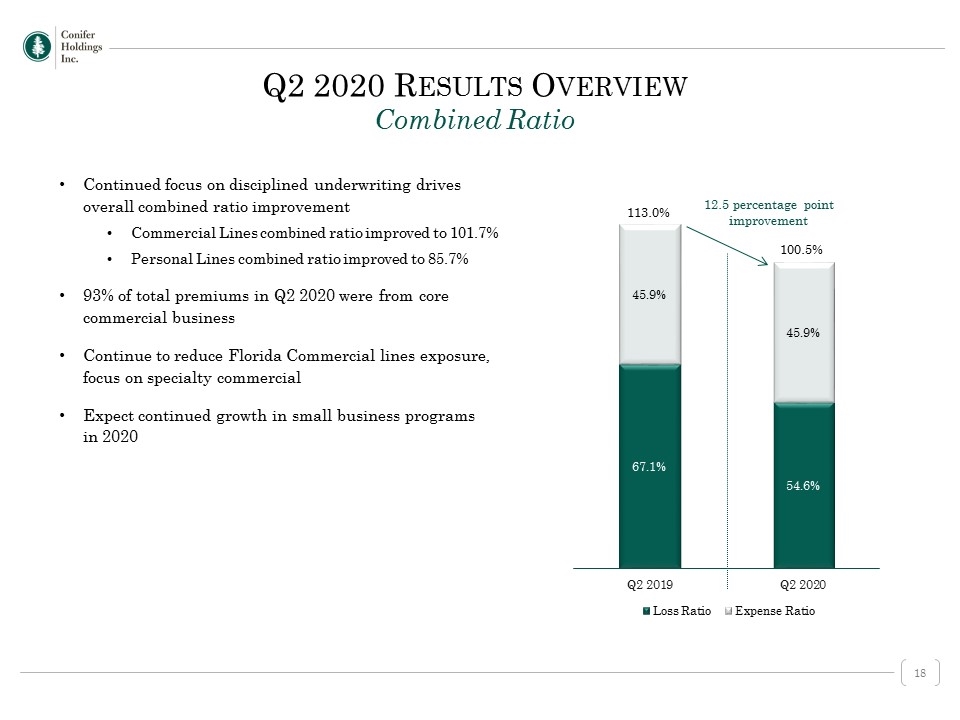
Continued focus on disciplined underwriting drives overall combined ratio improvement Commercial Lines combined ratio improved to 101.7% Personal Lines combined ratio improved to 85.7% 93% of total premiums in Q2 2020 were from core commercial business Continue to reduce Florida Commercial lines exposure, focus on specialty commercial Expect continued growth in small business programs in 2020 Q2 2020 Results Overview Combined Ratio 113.0% 100.5% 12.5 percentage point improvement
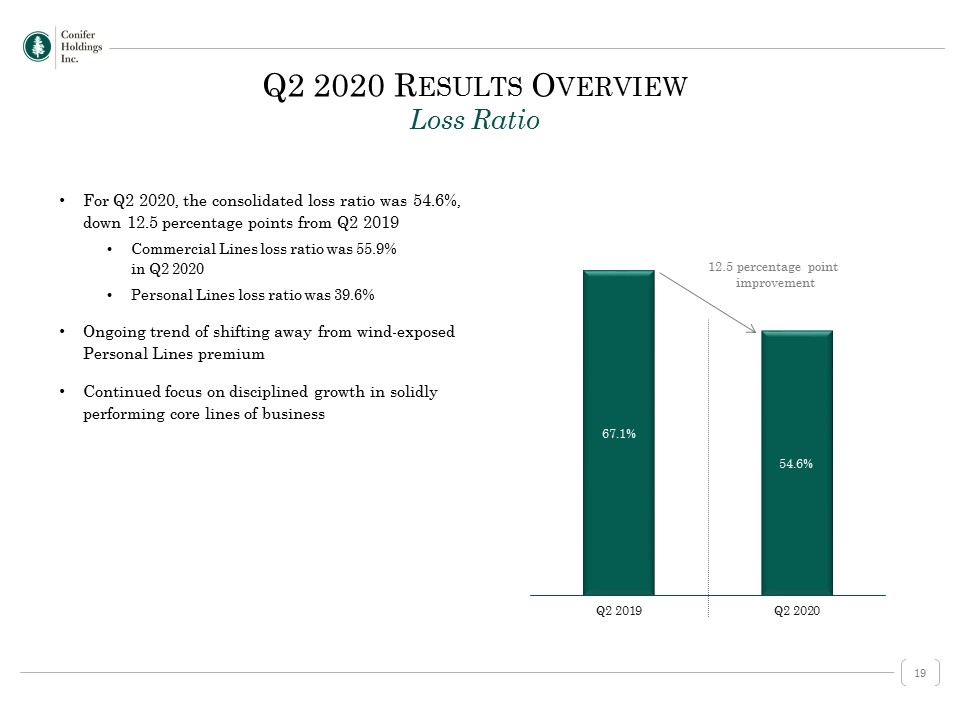
For Q2 2020, the consolidated loss ratio was 54.6%, down 12.5 percentage points from Q2 2019 Commercial Lines loss ratio was 55.9% in Q2 2020 Personal Lines loss ratio was 39.6% Ongoing trend of shifting away from wind-exposed Personal Lines premium Continued focus on disciplined growth in solidly performing core lines of business Q2 2020 Results Overview Loss Ratio 12.5 percentage point improvement
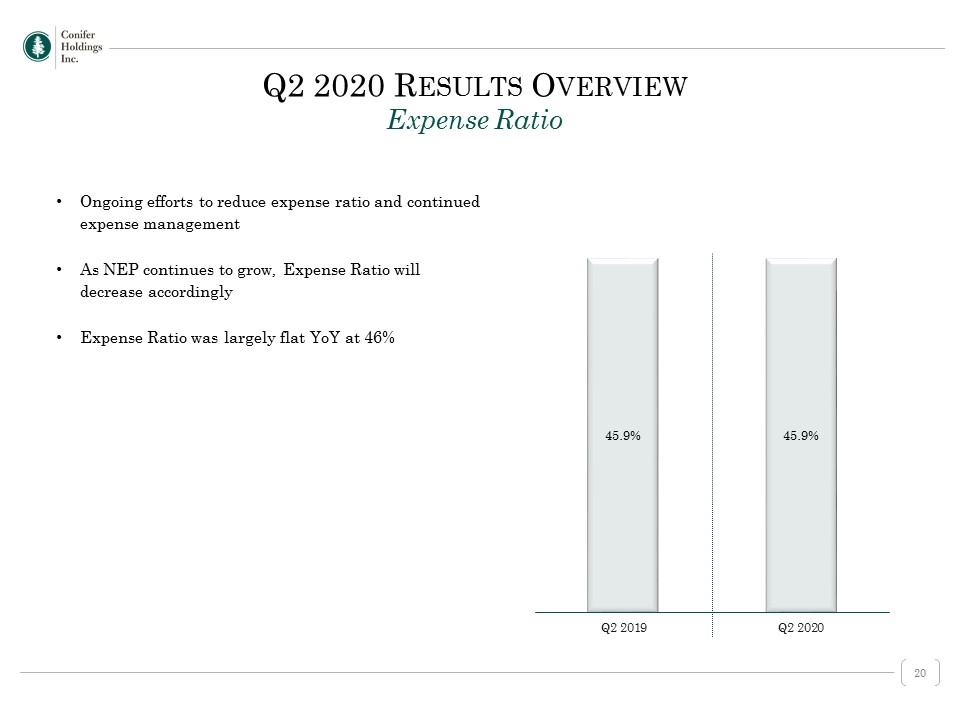
Ongoing efforts to reduce expense ratio and continued expense management As NEP continues to grow, Expense Ratio will decrease accordingly Expense Ratio was largely flat YoY at 46% Q2 2020 Results Overview Expense Ratio
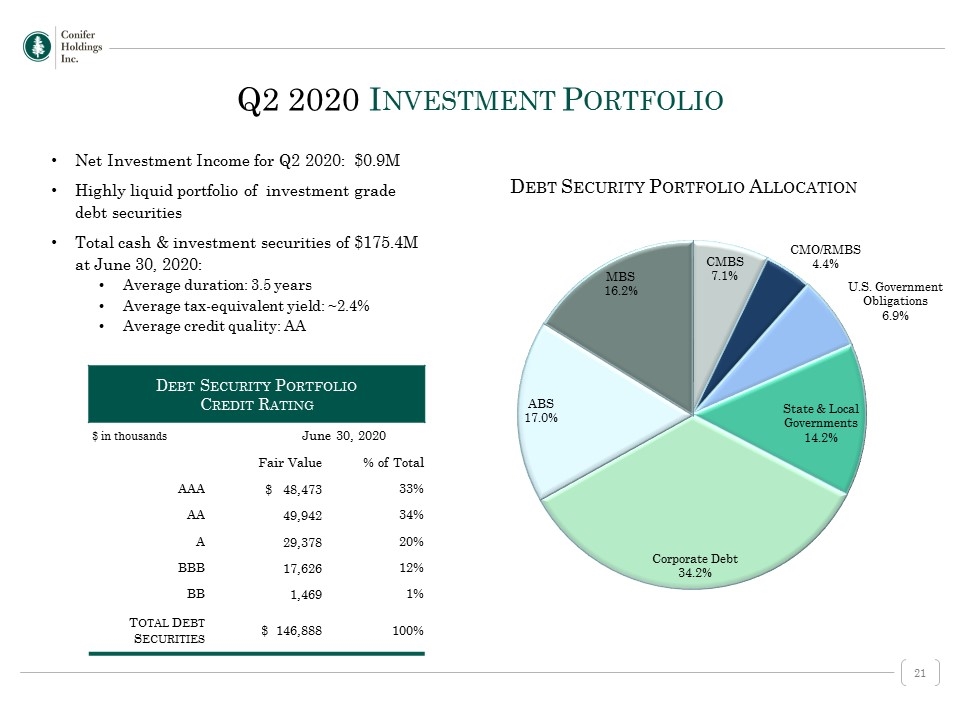
Debt Security Portfolio Allocation Net Investment Income for Q2 2020: $0.9M Highly liquid portfolio of investment grade debt securities Total cash & investment securities of $175.4M at June 30, 2020: Average duration: 3.5 years Average tax-equivalent yield: ~2.4% Average credit quality: AA Debt Security Portfolio Credit Rating $ in thousands June 30, 2020 Fair Value % of Total AAA $ 48,473 33% AA 49,942 34% A 29,378 20% BBB 17,626 12% BB 1,469 1% Total Debt Securities $ 146,888 100% Q2 2020 Investment Portfolio

Operating Trends Moving in the Right Direction 2 Attractive Entry Point Valuation Based on Operating Trajectory 3 Focused Expertise in Niche Specialty Insurance Markets 1 Investment Thesis
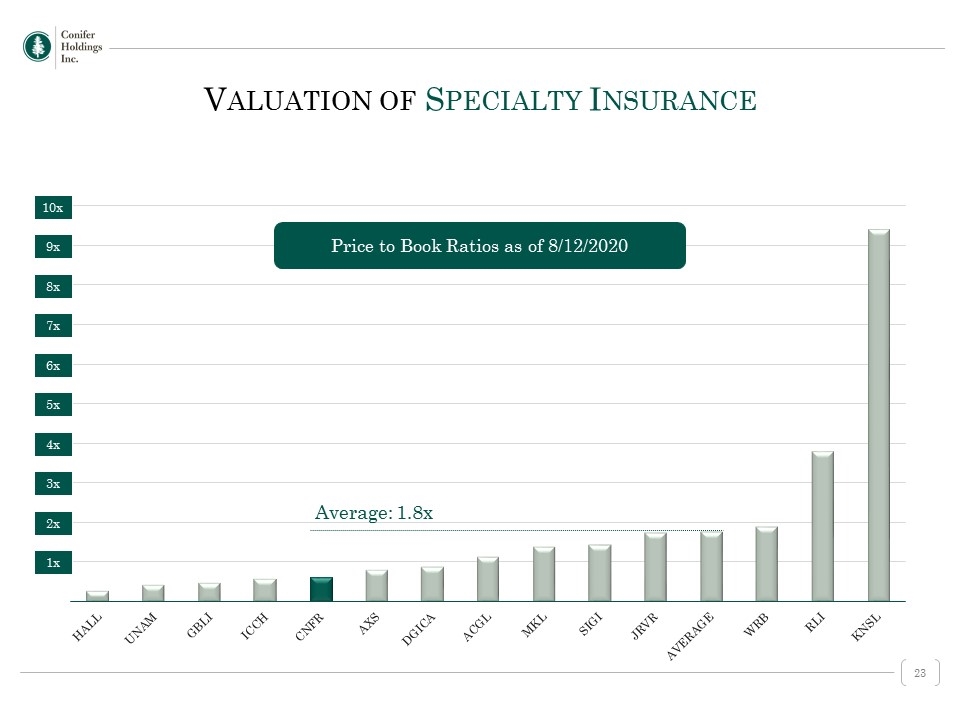
Price to Book Ratios as of 8/12/2020 7x 2x 4x 5x 3x 1x 6x Average: 1.8x Valuation of Specialty Insurance 9x 8x 10x
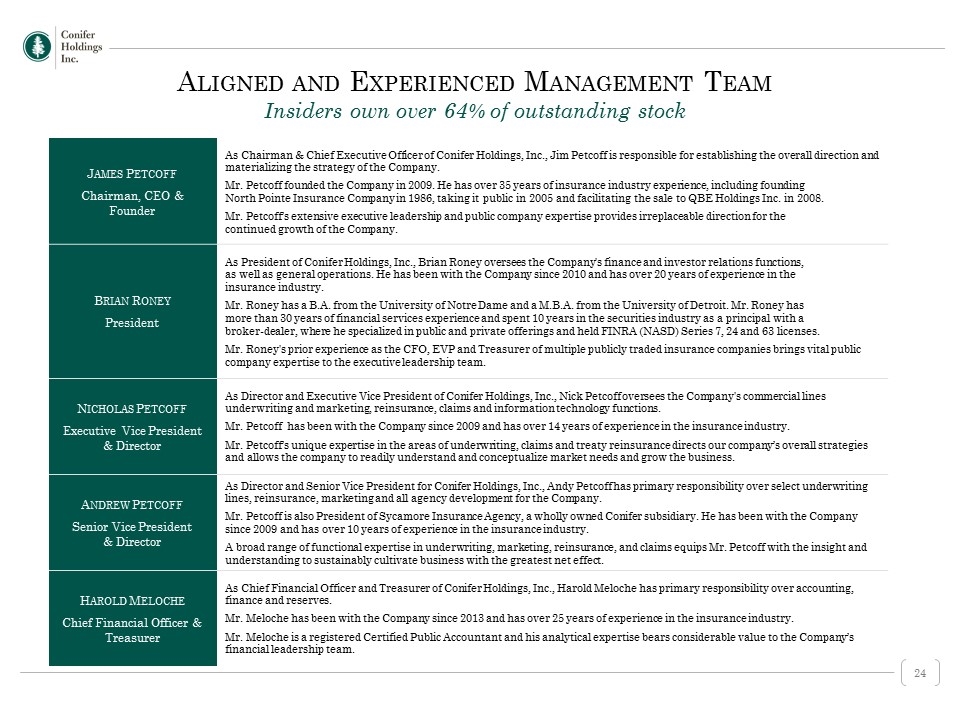
Aligned and Experienced Management Team Insiders own over 64% of outstanding stock James Petcoff Chairman, CEO & Founder As Chairman & Chief Executive Officer of Conifer Holdings, Inc., Jim Petcoff is responsible for establishing the overall direction and materializing the strategy of the Company. Mr. Petcoff founded the Company in 2009. He has over 35 years of insurance industry experience, including founding North Pointe Insurance Company in 1986, taking it public in 2005 and facilitating the sale to QBE Holdings Inc. in 2008. Mr. Petcoff’s extensive executive leadership and public company expertise provides irreplaceable direction for the continued growth of the Company. Brian Roney President As President of Conifer Holdings, Inc., Brian Roney oversees the Company's finance and investor relations functions, as well as general operations. He has been with the Company since 2010 and has over 20 years of experience in the insurance industry. Mr. Roney has a B.A. from the University of Notre Dame and a M.B.A. from the University of Detroit. Mr. Roney has more than 30 years of financial services experience and spent 10 years in the securities industry as a principal with a broker-dealer, where he specialized in public and private offerings and held FINRA (NASD) Series 7, 24 and 63 licenses. Mr. Roney's prior experience as the CFO, EVP and Treasurer of multiple publicly traded insurance companies brings vital public company expertise to the executive leadership team. Nicholas Petcoff Executive Vice President & Director As Director and Executive Vice President of Conifer Holdings, Inc., Nick Petcoff oversees the Company's commercial lines underwriting and marketing, reinsurance, claims and information technology functions. Mr. Petcoff has been with the Company since 2009 and has over 14 years of experience in the insurance industry. Mr. Petcoff’s unique expertise in the areas of underwriting, claims and treaty reinsurance directs our company’s overall strategies and allows the company to readily understand and conceptualize market needs and grow the business. Andrew Petcoff Senior Vice President & Director As Director and Senior Vice President for Conifer Holdings, Inc., Andy Petcoff has primary responsibility over select underwriting lines, reinsurance, marketing and all agency development for the Company. Mr. Petcoff is also President of Sycamore Insurance Agency, a wholly owned Conifer subsidiary. He has been with the Company since 2009 and has over 10 years of experience in the insurance industry. A broad range of functional expertise in underwriting, marketing, reinsurance, and claims equips Mr. Petcoff with the insight and understanding to sustainably cultivate business with the greatest net effect. Harold Meloche Chief Financial Officer & Treasurer As Chief Financial Officer and Treasurer of Conifer Holdings, Inc., Harold Meloche has primary responsibility over accounting, finance and reserves. Mr. Meloche has been with the Company since 2013 and has over 25 years of experience in the insurance industry. Mr. Meloche is a registered Certified Public Accountant and his analytical expertise bears considerable value to the Company’s financial leadership team.
Balance Sheet Remains Well-Positioned to Support Companies Significant Runway for Additional Growth Opportunities Financial Trends Moving Toward Sustained Profitable Operations Tech Investments Create a Scalable Platform Why Conifer
Contact: Adam Prior 212-836-9606 aprior@equityny.com Appendix Income Statement Balance Sheet Summary Financial Information Adjusted Operating EPS
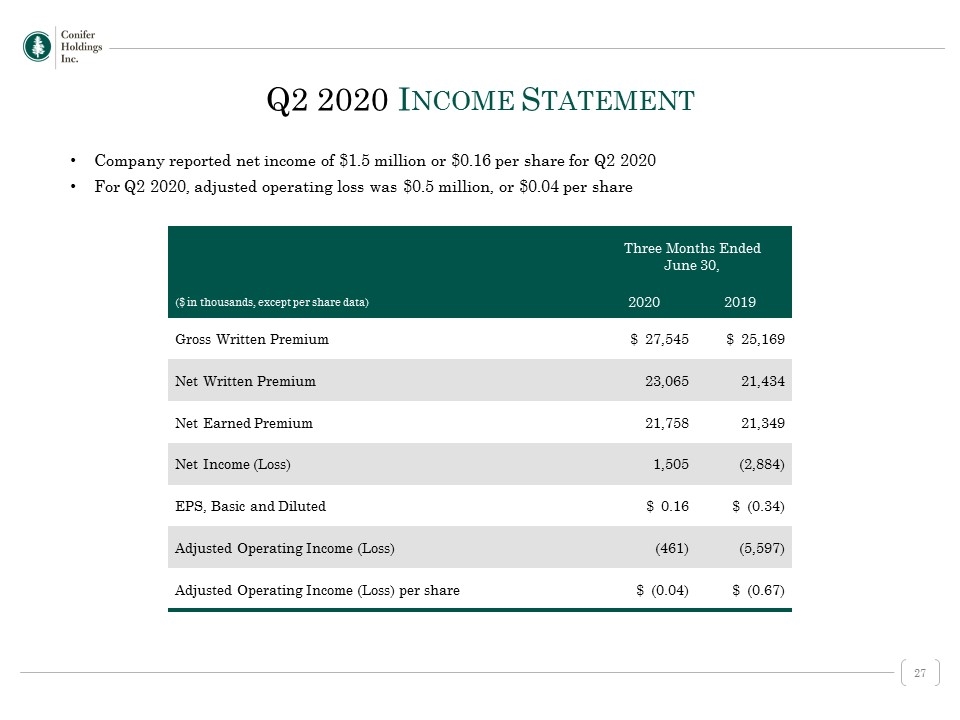
Company reported net income of $1.5 million or $0.16 per share for Q2 2020 For Q2 2020, adjusted operating loss was $0.5 million, or $0.04 per share Three Months Ended June 30, ($ in thousands, except per share data) 2020 2019 Gross Written Premium $ 27,545 $ 25,169 Net Written Premium 23,065 21,434 Net Earned Premium 21,758 21,349 Net Income (Loss) 1,505 (2,884) EPS, Basic and Diluted $ 0.16 $ (0.34) Adjusted Operating Income (Loss) (461) (5,597) Adjusted Operating Income (Loss) per share $ (0.04) $ (0.67) Q2 2020 Income Statement
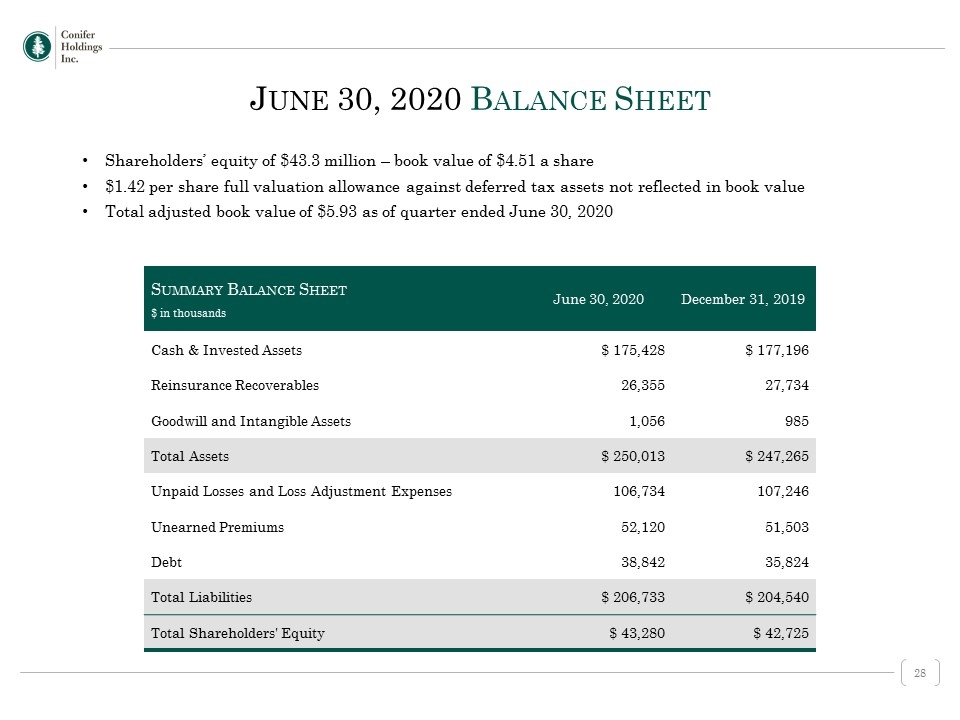
Shareholders’ equity of $43.3 million – book value of $4.51 a share $1.42 per share full valuation allowance against deferred tax assets not reflected in book value Total adjusted book value of $5.93 as of quarter ended June 30, 2020 Summary Balance Sheet $ in thousands June 30, 2020 December 31, 2019 Cash & Invested Assets $ 175,428 $ 177,196 Reinsurance Recoverables 26,355 27,734 Goodwill and Intangible Assets 1,056 985 Total Assets $ 250,013 $ 247,265 Unpaid Losses and Loss Adjustment Expenses 106,734 107,246 Unearned Premiums 52,120 51,503 Debt 38,842 35,824 Total Liabilities $ 206,733 $ 204,540 Total Shareholders' Equity $ 43,280 $ 42,725 June 30, 2020 Balance Sheet
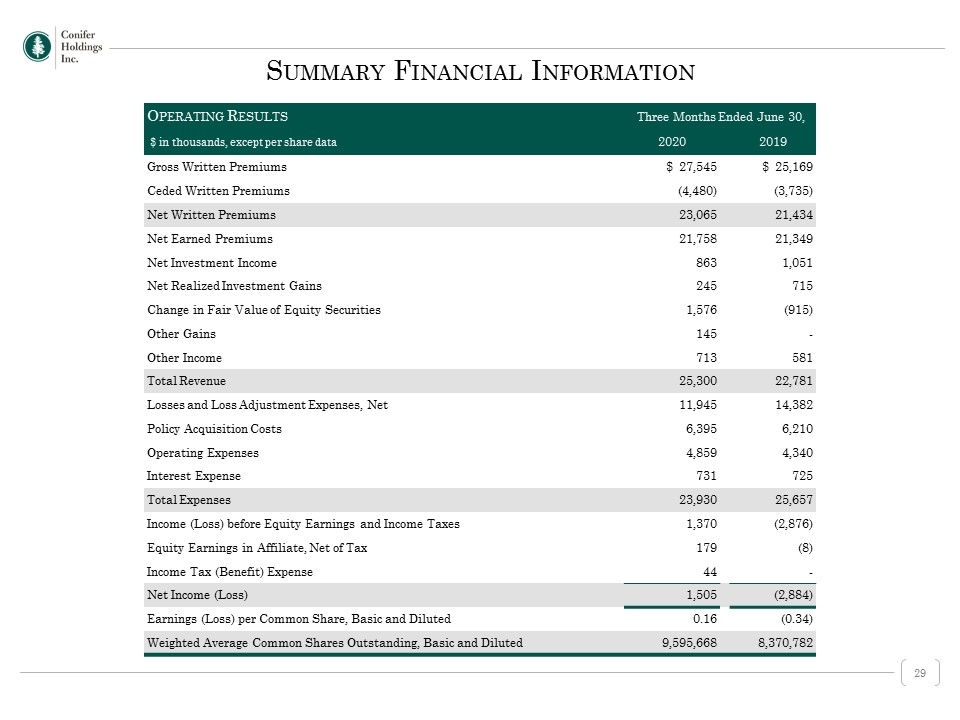
Operating Results Three Months Ended June 30, $ in thousands, except per share data 2020 2019 Gross Written Premiums $ 27,545 $ 25,169 Ceded Written Premiums (4,480) (3,735) Net Written Premiums 23,065 21,434 Net Earned Premiums 21,758 21,349 Net Investment Income 863 1,051 Net Realized Investment Gains 245 715 Change in Fair Value of Equity Securities 1,576 (915) Other Gains 145 - Other Income 713 581 Total Revenue 25,300 22,781 Losses and Loss Adjustment Expenses, Net 11,945 14,382 Policy Acquisition Costs 6,395 6,210 Operating Expenses 4,859 4,340 Interest Expense 731 725 Total Expenses 23,930 25,657 Income (Loss) before Equity Earnings and Income Taxes 1,370 (2,876) Equity Earnings in Affiliate, Net of Tax 179 (8) Income Tax (Benefit) Expense 44 - Net Income (Loss) 1,505 (2,884) Earnings (Loss) per Common Share, Basic and Diluted 0.16 (0.34) Weighted Average Common Shares Outstanding, Basic and Diluted 9,595,668 8,370,782 Summary Financial Information
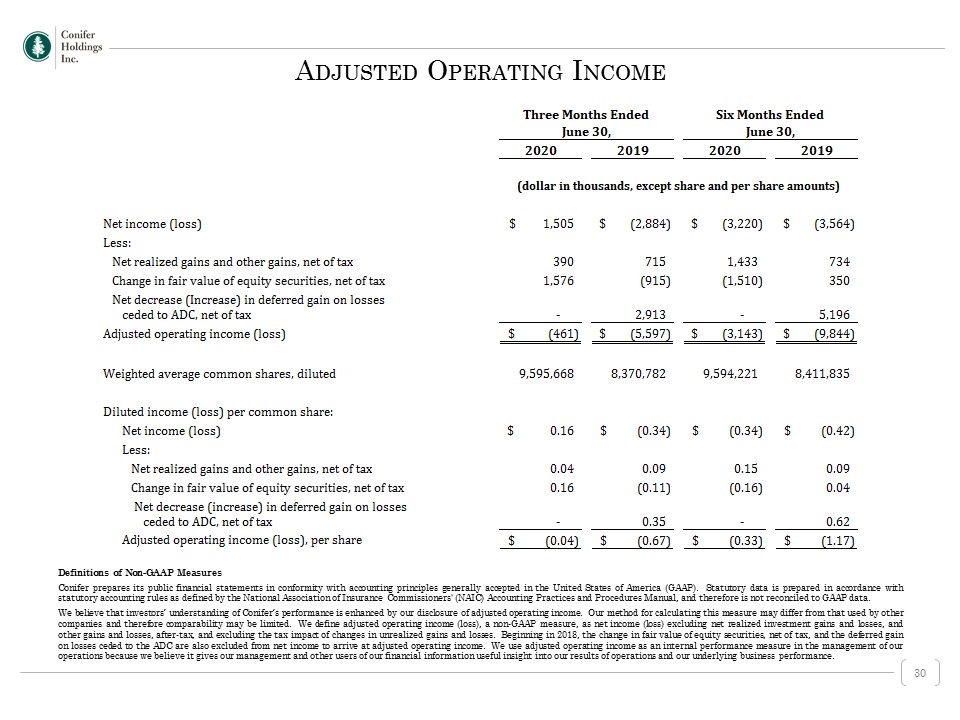
Definitions of Non-GAAP Measures Conifer prepares its public financial statements in conformity with accounting principles generally accepted in the United States of America (GAAP). Statutory data is prepared in accordance with statutory accounting rules as defined by the National Association of Insurance Commissioners' (NAIC) Accounting Practices and Procedures Manual, and therefore is not reconciled to GAAP data. We believe that investors’ understanding of Conifer’s performance is enhanced by our disclosure of adjusted operating income. Our method for calculating this measure may differ from that used by other companies and therefore comparability may be limited. We define adjusted operating income (loss), a non-GAAP measure, as net income (loss) excluding net realized investment gains and losses, and other gains and losses, after-tax, and excluding the tax impact of changes in unrealized gains and losses. Beginning in 2018, the change in fair value of equity securities, net of tax, and the deferred gain on losses ceded to the ADC are also excluded from net income to arrive at adjusted operating income. We use adjusted operating income as an internal performance measure in the management of our operations because we believe it gives our management and other users of our financial information useful insight into our results of operations and our underlying business performance. Adjusted Operating Income
