Attached files
| file | filename |
|---|---|
| EX-99.2 - EX-99.2 - CARVANA CO. | ex992q22020.htm |
| 8-K - 8-K - CARVANA CO. | cvna-20200805.htm |
Exhibit 99.1
Dear Shareholders,
The first half of 2020 has been an unprecedented time for all of us as we have grappled with the health and economic consequences of COVID-19. It has also been the most dynamic period we have managed through as a company. The second quarter started at the peak of COVID-19 related economic disruption and ended with structural shifts in customer preferences leading to the strongest demand we have ever seen. Throughout, we have been tested—operationally and culturally. We have risen to the occasion as can be seen in our results, and the quality of our customer experiences. There is a lot to discuss in the quarter and a lot of detail to parse, but we believe the way the team handled the dynamic environment and came together is the development with the most important long term implications. We are extremely proud of our team.
Looking forward, we are as optimistic as ever. It is still hard to say exactly how powerful the effects of all of this will be in the long run, but based on the data we see, we believe the long-term opportunity of the business is even larger than we previously thought and that the medium-term opportunity may be materially larger as COVID-19 and its follow on effects have likely accelerated the adoption of ecommerce across retail verticals. In the immediate term, we have our work cut out for us to catch up with the demand we are seeing and we are up to the challenge.
For the last seven years we have worked tirelessly to build a scalable offering that leverages modern technology to deliver the best customer experiences available anywhere and we have positioned ourselves as well as we could have for the behavior changes we are now witnessing. As a team we are focused on pouring the same energy that got us here in that short period of time into continuing our journey to selling 2 million+ cars per year and becoming the largest and most profitable automotive retailer.
Summary of Q2 2020 Results
All financial comparisons stated below are versus Q2 2019, unless otherwise noted. Complete financial tables appear at the end of this letter.
Q2 2020 Financial Results:
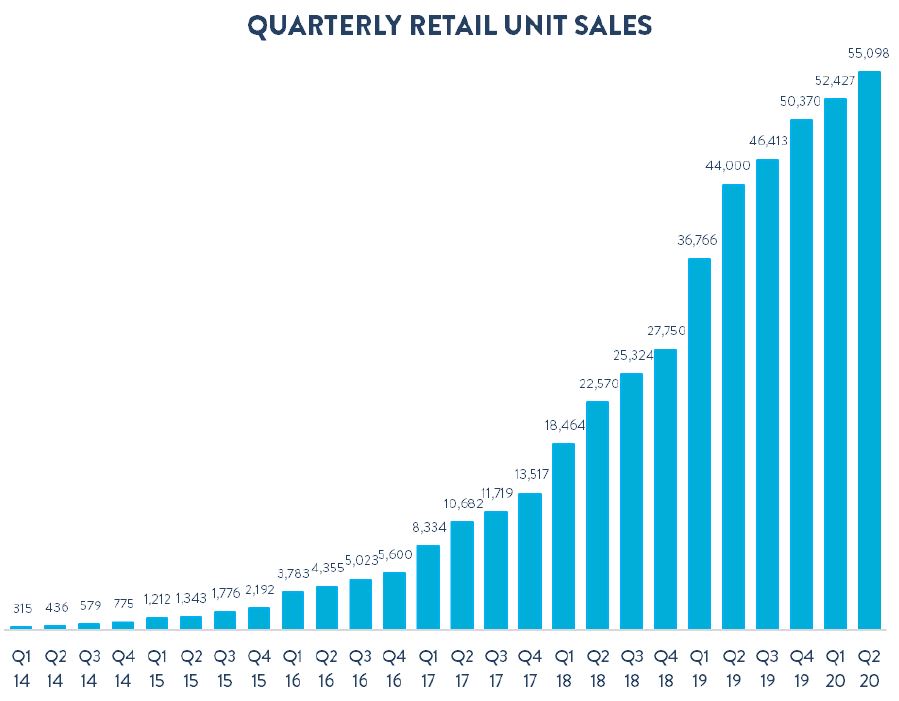
•Retail units sold totaled 55,098, an increase of 25%
•Revenue totaled $1.118 billion, an increase of 13%
•Total gross profit was $150 million, an increase of 9%
•Total gross profit per unit was $2,726, a decrease of $406 1
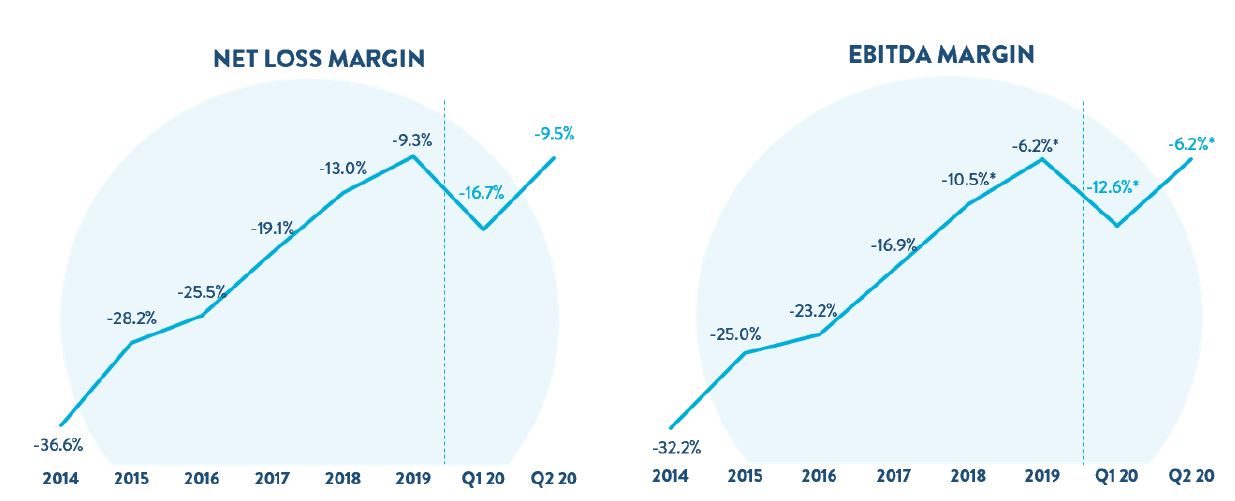
•Net loss was ($106) million, an increase of 66%
•EBITDA margin was (6.2%), a decrease from (3.6%) 2
•Basic and diluted net loss per Class A share was $0.62 based on 66.3 million shares of Class A common stock outstanding
Q2 2020 Other Results:
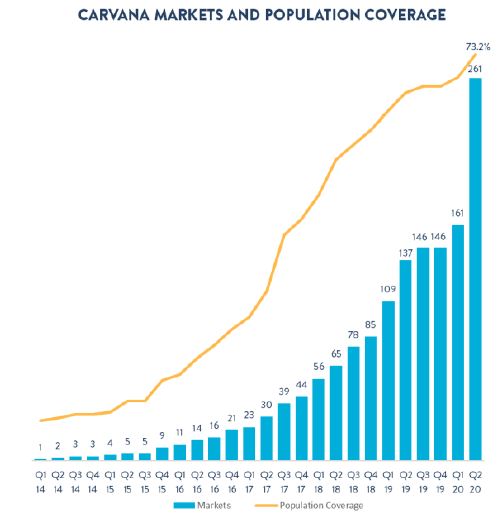
•Opened 100 new markets, bringing our end-of-quarter total to 261, covering 73.2% of the U.S. population.
•Closed two equity offerings, resulting in $1.06 billion of net proceeds.
•On June 25, we launched CarvanaACCESS, a direct-purchase platform, giving wholesale buyers access to a broad selection of Carvana inventory through a centralized user-friendly platform.
Recent Events
•Opened our 9th inspection and reconditioning center (IRC) near Columbus, Ohio.
1 Includes a $0 and $43 impact for the current and prior year period, respectively, from the 100k Milestone Gift
2 Includes a 0.0% and 0.3% impact for the current and prior year period, respectively, from the 100k Milestone Gift
1
Outlook
In light of the uncertainty surrounding COVID-19 and its economic repercussions, we are not providing guidance at this time. Instead, we are providing more granular quarterly data and directional color.
Sales began to rebound in late April, and continued to improve with sales growth of approximately 40% year-over-year later in the quarter. This sales strength continued in July.
We are currently seeing more demand for our offering than we’ve ever seen in our history. However, as a result of pausing purchasing operations and reducing production capacity at the onset of the pandemic, as well as ongoing COVID-19 related disruptions more recently, we are inventory-constrained and over the immediate term we expect our sales volumes to largely be dictated by our production capacity.
Looking toward Q3, we expect Total GPU to increase relative to Q2, primarily driven by higher retail GPU, and we expect meaningful EBITDA margin improvement.
For more information regarding the non-GAAP financial measures discussed in this letter, please see the reconciliations of our non-GAAP measurements to their most directly comparable GAAP-based financial measurements included at the end of this letter.
2
Managing the Business Through COVID-19 and Beyond
The COVID-19 pandemic has required real-time responses across all areas of our business. Over this short period of time, we faced unprecedented disruption, health concerns, the need to implement new policies to keep our team safe, as well as rapid demand declines followed by unprecedented demand recovery. Through it all, we reacted nimbly to the changing environment by utilizing our company values and a long-term lens. We’ve categorized the crisis thus far into three distinct phases.
In the first phase, as demand decreased, we immediately responded by de-risking the business and preparing for uncertainty. Then, as demand started to rebound, we quickly adapted and scaled up operations and production. Currently, we are experiencing operational constraints, which we are actively working to alleviate. More granular detail is illustrated below.
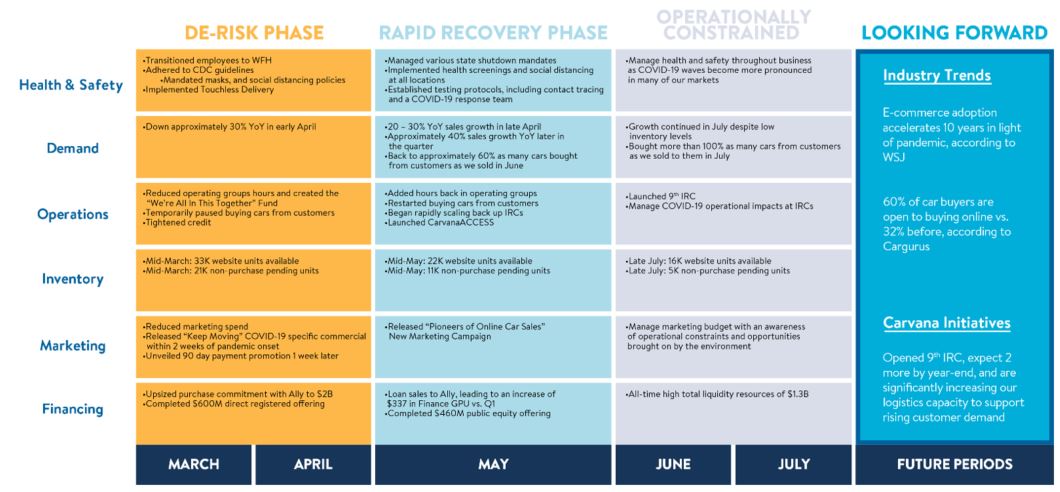
We are extremely optimistic about the implications of recent consumer behavior shifts in the medium and long-term.
Seven years ago we began on a journey to provide a seamless end-to-end online automotive retail experience. We methodically assembled the right technology, infrastructure, brand, team, and culture to give customers the best online car buying experience available. And we are tirelessly working to continue to improve our offering every day. These efforts have led to 6 straight years of triple digit growth and positioned us as the clear market leader. Today customer preferences are moving even more rapidly in our direction.
COVID-19 has caused all of us to reevaluate our shopping behaviors. Many people who previously would not have considered buying a car online are giving it a second thought. In a recent CarGurus survey, 60% of respondents said they were open to buying a car online vs. 32% before. We believe this shift is here to stay.
3
Expansion
We opened a record 100 new markets in Q2 2020, increasing the total percentage of the U.S. population we serve in our 261 markets to 73.2%, up from 68.7% at the end of Q1 2020.
Following quarter-end, we launched our ninth IRC near Columbus, Ohio, a four-line facility increasing our annual production capacity to nearly 500K vehicles at full utilization. We expect to open two additional IRCs by year-end that are currently under construction and will provide over 100K in additional production capacity. Beyond those, we also have a robust IRC pipeline that will continue building on our existing foundation to achieve our long-term goal of 2 million+ cars per year. To correspondingly scale up other components of the supply chain, we are also significantly increasing capacity in our logistics and last mile delivery network to support rising customer demand.
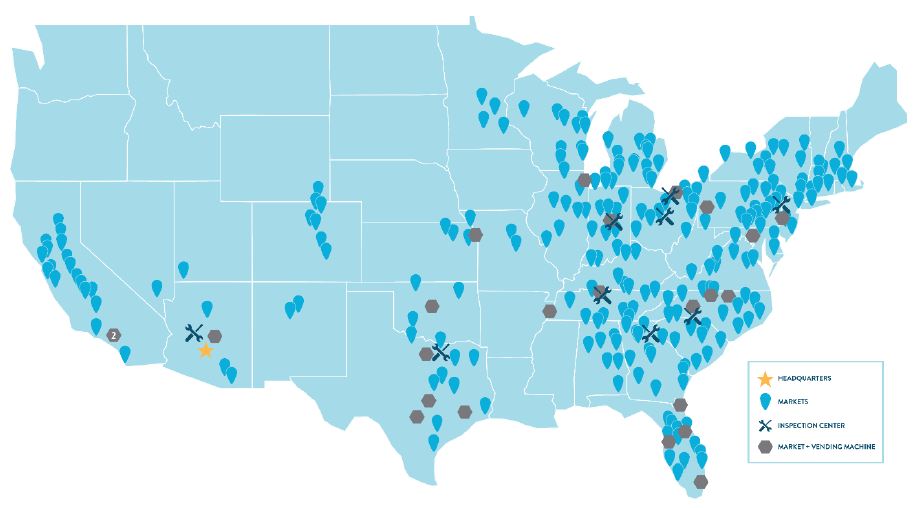
*Represents facilities and markets as of August 5, 2020
For a complete list of our market opening history, estimated populations, and estimated total industry used vehicle sales by market, along with details on our IRCs, please see: investors.carvana.com/resources/investor-materials.
4
Management Objectives
As discussed in previous shareholder letters, our management team focuses on delivering an exceptional and unparalleled customer experience while simultaneously growing the business rapidly and achieving our financial objectives. We firmly believe wowing the customer is the core of our model and drives all other metrics. To realize our long-term vision, our three primary financial objectives remain unchanged: (1) Grow Retail Units and Revenue; (2) Increase Total Gross Profit Per Unit; and (3) Demonstrate Operating Leverage. We believe continued focus on these goals will lead to a strong long-term financial model.
Below we present our long-term financial model that we introduced at our Analyst Day on November 29, 2018. We believe this is the appropriate frame through which to evaluate our results and progress towards each of our financial objectives.
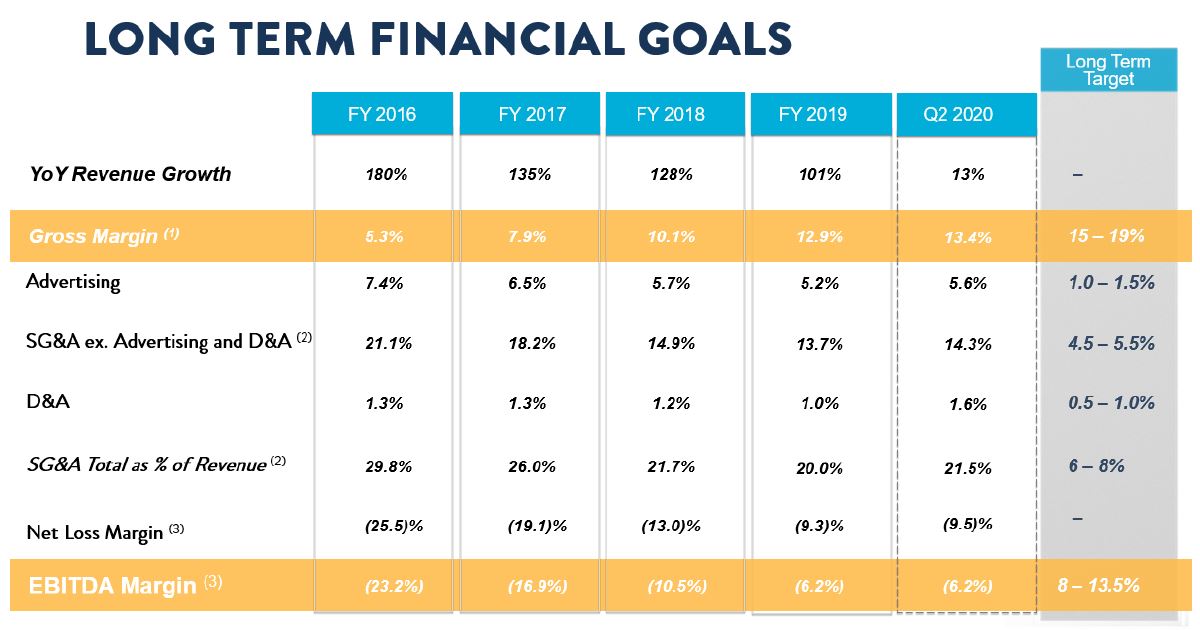
(1) Gift impact of 0.2%, 0.1%, and 0.0% in 2018, 2019, and Q2 2020, respectively.
(2) Gift impact of 0.4%, 0.2%, and 0.0% in 2018, 2019, and Q2 2020, respectively.
(3) Gift impact of 0.6%, 0.4%, and 0.0% in 2018, 2019, and Q2 2020, respectively.
Note: Numbers may not foot due to rounding.
5
Objective #1: Grow Retail Units and Revenue
Retail units sold and revenue grew year-over-year despite sales hitting a low for the year in April due to COVID-19. Sales began to rebound in late April, and continued to improve with sales growth of approximately 40% year-over-year later in the quarter.
For the quarter, retail units sold increased to 55,098, up 25% from 44,000 in Q2 2019. Q2 revenue grew to $1.118 billion, up 13% from $986 million. Growth in units was higher than growth in revenue primarily due to lower average selling prices and lower wholesale revenue this quarter compared to Q2 2019. Lower average selling prices were driven primarily by vehicle acquisition mix, and lower wholesale revenue was driven primarily by pausing purchasing from customers early in the pandemic.
Our rapid growth in retail units sold in June was achieved despite significant constraints on inventory. We ended the quarter with 16,479 website units available, and the number of vehicles available for immediate purchase by customers (excluding purchase pending or work-in-process vehicles) was 5,914, our lowest level since Q3 2018.
Our current low inventory levels are driven by several factors related to COVID-19. First, we are seeing record demand at the top of the funnel as customers nationwide increasingly seek to buy cars online. Second, early in the pandemic we paused purchasing and production to limit risk, leading to lower inventory today. Third, the spread of COVID in regions where we have IRCs has led to a temporary reduction in production throughput and lower than normalized hiring rates.
Record demand for our offering combined with production capacity constraints has led inventory efficiency, which we define as the ratio between quarterly retail units sold (or 3x monthly retail units sold for monthly data) and average website units available, to be significantly higher than any prior point in our history. While on the one hand this demonstrates our ability to turn cars extremely quickly – a noticeable positive for the long-term model – on the other we believe our current inventory is meaningfully limiting sales, making growing inventory our top company priority.
We are taking several steps to increase inventory in the near-term. We are actively hiring to staff our existing IRCs and have mobilized our recruiting and training teams to support this effort. In addition, as described in the expansion section, we recently launched our ninth IRC, are on track to open two additional IRCs by year-end, and have a robust pipeline of IRCs beyond that.
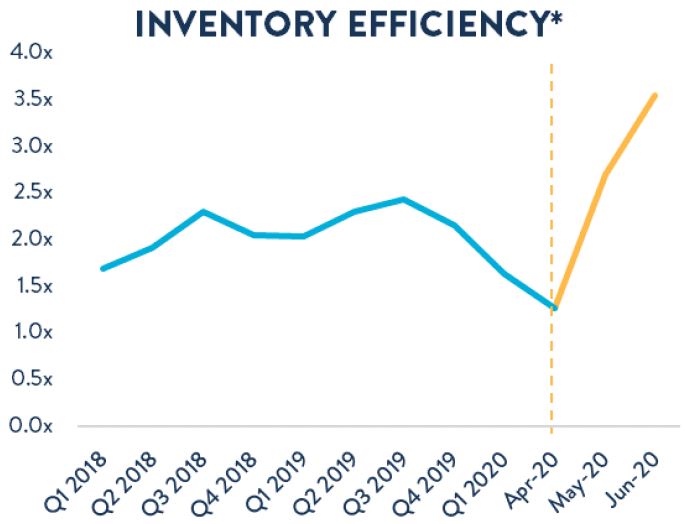
*Quarterly retail units sold (or 3x monthly retail units sold for monthly data) as multiple of average website units available
6
Buying Cars from Customers
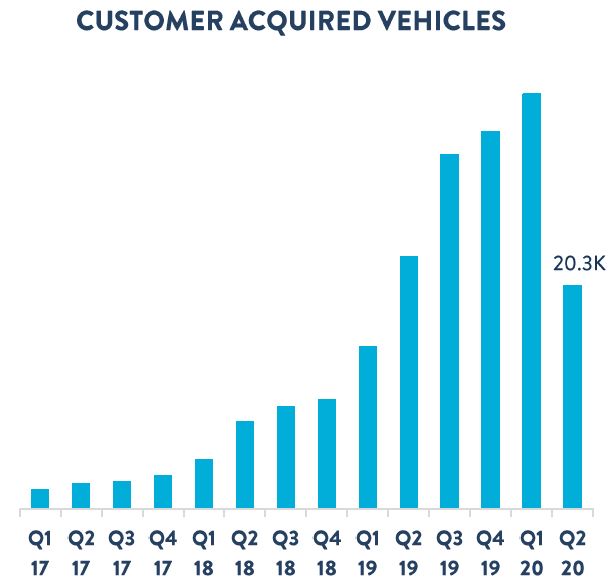
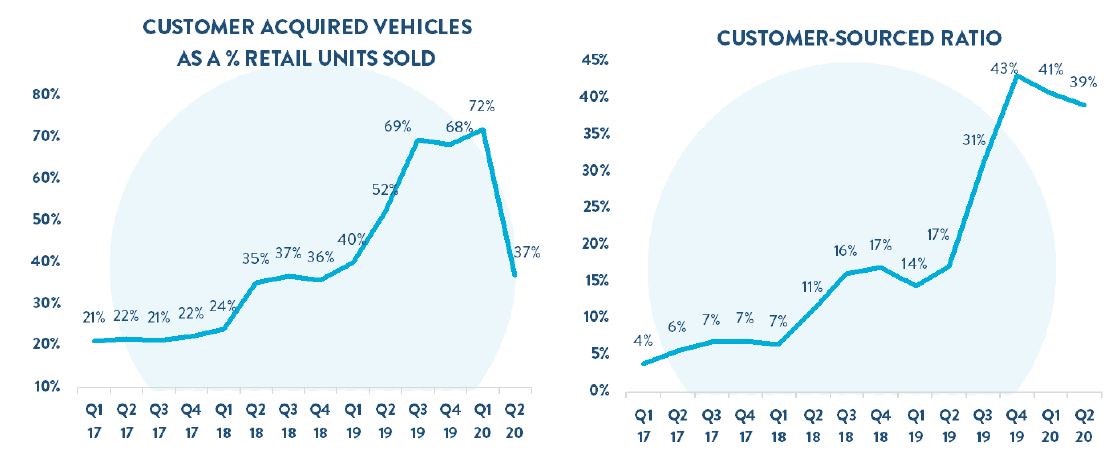
We remain focused on buying more cars from our customers and are excited about further simplifying the automotive value chain and diversifying our inventory. In Q2 2020, we acquired 20.3K vehicles from customers, 37% as many cars as we sold, down from 52% a year ago as a result of our decision to temporarily pause standalone vehicles purchases from customers in March and April due to uncertainty surrounding COVID-19.
After resuming these purchases from customers near the end of April, we rapidly accelerated the number of cars we bought from customers. This strength continued into July, when we bought more than 100% as many cars from customers as we sold to them, hitting an exciting milestone we’ve been building toward since launching our buying cars from customers offering.
7
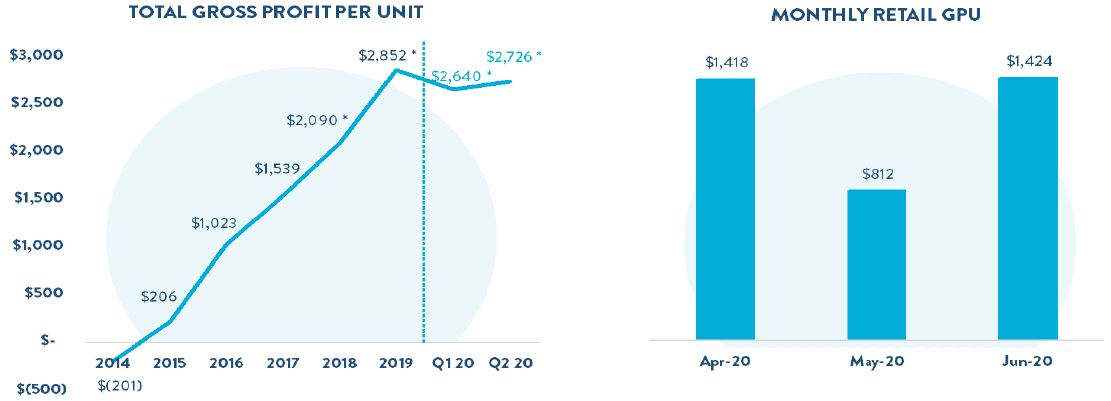
Objective #2: Increase Total Gross Profit Per Unit
Total GPU showed resilience in Q2 and improved from Q1 levels despite the impact from COVID-19. The sequential growth in GPU was driven primarily by strength in Finance GPU and Wholesale GPU.
For Q2 2020:
•Total
◦Total GPU was $2,726 vs. $3,132 in Q2 2019 and $2,640 in Q1 2020 3
•Retail
◦Retail GPU was $1,190 vs. $1,440 in Q2 2019 and $1,581 in Q1 2020 3
◦Year-over-year changes in retail vehicle GPU were primarily driven by higher average days to sale partially offset by strength in customer-sourced vehicles. Sequential changes were primarily driven by higher average days to sale and higher average retail write-downs on vehicles acquired prior to COVID-19 that were sold after the start of the pandemic. The sale of pre-COVID vehicles early in the quarter combined with the subsequent purchase and sale of post-COVID vehicles later in the quarter led to a V-shaped pattern of retail GPU. Retail GPU reached a low in May before rebounding in June as higher margin post-COVID acquisitions reached the website.
•Wholesale
◦Wholesale GPU was $137 vs. $159 in Q2 2019 and $23 in Q1 2020 3
◦Year-over-year changes in wholesale GPU were driven by reduced wholesale volume offset by record gross profit per wholesale unit sold of $1,036 (or $695 excluding the impact of our wholesale valuation adjustment in Q1), an increase from $650 in Q2 2019. Reduced wholesale volume was primarily due to our temporary pause in acquiring cars from customers in March and April, while gross profit per wholesale unit was primarily driven by the rapid increase in wholesale market prices in May and June.
•Other
◦Other GPU was $1,399 vs. $1,532 in Q2 2019 and $1,036 in Q1 2020
◦Year-over-year changes in Other GPU were driven by lower finance GPU and partially offset by increased attachment of VSC. Total finance GPU was $865 in Q2 compared to $1,100 in Q2 2019 and $528 in Q1 2020. The YoY decrease was primarily due to a shift toward more stable loan monetization channels during this period of heightened uncertainty, while the sequential gain was primarily due to improved market conditions and credit tightening at the onset of the pandemic.
3 Total GPU includes a $0, $43, and $10 impact in Q2 2020, Q2 2019, and Q1 2020, respectively, from the 100k Milestone Gift. This includes a $0, $42, and $10 impact, respectively, in retail GPU, and a $0, $1, and $0 impact, respectively, in wholesale GPU.
8
*2018, 2019, Q1 2020, and Q2 2020 include a $43, $31, $10, and $0 impact from the 100k Milestone Gift, respectively.
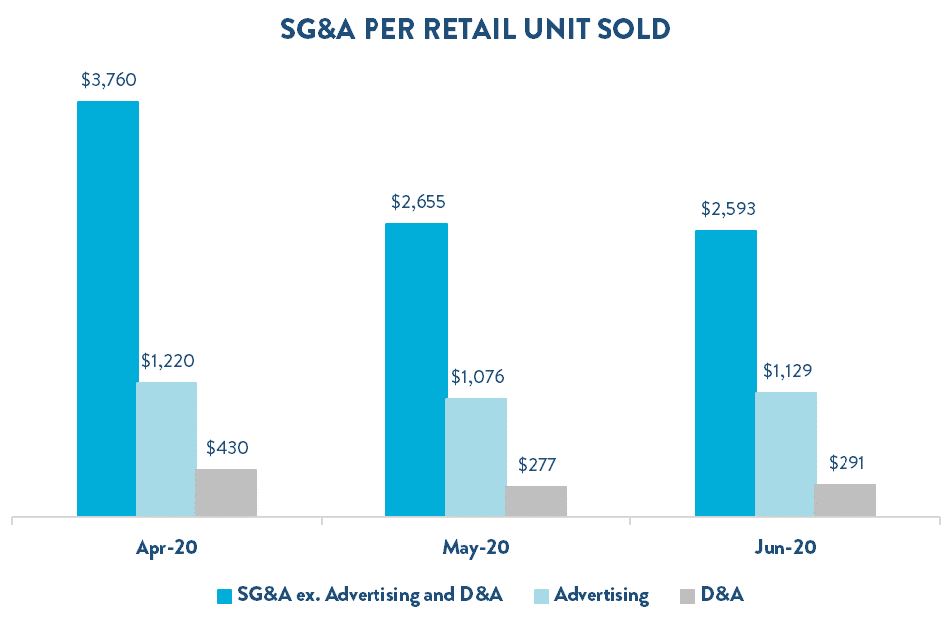
Objective #3: Demonstrate Operating Leverage
Following the spread of COVID-19, we took decisive action to pause corporate hiring and adjusted hours for operational employees to more closely align with current demand rather than positioning the business for future demand to the extent we historically have. These actions and a rebound in retail sales led to significant sequential improvements in SG&A throughout the quarter.
In total, we sold 2,671 more retail units in Q2 than Q1, while reducing total SG&A spend by approximately $36 million. This led SG&A as a percent of revenue to decline by 3.7% or $904 per retail unit from Q1 2020. We also demonstrated strong trends on operating leverage within the quarter as sales grew. From April to June, retail units sold increased from 13,548 to 20,627, while SG&A expenses declined by $1,398 per unit, evidencing our ability to flexibly respond to demand in a dynamic environment.
9
*2018, 2019, Q1 2020, and Q2 2020 include a 0.6%, 0.4%, 0.0%, and 0.0% impact from the 100k Milestone Gift, respectively.
Summary
The first half of this year has been unlike anything we have ever lived through. It has tested us in ways that we couldn’t have prepared for. The customer experience we deliver and our results demonstrate how well our team came together during this unprecedented time.
We have emerged from the first half of 2020 even stronger than we entered it. We believe that additional strength is coming from two sources: The first is the powerful reality that buying a car online has suddenly become normalized. That’s a really big deal.
The second source of strength probably won’t get as many headlines but it might be even more powerful. Our team has been battle-tested. We fought uncertainty together. We learned more about one another in that battle and we now share even stronger bonds.
We are on a mission to change the way people buy cars.
We remain focused on the long term. We remain energized and ambitious. And we are still just getting started.
Sincerely,
Ernie Garcia, III, Chairman and CEO
Mark Jenkins, CFO
10
Appendix
Conference Call Details
Carvana will host a conference call today, August 5, 2020, at 5:30 p.m. EDT (2:30 p.m. PDT) to discuss financial results. To participate in the live call, analysts and investors should dial (833) 255-2830 or (412) 902-6715, and ask for “Carvana Earnings.” A live audio webcast of the conference call along with supplemental financial information will also be accessible on the company's website at investors.carvana.com. Following the webcast, an archived version will also be available on the Investor Relations section of the company’s website. A telephonic replay of the conference call will be available until August 12, 2020, by dialing (877) 344-7529 or (412) 317-0088 and entering passcode 10146057#.
Forward Looking Statements
This letter contains forward-looking statements within the meaning of the Private Securities Litigation Reform Act of 1995. These forward-looking statements reflect Carvana’s current expectations and projections with respect to, among other things, its financial condition, results of operations, plans, objectives, future performance, and business. These statements may be preceded by, followed by or include the words "aim," "anticipate," "believe," "estimate," "expect," "forecast," "intend," "likely," "outlook," "plan," "potential," "project," "projection," "seek," "can," "could," "may," "should," "would," "will," the negatives thereof and other words and terms of similar meaning.
Forward-looking statements include all statements that are not historical facts. Such forward-looking statements are subject to various risks and uncertainties. Accordingly, there are or will be important factors that could cause actual outcomes or results to differ materially from those indicated in these statements. Among these factors are risks related to the “Risk Factors” identified in our Annual Report on Form 10-K for 2019 and our Quarterly Report on Form 10-Q for Q2 2020.
There is no assurance that any forward-looking statements will materialize. You are cautioned not to place undue reliance on forward-looking statements, which reflect expectations only as of this date. Carvana does not undertake any obligation to publicly update or review any forward-looking statement, whether as a result of new information, future developments, or otherwise.
Use of Non-GAAP Financial Measures
As appropriate, we supplement our results of operations determined in accordance with U.S. generally accepted accounting principles (“GAAP”) with certain non-GAAP financial measurements that are used by management, and which we believe are useful to investors, as supplemental operational measurements to evaluate our financial performance. These measurements should not be considered in isolation or as a substitute for reported GAAP results because they may include or exclude certain items as compared to similar GAAP-based measurements, and such measurements may not be comparable to similarly-titled measurements reported by other companies. Rather, these measurements should be considered as an additional way of viewing aspects of our operations that provide a more complete understanding of our business. We strongly encourage investors to review our consolidated financial statements included in publicly filed reports in their entirety and not rely solely on any one, single financial measurement or communication.
Reconciliations of our non-GAAP measurements to their most directly comparable GAAP-based financial measurements are included at the end of this letter.
Investor Relations Contact Information: Mike Levin, investors@carvana.com
11
CARVANA CO. AND SUBSIDIARIES
CONDENSED CONSOLIDATED BALANCE SHEETS
(Unaudited)
(In thousands)
| June 30, 2020 | December 31, 2019 | ||||||||||
| ASSETS | |||||||||||
| Current assets: | |||||||||||
| Cash and cash equivalents | $ | 246,299 | $ | 76,016 | |||||||
| Restricted cash | 119,987 | 42,443 | |||||||||
| Accounts receivable, net | 45,543 | 39,864 | |||||||||
| Finance receivables held for sale, net | 358,124 | 286,969 | |||||||||
| Vehicle inventory | 629,401 | 762,696 | |||||||||
| Beneficial interests in securitizations | 116,563 | 98,780 | |||||||||
Other current assets, including $1,248 and $0, respectively, due from related parties | 55,569 | 52,654 | |||||||||
| Total current assets | 1,571,486 | 1,359,422 | |||||||||
| Property and equipment, net | 704,748 | 543,471 | |||||||||
Operating lease right-of-use assets, including $42,691 and $44,583, respectively, from leases with related parties | 166,337 | 123,420 | |||||||||
| Intangible assets, net | 6,337 | 7,232 | |||||||||
| Goodwill | 9,353 | 9,353 | |||||||||
Other assets, including $10,502 and $6,138, respectively, due from related parties | 18,545 | 14,850 | |||||||||
| Total assets | $ | 2,476,806 | $ | 2,057,748 | |||||||
| LIABILITIES & STOCKHOLDERS' EQUITY | |||||||||||
| Current liabilities: | |||||||||||
Accounts payable and accrued liabilities, including $10,912 and $9,549, respectively, due to related parties | $ | 278,081 | $ | 234,443 | |||||||
| Short-term revolving facilities | 31,000 | 568,840 | |||||||||
| Current portion of long-term debt | 52,470 | 48,731 | |||||||||
Other current liabilities, including $4,329 and $4,518, respectively, from leases with related parties | 11,712 | 12,856 | |||||||||
| Total current liabilities | 373,263 | 864,870 | |||||||||
Long-term debt, excluding current portion, including $15,000 held by a related party | 965,668 | 883,060 | |||||||||
Operating lease liabilities, excluding current portion, including $39,664 and $41,829, respectively, from leases with related parties | 163,210 | 116,071 | |||||||||
| Other liabilities | 1,584 | 1,808 | |||||||||
| Total liabilities | 1,503,725 | 1,865,809 | |||||||||
| Commitments and contingencies | |||||||||||
| Stockholders' equity: | |||||||||||
Preferred stock, $0.01 par value - 50,000 shares authorized; none issued and outstanding as of June 30, 2020 and December 31, 2019 | — | — | |||||||||
Class A common stock, $0.001 par value - 500,000 shares authorized; 69,414 and 50,507 shares issued and outstanding as of June 30, 2020 and December 31, 2019, respectively | 69 | 51 | |||||||||
Class B common stock, $0.001 par value - 125,000 shares authorized; 101,200 and 101,219 shares issued and outstanding as of June 30, 2020 and December 31, 2019, respectively | 101 | 101 | |||||||||
| Additional paid-in capital | 709,536 | 280,994 | |||||||||
| Accumulated deficit | (283,751) | (183,034) | |||||||||
| Total stockholders' equity attributable to Carvana Co. | 425,955 | 98,112 | |||||||||
| Non-controlling interests | 547,126 | 93,827 | |||||||||
| Total stockholders' equity | 973,081 | 191,939 | |||||||||
| Total liabilities & stockholders' equity | $ | 2,476,806 | $ | 2,057,748 | |||||||
12
CARVANA CO. AND SUBSIDIARIES
CONDENSED CONSOLIDATED STATEMENTS OF OPERATIONS
(Unaudited)
(In thousands, except per share amounts)
| Three Months Ended June 30, | Six Months Ended June 30, | ||||||||||||||||||||||
| 2020 | 2019 | 2020 | 2019 | ||||||||||||||||||||
| Sales and operating revenues: | |||||||||||||||||||||||
| Used vehicle sales, net | $ | 991,802 | $ | 855,785 | $ | 1,956,081 | $ | 1,539,614 | |||||||||||||||
| Wholesale vehicle sales | 49,434 | 63,014 | 129,040 | 96,044 | |||||||||||||||||||
Other sales and revenues, including $22,720, $13,989, $43,282, and $24,562, respectively, from related parties | 77,098 | 67,422 | 131,429 | 105,797 | |||||||||||||||||||
| Net sales and operating revenues | 1,118,334 | 986,221 | 2,216,550 | 1,741,455 | |||||||||||||||||||
Cost of sales, including $891, $1,217, $1,733, and $2,490, respectively, to related parties | 968,128 | 848,428 | 1,927,922 | 1,515,130 | |||||||||||||||||||
| Gross profit | 150,206 | 137,793 | 288,628 | 226,325 | |||||||||||||||||||
Selling, general and administrative expenses, including $4,491, $2,885, $8,917, and $5,620, respectively, to related parties | 239,934 | 181,843 | 515,645 | 337,084 | |||||||||||||||||||
Interest expense, including $333, $333, $666, and $666 to related parties | 19,915 | 19,315 | 48,777 | 34,963 | |||||||||||||||||||
| Other (income) expense, net | (3,079) | 694 | 14,327 | 933 | |||||||||||||||||||
| Net loss before income taxes | (106,564) | (64,059) | (290,121) | (146,655) | |||||||||||||||||||
| Income tax provision | (238) | — | (238) | — | |||||||||||||||||||
| Net loss | (106,326) | (64,059) | (289,883) | (146,655) | |||||||||||||||||||
| Net loss attributable to non-controlling interests | (65,496) | (43,736) | (189,166) | (103,217) | |||||||||||||||||||
| Net loss attributable to Carvana Co. | $ | (40,830) | $ | (20,323) | $ | (100,717) | $ | (43,438) | |||||||||||||||
| Net loss per share of Class A common stock, basic and diluted | $ | (0.62) | $ | (0.44) | $ | (1.73) | $ | (0.99) | |||||||||||||||
Weighted-average shares of Class A common stock, basic and diluted (1) | 66,327 | 46,038 | 58,363 | 43,695 | |||||||||||||||||||
(1) Weighted-average shares of Class A common stock outstanding have been adjusted for unvested restricted stock awards.
13
CARVANA CO. AND SUBSIDIARIES
CONDENSED CONSOLIDATED STATEMENTS OF CASH FLOWS
(Unaudited)
(In thousands)
| Six Months Ended June 30, | |||||||||||
| 2020 | 2019 | ||||||||||
| Cash Flows from Operating Activities: | |||||||||||
| Net loss | $ | (289,883) | $ | (146,655) | |||||||
| Adjustments to reconcile net loss to net cash used in operating activities: | |||||||||||
| Depreciation and amortization expense | 33,440 | 16,830 | |||||||||
| Loss on disposal of property and equipment | 4,643 | 653 | |||||||||
| Provision for bad debt and valuation allowance | 7,618 | 3,291 | |||||||||
| Gain on loan sales | (52,272) | (59,573) | |||||||||
| Equity-based compensation expense | 12,160 | 15,745 | |||||||||
| Amortization and write-off of debt issuance costs and bond premium | 3,838 | 2,172 | |||||||||
| Originations of finance receivables | (1,565,009) | (1,181,807) | |||||||||
| Proceeds from sale of finance receivables, net | 1,459,344 | 1,356,345 | |||||||||
| Purchase of finance receivables | — | (161,781) | |||||||||
| Principal payments received on finance receivables held for sale | 38,370 | 30,846 | |||||||||
| Unrealized loss (gain) on beneficial interests in securitization | 3,388 | (177) | |||||||||
| Changes in assets and liabilities: | |||||||||||
| Accounts receivable | (7,041) | (9,747) | |||||||||
| Vehicle inventory | 137,224 | (191,991) | |||||||||
| Other assets | (3,371) | (24,074) | |||||||||
| Accounts payable and accrued liabilities | 39,275 | 57,152 | |||||||||
| Operating lease right-of-use assets | (42,917) | (15,115) | |||||||||
| Operating lease liabilities | 45,995 | 13,434 | |||||||||
| Other liabilities | (224) | (382) | |||||||||
| Net cash used in operating activities | (175,422) | (294,834) | |||||||||
| Cash Flows from Investing Activities: | |||||||||||
Purchases of property and equipment, including $0 and $6,282, respectively, from related parties | (171,057) | (88,137) | |||||||||
| Principal payments received on beneficial interests in securitizations | 3,869 | 1,108 | |||||||||
| Net cash used in investing activities | (167,188) | (87,029) | |||||||||
| Cash Flows from Financing Activities: | |||||||||||
| Proceeds from short-term revolving facilities | 2,616,660 | 1,901,607 | |||||||||
| Payments on short-term revolving facilities | (3,154,500) | (2,164,248) | |||||||||
| Proceeds from issuance of long-term debt | 87,391 | 315,674 | |||||||||
| Payments on long-term debt | (11,912) | (6,868) | |||||||||
| Payments of debt issuance costs | (3,472) | (7,034) | |||||||||
| Net proceeds from issuance of Class A common stock | 1,058,940 | 297,611 | |||||||||
| Proceeds from exercise of stock options | 2,821 | 798 | |||||||||
| Tax withholdings related to restricted stock awards | (5,491) | (1,990) | |||||||||
| Net cash provided by financing activities | 590,437 | 335,550 | |||||||||
| Net increase (decrease) in cash, cash equivalents and restricted cash | 247,827 | (46,313) | |||||||||
| Cash, cash equivalents and restricted cash at beginning of period | 118,459 | 88,709 | |||||||||
| Cash, cash equivalents and restricted cash at end of period | $ | 366,286 | $ | 42,396 | |||||||
14
CARVANA CO. AND SUBSIDIARIES
OUTSTANDING SHARES AND LLC UNITS
(Unaudited)
LLC Units (adjusted for the exchange ratio and participation thresholds) are considered potentially dilutive shares of Class A common stock because they are exchangeable into shares of Class A common stock, if the Company elects not to settle exchanges in cash. Weighted-average shares of Class A common stock and as-exchanged LLC Units, which were evaluated for potentially dilutive effects and were determined to be anti-dilutive, are as follows:
| Three Months Ended June 30, | Six Months Ended June 30, | ||||||||||||||||||||||
| 2020 | 2019 | 2020 | 2019 | ||||||||||||||||||||
| (in thousands) | |||||||||||||||||||||||
| Weighted-average shares of Class A common stock outstanding | 66,327 | 46,038 | 58,363 | 43,695 | |||||||||||||||||||
| Weighted-average as-exchanged LLC Units for shares of Class A common stock | 105,075 | 106,377 | 105,158 | 107,676 | |||||||||||||||||||
| 171,402 | 152,415 | 163,521 | 151,641 | ||||||||||||||||||||
15
CARVANA CO. AND SUBSIDIARIES
RECONCILIATION OF GAAP TO NON-GAAP FINANCIAL MEASURES
(Unaudited)
In prior periods we calculated non-GAAP measures including Gross Profit ex-Gift, Gross Profit per Unit ex-Gift, EBITDA ex-Gift, EBITDA Margin ex-Gift, Adjusted Net Loss and Adjusted Net Loss per Share, to exclude the impact of the 100k Milestone Gift program. As this program has concluded it is not material to current or future years and the adjustment is no longer included within similar calculations. For the three and six months ended June 30, 2020, there was approximately $0.0 million and $0.5 million, respectively, of stock based compensation related to the 100k Milestone Gift program within cost of sales, which would impact all measures. For the three and six months ended June 30, 2019, there was approximately $3.3 million and $6.3 million, respectively, of stock based compensation related to the 100k Milestone Gift program impacting the calculation of EBITDA ex-Gift, EBITDA Margin ex-Gift, Adjusted Net Loss, and Adjusted Net Loss per Share, including approximately $1.9 million and $2.7 million, respectively, within cost of sales impacting the calculation of Gross Profit ex-Gift and Gross Profit per Unit ex-Gift.
EBITDA and EBITDA Margin
EBITDA and EBITDA Margin are supplemental measures of operating performance that do not represent and should not be considered an alternative to net loss or cash flow from operations, as determined by GAAP. EBITDA is defined as net loss before interest expense, income tax expense, and depreciation and amortization expense. EBITDA Margin is EBITDA as a percentage of total revenues. We use EBITDA to measure the operating performance of our business and EBITDA Margin to measure our operating performance relative to our total revenues. We believe that EBITDA and EBITDA Margin are useful measures to us and to our investors because they exclude certain financial and capital structure items that we do not believe directly reflect our core operations and may not be indicative of our recurring operations, in part because they may vary widely across time and within our industry independent of the performance of our core operations. We believe that excluding these items enables us to more effectively evaluate our performance period-over-period and relative to our competitors. EBITDA and EBITDA Margin may not be comparable to similarly titled measures provided by other companies due to potential differences in methods of calculations. A reconciliation of EBITDA to net loss is the most directly comparable GAAP measure, and calculation of EBITDA Margin is as follows (dollars in thousands):
| Three Months Ended | ||||||||||||||||||||||||||||||||
| Jun 30, 2019 | Sep 30, 2019 | Dec 31, 2019 | Mar 31, 2020 | Jun 30, 2020 | ||||||||||||||||||||||||||||
Net loss (1) | $ | (64,059) | $ | (92,244) | $ | (125,740) | $ | (183,557) | $ | (106,326) | ||||||||||||||||||||||
| Depreciation and amortization expense | 8,887 | 10,675 | 13,760 | 15,811 | 17,629 | |||||||||||||||||||||||||||
| Interest expense | 19,315 | 20,990 | 24,653 | 28,862 | 19,915 | |||||||||||||||||||||||||||
| Income tax provision | — | — | — | — | (238) | |||||||||||||||||||||||||||
| EBITDA | $ | (35,857) | $ | (60,579) | $ | (87,327) | $ | (138,884) | $ | (69,020) | ||||||||||||||||||||||
| Total revenues | $ | 986,221 | $ | 1,094,854 | $ | 1,103,587 | $ | 1,098,216 | $ | 1,118,334 | ||||||||||||||||||||||
| Net loss margin | (6.5) | % | (8.4) | % | (11.4) | % | (16.7) | % | (9.5) | % | ||||||||||||||||||||||
EBITDA Margin (2) | (3.6) | % | (5.5) | % | (7.9) | % | (12.6) | % | (6.2) | % | ||||||||||||||||||||||
(1) Includes $3.3 million, $4.4 million, $2.5 million, $0.5 million, and $0.0 million, respectively, related to the 100k Milestone Gift.
(2) Includes 0.3%, 0.4%, 0.2%, 0.0%, and 0.0%, respectively, related to the 100k Milestone Gift.
| Years Ended December 31, | |||||||||||||||||||||||||||||||||||
| 2014 | 2015 | 2016 | 2017 | 2018 | 2019 | ||||||||||||||||||||||||||||||
Net loss (1) | $ | (15,238) | $ | (36,780) | $ | (93,112) | $ | (164,316) | $ | (254,745) | $ | (364,639) | |||||||||||||||||||||||
| Depreciation and amortization expense | 1,705 | 2,800 | 4,658 | 11,568 | 23,539 | 41,265 | |||||||||||||||||||||||||||||
| Interest expense | 108 | 1,412 | 3,587 | 7,659 | 25,018 | 80,606 | |||||||||||||||||||||||||||||
| EBITDA | $ | (13,425) | $ | (32,568) | $ | (84,867) | $ | (145,089) | $ | (206,188) | $ | (242,768) | |||||||||||||||||||||||
| Total revenues | $ | 41,679 | $ | 130,392 | $ | 365,148 | $ | 858,870 | $ | 1,955,467 | $ | 3,939,896 | |||||||||||||||||||||||
| Net loss margin | (36.6) | % | (28.2) | % | (25.5) | % | (19.1) | % | (13.0) | % | (9.3) | % | |||||||||||||||||||||||
EBITDA Margin (2) | (32.2) | % | (25.0) | % | (23.2) | % | (16.9) | % | (10.5) | % | (6.2) | % | |||||||||||||||||||||||
(1) Includes $0.0 million, $0.0 million, $0.0 million, $0.0 million, $11.8 million, and $13.2 million, respectively, related to the 100k Milestone Gift.
(2) Includes 0.0%, 0.0%, 0.0%, 0.0%, 0.6%, and 0.4%, respectively, related to the 100k Milestone Gift.
16
CARVANA CO. AND SUBSIDIARIES
RESULTS OF OPERATIONS
(Unaudited)
| Three Months Ended June 30, | Six Months Ended June 30, | |||||||||||||||||||||||||||||||||||||
| 2020 | 2019 | Change | 2020 | 2019 | Change | |||||||||||||||||||||||||||||||||
| (dollars in thousands, except per unit amounts) | (dollars in thousands, except per unit amounts) | |||||||||||||||||||||||||||||||||||||
| Net sales and operating revenues: | ||||||||||||||||||||||||||||||||||||||
| Used vehicle sales, net | $ | 991,802 | $ | 855,785 | 15.9 | % | $ | 1,956,081 | $ | 1,539,614 | 27.1 | % | ||||||||||||||||||||||||||
| Wholesale vehicle sales | 49,434 | 63,014 | (21.6) | % | 129,040 | 96,044 | 34.4 | % | ||||||||||||||||||||||||||||||
Other sales and revenues (1) | 77,098 | 67,422 | 14.4 | % | 131,429 | 105,797 | 24.2 | % | ||||||||||||||||||||||||||||||
| Total net sales and operating revenues | $ | 1,118,334 | $ | 986,221 | 13.4 | % | $ | 2,216,550 | $ | 1,741,455 | 27.3 | % | ||||||||||||||||||||||||||
| Gross profit: | ||||||||||||||||||||||||||||||||||||||
Used vehicle gross profit(3) | $ | 65,566 | $ | 63,378 | 3.5 | % | $ | 148,428 | $ | 110,500 | 34.3 | % | ||||||||||||||||||||||||||
Wholesale vehicle gross profit(4) | 7,542 | 6,993 | 7.9 | % | 8,771 | 10,028 | (12.5) | % | ||||||||||||||||||||||||||||||
Other gross profit (1) | 77,098 | 67,422 | 14.4 | % | 131,429 | 105,797 | 24.2 | % | ||||||||||||||||||||||||||||||
| Total gross profit | $ | 150,206 | $ | 137,793 | 9.0 | % | $ | 288,628 | $ | 226,325 | 27.5 | % | ||||||||||||||||||||||||||
| Market information: | ||||||||||||||||||||||||||||||||||||||
| Markets, beginning of period | 161 | 109 | 47.7 | % | 146 | 85 | 71.8 | % | ||||||||||||||||||||||||||||||
| Market launches | 100 | 28 | 257.1 | % | 115 | 52 | 121.2 | % | ||||||||||||||||||||||||||||||
| Markets, end of period | 261 | 137 | 90.5 | % | 261 | 137 | 90.5 | % | ||||||||||||||||||||||||||||||
| Unit sales information: | ||||||||||||||||||||||||||||||||||||||
| Used vehicle unit sales | 55,098 | 44,000 | 25.2 | % | 107,525 | 80,766 | 33.1 | % | ||||||||||||||||||||||||||||||
| Wholesale vehicle unit sales | 7,277 | 10,756 | (32.3) | % | 18,031 | 17,457 | 3.3 | % | ||||||||||||||||||||||||||||||
| Per unit selling prices: | ||||||||||||||||||||||||||||||||||||||
| Used vehicles | $ | 18,001 | $ | 19,450 | (7.4) | % | $ | 18,192 | $ | 19,063 | (4.6) | % | ||||||||||||||||||||||||||
| Wholesale vehicles | $ | 6,793 | $ | 5,858 | 16.0 | % | $ | 7,157 | $ | 5,502 | 30.1 | % | ||||||||||||||||||||||||||
Per unit gross profit:(2) | ||||||||||||||||||||||||||||||||||||||
Used vehicle gross profit(3) | $ | 1,190 | $ | 1,440 | (17.4) | % | $ | 1,380 | $ | 1,368 | 0.9 | % | ||||||||||||||||||||||||||
Wholesale vehicle gross profit(4) | $ | 1,036 | $ | 650 | 59.4 | % | $ | 486 | $ | 574 | (15.3) | % | ||||||||||||||||||||||||||
| Other gross profit | $ | 1,399 | $ | 1,532 | (8.7) | % | $ | 1,222 | $ | 1,310 | (6.7) | % | ||||||||||||||||||||||||||
| Total gross profit | $ | 2,726 | $ | 3,132 | (13.0) | % | $ | 2,684 | $ | 2,802 | (4.2) | % | ||||||||||||||||||||||||||
(1) Includes $22,720 and $13,989 for the three months ended June 30, 2020 and 2019, respectively, and $43,282 and $24,562 for the six months ended June 30, 2020 and 2019, respectively, of other sales and revenues from related parties.
(2) All gross profit per unit amounts are per used vehicle sold, except wholesale vehicle gross profit, which is per wholesale vehicle sold.
(3) Includes $0, $1,808, $510, and $2,572, or $0, $42, $5, and $32 per unit, related to the 100k Milestone Gift.
(4) Includes $0, $103, $17, and $125, or $0, $10, $0, and $8 per wholesale unit, related to the 100k Milestone Gift.
17
CARVANA CO. AND SUBSIDIARIES
COMPONENTS OF SG&A
(Unaudited)
| Three Months Ended | ||||||||||||||||||||||||||||||||
| Jun 30, 2019 | Sep 30, 2019 | Dec 31, 2019 | Mar 31, 2020 | Jun 30, 2020 | ||||||||||||||||||||||||||||
| (in thousands) | ||||||||||||||||||||||||||||||||
Compensation and benefits (1) | $ | 54,184 | $ | 60,655 | $ | 72,939 | $ | 84,250 | $ | 74,202 | ||||||||||||||||||||||
| 100k Milestone Gift | 1,415 | 2,903 | 1,263 | — | — | |||||||||||||||||||||||||||
| Advertising | 50,367 | 55,264 | 58,867 | 74,788 | 62,330 | |||||||||||||||||||||||||||
Market occupancy (2) | 4,720 | 5,517 | 6,644 | 8,103 | 8,019 | |||||||||||||||||||||||||||
Logistics (3) | 13,643 | 14,068 | 18,090 | 18,914 | 16,699 | |||||||||||||||||||||||||||
Other (4) | 57,514 | 69,563 | 83,860 | 89,656 | 78,684 | |||||||||||||||||||||||||||
| Total | $ | 181,843 | $ | 207,970 | $ | 241,663 | $ | 275,711 | $ | 239,934 | ||||||||||||||||||||||
(1) Compensation and benefits includes all payroll and related costs, including benefits, payroll taxes, and equity-based compensation, except those related to preparing vehicles for sale, which are included in cost of sales, those related to the development of software products for internal use, which are capitalized to software and depreciated over the estimated useful lives of the related assets, and those related to the 100k Milestone Gift.
(2) Market occupancy costs includes occupancy costs of our vending machine and hubs. It excludes occupancy costs related to reconditioning vehicles which are included in cost of sales and the portion related to corporate occupancy which are included in other costs.
(3) Logistics includes fuel, maintenance and depreciation related to operating our own transportation fleet, and third party transportation fees, except the portion related to inbound transportation, which is included in cost of sales.
(4) Other costs include all other selling, general and administrative expenses such as IT expenses, corporate occupancy, professional services and insurance, limited warranty, and title and registration.
18
CARVANA CO. AND SUBSIDIARIES
LIQUIDITY RESOURCES
(Unaudited)
| June 30, 2020 | December 31, 2019 | ||||||||||
| (in thousands) | |||||||||||
| Cash and cash equivalents | $ | 246,299 | $ | 76,016 | |||||||
Availability under short-term revolving facilities (1) | 806,697 | 279,080 | |||||||||
Availability under sale-leaseback agreements (2)(3) | 106,104 | 104,680 | |||||||||
| Committed liquidity resources available | $ | 1,159,100 | $ | 459,776 | |||||||
(1) Based on pledging all eligible vehicles and finance receivables under the available capacity in the Floor Plan Facility and Finance Receivable Facilities, excluding the impact to restricted cash requirements.
(2) We have $75.0 million available for sale and leaseback transactions under the Master Sale-Leaseback Agreement with VMRE, and an additional $31.1 million and $29.7 million as of June 30, 2020 and December 31, 2019, respectively, available under sale-leaseback agreements with other parties.
(3) We have $213.5 million and $158.7 million of total unfunded gross real estate assets as of June 30, 2020 and December 31, 2019, respectively.
As of June 30, 2020 and December 31, 2019, the short-term revolving facilities had total capacity of $1.9 billion and $1.6 billion, an outstanding balance of $31.0 million and $568.8 million, and unused capacity of $1.8 billion and $1.0 billion, respectively.
We also had $52.6 million and $137.7 million of committed funds for future construction costs of four IRCs with unfinished construction as of June 30, 2020 and December 31, 2019, respectively.
In addition, we had $47.0 million and $13.5 million of total unpledged beneficial interests in securitizations as of June 30, 2020 and December 31, 2019, respectively.
As of June 30, 2020, the Company's restricted cash included approximately $117.7 million in collections accounts for finance receivables pledged to the Finance Receivables Facilities, the majority of which became unrestricted on July 15, 2020.
19