Attached files
| file | filename |
|---|---|
| EX-32 - EX-32 - RICHARDSON ELECTRONICS LTD/DE | rell-ex32_10.htm |
| EX-31.2 - EX-31.2 - RICHARDSON ELECTRONICS LTD/DE | rell-ex312_8.htm |
| EX-31.1 - EX-31.1 - RICHARDSON ELECTRONICS LTD/DE | rell-ex311_7.htm |
| EX-23.1 - EX-23.1 - RICHARDSON ELECTRONICS LTD/DE | rell-ex231_6.htm |
| EX-21 - EX-21 - RICHARDSON ELECTRONICS LTD/DE | rell-ex21_9.htm |
| EX-10.2 - EX-10.2 - RICHARDSON ELECTRONICS LTD/DE | rell-ex102_14.htm |
| EX-4 - EX-4 - RICHARDSON ELECTRONICS LTD/DE | rell-ex4_91.htm |
UNITED STATES
SECURITIES AND EXCHANGE COMMISSION
WASHINGTON, DC 20549
FORM 10-K
|
☒ |
ANNUAL REPORT PURSUANT TO SECTION 13 OR 15(d) OF THE SECURITIES EXCHANGE ACT OF 1934 |
For the fiscal year ended May 30, 2020
OR
|
☐ |
TRANSITION REPORT PURSUANT TO SECTION 13 OR 15(d) OF THE SECURITIES EXCHANGE ACT OF 1934 |
For the transition period from__________ to
Commission File Number: 0-12906

(Exact name of registrant as specified in its charter)
|
Delaware |
|
36-2096643 |
|
(State or other jurisdiction of incorporation or organization) |
|
(I.R.S. Employer Identification No.) |
40W267 Keslinger Road, P.O. Box 393, LaFox, Illinois 60147-0393
(Address of principal executive offices)
Registrant’s telephone number, including area code: (630) 208-2200
Securities registered pursuant to Section 12(b) of the Act:
|
Title of each class |
|
Trading Symbol(s) |
|
Name of each exchange on which registered |
|
Common stock, $0.05 Par Value |
|
RELL |
|
NASDAQ Global Select Market |
Securities registered pursuant to Section 12(g) of the Act: None
Indicate by check mark if the registrant is a well-known seasoned issuer, as defined in Rule 405 of the Securities Act. ☐ Yes ☒ No
Indicate by check mark if the registrant is not required to file reports pursuant to Section 13 or Section 15(d) of the Act ☐ Yes ☒ No
Indicate by check mark whether the registrant (1) has filed all reports required to be filed by Section 13 or 15(d) of the Securities Exchange Act of 1934 during the preceding 12 months (or for such shorter period that the registrant was required to file such reports), and (2) has been subject to such filing requirements for the past 90 days. ☒ Yes ☐ No
Indicate by check mark whether the registrant has submitted electronically every Interactive Data File required to be submitted pursuant to Rule 405 of Regulation S-T (§232.405 of this chapter) during the preceding 12 months (or for such shorter period that the registrant was required to submit such files). ☒ Yes ☐ No
Indicate by check mark whether the registrant is a large accelerated filer, an accelerated filer, a non-accelerated filer, smaller reporting company, or an emerging growth company. See definitions of “large accelerated filer,” “accelerated filer,” “smaller reporting company,” and “emerging growth company” in Rule 12b-2 of the Exchange Act.
|
Large Accelerated Filer |
☐ |
|
|
Accelerated Filer |
☒ |
|
Non-Accelerated Filer |
☐ |
|
|
Smaller reporting company |
☒ |
|
Emerging growth company |
☐ |
|
|
|
|
If an emerging growth company, indicate by check mark if the registrant has elected not to use the extended transition period for complying with any new or revised financial accounting standards provided pursuant to Section 13(a) of the Exchange Act. ☐
Indicate by check mark whether the registrant is a shell company (as defined in Rule 12b-2 of the Exchange Act). ☐ Yes ☒ No
The aggregate market value of the registrant’s common stock held by non-affiliates of the registrant as of November 30, 2019 was approximately $61.4 million.
As of July 27, 2020, there were outstanding 11,110,735 shares of Common Stock, $0.05 par value and 2,096,919 shares of Class B Common Stock, $0.05 par value, which are convertible into Common Stock of the registrant on a one-for-one basis.
DOCUMENTS INCORPORATED BY REFERENCE
Portions of the registrant’s Proxy Statement for the Annual Meeting of Stockholders scheduled to be held October 6, 2020, which will be filed pursuant to Regulation 14A, are incorporated by reference in Part III of this report. Except as specifically incorporated herein by reference, the abovementioned Proxy Statement is not deemed filed as part of this report.
|
|
|
|
Page |
|
|
|
3 |
|
|
Item 1. |
|
3 |
|
|
Item 1A. |
|
6 |
|
|
Item 1B. |
|
13 |
|
|
Item 2. |
|
14 |
|
|
Item 3. |
|
14 |
|
|
|
|
|
|
|
|
|
15 |
|
|
Item 5. |
|
15 |
|
|
Item 6. |
|
17 |
|
|
Item 7. |
Management’s Discussion and Analysis of Financial Condition and Results of Operations |
|
18 |
|
Item 7A. |
|
27 |
|
|
Item 8. |
|
27 |
|
|
Item 9A. |
|
57 |
|
|
Item 9B. |
|
57 |
|
|
|
|
|
|
|
|
|
58 |
|
|
Item 10. |
|
58 |
|
|
Item 11. |
|
58 |
|
|
Item 12. |
Security Ownership of Certain Beneficial Owners and Management and Related Stockholder Matters |
|
58 |
|
Item 13. |
Certain Relationships and Related Transactions, and Director Independence |
|
58 |
|
Item 14. |
|
58 |
|
|
|
|
|
|
|
|
|
59 |
|
|
Item 15. |
|
59 |
|
|
Item 16. |
|
60 |
|
|
|
|
|
|
|
|
61 |
||
|
|
63 |
||
2
Certain statements in this report may constitute “forward-looking” statements within the meaning of the Private Securities Litigation Reform Act of 1995. The terms “may”, “should”, “could”, “anticipate”, “believe”, “continues”, “estimate”, “expect”, “intend”, “objective”, “plan”, “potential”, “project” and similar expressions are intended to identify forward-looking statements. These statements are not guarantees of future performance and involve risks, uncertainties and assumptions that are difficult to predict. These statements are based on management’s current expectations, intentions or beliefs and are subject to a number of factors, assumptions and uncertainties that could cause actual results to differ materially from those described in the forward-looking statements. Factors that could cause or contribute to such differences or that might otherwise impact the business include the risk factors set forth in Item 1A of this Form 10-K. We undertake no obligation to update any such factor or to publicly announce the results of any revisions to any forward-looking statements contained herein whether as a result of new information, future events, or otherwise.
In addition, while we do, from time to time, communicate with securities analysts, it is against our policy to disclose to them any material non-public information or other confidential commercial information. Accordingly, stockholders should not assume that we agree with any statement or report issued by any analyst irrespective of the content of the statement or report. Thus, to the extent that reports issued by securities analysts contain any projections, forecasts or opinions, such reports are not our responsibility.
General
Richardson Electronics, Ltd. is a leading global provider of engineered solutions, power grid and microwave tubes and related consumables; power conversion and RF and microwave components; high value flat panel detector solutions, replacement parts, tubes and service training for diagnostic imaging equipment; and customized display solutions. We serve customers in the alternative energy, healthcare, aviation, broadcast, communications, industrial, marine, medical, military, scientific and semiconductor markets. The Company’s strategy is to provide specialized technical expertise and “engineered solutions” based on our core engineering and manufacturing capabilities. The Company provides solutions and adds value through design-in support, systems integration, prototype design and manufacturing, testing, logistics, and aftermarket technical service and repair through its global infrastructure.
Our fiscal year 2020 began on June 2, 2019 and ended on May 30, 2020, our fiscal year 2019 began on June 3, 2018 and ended on June 1, 2019 and our fiscal year 2018 began on May 28, 2017 and ended on June 2, 2018. Unless otherwise noted, all references to a particular year in this document shall mean our fiscal year.
Company Response to COVID-19
On January 30, 2020, the World Health Organization (“WHO”) announced a global health emergency because of a new strain of coronavirus originating in Wuhan, China (the “COVID-19 outbreak”) and the risks to the international community as the virus spreads globally.
In March 2020, the WHO classified the COVID-19 outbreak as a pandemic based on the rapid increase in global exposure. Thereafter, most U.S. states imposed “shelter in place” directives on their populations to stem the spread of COVID-19. Of specific interest to the Company, shelter in place directives were imposed in the states of Illinois, Massachusetts and South Carolina.
The shelter in place directives generally required the closure of businesses that did not provide essential functions. The Company was considered a critical supplier of products to healthcare and critical infrastructure businesses. Several of our largest customers mandated that we continue to supply parts so as not to disrupt the supply chain and their ability to serve critical industries. As such, the Company qualified as an “Essential Business”. Essential Businesses were allowed to continue to operate during shelter in place directives. We continued our manufacturing and distribution operations even when a shelter in place directive was issued. We limited the number of people in any one of our facilities by requiring only employees who could not perform their work remotely to physically work in a Company US-based facility. The Company advised all other employees that could perform their job functions remotely to do so. As such, the Company’s operations remained operational.
3
The impact of the COVID-19 outbreak continues to evolve. As such, the full magnitude that the pandemic will have on the Company’s financial condition, liquidity and future results of operations is uncertain. Management is actively monitoring the global situation on its financial condition, liquidity, operations, suppliers, industry and workforce. As the spread of COVID-19 continues, our ability to meet customer demands for products may be impaired or, similarly, our customers may experience adverse business consequences due to COVID-19. Reduced demand for products or impaired ability to meet customer demand (including disruptions at our transportation service providers or vendors) could have a material adverse effect on our business, operations and financial performance. Some of the decline in fiscal 2020 PMT sales and the decrease in Healthcare sales was primarily due to the COVID-19 global pandemic. While we had some COVID-19 related longer lead times as well as delays impacting new product development schedules, we did not experience a major interruption in our supply chain. Given the daily evolution of the COVID-19 outbreak and the global responses to curb its spread, the Company is not presently able to estimate the effects of COVID-19 on its results of operations, financial condition or liquidity for fiscal year 2021.
Company Response to CARES Act
On March 27, 2020, Congress enacted the Coronavirus Aid, Relief, and Economic Security (“CARES”) Act to provide certain relief as a result of the COVID-19 outbreak. The CARES Act includes provisions relating to refundable payroll tax credits, deferral of employer side social security payments, net operating loss carryback periods, alternative minimum tax credit refunds, increased limitations on qualified charitable contributions and technical corrections to tax depreciation methods for qualified improvement property. The Company continues to examine how these provisions in the CARES Act will impact its financial position, results of operations and cash flows. In fiscal 2020, the Company deferred $0.2 million of employer side social security tax payments. The Company has estimated and recorded the overall effects of the CARES Act and does not anticipate a material change.
Geography
We currently have operations in the following major geographic regions: North America, Asia/Pacific, Europe and Latin America.
Selected financial data attributable to each segment and geographic region for fiscal 2020, fiscal 2019 and fiscal 2018 is set forth in Note 11 “Segment and Geographic Information” of the notes to our consolidated financial statements in Part II, Item 8 of this Annual Report on Form 10-K.
We have three operating and reportable segments, which we define as follows:
Power and Microwave Technologies Group
Power and Microwave Technologies Group (“PMT”) combines our core engineered solutions capabilities, power grid and microwave tube business with new RF, Wireless and Power disruptive technologies. As a designer, manufacturer, technology partner and authorized distributor, PMT’s strategy is to provide specialized technical expertise and engineered solutions based on our core engineering and manufacturing capabilities on a global basis. We provide solutions and add value through design-in support, systems integration, prototype design and manufacturing, testing, logistics and aftermarket technical service and repair—all through our existing global infrastructure. PMT’s focus is on products for power, RF and microwave applications for customers in 5G, alternative energy, aviation, broadcast, communications, industrial, marine, medical, military, scientific and semiconductor markets. PMT focuses on various applications including broadcast transmission, CO2 laser cutting, diagnostic imaging, dielectric and induction heating, high energy transfer, high voltage switching, plasma, power conversion, radar and radiation oncology. PMT also offers its customers technical services for both microwave and industrial equipment.
PMT represents leading manufacturers of electron tubes and RF, Microwave and power components used in semiconductor manufacturing equipment, RF and wireless and industrial power applications. Among the suppliers PMT supports are Amperex, CDE, CPI, Draloric, Eimac, General Electric, Hitachi, Jennings, L3, MACOM, National, NJRC, Ohmite, Qorvo, Thales, Toshiba and Vishay.
PMT’s inventory levels reflect our commitment to maintain an inventory of a broad range of products for customers who are buying products for replacement of components used in critical equipment and designing in new technologies. PMT also sells a number of products representing trailing edge technology. While the market for these trailing edge technology products is declining, PMT is increasing its market share. PMT often buys products it knows it can sell ahead of any supplier price increases and extended lead times. As manufacturers for these products exit the business, PMT has the option to purchase a substantial portion of their remaining inventory.
4
PMT has distribution agreements with many of its suppliers; most of these agreements provide exclusive distribution rights that often include global coverage. The agreements are typically long term, and usually contain provisions permitting termination by either party if there are significant breaches that are not cured within a reasonable period. Although some of these agreements allow PMT to return inventory periodically, others do not, in which case PMT may have obsolete inventory that they cannot return to the supplier.
PMT’s suppliers provide warranty coverage for the products and allow return of defective products, including those returned to PMT by its customers. For information regarding the warranty reserves, see Note 3 “Significant Accounting Policies” of the notes to our consolidated financial statements in Part II, Item 8 of this Annual Report on Form 10-K.
In addition to third party products, we sell proprietary products principally under certain trade names we own including Amperex®, Cetron® and National®. Our proprietary products include thyratrons and rectifiers, power tubes, ignitrons, magnetrons, phototubes, microwave generators, Ultracapacitor modules and liquid crystal display monitors. The materials used in the manufacturing process consist of glass bulbs and tubing, nickel, stainless steel and other metals, plastic and metal bases, ceramics and a wide variety of fabricated metal components. These materials are generally readily available, but some components may require long lead times for production, and some materials are subject to shortages or price fluctuations based on supply and demand.
Canvys – Visual Technology Solutions
Canvys provides customized display solutions serving the corporate enterprise, financial, healthcare, industrial and medical original equipment manufacturers markets. Our engineers design, manufacture, source and support a full spectrum of solutions to match the needs of our customers. We offer long term availability and proven custom display solutions that include touch screens, protective panels, custom enclosures, All-In-One computers, specialized cabinet finishes and application specific software packages and certification services. Our volume commitments are lower than the large display manufacturers, making us the ideal choice for companies with very specific design requirements. We partner with both private label manufacturing companies and leading branded hardware vendors to offer the highest quality display and touch solutions and customized computing platforms.
We have long-standing relationships with key component and finished goods manufacturers and several key ISO 9001 and ISO 13485 certified Asian display manufacturers that manufacture products to our specifications. We believe supplier relationships, combined with our engineering design and manufacturing capabilities and private label partnerships, allow us to maintain a well-balanced and technologically advanced offering of customer specific display solutions.
Healthcare
Healthcare manufactures, repairs, refurbishes and distributes high value replacement parts and equipment for the healthcare market including hospitals, medical centers, asset management companies, independent service organizations and multi-vendor service providers. Products include diagnostic imaging replacement parts for CT and MRI systems; replacement CT and MRI tubes; CT service training; MRI coils, cold heads and RF amplifiers; hydrogen thyratrons, klystrons, magnetrons; flat panel detector upgrades; pre-owned CT systems; and additional replacement solutions currently under development for the diagnostic imaging service market. Through a combination of newly developed products and partnerships, service offerings and training programs, we believe we can help our customers improve efficiency and deliver better clinical outcomes while lowering the cost of healthcare delivery.
Sales and Product Management
We have employees, as well as authorized representatives who are not our employees, selling our products primarily in regions where we do not have a direct sales presence.
We offer various credit terms to qualifying customers as well as cash in advance and credit card terms. We establish credit limits for each customer and routinely review delinquent and aging accounts.
5
Distribution
We maintain approximately 110,700 part numbers in our product inventory database and we estimate that more than 90% of orders received by 6:00 p.m. local time are shipped complete the same day for stock product. Customers can access our products on our web sites, www.rell.com, www.rellhealthcare.com, www.canvys.com, www.rellpower.com, www.relltubes.com and www.rellaser.com, through electronic data interchange, or by telephone. Customer orders are processed by our regional sales offices and supported primarily by one of our distribution facilities in LaFox, Illinois; Fort Mill, South Carolina; Amsterdam, Netherlands; Marlborough, Massachusetts; Donaueschingen, Germany; or Singapore, Singapore. We also have satellite warehouses in Sao Paulo, Brazil; Shanghai, China; Bangkok, Thailand; and Hook, United Kingdom. Our data processing network provides on-line, real-time interconnection of all sales offices and central distribution operations, 24 hours per day, seven days per week. Information on stock availability, pricing in local currency, cross-reference information, customers and market analyses are obtainable throughout the entire distribution network.
International Sales
During fiscal 2020, we made approximately 59% of our sales outside the U.S. We continue to pursue new international sales to further expand our geographic reach.
Major Customers
During fiscal 2020 and fiscal 2019, no one customer accounted for more than 10 percent of the Company’s consolidated net sales. During fiscal 2018, LAM Research Corporation individually accounted for 11 percent of the Company’s consolidated net sales. No other customer accounted for more than 10 percent of the Company’s consolidated net sales in fiscal 2018. The Company believes that the loss of this customer would have a material adverse effect on the Company’s financial condition or results of operations. See Note 11 “Segment and Geographic Information” of the notes to our consolidated financial statements in Part II, Item 8 of this Annual Report on Form 10-K for further information.
Employees
As of May 30, 2020, we employed 394 individuals. All of our employees are non-union and we consider our relationships with our employees to be good.
Website Access to SEC Reports
We maintain an Internet website at www.rell.com. Our Annual Report on Form 10-K, quarterly reports on Form 10-Q, current reports on Form 8-K and amendments to those reports filed or furnished pursuant to Section 13(a) or 15(d) of the Securities and Exchange Act of 1934 are accessible through our website, free of charge, as soon as reasonably practicable after these reports are filed electronically with the Securities and Exchange Commission. Interactive Data Files pursuant to Rule 405 of Regulation S-T, of these filing dates, formatted in Extensible Business Reporting Language (“XBRL”) are accessible as well. To access these reports, go to our website at www.rell.com. The foregoing information regarding our website is provided for convenience and the content of our website is not deemed to be incorporated by reference in this report filed with the Securities and Exchange Commission.
Investors should consider carefully the following risk factors in addition to the other information included and incorporated by reference in this Annual Report on Form 10-K that we believe are applicable to our businesses and the industries in which we operate. While we believe we have identified the key risk factors affecting our businesses, there may be additional risks and uncertainties that are not presently known or that are not currently believed to be significant that may adversely affect our results of operations.
A significant portion of our cash, cash equivalents and investments are held by our foreign subsidiaries and could affect future liquidity needs.
As of May 30, 2020, $16.2 million, or approximately 35% of our cash, cash equivalents and investments was held by our foreign subsidiaries. While we intend to use some of the cash held outside the United States to fund our international operations and growth, when we encounter a significant need for liquidity domestically or at a particular location that we cannot fulfill through other internal or external sources, our liquidity requirements could necessitate transfers of existing cash balances between our subsidiaries or to the United States. Some of these subsidiaries are located in jurisdictions that require foreign government approval before a cash repatriation can occur.
6
We may not achieve our plan for sales growth and margin targets.
We have established both margin and expense targets to grow our sales with new and existing customers. If we do not achieve our growth objectives, the complexity of our global infrastructure makes it difficult to leverage our fixed cost structure to align with the size of our operations. Factors that could have a significant effect on our ability to achieve these goals include the following:
|
|
• |
Failure to achieve our sales and margin growth objectives in our product lines and business units; |
|
|
• |
Failure to identify, consummate and successfully integrate acquisitions; |
|
|
• |
Declining gross margin reflecting competitive pricing pressures or product mix; and |
|
|
• |
Limitations on our ability to leverage our support-function cost structure while maintaining an adequate structure to achieve our growth objectives. |
We have historically incurred significant charges for inventory obsolescence, and may incur similar charges in the future.
We maintain significant inventories in an effort to ensure that customers have a reliable source of supply. Our products generally support industrial machinery powered by tube technology. As technology evolves and companies replace this capital equipment, the market for our products potentially declines. In addition, the market for many of our other products changes rapidly resulting from the development of new technologies, evolving industry standards, frequent new product introductions by some of our suppliers and changing end-user demand, which can contribute to the decline in value or obsolescence of our inventory. We do not have many long-term supply contracts with our customers. If we fail to anticipate the changing needs of our customers or we do not accurately forecast customer demand, our customers may not place orders with us, and we may accumulate significant inventories of products that we may be unable to sell or return to our vendors. This may result in a decline in the value of our inventory.
We face competitive pressures that could have a material adverse effect on our business.
Our overall competitive position depends on a number of factors including price, engineering capability, vendor representation, product diversity, lead times and the level of customer service. There are very few vacuum tube competitors in the markets we serve. There are also a limited number of Chinese manufacturers whose ability to produce vacuum tubes has progressed over the past several years. The most significant competitive risk comes from technical obsolescence. Canvys faces many competitors in the markets we serve. Increased competition may result in price reductions, reduced margins, or a loss of market share, any of which could materially and adversely affect our business, operating results, and financial condition. As we expand our business and pursue our growth initiatives, we may encounter increased competition from current and/or new competitors. Our failure to maintain and enhance our competitive position could have a material adverse effect on our business.
A single stockholder has voting control over us.
As of July 27, 2020, Edward J. Richardson, our Chairman, Chief Executive Officer and President, beneficially owned approximately 99% of the outstanding shares of our Class B common stock, representing approximately 65% of the voting power of the outstanding common stock. This share ownership permits Mr. Richardson to exert control over the outcome of stockholder votes, including votes concerning the election of directors, by-law amendments, possible mergers, corporate control contests, and other significant corporate transactions.
Failure to attract and retain key skilled personnel could hurt operations.
Our success depends to a large extent upon the continued services of key management personnel, particularly Mr. Richardson. While we have employment contracts in place with several of our executive officers, we nevertheless cannot be assured that we will retain our key employees and the loss of service of any of these officers or key management personnel could have a material adverse effect on our business growth and operating results.
Our future success will require an ability to attract and retain qualified employees. Competition for such key personnel is intense and we cannot be assured that we will be successful in attracting and retaining such personnel. We cannot make assurances that key personnel will not depart in the future. Changes in the cost of providing employee benefits in order to attract and retain personnel, including changes in health care costs, could lead to increased costs in any of our operations.
7
We are dependent on a limited number of vendors to supply us with essential products.
The products we supply are currently produced by a relatively small number of manufacturers. One of our suppliers represented 16 percent of our total cost of sales. Our success depends, in large part, on maintaining current vendor relationships and developing new relationships. To the extent that our significant suppliers are unwilling or unable to continue to do business with us, extend lead times, limit supplies due to capacity constraints, or other factors, there could be a material adverse effect on our business.
International operations represent a significant percentage of our business and present a variety of risks that could impact our results.
Because we source and sell our products worldwide, our business is subject to risks associated with doing business internationally. These risks include the costs and difficulties of managing foreign entities, limitations on the repatriation and investment of funds, cultural differences that affect customer preferences and business practices, unstable political or economic conditions, trade protection measures and import or export licensing requirements, and changes in tax laws.
We also face exposure to fluctuations in foreign currency exchange rates because we conduct business outside of the United States. Price increases caused by currency exchange rate fluctuations may make our products less competitive or may have an adverse effect on our margins. Our international revenues and expenses generally are derived from sales and operations in currencies other than the U.S. dollar. Accordingly, when the U.S. dollar strengthens in relation to the base currencies of the countries in which we sell our products, our U.S. dollar reported net revenue and income would decrease. We currently do not engage in any currency hedging transactions. We cannot predict whether foreign currency exchange risks inherent in doing business in foreign countries will have a material adverse effect on our operations and financial results in the future. Further, global economic conditions may cause volatility and disruptions in the capital and credit markets. Negative or uncertain financial and macroeconomic conditions may have a significant adverse impact on our sales, profitability, and results of operations.
We may need to raise additional funds through debt or equity financings in the future to fund our domestic operations and our broader corporate initiatives, which would dilute the ownership of our existing shareholders.
If the cash generated by our domestic operations is not sufficient to fund our domestic operations and our broader corporate initiatives, such as stock repurchases, dividends, acquisitions, and other strategic opportunities, we may need to raise additional funds through public or private debt or equity financings, or we may need to obtain new credit facilities to the extent we are unable to, or choose not to, repatriate our overseas cash. Such additional financing may not be available on terms favorable to us, or at all, and any new equity financings or offerings would dilute our current stockholders’ ownership interests in us. Furthermore, lenders may not agree to extend us new, additional or continuing credit. The COVID-19 pandemic and its economic impact could result in significant or sustained disruption of global financial markets, thereby reducing our ability to access capital. In any such case, our business, operating results or financial condition could be adversely impacted.
The withdrawal by the United Kingdom from the European Union could have a material adverse effect on our business, financial position, liquidity and results of operations.
We conduct a significant portion of our business in the European Union (“EU”) and in June 2016, voters approved the withdrawal of the United Kingdom (“U.K.”) from the EU (also referred to as “Brexit”). The U.K. left the EU on January 31, 2020, and is currently in an 11-month transition period following which it will leave the single market and customs union pursuant to terms of a trade agreement currently being negotiated by the U.K. and the EU. The terms of this trade agreement are uncertain, and the political and economic instability created by Brexit caused and may continue to cause significant volatility in global markets. Further, the terms ultimately reached may result in greater restrictions on imports and exports between the U.K. and EU countries, a fluctuation in currency exchange rates and increased regulatory complexities. The impact of the withdrawal of the U.K. may adversely affect business activity, political stability and economic conditions in the U.K., the EU and elsewhere. Such developments and their ultimate impact, or the perception that any of these developments are likely to occur, could have a material adverse effect on economic growth or business activity in the U.K., the Eurozone, or the EU, and could result in the relocation of businesses, cause business interruptions, lead to economic recession or depression, and impact the stability of the financial markets, availability of credit, political systems or financial institutions and the financial and monetary system.
Such developments could have a material adverse effect on our business, financial position, liquidity and results of operations. The uncertainty concerning the terms of the exit could also have a negative impact on the growth of the European economy and cause greater volatility in all of the global currencies that we currently use to transact business.
8
We rely heavily on information technology systems that, if not properly functioning, could materially adversely affect our business.
We rely on our information technology systems to process, analyze, and manage data to facilitate the purchase, manufacture, and distribution of our products, as well as to receive, process, bill, and ship orders on a timely basis. A significant disruption or failure in the design, operation, security or support of our information technology systems could significantly disrupt our business.
Our information technology systems may be subject to cyber attacks, security breaches or computer hacking. Experienced computer programmers and hackers may be able to penetrate our security controls and misappropriate or compromise sensitive personal, proprietary or confidential information, create system disruptions or cause shutdowns. They also may be able to develop and deploy viruses, worms and other malicious software programs that attack our systems or otherwise exploit any security vulnerabilities. Additionally, third parties may attempt to fraudulently induce employees or customers into disclosing sensitive information such as user names, passwords or other information in order to gain access to our customers’ data or our data, including our intellectual property and other confidential business information, employee information or our information technology systems. Our systems and the data stored on those systems may also be vulnerable to security incidents or security attacks, acts of vandalism or theft, coordinated attacks by activist entities, misplaced or lost data, human errors, or other similar events that could negatively affect our systems and its data, as well as the data of our business partners. Further, third parties, such as hosted solution providers, that provide services to us, could also be a source of security risk in the event of a failure of their own security systems and infrastructure.
The costs to mitigate or address security threats and vulnerabilities before or after a cyber incident could be significant. Our remediation efforts may not be successful and could result in interruptions, delays or cessation of service, and loss of existing or potential suppliers or customers. In addition, breaches of our security measures and the unauthorized dissemination of sensitive personal, proprietary or confidential information about us, our business partners or other third parties could expose us to significant potential liability and reputational harm. As threats related to cyber attacks develop and grow, we may also find it necessary to make further investments to protect our data and infrastructure, which may impact our profitability. As a global enterprise, we could also be negatively impacted by existing and proposed laws and regulations, as well as government policies and practices related to cybersecurity, privacy, data localization and data protection.
Our products may be found to be defective or our services performed may result in equipment or product damage and, as a result, warranty and/or product liability claims may be asserted against us.
We sell many of our components at prices that are significantly lower than the cost of the equipment or other goods in which they are incorporated. Since a defect or failure in a product could give rise to failures in the equipment that incorporates them, we may face claims for damages that are disproportionate to the revenues and profits we receive from the components involved in the claims. While we typically have provisions in our agreements with our suppliers that hold the supplier accountable for defective products, and we and our suppliers generally exclude consequential damages in our standard terms and conditions, our ability to avoid such liabilities may be limited as a result of various factors, including the inability to exclude such damages due to the laws of some of the countries where we do business. Our business could be adversely affected as a result of a significant quality or performance issues in the components sold by us if we are required to pay for the damages. Although we have product liability insurance, such insurance is limited in coverage and amount.
Substantial defaults by our customers on our accounts receivable or the loss of significant customers could have a significant negative impact on our business.
We extend credit to our customers. The failure of a significant customer or a significant group of customers to timely pay all amounts due could have a material adverse effect on our financial condition and results of operations. The extension of credit involves considerable judgment and is based on management’s evaluation of factors that include such things as a customer’s financial condition, payment history, and the availability of collateral to secure customers’ receivables.
Failure to successfully implement our growth initiatives, or failure to realize the benefits expected from these initiatives if implemented, may create ongoing operating losses or otherwise adversely affect our business, operating results and financial condition.
Our growth strategy focuses on expanding our healthcare and our power conversion businesses. In 2015, we acquired certain assets, including inventory, receivables, fixed assets and certain other assets, of International Medical Equipment and Services, Inc. (“IMES”) and launched Power and Microwave Technologies Group (“PMT”), which combines our core engineered solutions, power grid and microwave tube business with new RF and power technologies. We may be unable to implement our growth initiatives or reach profitability in the near future or at all, due to many factors, including factors outside of our control. If our investments in these growth initiatives do not yield anticipated returns for any reason, our business, operating results and financial condition may be adversely affected.
9
We may not be successful in identifying, consummating and integrating future acquisitions.
As part of our growth strategy, our intent is to acquire additional businesses or assets. We may not be able to identify attractive acquisition candidates or complete the acquisition of identified candidates at favorable prices and upon advantageous terms. Also, acquisitions are accompanied by risks, such as potential exposure to unknown liabilities and the possible loss of key employees and customers of the acquired business. In addition, we may not obtain the expected benefits or cost savings from acquisitions. Acquisitions are subject to risks associated with financing the acquisition, and integrating the operations, personnel and systems of the acquired businesses. If any of these risks materialize, they may result in disruptions to our business and the diversion of management time and attention, which could increase the costs of operating our existing or acquired businesses or negate the expected benefits of the acquisitions.
Economic weakness and uncertainty could adversely affect our revenues and gross margins.
Our revenues and gross profit margins depend significantly on global economic conditions, the demand for our products and services and the financial condition of our customers. Economic weakness and uncertainty have in the past, and may in the future, result in decreased revenues and gross profit margins. Economic uncertainty also makes it more difficult for us to forecast overall supply and demand with a great deal of confidence. Financial turmoil affecting the banking system and financial markets could result in tighter credit markets and lower levels of liquidity in some financial markets. The effects of a tightened credit environment could include the insolvency of key vendors or their inability to obtain credit to finance development and/or manufacture products resulting in product delays as well as the inability of customers to obtain credit to finance operations and/or customer insolvencies. Spending and the timing thereof by our customers may have a significant impact on our results and, where such spending is delayed or cancelled, it could have a material negative impact on our operating results. Current global economic conditions remain uncertain and challenging. Weakness in the markets in which we operate could negatively impact our revenue and operating expenses, and consequently have a material adverse effect on our business, financial condition and results of operations.
Our operating results during fiscal 2020 and fiscal 2019 reflected a net loss, while we reported net income for fiscal 2018. There can be no assurance that we will experience recovery in the near future; nor is there any assurance that such worldwide economic volatility experienced recently will not continue.
Major disruptions to our logistics capability or to the operations of our key vendors or customers could have a material adverse impact on our operations.
We operate our global logistics services through specialized and centralized distribution centers. We depend on third party transportation service providers for the delivery of products to our customers. A major interruption or disruption in service at any of our distribution centers, or a disruption at the operations of any of our significant vendors or customers, for any reason, including reasons beyond our control (such as natural disasters, pandemics (such as the outbreak of a novel strain of coronavirus, now known as COVID-19), work stoppages, power loss, cyber attacks, incidents of terrorism or other significant disruptions of services from our third party providers) could cause cancellations or delays in a significant number of shipments to customers and, as a result, could have a severe impact on our business, operations and financial performance.
In December 2019, an outbreak of COVID-19 virus originated in Wuhan, China, and has since spread to a number of other countries, including the United States. The outbreak and actions taken by the Chinese government resulted in travel restrictions and extended shutdowns of certain businesses in the region. As a result, we experienced cancellations and delays in shipments to our customers in China as well as receiving shipments from our vendors in China during our third and fourth quarters of fiscal 2020. On January 30, 2020, the World Health Organization (“WHO”) announced a global health emergency and the risks to the international community as the virus spreads globally. In March 2020, the WHO classified the COVID-19 outbreak as a pandemic, based on the rapid increase in global exposure. In response, the governments of many countries, states, cities and other geographic regions (including areas in which we have operations) took preventative or protective actions, such as imposing restrictions on business operations and requiring individuals to stay at home. As the impact of the spread of the COVID-19 outbreak continues to be felt, our ability to meet customer demands for products may be impaired or, similarly, our customers may experience adverse business consequences due to COVID-19. A resulting reduced demand for products or impaired ability to meet customer demand (including disruptions at our transportation service providers or vendors) could cause a material adverse effect on our business, operations and financial performance. Even after the COVID-19 pandemic subsides, we may experience adverse impacts to our business and financial results due to any economic recession or depression that has occurred, and due to any major public health crises that may occur in the future. This is a very dynamic situation and we cannot at this time reasonably estimate the scope of its impact on our employees, operations, suppliers, or customers, or the full extent to which COVID-19 could continue to affect the global economy and our results. The potential effects of COVID-19 also could impact many of our risk factors described herein; however, as this is an unprecedented and changing situation, the potential impacts to such risk factors remain uncertain.
10
Our business and results of operations are subject to a broad range of uncertainties arising out of world and domestic events.
Our business and results of operations are subject to uncertainties arising out of world and domestic events. These uncertainties may include a global economic slowdown, pandemics and other public health issues (including the COVID-19 pandemic), natural disasters, military action, terrorist activities, political and social turmoil, civil unrest and other crises. Such conditions may impact customer demand as well as our suppliers’ ability to supply us with necessary materials and, ultimately, may have an impact on our business, financial condition, results and stock price.
We may be subject to intellectual property rights claims, which are costly to defend, could require payment of damages or licensing fees, and/or could limit our ability to use certain technologies in the future.
Substantial litigation and threats of litigation regarding intellectual property rights exist in the display systems and electronics industries. From time to time, third parties, including certain companies in the business of acquiring patents with the intention of aggressively seeking licensing revenue from purported infringers, may assert patent and/or other intellectual property rights to technologies that are important to our business. In any dispute involving products that we have sold, our customers could also become the target of litigation. We are obligated in many instances to indemnify and defend our customers if the products we sell are alleged to infringe any third party’s intellectual property rights. In some cases, depending on the nature of the claim, we may be able to seek indemnification from our suppliers for our self and our customers against such claims, but there is no assurance that we will be successful in obtaining such indemnification or that we are fully protected against such claims. Any infringement claim brought against us, regardless of the duration, outcome or size of damage award, could result in substantial cost, divert our management’s attention, be time consuming to defend, result in significant damage awards, cause product shipment delays, or require us to enter into royalty or other licensing agreements. See Note 12 “Risks and Uncertainties” of the notes to our consolidated financial statements in Part II, Item 8 of this Annual Report on Form 10-K for further information regarding specific legal matters related to our patents.
Additionally, if an infringement claim is successful we may be required to pay damages or seek royalty or license arrangements which may not be available on commercially reasonable terms. The payment of any such damages or royalties may significantly increase our operating expenses and harm our operating results and financial condition. Also, royalty or license arrangements may not be available at all. We may have to stop selling certain products or certain technologies, which could affect our ability to compete effectively.
Potential lawsuits, with or without merit, may divert management’s attention, and we may incur significant expenses in our defense. In addition, we may be required to pay damage awards or settlements, become subject to injunctions or other equitable remedies, or determine to abandon certain lines of business, that may cause a material adverse effect on our results of operations, financial position, and cash flows.
If we fail to maintain an effective system of internal controls or discover material weaknesses in our internal controls over financial reporting, we may not be able to detect fraud or report our financial results accurately or timely.
An effective internal control environment is necessary for us to produce reliable financial reports and is an important part of our effort to prevent financial fraud. We are required to periodically evaluate the effectiveness of the design and operation of our internal controls over financial reporting. Based on these evaluations, we may conclude that enhancements, modifications, or changes to internal controls are necessary or desirable. While management evaluates the effectiveness of our internal controls on a regular basis, these controls may not always be effective. There are inherent limitations on the effectiveness of internal controls, including fraud, collusion, management override, and failure in human judgment. In addition, control procedures are designed to reduce rather than eliminate business risks.
If we fail to maintain an effective system of internal controls, or if management or our independent registered public accounting firm discovers material weaknesses in our internal controls, we may be unable to produce reliable financial reports or prevent fraud. In addition, we may be subject to sanctions or investigation by regulatory authorities, such as the Securities and Exchange Commission or NASDAQ. Any such actions could result in an adverse reaction in the financial markets due to a loss of confidence in the reliability of our financial statements.
If we are deemed to be an investment company, we will be required to meet burdensome compliance requirements and restrictions on our activities.
We currently have significant cash and investments. If we are deemed to be an “investment company” as defined under the Investment Company Act of 1940 (the “Investment Company Act”), the nature of our investments may be subject to various restrictions. We do not believe that our principal activities subject us to the Investment Company Act. If we are deemed to be subject to the Investment Company Act, compliance with required additional regulatory burdens would increase our operating expenses.
11
The company recorded a non-cash impairment charge for the full value of our goodwill and there remains the risk of possible additional future identifiable intangible asset impairment, which could reduce the value of our assets and reduce our net income in the year in which the write-off occurs.
In the fourth quarter of fiscal 2019, the Company recorded a non-cash goodwill impairment charge of $6.3 million for the full amount of the goodwill associated with the IMES reporting unit. The impairment resulted from fourth quarter events that decreased the forecasted future cash flows and the fair value of the IMES reporting unit below its carrying value as of the March 3, 2019 testing date. Refer to Note 7 “Goodwill and Intangible Assets” of the notes to our consolidated financial statements in Part II, Item 8 of this Annual Report on Form 10-K. Our remaining intangible assets could become impaired, which could reduce the value of our assets and reduce our net income in the year in which the write-off occurs. We ascribe value to certain intangible assets, which consist of customer lists and trade names resulting from acquisitions. An impairment charge on intangible assets would be incurred in the event that the fair value of the intangible assets are less than their current carrying values. We evaluate whether events have occurred that indicate all, or a portion, of the carrying amount of intangible assets may no longer be recoverable. If this is the case, an impairment charge to earnings would be necessary.
We may incur substantial operational costs or be required to change our business practices to comply with the General Data Protection Regulation and similar regulations.
The EU adopted the General Data Protection Regulation (“GDPR”) which went into effect in May 2018. The GDPR includes operational requirements for companies that receive or process personal data of residents of the European Union, including more robust documentation requirements for data protection compliance programs. Specifically, the GDPR introduced numerous privacy-related changes for companies operating in the EU, including greater control for data subjects, increased data portability for EU consumers, and data breach notification requirements.
Complying with the GDPR may cause us to incur substantial operational costs or require us to change our business practices in ways that we cannot currently predict. Despite our efforts to bring our practices into compliance with the GDPR, we may not be successful. Non-compliance could result in proceedings against us by governmental entities, customers, data subjects or others. Fines of up to 20 million euros or up to 4% of the annual global revenue of the noncompliant company, whichever is greater, may be imposed for violations of certain of the GDPR’s requirements.
In addition, several other jurisdictions in the U.S. and around the world have recently enacted privacy laws or regulations similar to GDPR. For instance, California enacted the California Consumer Privacy Act (“CCPA”), which was effective January 1, 2020 and which gives consumers many of the same rights as those available under GDPR. Several laws similar to the CCPA have been proposed in the United States at both the federal and state level. The effects of the GDPR, the CCPA and other data privacy laws and regulations may be significant, and may require us to modify our data processing practices and policies and to incur substantial costs and expenses in an effort to comply. Any actual or perceived failures to comply with the GDPR, the CCPA or other data privacy laws or regulations, or related contractual or other obligations, or any perceived privacy rights violation, could lead to investigations, claims, and proceedings by governmental entities and private parties, damages for contract breach, and other significant costs, penalties, and other liabilities, as well as harm to our reputation and market position.
Our international sales and operations are subject to applicable laws relating to trade, export controls and foreign corrupt practices, the violation of which could adversely affect our operations.
We are subject to applicable export control laws and regulations of the United States and other countries. United States laws and regulations applicable to us include the Arms Export Control Act, the International Traffic in Arms Regulations (“ITAR”), the Export Administration Regulations (“EAR”) and the trade and trade sanctions laws and regulations administered by the Office of the United States Trade Representative and the United States Department of the Treasury’s Office of Foreign Assets Control. The import and export of our products are subject to international trade agreements, the modification or repeal of which could impact our business. The U.S. government agencies responsible for administering EAR and ITAR have significant discretion in the interpretation and enforcement of these regulations. Violations of these laws or regulations could result in significant additional sanctions including fines, more onerous compliance requirements, more extensive debarments from export privileges, loss of authorizations needed to conduct aspects of our international business and criminal penalties and may harm our ability to enter contracts with customers who have contracts with the U.S. government. A violation of the laws or the regulations enumerated above could materially adversely affect our business, financial condition and results of operations.
New tariffs and the evolving trade policy dispute between the United States and China may adversely affect our business.
The U.S. government has made statements and taken certain actions that have led to, and may lead to, further changes to U.S. and international trade policies, including recently imposed tariffs affecting certain products exported by a number of U.S. trading
12
partners, including China. There remains uncertainty regarding tax and trade policies, border adjustments, tariffs and government regulations affecting trade between the U.S. and other countries.
For example, during 2018, the U.S. and China each imposed new tariffs, and announced further proposed tariffs, on various products imported from China and the U.S., respectively. Between July 2018 and September 2018, the Office of the United States Trade Representative imposed tariffs of 10% and 25% on three product lists totaling approximately $250 billion in Chinese imports. These lists include some of our products. The U.S. government has also indicated a readiness to further expand the scope of the tariffs on Chinese goods and, in May 2019, there was an announcement of the United States government’s imposition of a 25% tariff on a range of products exported from China to the U.S. on or after May 10, 2019. China thereafter announced a plan to impose tariffs on imports to China of a wide range of American products, in retaliation for the American tariffs. In January 2020, China and the U.S. entered the first phase of an economic and trade agreement. There is no assurance that a broader trade agreement will be successfully negotiated between the U.S. and China to reduce or eliminate existing tariffs applicable to the business of the Company.
Furthermore, the current U.S. administration may impose additional tariffs on imports from China and there is also a concern that the imposition of additional tariffs by the United States could result in the adoption of tariffs by other countries as well. It is possible that further tariffs may be imposed on imports of our products, or that our business will be impacted by retaliatory trade measures taken by China or other countries in response to existing or future tariffs, causing us to raise prices or make changes to our operations, any of which could adversely impact demand for our products, our costs, customers, suppliers and/or the United States economy or certain sectors thereof and, thus, to adversely impact our businesses and results of operations.
Given the uncertainty regarding the scope and duration of the effective and proposed tariffs, as well as the potential for additional trade actions by the U.S. or other countries, the impact on our operations and results is uncertain and could be significant. We can provide no assurance that any strategies we implement to mitigate the impact of such tariffs or other trade actions will be successful. To the extent that our supply chain, costs, sales or profitability are negatively affected by the tariffs or other trade actions, our business, financial condition and results of operations may be materially adversely affected.
ITEM 1B. Unresolved Staff Comments
None.
13
The Company owns one facility and leases 28 facilities. We own our corporate facility and largest distribution center, which is located on approximately 100 acres in LaFox, Illinois and consists of approximately 242,000 square feet of manufacturing, warehouse and office space. We maintain geographically diverse facilities because we believe this provides value to our customers and suppliers, and limits market risk and exchange rate exposure. We believe our properties are well maintained and adequate for our present needs. The extent of utilization varies from property to property and from time to time during the year.
Our facility locations, their primary use and segments served are as follows:
|
Location |
|
Leased/Owned |
|
Use |
|
Segment |
|
Woodland Hills, California |
|
Leased |
|
Sales |
|
PMT |
|
LaFox, Illinois * |
|
Owned |
|
Corporate/Sales/Distribution/Manufacturing |
|
PMT/Canvys/Healthcare |
|
Marlborough, Massachusetts |
|
Leased |
|
Sales/Distribution/Manufacturing |
|
Canvys |
|
Fort Mill, South Carolina |
|
Leased |
|
Sales/Distribution/Testing/Repair |
|
Healthcare |
|
Murray, Utah |
|
Leased |
|
Sales/Testing/Repair |
|
Healthcare |
|
Sao Paulo, Brazil |
|
Leased |
|
Sales/Distribution |
|
PMT |
|
Beijing, China |
|
Leased |
|
Sales |
|
PMT |
|
Nanjing, China |
|
Leased |
|
Sales |
|
PMT |
|
Shanghai, China |
|
Leased |
|
Sales/Distribution |
|
PMT |
|
Shenzhen, China |
|
Leased |
|
Sales |
|
PMT |
|
Brive, France |
|
Leased |
|
Manufacturing Support/Testing |
|
PMT |
|
Nanterre, France |
|
Leased |
|
Sales |
|
PMT |
|
Donaueschingen, Germany |
|
Leased |
|
Sales/Distribution/Manufacturing |
|
Canvys |
|
Puchheim, Germany |
|
Leased |
|
Sales |
|
PMT |
|
Mumbai, India |
|
Leased |
|
Sales |
|
PMT |
|
Ramat Gan, Israel |
|
Leased |
|
Sales |
|
PMT |
|
Florence, Italy ** |
|
Leased |
|
Sales |
|
PMT |
|
Milan, Italy |
|
Leased |
|
Sales |
|
PMT |
|
Tokyo, Japan |
|
Leased |
|
Sales |
|
PMT |
|
Mexico City, Mexico |
|
Leased |
|
Sales |
|
PMT |
|
Amsterdam, Netherlands |
|
Leased |
|
Sales/Distribution/Manufacturing |
|
PMT/Healthcare |
|
Singapore, Singapore |
|
Leased |
|
Sales/Distribution |
|
PMT |
|
Seoul, South Korea |
|
Leased |
|
Sales |
|
PMT |
|
Madrid, Spain |
|
Leased |
|
Sales |
|
PMT |
|
Taipei, Taiwan |
|
Leased |
|
Sales |
|
PMT/Canvys |
|
Bangkok, Thailand |
|
Leased |
|
Sales/Distribution |
|
PMT |
|
Dubai, United Arab Emirates |
|
Leased |
|
Sales/Distribution/Testing/Repair |
|
PMT |
|
Hook, United Kingdom |
|
Leased |
|
Sales/Distribution/Testing/Repair |
|
PMT |
|
Lincoln, United Kingdom |
|
Leased |
|
Sales |
|
PMT/Canvys |
|
* |
LaFox, Illinois is also the location of our corporate headquarters. |
|
** |
Sold building June 12, 2017, currently lease separate facility. |
On October 15, 2018, Varex Imaging Corporation (“Varex”) filed its original Complaint (Case No. 1:18-cv-06911) against Richardson Electronics Ltd. (“Richardson”) in the Northern District of Illinois, which was subsequently amended on November 27, 2018. Varex alleged counts of infringement of U.S. Patent Nos. 6,456,692 and 6,519,317. Subsequently, on October 24, 2018, Varex filed a motion for preliminary injunction to stop the sale of Richardson’s ALTA750 TM product. Richardson filed an opposition to the preliminary injunction. In January 2019, the Court took evidence on the preliminary injunction issue. On September 30, 2019, the Court denied Varex’s Motion for Preliminary Injunction. Richardson believes the lawsuit to be without merit and a loss is not probable or estimable based on the information at the time the financial statements were issued.
14
ITEM 5. Market for the Registrant’s Common Equity, Related Stockholder Matters and Issuer Purchases of Equity Securities
Unregistered Sales of Equity Securities
None.
Share Repurchases
There were no share repurchases in fiscal 2020.
Dividends
Our quarterly dividend was $0.06 per common share and $0.054 per Class B common share. Annual dividend payments were approximately $3.1 million for both fiscal 2020 and fiscal 2019. All future payments of dividends are at the discretion of the Board of Directors. Dividend payments will depend on earnings, capital requirements, operating conditions and such other factors that the Board may deem relevant.
Common Stock Information
Our common stock is traded on the NASDAQ Global Select Market (“NASDAQ”) under the trading symbol (“RELL”). There is no established public trading market for our Class B common stock. As of July 27, 2020, there were approximately 491 stockholders of record for the common stock and approximately 15 stockholders of record for the Class B common stock.
15
Performance Graph
The following graph compares the performance of our common stock for the periods indicated with the performance of the NASDAQ Composite Index and NASDAQ Electronic Components Index. The graph assumes $100 invested on the last day of our fiscal year 2015, in our common stock, the NASDAQ Composite Index and NASDAQ Electronic Components Index. Total return indices reflect reinvestment of dividends at the closing stock prices at the date of the dividend declaration.
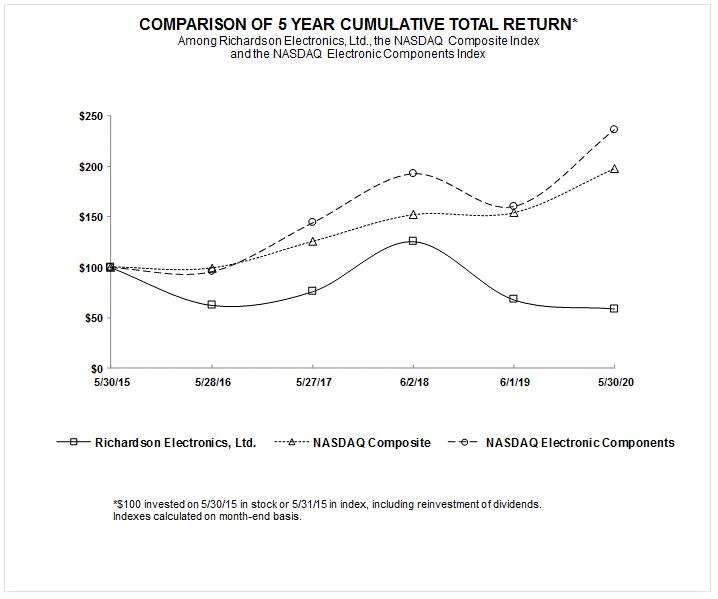
COMPARISON OF 5 YEAR CUMULATIVE TOTAL RETURN* Among Richardson Electronics, Ltd., the NASDAQ Composite Index and the NASDAQ Electronic Components Index $250 $200 $150 $100 $50 $0 5/30/15 5/28/16 5/27/17 6/2/18 6/1/19 5/30/20 Richardson Electronics, Ltd. NASDAQ Composite NASDAQ Electronic Components *$100 invested on 5/30/15 in stock or 5/31/15 in index, including reinvestment of dividends. Indexes calculated on month-end basis.
16
ITEM 6. Selected Financial Data
Five-Year Financial Review
This information should be read in conjunction with our consolidated financial statements, accompanying notes, and Management’s Discussion and Analysis of Financial Condition and Results of Operations included elsewhere herein.
|
|
|
Fiscal Year Ended (1) |
|
|||||||||||||||||
|
|
|
(in thousands, except per share amounts ) |
|
|||||||||||||||||
|
|
|
May 30, 2020 |
|
|
June 1, 2019 |
|
|
June 2, 2018 |
|
|
May 27, 2017 |
|
|
May 28, 2016 |
|
|||||
|
Statements of (Loss) Income |
|
|
|
|
|
|
|
|
|
|
|
|
|
|
|
|
|
|
|
|
|
Net sales |
|
$ |
155,898 |
|
|
$ |
166,652 |
|
|
$ |
163,212 |
|
|
$ |
136,872 |
|
|
$ |
142,016 |
|
|
Continuing Operations |
|
|
|
|
|
|
|
|
|
|
|
|
|
|
|
|
|
|
|
|
|
(Loss) income from continuing operations before tax |
|
$ |
(1,214 |
) |
|
$ |
(6,311 |
) |
|
$ |
3,860 |
|
|
$ |
(6,116 |
) |
|
$ |
(6,220 |
) |
|
Income tax provision |
|
|
624 |
|
|
|
1,017 |
|
|
|
1,534 |
|
|
|
812 |
|
|
|
546 |
|
|
(Loss) income from continuing operations |
|
$ |
(1,838 |
) |
|
$ |
(7,328 |
) |
|
$ |
2,326 |
|
|
$ |
(6,928 |
) |
|
$ |
(6,766 |
) |
|
Discontinued Operations |
|
|
|
|
|
|
|
|
|
|
|
|
|
|
|
|
|
|
|
|
|
Income from discontinued operations |
|
$ |
— |
|
|
$ |
— |
|
|
$ |
1,496 |
|
|
$ |
— |
|
|
$ |
— |
|
|
Net (loss) income |
|
$ |
(1,838 |
) |
|
$ |
(7,328 |
) |
|
$ |
3,822 |
|
|
$ |
(6,928 |
) |
|
$ |
(6,766 |
) |
|
Per Share Data |
|
|
|
|
|
|
|
|
|
|
|
|
|
|
|
|
|
|
|
|
|
Net (loss) income per Common share - Basic: |
|
|
|
|
|
|
|
|
|
|
|
|
|
|
|
|
|
|
|
|
|
(Loss) income from continuing operations |
|
$ |
(0.14 |
) |
|
$ |
(0.57 |
) |
|
$ |
0.18 |
|
|
$ |
(0.55 |
) |
|
$ |
(0.53 |
) |
|
Income from discontinued operations |
|
|
— |
|
|
|
— |
|
|
|
0.12 |
|
|
|
— |
|
|
|
— |
|
|
Total net (loss) income per Common share - Basic |
|
$ |
(0.14 |
) |
|
$ |
(0.57 |
) |
|
$ |
0.30 |
|
|
$ |
(0.55 |
) |
|
$ |
(0.53 |
) |
|
Net (loss) income per Class B common share - Basic: |
|
|
|
|
|
|
|
|
|
|
|
|
|
|
|
|
|
|
|
|
|
(Loss) income from continuing operations |
|
$ |
(0.13 |
) |
|
$ |
(0.51 |
) |
|
$ |
0.16 |
|
|
$ |
(0.49 |
) |
|
$ |
(0.47 |
) |
|
Income from discontinued operations |
|
|
— |
|
|
|
— |
|
|
|
0.11 |
|
|
|
— |
|
|
|
— |
|
|
Total net (loss) income per Class B common share - Basic |
|
$ |
(0.13 |
) |
|
$ |
(0.51 |
) |
|
$ |
0.27 |
|
|
$ |
(0.49 |
) |
|
$ |
(0.47 |
) |
|
Net (loss) income per Common share - Diluted: |
|
|
|
|
|
|
|
|
|
|
|
|
|
|
|
|
|
|
|
|
|
(Loss) income from continuing operations |
|
$ |
(0.14 |
) |
|
$ |
(0.57 |
) |
|
$ |
0.18 |
|
|
$ |
(0.55 |
) |
|
$ |
(0.53 |
) |
|
Income from discontinued operations |
|
|
— |
|
|
|
— |
|
|
|
0.12 |
|
|
|
— |
|
|
|
— |
|
|
Total net (loss) income per Common share - Diluted |
|
$ |
(0.14 |
) |
|
$ |
(0.57 |
) |
|
$ |
0.30 |
|
|
$ |
(0.55 |
) |
|
$ |
(0.53 |
) |
|
Net (loss) income per Class B common share - Diluted: |
|
|
|
|
|
|
|
|
|
|
|
|
|
|
|
|
|
|
|
|
|
(Loss) income from continuing operations |
|
$ |
(0.13 |
) |
|
$ |
(0.51 |
) |
|
$ |
0.16 |
|
|
$ |
(0.49 |
) |
|
$ |
(0.47 |
) |
|
Income from discontinued operations |
|
|
— |
|
|
|
— |
|
|
|
0.11 |
|
|
|
— |
|
|
|
— |
|
|
Total net (loss) income per Class B common share - Diluted |
|
$ |
(0.13 |
) |
|
$ |
(0.51 |
) |
|
$ |
0.27 |
|
|
$ |
(0.49 |
) |
|
$ |
(0.47 |
) |
|
Cash Dividend Data |
|
|
|
|
|
|
|
|
|
|
|
|
|
|
|
|
|
|
|
|
|
Dividends per common share |
|
$ |
0.24 |
|
|
$ |
0.24 |
|
|
$ |
0.24 |
|
|
$ |
0.24 |
|
|
$ |
0.24 |
|
|
Dividends per Class B common share (2) |
|
$ |
0.22 |
|
|
$ |
0.22 |
|
|
$ |
0.22 |
|
|
$ |
0.22 |
|
|
$ |
0.22 |
|
|
Balance Sheet Data |
|
|
|
|
|
|
|
|
|
|
|
|
|
|
|
|
|
|
|
|
|
Total assets |
|
$ |
150,720 |
|
|
$ |
153,017 |
|
|
$ |
166,329 |
|
|
$ |
157,464 |
|
|
$ |
168,130 |
|
|
Stockholders’ equity |
|
$ |
118,660 |
|
|
$ |
123,757 |
|
|
$ |
135,181 |
|
|
$ |
132,327 |
|
|
$ |
141,675 |
|
|
(1) |
Our fiscal year ends on the Saturday nearest the end of May. Each of the fiscal years presented contain 52/53 weeks. |
|
(2) |
The dividend per Class B common share is 90% of the dividend per Class A common share. |
17
ITEM 7. Management’s Discussion and Analysis of Financial Condition and Results of Operations
The following discussion should be read in conjunction with the consolidated financial statements and related notes.
Management’s Discussion and Analysis of Financial Condition and Results of Operations (“MD&A”) is intended to assist the reader in better understanding our business, results of operations, financial condition, changes in financial condition, critical accounting policies and estimates and significant developments. MD&A is provided as a supplement to, and should be read in conjunction with, our consolidated financial statements and the accompanying notes appearing elsewhere in this filing. This section is organized as follows:
|
|
• |
Business Overview |
|
|
• |
Results of Operations - an analysis and comparison of our consolidated results of operations for the fiscal years ended May 30, 2020, June 1, 2019 and June 2, 2018, as reflected in our consolidated statements of comprehensive (loss) income. |
|
|
• |
Liquidity, Financial Position and Capital Resources - a discussion of our primary sources and uses of cash for the fiscal years ended May 30, 2020, June 1, 2019 and June 2, 2018, and a discussion of changes in our financial position. |
Business Overview
Richardson Electronics, Ltd. is a leading global provider of engineered solutions, power grid and microwave tubes and related consumables; power conversion and RF and microwave components; high value flat panel detector solutions, replacement parts, tubes and service training for diagnostic imaging equipment; and customized display solutions. We serve customers in the alternative energy, healthcare, aviation, broadcast, communications, industrial, marine, medical, military, scientific and semiconductor markets. The Company’s strategy is to provide specialized technical expertise and “engineered solutions” based on our core engineering and manufacturing capabilities. The Company provides solutions and adds value through design-in support, systems integration, prototype design and manufacturing, testing, logistics, and aftermarket technical service and repair through its global infrastructure.
Some of the Company's products are manufactured in China and are imported into the United States. The Office of the United States Trade Representative ("USTR") instituted additional 10% to 25% tariffs on the importation of a number of products into the United States from China effective July 6, 2018, with additional products added August 23, 2018 and September 24, 2018. These additional tariffs are a response to what the USTR considers to be certain unfair trade practices by China. A number of the Company's products manufactured in China are now subject to these additional duties of 25% when imported into the United States.
Management is currently working with its suppliers as well as its customers to help outline and, where possible, mitigate the impact of the new tariffs on our customers’ markets. However, if the Company is unable to successfully pass through the additional cost of these tariffs, or if the higher prices reduce demand for the Company's products, it will have a negative effect on the Company's sales and gross margins.
We have three operating and reportable segments, which we define as follows:
Power and Microwave Technologies Group (“PMT”) combines our core engineered solutions capabilities, power grid and microwave tube business with new RF, Wireless and Power disruptive technologies. As a designer, manufacturer, technology partner and authorized distributor, PMT’s strategy is to provide specialized technical expertise and engineered solutions based on our core engineering and manufacturing capabilities on a global basis. We provide solutions and add value through design-in support, systems integration, prototype design and manufacturing, testing, logistics and aftermarket technical service and repair—all through our existing global infrastructure. PMT’s focus is on products for power, RF and microwave applications for customers in 5G, alternative energy, aviation, broadcast, communications, industrial, marine, medical, military, scientific and semiconductor markets. PMT focuses on various applications including broadcast transmission, CO2 laser cutting, diagnostic imaging, dielectric and induction heating, high energy transfer, high voltage switching, plasma, power conversion, radar and radiation oncology. PMT also offers its customers technical services for both microwave and industrial equipment.
Canvys provides customized display solutions serving the corporate enterprise, financial, healthcare, industrial and medical original equipment manufacturers markets. Our engineers design, manufacture, source and support a full spectrum of solutions to match the needs of our customers. We offer long term availability and proven custom display solutions that include touch screens, protective panels, custom enclosures, All-In-One computers, specialized cabinet finishes and application specific software packages and certification services. Our volume commitments are lower than the large display manufacturers, making us the ideal choice for companies with very specific design requirements. We partner with both private label manufacturing companies and leading branded hardware vendors to offer the highest quality display and touch solutions and customized computing platforms.
18
Healthcare manufactures, repairs, refurbishes and distributes high value replacement parts and equipment for the healthcare market including hospitals, medical centers, asset management companies, independent service organizations and multi-vendor service providers. Products include diagnostic imaging replacement parts for CT and MRI systems; replacement CT and MRI tubes; CT service training; MRI coils, cold heads and RF amplifiers; hydrogen thyratrons, klystrons, magnetrons; flat panel detector upgrades; pre-owned CT systems; and additional replacement solutions currently under development for the diagnostic imaging service market. Through a combination of newly developed products and partnerships, service offerings and training programs, we believe we can help our customers improve efficiency and deliver better clinical outcomes while lowering the cost of healthcare delivery.
We currently have operations in the following major geographic regions: North America, Asia/Pacific, Europe and Latin America.
Results of Operations
Overview - Fiscal Year Ended May 30, 2020
|
|
• |
Fiscal 2020 and fiscal 2019 both contained 52 weeks. |
|
|
• |
Net sales during fiscal 2020 were $155.9 million, down 6.5%, compared to net sales of $166.7 million during fiscal 2019. |
|
|
• |
Gross margin was 31.9% of net sales during fiscal 2020, compared to 31.0% of net sales during fiscal 2019. |
|
|
• |
Selling, general and administrative expenses were $51.3 million, or 32.9% of net sales, during fiscal 2020, compared to $52.2 million, or 31.3% of net sales, during fiscal 2019. |
|
|
• |
Impairment of goodwill, a non-cash item, was $6.3 million during fiscal 2019. |
|
|
• |
Operating loss during fiscal 2020 was $1.7 million, compared to operating loss of $6.8 million during fiscal 2019. Excluding the impairment of goodwill, operating loss during fiscal 2019 was $0.5 million. |
|
|
• |
Other income during fiscal 2020 was $0.4 million, compared to other income of $0.5 million during fiscal 2019. |
|
|
• |
Net loss during fiscal 2020 was $1.8 million, compared to net loss of $7.3 million during fiscal 2019. |
Net Sales and Gross Profit Analysis
Net sales by segment and percent change for fiscal 2020, fiscal 2019 and fiscal 2018 were as follows (in thousands):
|
Net Sales |
|
FY 2020 |
|
|
FY 2019 |
|
|
FY 2018 |
|
|
FY20 vs. FY19 % Change |
|
|
FY19 vs. FY18 % Change |
|
|||||
|
PMT |
|
$ |
118,480 |
|
|
$ |
128,902 |
|
|
$ |
128,296 |
|
|
|
(8.1 |
%) |
|
|
0.5 |
% |
|
Canvys |
|
|
28,926 |
|
|
|
27,968 |
|
|
|
26,683 |
|
|
|
3.4 |
% |
|
|
4.8 |
% |
|
Healthcare |
|
|
8,492 |
|
|
|
9,782 |
|
|
|
8,233 |
|
|
|
(13.2 |
%) |
|
|
18.8 |
% |
|
Total |
|
$ |
155,898 |
|
|
$ |
166,652 |
|
|
$ |
163,212 |
|
|
|
(6.5 |
%) |
|
|
2.1 |
% |
During fiscal 2020, consolidated net sales decreased by 6.5% compared to fiscal 2019. Sales for PMT decreased by 8.1%, Canvys sales increased by 3.4% and Healthcare sales decreased by 13.2%. During fiscal 2019, consolidated net sales increased by 2.1% compared to fiscal 2018. Sales for PMT increased by 0.5%, Canvys sales increased by 4.8% and Healthcare sales increased by 18.8%.
Gross profit by segment and percent of segment net sales for fiscal 2020, fiscal 2019 and fiscal 2018 were as follows (in thousands):
|
Gross Profit |
|
FY 2020 |
|
|
FY 2019 |
|
|
FY 2018 |
|
|||||||||||||||
|
PMT |
|
$ |
38,288 |
|
|
|
32.3 |
% |
|
$ |
40,254 |
|
|
|
31.2 |
% |
|
$ |
43,254 |
|
|
|
33.7 |
% |
|
Canvys |
|
|
9,313 |
|
|
|
32.2 |
% |
|
|
9,085 |
|
|
|
32.5 |
% |
|
|
8,410 |
|
|
|
31.5 |
% |
|
Healthcare |
|
|
2,072 |
|
|
|
24.4 |
% |
|
|
2,396 |
|
|
|
24.5 |
% |
|
|
3,418 |
|
|
|
41.5 |
% |
|
Total |
|
$ |
49,673 |
|
|
|
31.9 |
% |
|
$ |
51,735 |
|
|
|
31.0 |
% |
|
$ |
55,082 |
|
|
|
33.7 |
% |
19
Gross profit reflects the distribution and manufacturing product margin less manufacturing variances, inventory obsolescence charges, customer returns, scrap and cycle count adjustments, engineering costs and other provisions.
Consolidated gross profit was $49.7 million during fiscal 2020, compared to $51.7 million during fiscal 2019. Consolidated gross margin as a percentage of net sales increased to 31.9% during fiscal 2020, from 31.0% during fiscal 2019, mainly due to PMT improved product mix and manufacturing efficiencies. Gross margin during fiscal 2020 included expense related to inventory provisions for PMT of $0.6 million, $0.1 million for Canvys and $0.3 million for Healthcare.
Consolidated gross profit was $51.7 million during fiscal 2019, compared to $55.1 million during fiscal 2018. Consolidated gross margin as a percentage of net sales decreased to 31.0% during fiscal 2019, from 33.7% during fiscal 2018. Gross margin during fiscal 2019 included expense related to inventory provisions for PMT of $0.7 million, $0.1 million for Canvys and $0.3 million for Healthcare. Gross margin during fiscal 2019 also included $1.6 million in under absorption of manufacturing costs primarily related to the slowdown in the semi-wafer fab equipment market. Gross margin during fiscal 2018 included expense related to inventory provisions for PMT of $0.6 million, $0.1 million for Canvys and $0.1 million for Healthcare. Additionally, gross margin during fiscal 2018 included over absorption of manufacturing costs.
Power and Microwave Technologies Group
Net sales for PMT decreased 8.1% to $118.5 million during fiscal 2020, from $128.9 million during fiscal 2019. This decrease was mainly due to a slowdown in the MRO replacement tube market and COVID-19 related market decline but was partially offset by growth in 5G and other RF and Power markets from new technology suppliers in our Power and Microwave Group (PMG). Gross margin as a percentage of net sales increased to 32.3% during fiscal 2020 as compared to 31.2% during fiscal 2019, primarily due to an improved product mix and manufacturing efficiencies.
Net sales for PMT increased 0.5% to $128.9 million during fiscal 2019, from $128.3 million during fiscal 2018. This increase was led by growth in market share in some electron device products as well as major growth in the 5G and other RF and Microwave markets from new technology suppliers somewhat offset by lower sales from the decline in the semi-wafer fab equipment market. Gross margin as a percentage of net sales decreased to 31.2% during fiscal 2019 as compared to 33.7% during fiscal 2018, primarily due to product mix and manufacturing under absorption.
Canvys – Visual Technology Solutions
Net sales for Canvys increased 3.4% to $28.9 million during fiscal 2020, from $28.0 million during fiscal 2019. Sales were up due to the addition of new customers and programs as well as increased customer demand in North America. Gross margin as a percentage of net sales decreased to 32.2% during fiscal 2020 as compared to 32.5% during fiscal 2019, primarily due to product mix and foreign currency effects.
Net sales for Canvys increased 4.8% to $28.0 million during fiscal 2019, from $26.7 million during fiscal 2018. Sales were up in North America due to the addition of new customers and programs as well as strong demand from existing customers throughout the year. Net sales were down in Europe primarily due to foreign currency effects. Gross margin as a percentage of net sales increased to 32.5% during fiscal 2019 as compared to 31.5% during fiscal 2018, primarily due to product mix and foreign currency effects.
Healthcare
Net sales for Healthcare decreased 13.2% to $8.5 million during fiscal 2020, from $9.8 million during fiscal 2019. The decrease in sales was primarily due to the COVID-19 global pandemic. Gross margin as a percentage of net sales was 24.4% during fiscal 2020, nearly flat compared to 24.5% during fiscal 2019. This decrease was primarily due to high scrap expenses associated with CT tube development and lower sales, partially offset by improved manufacturing efficiencies and favorable product mix.
Net sales for Healthcare increased 18.8% to $9.8 million during fiscal 2019, from $8.2 million during fiscal 2018. The increase in sales was primarily due to the launch of the new ALTA750 TM CT Tube in FY19 in addition to significant growth in equipment sales. Gross margin as a percentage of net sales decreased to 24.5% during fiscal 2019, compared to 41.5% during fiscal 2018. This decrease was primarily due an unfavorable product mix in addition to manufacturing absorption and high scrap expenses associated with the launch of the ALTA750 TM.
20
Sales by Geographic Area
On a geographic basis, our sales are categorized by destination: North America; Asia/Pacific; Europe; Latin America; and Other.
Net sales by geographic area and percent change for fiscal 2020, fiscal 2019 and fiscal 2018 were as follows (in thousands):
|
Net Sales |
|
FY 2020 |
|
|
FY 2019 |
|
|
FY 2018 |
|
|
FY20 vs. FY19 % Change |
|
|
FY19 vs. FY18 % Change |
|
|||||
|
North America |
|
$ |
65,259 |
|
|
$ |
66,228 |
|
|
$ |
67,662 |
|
|
|
(1.5 |
%) |
|
|
(2.1 |
%) |
|
Asia/Pacific |
|
|
32,979 |
|
|
|
34,681 |
|
|
|
32,607 |
|
|
|
(4.9 |
%) |
|
|
6.4 |
% |
|
Europe |
|
|
49,394 |
|
|
|
55,038 |
|
|
|
53,818 |
|
|
|
(10.3 |
%) |
|
|
2.3 |
% |
|
Latin America |
|
|
8,308 |
|
|
|
10,653 |
|
|
|
9,123 |
|
|
|
(22.0 |
%) |
|
|
16.8 |
% |
|
Other (1) |
|
|
(42 |
) |
|
|
52 |
|
|
|
2 |
|
|
|
(180.8 |
%) |
|
|
2,500.0 |
% |
|
Total |
|
$ |
155,898 |
|
|
$ |
166,652 |
|
|
$ |
163,212 |
|
|
|
(6.5 |
%) |
|
|
2.1 |
% |
Gross profit by geographic area and percent of geographic net sales for fiscal 2020, fiscal 2019 and fiscal 2018 were as follows (in thousands):
|
Gross Profit (Loss) |
|
FY 2020 |
|
|
FY 2019 |
|
|
FY 2018 |
|
|||||||||||||||
|
North America |
|
$ |
24,494 |
|
|
|
37.5 |
% |
|
$ |
24,776 |
|
|
|
37.4 |
% |
|
$ |
25,996 |
|
|
|
38.4 |
% |
|
Asia/Pacific |
|
|
10,629 |
|
|
|
32.2 |
% |
|
|
10,905 |
|
|
|
31.4 |
% |
|
|
10,794 |
|
|
|
33.1 |
% |
|
Europe |
|
|
15,483 |
|
|
|
31.3 |
% |
|
|
17,425 |
|
|
|
31.7 |
% |
|
|
18,071 |
|
|
|
33.6 |
% |
|
Latin America |
|
|
2,804 |
|
|
|
33.8 |
% |
|
|
3,863 |
|
|
|
36.3 |
% |
|
|
3,602 |
|
|
|
39.5 |
% |
|
Other (1) |
|
|
(3,737 |
) |
|
|
|
|
|
|
(5,234 |
) |
|
|
|
|
|
|
(3,381 |
) |
|
|
|
|
|
Total |
|
$ |
49,673 |
|
|
|
31.9 |
% |
|
$ |
51,735 |
|
|
|
31.0 |
% |
|
$ |
55,082 |
|
|
|
33.7 |
% |
|
(1) |
Other primarily includes net sales not allocated to a specific geographical region, unabsorbed value-add costs and other unallocated expenses. |
We sell our products to customers in diversified industries and perform periodic credit evaluations of our customers’ financial condition. Terms are generally on open account, payable net 30 days in North America, and vary throughout Asia/Pacific, Europe and Latin America. Estimates of credit losses are recorded in the financial statements based on monthly reviews of outstanding accounts.
Selling, General and Administrative Expenses
Selling, general and administrative expenses (“SG&A”) decreased during fiscal 2020 to $51.3 million from $52.2 million during fiscal 2019. SG&A as a percentage of sales increased to 32.9% during fiscal 2020 as compared to 31.3% during fiscal 2019. The decrease in expense was primarily due to lower travel, severance, legal and IT expenses, partially offset by higher employee compensation expenses.
Selling, general and administrative expenses (“SG&A”) increased during fiscal 2019 to $52.2 million from $51.7 million during fiscal 2018. SG&A as a percentage of sales decreased to 31.3% during fiscal 2019 as compared to 31.7% during fiscal 2018. The increase in expense was due to higher legal and severance expense related to two lawsuits litigated during fiscal 2019 and headcount reductions throughout fiscal 2019. Bad debt expense was also higher in fiscal 2019 compared to fiscal 2018 due to a large recovery that was collected in fiscal 2018. These increases were mostly offset by lower incentive expenses.
Impairment of Goodwill
In connection with a year-end impairment review of goodwill, the Company recorded a $6.3 million non-cash goodwill impairment charge in the fourth quarter of fiscal 2019 to write off all the goodwill associated with the IMES acquisition. Refer to Note 7 “Goodwill and Intangible Assets” of the notes to our consolidated financial statements in Part II, Item 8 of this Annual Report on Form 10-K.
Other Income/Expense
Other income/expense was income of $0.4 million during fiscal 2020, compared to income of $0.5 million during fiscal 2019. Fiscal 2020 had $0.4 million of investment income. Fiscal 2019 included $0.5 million of investment income, partially offset by less than $0.1 million of foreign exchange losses. Our foreign exchange gains and losses are primarily due to the translation of U.S. dollars held in non-U.S. entities. We currently do not utilize derivative instruments to manage our exposure to foreign currency.
21
Income Tax Provision
Our income tax provision from continuing operations during fiscal 2020, fiscal 2019 and fiscal 2018 was $0.6 million, $1.0 million and $1.5 million, respectively. The effective income tax rates from continuing operations during fiscal 2020, fiscal 2019 and fiscal 2018 were (51.4)%, (16.1)% and 39.7%, respectively. The difference between the effective tax rates as compared to the U.S. federal statutory rate of 21.0% during fiscal 2020, 21.0% during fiscal 2019 and 29.2% during fiscal 2018 was primarily driven by the impact of recording a valuation allowance against all of our U.S. state and federal net deferred tax assets, and changes in our geographical distribution of income (loss).
On December 22, 2017, the U.S. government enacted new tax legislation, Tax Cuts and Jobs Act (the “Act”). The primary provision of the Act that impacted the Company in fiscal 2019 was a reduction to the U.S. corporate income tax rate from 35% to 21%. The 21% corporate income tax rate was effective January 1, 2018 and is in effect for the Company’s full fiscal 2020 and fiscal 2019 tax years.
The Company is subject to additional requirements of the Act beginning in fiscal 2019. Those provisions include an income inclusion for global intangible low-taxed income (“GILTI”), a tax determined by base erosion and anti-avoidance tax (“BEAT”) related to certain payments between a U.S. corporation and foreign related entities, a limitation of certain executive compensation and a deduction for foreign derived intangible income. The Company has determined its accounting policy to treat the taxes due on GILTI as a period cost. The Company is not subject to BEAT provision due to the revenue thresholds.
As of May 30, 2020, we had approximately $3.7 million of net deferred tax assets related to federal net operating loss (“NOL”) carryforwards, compared to $3.1 million as of June 1, 2019. Net deferred tax assets related to domestic state NOL carryforwards at May 30, 2020 amounted to approximately $3.8 million, compared to $3.9 million at June 1, 2019. Net deferred tax assets related to foreign NOL carryforwards as of May 30, 2020 totaled approximately $0.3 million with various or indefinite expiration dates. The amount of net deferred tax assets related to foreign NOL carryforwards was $0.4 million as of June 1, 2019. We also had a domestic net deferred tax asset of $1.8 million of foreign tax credit carryforwards as of May 30, 2020, compared to $1.8 million as of June 1, 2019. We did not have any alternative minimum tax credit carryforward as of May 30, 2020.
We have historically determined that undistributed earnings of our foreign subsidiaries, to the extent of cash available, will be repatriated to the U.S. The deferred tax liability on the outside basis difference is now primarily withholding tax on future dividend distributions. Accordingly, we have reduced the deferred tax liability related to undistributed earnings of our foreign subsidiaries from $0.2 million in fiscal 2019 to less than $0.1 million in fiscal 2020.
Management assesses the available positive and negative evidence to estimate if sufficient future taxable income will be generated to use the existing deferred tax assets. A significant component of objective evidence evaluated was the cumulative income or loss incurred in each jurisdiction over the three-year period ended May 30, 2020. Such objective evidence limits the ability to consider subjective evidence such as future income projections. We considered other positive evidence in determining the need for a valuation allowance in the U.S. including the subpart F and GILTI inclusions of our foreign earnings. The weight of this positive evidence is not sufficient to outweigh other negative evidence in evaluating our need for a valuation allowance in the U.S. jurisdiction.
As of May 30, 2020, a valuation allowance of $12.3 million was established to record only the portion of the deferred tax asset that will more likely than not be realized. The valuation allowance as of June 1, 2019 was $11.7 million. We recorded a valuation allowance for all domestic federal and state net deferred tax assets considering the significant cumulative losses in the U.S. jurisdiction, the reversal of the deferred tax liability for foreign earnings and no forecast of additional U.S. income. The valuation allowance also related to deferred tax assets in foreign jurisdictions where historical taxable losses have been incurred. The amount of the deferred tax asset considered realizable, however, could be adjusted if estimates of future taxable income during the carryforward period are increased, or if objective negative evidence in the form of cumulative losses is no longer present and additional weight may be given to subjective evidence such as our projections for growth.
Income taxes paid, including foreign estimated tax payments, were $1.0 million, $0.3 million and $0.5 million, during fiscal 2020, fiscal 2019 and fiscal 2018, respectively.
In the normal course of business, we are subject to examination by taxing authorities throughout the world. Generally, years prior to fiscal 2015 are closed for examination under the statute of limitation for U.S. federal, U.S. state and local or non-U.S. tax jurisdictions. We are currently under examination in Thailand (fiscal 2008 through 2011). Our primary foreign tax jurisdictions are Germany and the Netherlands. We have tax years open in Germany beginning in fiscal 2015 and the Netherlands beginning in fiscal 2018.
The uncertain tax positions from continuing operations as of both May 30, 2020 and June 1, 2019 were $0.1 million. We record penalties and interest related to uncertain tax positions in the income tax expense line item within the Consolidated Statements of Comprehensive (Loss) Income. Accrued interest and penalties are included within the related tax liability line in the Consolidated Balance Sheets. We have not recorded a liability for interest and penalties as of May 30, 2020 or June 1, 2019. It is not expected that there will be a change in the unrecognized tax benefits due to the expiration of various statutes of limitations within the next 12 months.
22
Liquidity, Financial Position and Capital Resources
Our operations and cash needs have been primarily financed through cash on hand and investments.
Cash, cash equivalents and investments were $46.5 million at May 30, 2020. Cash, cash equivalents and investments at May 30, 2020, consisted of $30.6 million in North America, $8.3 million in Europe, $0.9 million in Latin America and $6.7 million in Asia/Pacific. We repatriated a total of $8.5 million to the United States in fiscal 2020 from several of our foreign entities. This amount includes $4.4 million from our entities in Germany and the Netherlands in the second quarter of fiscal 2020, $1.5 million from our entity in Japan in the third quarter of fiscal 2020 and $1.0 million from our entity in Italy in the fourth quarter of fiscal 2020. Although the Tax Cuts and Jobs Act generally eliminated federal income tax on future cash repatriation to the United States, cash repatriation may be subject to state and local taxes, withholding or similar taxes. See Note 9 “Income Taxes” of the notes to our consolidated financial statements in Part II, Item 8 of this Annual Report on Form 10-K for further information.
Cash, cash equivalents and investments were $50.0 million at June 1, 2019. Cash, cash equivalents and investments at June 1, 2019, consisted of $21.5 million in North America, $17.8 million in Europe, $0.9 million in Latin America and $9.8 million in Asia/Pacific. We repatriated $2.3 million total cash from our entities in Japan and Korea in fiscal 2019 and $5.9 million total cash from our entities in Germany and France in fiscal 2019.
The Company continues to monitor the impact of the COVID-19 outbreak on its supply chain, manufacturing and distribution operations, customers and employees, as well as the U.S. economy in general. However, due to the uncertainty as to when governmental restrictions on business will be fully lifted, the impact thereof, and the duration and widespread nature of the COVID-19 outbreak, the Company cannot currently predict the long-term impact on its operations and financial results. The uncertainties associated with the COVID-19 outbreak include potential adverse effects on the overall economy, the Company’s supply chain, transportation services, employees and customers. The COVID-19 outbreak could adversely affect the Company’s revenues, earnings, liquidity and cash flows and may require significant actions in response, including expense reductions. Conditions surrounding COVID-19 change rapidly and additional impacts of which the Company is not currently aware may arise. Based on past performance and current expectations, we believe that the existing sources of liquidity, including current cash, will provide sufficient resources to meet known capital requirements and working capital needs through the next twelve months.
Cash Flows from Operating Activities
Cash flow from operating activities primarily resulted from our net loss adjusted for non-cash items and changes in our operating assets and liabilities.
Operating activities provided $1.9 million of cash during fiscal 2020. We had net loss of $1.8 million during fiscal 2020, which included non-cash stock-based compensation expense of $0.7 million associated with the issuance of stock option awards and restricted stock awards, $1.0 million of inventory provisions and depreciation and amortization expense of $3.4 million associated with our property and equipment as well as amortization of our intangible assets. Changes in our operating assets and liabilities resulted in a use of cash of $1.3 million during fiscal 2020, primarily due to the increase in inventories of $5.5 million and the decrease in accrued liabilities of $0.9 million. These uses of cash were partially offset by the decrease in accounts receivable of $3.9 million, the increase in our accounts payable of $0.6 million and the decrease in prepaid expenses and other assets of $0.6 million. The majority of the inventory increase was to support our electron tube and Canvys businesses and the impact of COVID-19 on sales. The decrease in accounts receivable was primarily due to the decrease in sales and better collection of receivables. The increase in our accounts payable was due to timing of payments for some of our larger vendors for both inventory and services.
Operating activities used $2.6 million of cash during fiscal 2019. We had net loss of $7.3 million during fiscal 2019, which included non-cash stock-based compensation expense of $0.7 million associated with the issuance of stock option awards and restricted stock awards, $1.1 million of inventory provisions and depreciation and amortization expense of $3.2 million associated with our property and equipment as well as amortization of our intangible assets. The Company recorded a non-cash goodwill impairment charge of $6.3 million for the full amount of the goodwill associated with the IMES reporting unit. Changes in our operating assets and liabilities resulted in a use of cash of $6.8 million during fiscal 2019, primarily due to the increase in inventories of $4.2 million, the increase in accounts receivable of $2.0 million and the decrease in our accounts payable of $2.4 million. These uses of cash were partially offset by the decrease in prepaid expenses and other assets of $0.6 million and the increase in accrued liabilities of $1.1 million. The inventory increase was due to the ongoing growth of our RF and power technologies business and growth in CT Tube and component inventory as we prepare for expected ALTA750 TM tube sales growth in the Healthcare market. The increase in accounts receivable was primarily due to the increase in sales. The decrease in our accounts payable was due to timing of payments for some of our larger vendors for both inventory and services. The increase in accrued liabilities was primarily due to an increase in deferred revenues as well as several accrued expenses.
Cash Flows from Investing Activities
The cash flow from investing activities consisted primarily of purchases and maturities of investments and capital expenditures.
23
Cash used in investing activities of $9.8 million during fiscal 2020 included purchases of investments of $29.0 million and $1.8 million in capital expenditures, partially offset by the proceeds from the maturities of investments of $21.0 million. Capital expenditures related primarily to capital used for our IT system, and Healthcare and LaFox manufacturing businesses.
Cash used in investing activities of $11.9 million during fiscal 2019 included purchases of investments of $17.8 million and $3.9 million in capital expenditures, partially offset by the proceeds from the maturities of investments of $9.8 million. Capital expenditures relates primarily to our Healthcare growth initiative, a new air conditioner unit for the global headquarters, investments in our LaFox manufacturing operation and capital used for our IT system.
Our purchases and proceeds from investments consist of time deposits and CDs. Purchasing of future investments may vary from period to period due to interest and foreign currency exchange rates.
Cash Flows from Financing Activities
The cash flow from financing activities primarily consists of cash dividends paid.
Cash used in financing activities of $3.2 million during fiscal 2020 resulted primarily from cash used to pay dividends, partially offset by proceeds from the issuance of common stock from stock option exercises.
Cash used in financing activities of $2.8 million during fiscal 2019 resulted primarily from cash used to pay dividends, partially offset by proceeds from the issuance of common stock from stock option exercises.
All future payments of dividends are at the discretion of the Board of Directors. Dividend payments will depend on earnings, capital requirements, operating conditions and such other factors that the Board may deem relevant.
Contractual Obligations
Contractual obligations are presented in the table below as of May 30, 2020 (in thousands):
|
|
|
Less than 1 year |
|
|
1 - 3 years |
|
|
4 - 5 years |
|
|
More than 5 years |
|
|
Less Interest |
|
|
Total |
|
||||||
|
Lease obligations (1) |
|
$ |
1,653 |
|
|
$ |
1,697 |
|
|
$ |
272 |
|
|
$ |
61 |
|
|
$ |
(257 |
) |
|
$ |
3,426 |
|
|
(1) |
Lease obligations are related to certain warehouse and office facilities under non-cancelable operating leases as well as financing leases. |
Critical Accounting Policies and Estimates
The preparation of financial statements in conformity with United States Generally Accepted Accounting Principles (“GAAP”) requires management to make significant estimates and assumptions that affect the reported amounts of assets and liabilities and disclosure of contingent assets and liabilities at the date of the financial statements and the reported amounts of revenues and expenses during the reporting period. Management continuously evaluates its critical accounting policies and estimates, including the allowance for doubtful accounts, revenue recognition, inventory obsolescence, goodwill and other intangible assets, loss contingencies and income taxes. Management bases the estimates on historical experience and on various other assumptions believed to be reasonable under the circumstances, however, actual results could differ from those estimates.
The policies discussed below are considered by management to be critical to understanding our financial position and the results of operations. Their application involves significant judgments and estimates in preparation of our consolidated financial statements. For all of these policies, management cautions that future events rarely develop exactly as forecasted, and the best estimates routinely require adjustment.
Allowance for Doubtful Accounts
Our allowance for doubtful accounts includes estimated losses that result from uncollectible receivables. The estimates are influenced by the following: continuing credit evaluation of customers’ financial conditions; aging of receivables, individually and in the aggregate; a large number of customers which are widely dispersed across geographic areas; and collectability and delinquency history by geographic area. Significant changes in one or more of these considerations may require adjustments affecting net income and net carrying value of accounts receivable. The allowance for doubtful accounts was approximately $0.3 million as of both May 30, 2020 and June 1, 2019.
24
Revenue Recognition
Revenue is recognized when control of the promised goods is transferred to our customers, which is simultaneous with the title transferring to the customer, in an amount that reflects the transaction price consideration that we expect to receive in exchange for those goods. Control refers to the ability of the customer to direct the use of, and obtain substantially all of, the remaining benefits from the goods. Our transaction price consideration is fixed, unless otherwise disclosed below as variable consideration. Generally, our contracts require our customers to pay for goods after we deliver products to them. Terms are generally on open account, payable net 30 days in North America, and vary throughout Asia/Pacific, Europe and Latin America subject to customary credit checks.
The Company also sells products that are manufactured or assembled in our manufacturing facility. These products can either be built to the customer’s prints/designs or are products that we stock in our warehouse to sell to any customer that places an order. The manufacturing business does not include a separate service bundled with the product sold or sold in addition to the product.
The Company recognizes services revenue when the repair, installation or training is performed. Based on our analysis of services revenue, ASU 2014-09 has an immaterial impact on the timing, amount or characterization of services revenue recognized by the Company. The services we provide are relatively short in duration and typically completed in one to two weeks. Therefore, at each reporting date, the amount of unbilled work performed is insignificant. The services revenue has consistently accounted for less than 5% of the Company’s total revenues and is expected to continue at that level.
Prior to the adoption of ASU 2014-09, our product sales are recognized as revenue upon shipment, when title passes to the customer, when delivery has occurred or services have been rendered and when collectability is reasonably assured. We also record estimated discounts and returns based on our historical experience. Our products are often manufactured to meet the specific design needs of our customers’ applications. Our engineers work closely with customers to ensure that our products will meet their needs. Our customers are under no obligation to compensate us for designing the products we sell.
Inventories, net
Our consolidated inventories are stated at the lower of cost and net realizable value, generally using a weighted-average cost method. Our net inventories include approximately $51.8 million of finished goods, $3.6 million of raw materials and $2.1 million of work-in-progress as of May 30, 2020, as compared to approximately $47.2 million of finished goods, $4.2 million of raw materials and $1.8 million of work-in-progress as of June 1, 2019. The inventory reserve as of May 30, 2020 was $5.4 million compared to $4.6 million as of June 1, 2019.
At this time, we do not anticipate any material risks or uncertainties related to possible future inventory write-downs. Provisions for obsolete or slow moving inventories are recorded based upon regular analysis of stock rotation privileges, obsolescence, the exiting of certain markets and assumptions about future demand and market conditions. If future demand changes in an industry or market conditions differ from management’s estimates, additional provisions may be necessary.
We recorded provisions to our inventory reserves of $1.0 million, $1.1 million and $0.8 million during fiscal 2020, fiscal 2019 and fiscal 2018, respectively, which were included in cost of sales. The provisions were primarily for obsolete and slow moving parts. The parts were written down to estimated realizable value.
Intangible and Long-Lived Assets
Intangible assets are initially recorded at their fair market values determined by quoted market prices in active markets, if available, or recognized valuation models. Intangible assets that have finite useful lives are amortized over their useful lives either on a straight-line basis or over their projected future cash flows and are tested for impairment when events or changes in circumstances occur that indicate possible impairment. Our intangible assets represent the fair value for trade name, customer relationships, non-compete agreements and technology acquired in connection with the acquisitions.
We review property and equipment, definite-lived intangible assets and other long-lived assets for impairment whenever adverse events or changes in circumstances indicate that the carrying amounts of such assets may not be recoverable.
If adverse events do occur, our impairment review is based on an undiscounted cash flow analysis at the lowest level at which cash flows of the long-lived assets are largely independent of other groups of our assets and liabilities. This analysis requires management judgment with respect to changes in technology, the continued success of product lines and future volume, revenue and expense growth rates. We conduct annual reviews for idle and underutilized equipment and review business plans for possible impairment. Impairment occurs when the carrying value of the assets exceeds the future undiscounted cash flows expected to be earned by the use of the asset or asset group. When impairment is indicated, the estimated future cash flows are then discounted to determine the estimated fair value of the asset or asset group and an impairment charge is recorded for the difference between the carrying value and the estimated fair value.
25
Additionally, we also evaluate the remaining useful life each reporting period to determine whether events and circumstances warrant a revision to the remaining period of depreciation or amortization. If the estimate of a long lived asset’s remaining useful life is changed, the remaining carrying amount of the asset is amortized prospectively over that revised remaining useful life.
Loss Contingencies
We accrue a liability for loss contingencies when it is probable that a liability has been incurred and the amount can be reasonably estimated. When only a range of possible loss can be established, the most probable amount in the range is accrued. If no amount within this range is a better estimate than any other amount within the range, the minimum amount in the range is accrued. If we determine that there is at least a reasonable possibility that a loss may have been incurred, we will include a disclosure describing the contingency.
Income Taxes
We recognize deferred tax assets and liabilities based on the differences between financial statement carrying amounts and the tax bases of assets and liabilities. We regularly review our deferred tax assets for recoverability and determine the need for a valuation allowance based on a number of factors, including both positive and negative evidence. These factors include historical taxable income or loss, projected future taxable income or loss, the expected timing of the reversals of existing temporary differences and the implementation of tax planning strategies. In circumstances where we, or any of our affiliates, have incurred three years of cumulative losses which constitute significant negative evidence, positive evidence of equal or greater significance is needed to overcome the negative evidence before a tax benefit is recognized for deductible temporary differences and loss carryforwards. See Note 9 “Income Taxes” of the notes to our consolidated financial statements in Part II, Item 8 of this Annual Report on Form 10-K for further information.
New Accounting Pronouncements
In May 2014, the FASB issued ASU No. 2014-09 (“ASU 2014-09”), Revenue from Contracts with Customers, which amends guidance for revenue recognition. ASU 2014-09 is principles based guidance that can be applied to all contracts with customers, enhancing comparability of revenue recognition practices across entities, industries, jurisdictions and capital markets. The core principle of the guidance is that entities should recognize revenue to depict the transfer of promised goods or services to customers in an amount that reflects the consideration to which the entity expects to be entitled in exchange for those goods and services. The guidance details the steps entities should apply to achieve the core principle. In August 2015, the FASB issued an amendment to defer the effective date for all entities by one year. For public entities, ASU 2014-09 is effective for annual reporting periods beginning after December 15, 2017, including interim periods within that reporting period. Early adoption is permitted as of annual reporting periods beginning after December 15, 2016. Companies have the option of using either a full or modified retrospective approach in applying this standard. During fiscal 2016, 2017, 2018 and 2019 the FASB issued additional updates that further clarify the guidance provided in ASU 2014-09.
Effective June 3, 2018, the Company adopted the standard using the modified retrospective method to all contracts. As a result, financial information for the reporting period beginning June 3, 2018 was reported under the new standard, while comparative financial information has not been adjusted and continues to be reported in accordance with the previous standard. The adoption of this standard did not impact the timing of revenue recognition for our customer sales. The adoption did not result in the recognition of a cumulative adjustment to beginning retained earnings, nor did it have a material impact on the consolidated financial statements. For the Company, the most significant impact of the new standard is the addition of required disclosures within the notes to the financial statements. See Note 4 “Revenue Recognition” of the notes to our consolidated financial statements.
In February 2016, the FASB issued ASU 2016-02 (“ASU 2016-02”), Leases (“Topic 842”). ASU 2016-02 establishes a right-of-use (“ROU”) model that requires a lessee to record an ROU asset and a lease liability on the balance sheet for all leases with terms longer than 12 months. Leases will be classified as either financing or operating, with classification affecting the pattern of expense recognition in the income statement. ASU 2016-02 is effective for fiscal years beginning after December 15, 2018, including interim periods within those fiscal years. The new standard was effective for the Company on June 2, 2019. See Note 8 “Lease Obligations and Other Commitments” of the notes to our consolidated financial statements.
In June 2016, the FASB issued ASU No. 2016-13, Financial Instruments—Credit Losses (Topic 326): Measurement of Credit Losses on Financial Instruments. ASU 2016-13 (as amended by ASU 2018-19, ASU 2019-04, ASU 2019-05, ASU 2019-10, ASU 2019-11 and 2020-02) introduces a new forward-looking approach, based on expected losses, to estimate credit losses on certain types of financial instruments, including trade receivables. The estimate of expected credit losses will require entities to incorporate considerations of historical information, current information and reasonable and supportable forecasts. This ASU also expands the disclosure requirements to enable users of financial statements to understand the entity’s assumptions, models and methods for estimating expected credit losses. The new standard is effective for smaller reporting companies for fiscal years, and interim periods within those fiscal years, beginning after December 15, 2022. Early adoption is permitted. The Company is currently in the process of evaluating the impact of adoption on its consolidated financial statements.
26
ITEM 7A. Quantitative and Qualitative Disclosures about Market Risk
Risk Management and Market Sensitive Financial Instruments
We are exposed to many different market risks with the various industries we serve. The primary financial risk we are exposed to is foreign currency exchange, as certain operations, assets and liabilities of ours are denominated in foreign currencies. We manage these risks through normal operating and financing activities.
Foreign Currency Exposure
Even though we take into account current foreign currency exchange rates at the time an order is taken, our financial statements, denominated in a non-U.S. functional currency, are subject to foreign exchange rate fluctuations.
Our foreign denominated assets and liabilities are cash and cash equivalents, accounts receivable, inventory, accounts payable and intercompany receivables and payables, as we conduct business in countries of the European Union, Asia/Pacific and, to a lesser extent, Canada and Latin America. We do manage foreign exchange exposures by using currency clauses in certain sales contracts and we also have local debt to offset asset exposures. We have not used any derivative instruments nor entered into any forward contracts in fiscal 2020, fiscal 2019 or fiscal 2018.
Had the U.S. dollar changed unfavorably 10% against various foreign currencies, foreign denominated net sales would have been lower by an estimated $9.3 million during fiscal 2020, an estimated $10.5 million during fiscal 2019 and an estimated $10.4 million during fiscal 2018. Total assets would have declined by an estimated $4.3 million as of the fiscal year ended May 30, 2020 and an estimated $4.7 million as of the fiscal year ended June 1, 2019, while the total liabilities would have decreased by an estimated $1.0 million as of the fiscal year ended May 30, 2020 and an estimated $1.1 million as of the fiscal year ended June 1, 2019.
The interpretation and analysis of these disclosures should not be considered in isolation since such variances in exchange rates would likely influence other economic factors. Such factors, which are not readily quantifiable, would likely also affect our operations. Additional disclosure regarding various market risks are set forth in Part I, Item 1A, “Risk Factors” of our Annual Report on this Form 10-K.
ITEM 8. Financial Statements and Supplementary Data
27
Report of Independent Registered Public Accounting Firm
Board of Directors and Stockholders
Richardson Electronics, Ltd.
LaFox, Illinois
Opinion on the Consolidated Financial Statements
We have audited the accompanying consolidated balance sheets of Richardson Electronics, Ltd. (the “Company”) as of May 30, 2020 and June 1, 2019, the related consolidated statements of comprehensive (loss) income, stockholders’ equity, and cash flows for each of the three years in the period ended May 30, 2020, and the related notes (collectively referred to as the “consolidated financial statements”). In our opinion, the consolidated financial statements present fairly, in all material respects, the financial position of the Company at May 30, 2020 and June 1, 2019, and the results of its operations and its cash flows for each of the three years in the period ended May 30, 2020, in conformity with accounting principles generally accepted in the United States of America.
We also have audited, in accordance with the standards of the Public Company Accounting Oversight Board (United States) (“PCAOB”), the Company's internal control over financial reporting as of May 30, 2020, based on criteria established in Internal Control – Integrated Framework (2013) issued by the Committee of Sponsoring Organizations of the Treadway Commission (“COSO”) and our report dated August 3, 2020 expressed an unqualified opinion thereon.
Change in Accounting Method Related to Leases
As discussed in Notes 3 and 8 to the consolidated financial statements, the Company has changed its method of accounting for leases during the year ended May 30, 2020 due to the adoption of Accounting Standards Codification Topic 842, Leases.
Basis for Opinion
These consolidated financial statements are the responsibility of the Company’s management. Our responsibility is to express an opinion on the Company’s consolidated financial statements based on our audits. We are a public accounting firm registered with the PCAOB and are required to be independent with respect to the Company in accordance with the U.S. federal securities laws and the applicable rules and regulations of the Securities and Exchange Commission and the PCAOB.
We conducted our audits in accordance with the standards of the PCAOB. Those standards require that we plan and perform the audit to obtain reasonable assurance about whether the consolidated financial statements are free of material misstatement, whether due to error or fraud.
Our audits included performing procedures to assess the risks of material misstatement of the consolidated financial statements, whether due to error or fraud, and performing procedures that respond to those risks. Such procedures included examining, on a test basis, evidence regarding the amounts and disclosures in the consolidated financial statements. Our audits also included evaluating the accounting principles used and significant estimates made by management, as well as evaluating the overall presentation of the consolidated financial statements. We believe that our audits provide a reasonable basis for our opinion.
/s/ BDO USA, LLP
We have served as the Company's auditor since 2015.
Chicago, Illinois
August 3, 2020
28
Richardson Electronics, Ltd.
(in thousands, except per share amounts)
|
|
|
May 30, 2020 |
|
|
June 1, 2019 |
|
||
|
Assets |
|
|
|
|
|
|
|
|
|
Current assets: |
|
|
|
|
|
|
|
|
|
Cash and cash equivalents |
|
$ |
30,535 |
|
|
$ |
42,019 |
|
|
Accounts receivable, less allowance of $334 and $339, respectively |
|
|
20,197 |
|
|
|
24,296 |
|
|
Inventories, net |
|
|
57,492 |
|
|
|
53,232 |
|
|
Prepaid expenses and other assets |
|
|
2,442 |
|
|
|
3,067 |
|
|
Investments - current |
|
|
16,000 |
|
|
|
8,000 |
|
|
Total current assets |
|
|
126,666 |
|
|
|
130,614 |
|
|
Non-current assets: |
|
|
|
|
|
|
|
|
|
Property, plant and equipment, net |
|
|
17,674 |
|
|
|
19,111 |
|
|
Intangible assets, net |
|
|
2,505 |
|
|
|
2,763 |
|
|
Lease ROU asset |
|
|
3,419 |
|
|
|
— |
|
|
Non-current deferred income taxes |
|
|
456 |
|
|
|
529 |
|
|
Total non-current assets |
|
|
24,054 |
|
|
|
22,403 |
|
|
Total assets |
|
$ |
150,720 |
|
|
$ |
153,017 |
|
|
Liabilities and Stockholders’ Equity |
|
|
|
|
|
|
|
|
|
Current liabilities: |
|
|
|
|
|
|
|
|
|
Accounts payable |
|
$ |
17,372 |
|
|
$ |
16,943 |
|
|
Accrued liabilities |
|
|
10,324 |
|
|
|
11,273 |
|
|
Lease liability current |
|
|
1,485 |
|
|
|
— |
|
|
Total current liabilities |
|
|
29,181 |
|
|
|
28,216 |
|
|
Non-current liabilities: |
|
|
|
|
|
|
|
|
|
Non-current deferred income tax liabilities |
|
|
161 |
|
|
|
212 |
|
|
Lease liability non-current |
|
|
1,941 |
|
|
|
— |
|
|
Other non-current liabilities |
|
|
777 |
|
|
|
832 |
|
|
Total non-current liabilities |
|
|
2,879 |
|
|
|
1,044 |
|
|
Total liabilities |
|
|
32,060 |
|
|
|
29,260 |
|
|
|
|
|
|
|
|
|
|
|
|
Commitments and Contingencies |
|
|
|
|
|
|
|
|
|
|
|
|
|
|
|
|
|
|
|
Stockholders’ equity |
|
|
|
|
|
|
|
|
|
Common stock, $0.05 par value; issued and outstanding 11,038 shares at May 30, 2020 and 10,957 shares at June 1, 2019 |
|
|
552 |
|
|
|
547 |
|
|
Class B common stock, convertible, $0.05 par value; issued and outstanding 2,097 shares at May 30, 2020 and 2,097 shares at June 1, 2019 |
|
|
105 |
|
|
|
105 |
|
|
Preferred stock, $1.00 par value, no shares issued |
|
|
— |
|
|
|
— |
|
|
Additional paid-in-capital |
|
|
61,749 |
|
|
|
61,012 |
|
|
Retained earnings |
|
|
54,764 |
|
|
|
59,703 |
|
|
Accumulated other comprehensive income |
|
|
1,490 |
|
|
|
2,390 |
|
|
Total stockholders’ equity |
|
|
118,660 |
|
|
|
123,757 |
|
|
Total liabilities and stockholders’ equity |
|
$ |
150,720 |
|
|
$ |
153,017 |
|
29
Richardson Electronics, Ltd.
Consolidated Statements of Comprehensive (Loss) Income
(in thousands, except per share amounts)
|
|
|
Fiscal Year Ended |
|
|||||||||
|
|
|
May 30, 2020 |
|
|
June 1, 2019 |
|
|
June 2, 2018 |
|
|||
|
Statements of Comprehensive (Loss) Income |
|
|
|
|
|
|
|
|
|
|
|
|
|
Net sales |
|
$ |
155,898 |
|
|
$ |
166,652 |
|
|
$ |
163,212 |
|
|
Cost of sales |
|
|
106,225 |
|
|
|
114,917 |
|
|
|
108,130 |
|
|
Gross profit |
|
|
49,673 |
|
|
|
51,735 |
|
|
|
55,082 |
|
|
Selling, general and administrative expenses |
|
|
51,327 |
|
|
|
52,156 |
|
|
|
51,729 |
|
|
Impairment of goodwill |
|
|
— |
|
|
|
6,332 |
|
|
|
— |
|
|
Loss (gain) on disposal of assets |
|
|
3 |
|
|
|
23 |
|
|
|
(276 |
) |
|
Operating (loss) income |
|
|
(1,657 |
) |
|
|
(6,776 |
) |
|
|
3,629 |
|
|
Other (income) expense: |
|
|
|
|
|
|
|
|
|
|
|
|
|
Investment/interest income |
|
|
(377 |
) |
|
|
(540 |
) |
|
|
(432 |
) |
|
Foreign exchange (gain) loss |
|
|
(15 |
) |
|
|
84 |
|
|
|
224 |
|
|
Other, net |
|
|
(51 |
) |
|
|
(9 |
) |
|
|
(23 |
) |
|
Total other (income) expense |
|
|
(443 |
) |
|
|
(465 |
) |
|
|
(231 |
) |
|
(Loss) income from continuing operations before income taxes |
|
|
(1,214 |
) |
|
|
(6,311 |
) |
|
|
3,860 |
|
|
Income tax provision |
|
|
624 |
|
|
|
1,017 |
|
|
|
1,534 |
|
|
(Loss) income from continuing operations |
|
|
(1,838 |
) |
|
|
(7,328 |
) |
|
|
2,326 |
|
|
Income from discontinued operations |
|
|
— |
|
|
|
— |
|
|
|
1,496 |
|
|
Net (loss) income |
|
|
(1,838 |
) |
|
|
(7,328 |
) |
|
|
3,822 |
|
|
Foreign currency translation (loss) gain, net of tax |
|
|
(900 |
) |
|
|
(1,976 |
) |
|
|
1,580 |
|
|
Fair value adjustments on investments (loss) gain |
|
|
— |
|
|
|
— |
|
|
|
(130 |
) |
|
Comprehensive (loss) income |
|
$ |
(2,738 |
) |
|
$ |
(9,304 |
) |
|
$ |
5,272 |
|
|
Net (loss) income per Common share - Basic: |
|
|
|
|
|
|
|
|
|
|
|
|
|
(Loss) income from continuing operations |
|
$ |
(0.14 |
) |
|
$ |
(0.57 |
) |
|
$ |
0.18 |
|
|
Income from discontinued operations |
|
|
— |
|
|
|
— |
|
|
|
0.12 |
|
|
Total net (loss) income per Common share - Basic |
|
$ |
(0.14 |
) |
|
$ |
(0.57 |
) |
|
$ |
0.30 |
|
|
Net (loss) income per Class B common share - Basic: |
|
|
|
|
|
|
|
|
|
|
|
|
|
(Loss) income from continuing operations |
|
$ |
(0.13 |
) |
|
$ |
(0.51 |
) |
|
$ |
0.16 |
|
|
Income from discontinued operations |
|
|
— |
|
|
|
— |
|
|
|
0.11 |
|
|
Total net (loss) income per Class B common share - Basic |
|
$ |
(0.13 |
) |
|
$ |
(0.51 |
) |
|
$ |
0.27 |
|
|
Net (loss) income per Common share - Diluted: |
|
|
|
|
|
|
|
|
|
|
|
|
|
(Loss) income from continuing operations |
|
$ |
(0.14 |
) |
|
$ |
(0.57 |
) |
|
$ |
0.18 |
|
|
Income from discontinued operations |
|
|
— |
|
|
|
— |
|
|
|
0.12 |
|
|
Total net (loss) income per Common share - Diluted |
|
$ |
(0.14 |
) |
|
$ |
(0.57 |
) |
|
$ |
0.30 |
|
|
Net (loss) income per Class B common share - Diluted: |
|
|
|
|
|
|
|
|
|
|
|
|
|
(Loss) income from continuing operations |
|
$ |
(0.13 |
) |
|
$ |
(0.51 |
) |
|
$ |
0.16 |
|
|
Income from discontinued operations |
|
|
— |
|
|
|
— |
|
|
|
0.11 |
|
|
Total net (loss) income per Class B common share - Diluted |
|
$ |
(0.13 |
) |
|
$ |
(0.51 |
) |
|
$ |
0.27 |
|
|
Weighted average number of shares: |
|
|
|
|
|
|
|
|
|
|
|
|
|
Common shares - Basic |
|
|
11,026 |
|
|
|
10,923 |
|
|
|
10,765 |
|
|
Class B common shares - Basic |
|
|
2,097 |
|
|
|
2,106 |
|
|
|
2,137 |
|
|
Common shares - Diluted |
|
|
11,026 |
|
|
|
10,923 |
|
|
|
10,824 |
|
|
Class B common shares - Diluted |
|
|
2,097 |
|
|
|
2,106 |
|
|
|
2,137 |
|
|
Dividends per common share |
|
$ |
0.240 |
|
|
$ |
0.240 |
|
|
$ |
0.240 |
|
|
Dividends per Class B common share |
|
$ |
0.220 |
|
|
$ |
0.220 |
|
|
$ |
0.220 |
|
30
Richardson Electronics, Ltd.
Consolidated Statements of Cash Flows
(in thousands)
|
|
|
Fiscal Year Ended |
|
|||||||||
|
|
|
May 30, 2020 |
|
|
June 1, 2019 |
|
|
June 2, 2018 |
|
|||
|
Operating activities: |
|
|
|
|
|
|
|
|
|
|
|
|
|
Net (loss) income |
|
$ |
(1,838 |
) |
|
$ |
(7,328 |
) |
|
$ |
3,822 |
|
|
Adjustments to reconcile net (loss) income to cash (used in) provided by operating activities: |
|
|
|
|
|
|
|
|
|
|
|
|
|
Depreciation and amortization |
|
|
3,386 |
|
|
|
3,173 |
|
|
|
2,993 |
|
|
Inventory provisions |
|
|
1,013 |
|
|
|
1,076 |
|
|
|
773 |
|
|
Gain on sale of investments |
|
|
— |
|
|
|
— |
|
|
|
(183 |
) |
|
Loss (gain) on disposal of assets |
|
|
3 |
|
|
|
23 |
|
|
|
(276 |
) |
|
Share-based compensation expense |
|
|
683 |
|
|
|
697 |
|
|
|
533 |
|
|
Deferred income taxes |
|
|
(7 |
) |
|
|
315 |
|
|
|
319 |
|
|
Impairment of goodwill |
|
|
— |
|
|
|
6,332 |
|
|
|
— |
|
|
Change in assets and liabilities: |
|
|
|
|
|
|
|
|
|
|
|
|
|
Accounts receivable |
|
|
3,895 |
|
|
|
(2,030 |
) |
|
|
(1,764 |
) |
|
Inventories |
|
|
(5,452 |
) |
|
|
(4,242 |
) |
|
|
(8,247 |
) |
|
Prepaid expenses and other assets |
|
|
620 |
|
|
|
622 |
|
|
|
(627 |
) |
|
Accounts payable |
|
|
631 |
|
|
|
(2,424 |
) |
|
|
3,457 |
|
|
Accrued liabilities |
|
|
(889 |
) |
|
|
1,097 |
|
|
|
1,906 |
|
|
Other |
|
|
(122 |
) |
|
|
126 |
|
|
|
246 |
|
|
Net cash provided by (used in) operating activities |
|
|
1,923 |
|
|
|
(2,563 |
) |
|
|
2,952 |
|
|
Investing activities: |
|
|
|
|
|
|
|
|
|
|
|
|
|
Capital expenditures |
|
|
(1,776 |
) |
|
|
(3,874 |
) |
|
|
(5,239 |
) |
|
Proceeds from sale of assets |
|
|
— |
|
|
|
— |
|
|
|
374 |
|
|
Proceeds from maturity of investments |
|
|
21,000 |
|
|
|
9,800 |
|
|
|
12,315 |
|
|
Purchases of investments |
|
|
(29,000 |
) |
|
|
(17,800 |
) |
|
|
(3,943 |
) |
|
Proceeds from sales of available-for-sale securities |
|
|
— |
|
|
|
— |
|
|
|
913 |
|
|
Purchases of available-for-sale securities |
|
|
— |
|
|
|
— |
|
|
|
(265 |
) |
|
Other |
|
|
— |
|
|
|
— |
|
|
|
(3 |
) |
|
Net cash (used in) provided by investing activities |
|
|
(9,776 |
) |
|
|
(11,874 |
) |
|
|
4,152 |
|
|
Financing activities: |
|
|
|
|
|
|
|
|
|
|
|
|
|
Payment of financing lease principal |
|
|
(166 |
) |
|
|
— |
|
|
|
— |
|
|
Proceeds from issuance of common stock |
|
|
59 |
|
|
|
259 |
|
|
|
97 |
|
|
Cash dividends paid on Common and Class B Common shares |
|
|
(3,101 |
) |
|
|
(3,076 |
) |
|
|
(3,048 |
) |
|
Net cash used in financing activities |
|
|
(3,208 |
) |
|
|
(2,817 |
) |
|
|
(2,951 |
) |
|
Effect of exchange rate changes on cash and cash equivalents |
|
|
(423 |
) |
|
|
(1,192 |
) |
|
|
985 |
|
|
(Decrease) increase in cash and cash equivalents |
|
|
(11,484 |
) |
|
|
(18,446 |
) |
|
|
5,138 |
|
|
Cash and cash equivalents at beginning of period |
|
|
42,019 |
|
|
|
60,465 |
|
|
|
55,327 |
|
|
Cash and cash equivalents at end of period |
|
$ |
30,535 |
|
|
$ |
42,019 |
|
|
$ |
60,465 |
|
|
Supplemental Disclosure of Cash Flow Information: |
|
|
|
|
|
|
|
|
|
|
|
|
|
Cash paid during the fiscal year for: |
|
|
|
|
|
|
|
|
|
|
|
|
|
Income taxes |
|
|
1,018 |
|
|
|
290 |
|
|
|
474 |
|
31
Richardson Electronics, Ltd.
Consolidated Statements of Stockholders’ Equity
(in thousands, except per share amounts)
|
|
|
Common |
|
|
Class B Common |
|
|
Par Value |
|
|
Additional Paid In Capital |
|
|
Retained Earnings |
|
|
Accumulated Other Comprehensive Income |
|
|
Total |
|
|||||||
|
Balance May 27, 2017: |
|
|
10,712 |
|
|
|
2,137 |
|
|
$ |
642 |
|
|
$ |
59,436 |
|
|
$ |
69,333 |
|
|
$ |
2,916 |
|
|
$ |
132,327 |
|
|
Comprehensive income |
|
|
|
|
|
|
|
|
|
|
|
|
|
|
|
|
|
|
|
|
|
|
|
|
|
|
|
|
|
Net income |
|
|
— |
|
|
|
— |
|
|
|
— |
|
|
|
— |
|
|
|
3,822 |
|
|
|
— |
|
|
|
3,822 |
|
|
Foreign currency translation |
|
|
— |
|
|
|
— |
|
|
|
— |
|
|
|
— |
|
|
|
— |
|
|
|
1,580 |
|
|
|
1,580 |
|
|
Fair value adjustments on investments |
|
|
— |
|
|
|
— |
|
|
|
— |
|
|
|
— |
|
|
|
— |
|
|
|
(130 |
) |
|
|
(130 |
) |
|
Share-based compensation: |
|
|
|
|
|
|
|
|
|
|
|
|
|
|
|
|
|
|
|
|
|
|
|
|
|
|
|
|
|
Restricted stock |
|
|
— |
|
|
|
— |
|
|
|
— |
|
|
|
98 |
|
|
|
— |
|
|
|
— |
|
|
|
98 |
|
|
Stock options |
|
|
— |
|
|
|
— |
|
|
|
— |
|
|
|
435 |
|
|
|
— |
|
|
|
— |
|
|
|
435 |
|
|
Common stock: |
|
|
|
|
|
|
|
|
|
|
|
|
|
|
|
|
|
|
|
|
|
|
|
|
|
|
|
|
|
Options exercised |
|
|
16 |
|
|
|
— |
|
|
|
1 |
|
|
|
96 |
|
|
|
— |
|
|
|
— |
|
|
|
97 |
|
|
Restricted stock issuance |
|
|
78 |
|
|
|
— |
|
|
|
4 |
|
|
|
(4 |
) |
|
|
— |
|
|
|
— |
|
|
|
— |
|
|
Dividends paid to: |
|
|
|
|
|
|
|
|
|
|
|
|
|
|
|
|
|
|
|
|
|
|
|
|
|
|
|
|
|
Common ($0.24 per share) |
|
|
— |
|
|
|
— |
|
|
|
— |
|
|
|
— |
|
|
|
(2,586 |
) |
|
|
— |
|
|
|
(2,586 |
) |
|
Class B ($0.22 per share) |
|
|
— |
|
|
|
— |
|
|
|
— |
|
|
|
— |
|
|
|
(462 |
) |
|
|
— |
|
|
|
(462 |
) |
|
Balance June 2, 2018 |
|
|
10,806 |
|
|
|
2,137 |
|
|
$ |
647 |
|
|
$ |
60,061 |
|
|
$ |
70,107 |
|
|
$ |
4,366 |
|
|
$ |
135,181 |
|
|
Comprehensive loss |
|
|
|
|
|
|
|
|
|
|
|
|
|
|
|
|
|
|
|
|
|
|
|
|
|
|
|
|
|
Net loss |
|
|
— |
|
|
|
— |
|
|
|
— |
|
|
|
— |
|
|
|
(7,328 |
) |
|
|
— |
|
|
|
(7,328 |
) |
|
Foreign currency translation |
|
|
— |
|
|
|
— |
|
|
|
— |
|
|
|
— |
|
|
|
— |
|
|
|
(1,976 |
) |
|
|
(1,976 |
) |
|
Share-based compensation: |
|
|
|
|
|
|
|
|
|
|
|
|
|
|
|
|
|
|
|
|
|
|
|
|
|
|
|
|
|
Restricted stock |
|
|
— |
|
|
|
— |
|
|
|
— |
|
|
|
313 |
|
|
|
— |
|
|
|
— |
|
|
|
313 |
|
|
Stock options |
|
|
— |
|
|
|
— |
|
|
|
— |
|
|
|
384 |
|
|
|
— |
|
|
|
— |
|
|
|
384 |
|
|
Common stock: |
|
|
|
|
|
|
|
|
|
|
|
|
|
|
|
|
|
|
|
|
|
|
|
|
|
|
|
|
|
Options exercised |
|
|
46 |
|
|
|
— |
|
|
|
2 |
|
|
|
257 |
|
|
|
— |
|
|
|
— |
|
|
|
259 |
|
|
Restricted stock issuance |
|
|
65 |
|
|
|
— |
|
|
|
3 |
|
|
|
(3 |
) |
|
|
— |
|
|
|
— |
|
|
|
— |
|
|
Convert Class B to Common |
|
|
40 |
|
|
|
(40 |
) |
|
|
— |
|
|
|
— |
|
|
|
— |
|
|
|
— |
|
|
|
— |
|
|
Dividends paid to: |
|
|
|
|
|
|
|
|
|
|
|
|
|
|
|
|
|
|
|
|
|
|
|
|
|
|
|
|
|
Common ($0.24 per share) |
|
|
— |
|
|
|
— |
|
|
|
— |
|
|
|
— |
|
|
|
(2,621 |
) |
|
|
— |
|
|
|
(2,621 |
) |
|
Class B ($0.22 per share) |
|
|
— |
|
|
|
— |
|
|
|
— |
|
|
|
— |
|
|
|
(455 |
) |
|
|
— |
|
|
|
(455 |
) |
|
Balance June 1, 2019: |
|
|
10,957 |
|
|
|
2,097 |
|
|
$ |
652 |
|
|
$ |
61,012 |
|
|
$ |
59,703 |
|
|
$ |
2,390 |
|
|
$ |
123,757 |
|
|
Comprehensive loss |
|
|
|
|
|
|
|
|
|
|
|
|
|
|
|
|
|
|
|
|
|
|
|
|
|
|
|
|
|
Net loss |
|
|
— |
|
|
|
— |
|
|
|
— |
|
|
|
— |
|
|
|
(1,838 |
) |
|
|
— |
|
|
|
(1,838 |
) |
|
Foreign currency translation |
|
|
— |
|
|
|
— |
|
|
|
— |
|
|
|
— |
|
|
|
— |
|
|
|
(900 |
) |
|
|
(900 |
) |
|
Share-based compensation: |
|
|
|
|
|
|
|
|
|
|
|
|
|
|
|
|
|
|
|
|
|
|
|
|
|
|
|
|
|
Restricted stock |
|
|
— |
|
|
|
— |
|
|
|
— |
|
|
|
455 |
|
|
|
— |
|
|
|
— |
|
|
|
455 |
|
|
Stock options |
|
|
— |
|
|
|
— |
|
|
|
— |
|
|
|
228 |
|
|
|
— |
|
|
|
— |
|
|
|
228 |
|
|
Common stock: |
|
|
|
|
|
|
|
|
|
|
|
|
|
|
|
|
|
|
|
|
|
|
|
|
|
|
|
|
|
Options exercised |
|
|
10 |
|
|
|
— |
|
|
|
1 |
|
|
|
58 |
|
|
|
— |
|
|
|
— |
|
|
|
59 |
|
|
Restricted stock issuance |
|
|
71 |
|
|
|
— |
|
|
|
4 |
|
|
|
(4 |
) |
|
|
— |
|
|
|
— |
|
|
|
— |
|
|
Dividends paid to: |
|
|
|
|
|
|
|
|
|
|
|
|
|
|
|
|
|
|
|
|
|
|
|
|
|
|
|
|
|
Common ($0.24 per share) |
|
|
— |
|
|
|
— |
|
|
|
— |
|
|
|
— |
|
|
|
(2,648 |
) |
|
|
— |
|
|
|
(2,648 |
) |
|
Class B ($0.22 per share) |
|
|
— |
|
|
|
— |
|
|
|
— |
|
|
|
— |
|
|
|
(453 |
) |
|
|
— |
|
|
|
(453 |
) |
|
Balance May 30, 2020: |
|
|
11,038 |
|
|
|
2,097 |
|
|
$ |
657 |
|
|
$ |
61,749 |
|
|
$ |
54,764 |
|
|
$ |
1,490 |
|
|
$ |
118,660 |
|
32
Notes to Consolidated Financial Statements
|
1. |
DESCRIPTION OF THE COMPANY |
Richardson Electronics, Ltd. is a leading global provider of engineered solutions, power grid and microwave tubes and related consumables; power conversion and RF and microwave components; high value flat panel detector solutions, replacement parts, tubes and service training for diagnostic imaging equipment; and customized display solutions. We serve customers in the alternative energy, healthcare, aviation, broadcast, communications, industrial, marine, medical, military, scientific and semiconductor markets. The Company’s strategy is to provide specialized technical expertise and “engineered solutions” based on our core engineering and manufacturing capabilities. The Company provides solutions and adds value through design-in support, systems integration, prototype design and manufacturing, testing, logistics and aftermarket technical service and repair through its global infrastructure.
Our products include electron tubes and related components, microwave generators, subsystems used in semiconductor manufacturing and visual technology solutions. These products are used to control, switch or amplify electrical power signals, or are used as display devices in a variety of industrial, commercial, medical and communication applications.
We have three operating and reportable segments, which we define as follows:
Power and Microwave Technologies Group (“PMT”) combines our core engineered solutions capabilities, power grid and microwave tube business with new RF, Wireless and disruptive power technologies. As a manufacturer, technology partner and authorized distributor, PMT’s strategy is to provide specialized technical expertise and engineered solutions based on our core engineering and manufacturing capabilities on a global basis. We provide solutions and add value through design-in support, systems integration, prototype design and manufacturing, testing, logistics and aftermarket technical service and repair—all through our existing global infrastructure. PMT’s focus is on products for power, RF and microwave applications for customers in 5G, alternative energy, aviation, broadcast, communications, industrial, marine, medical, military, scientific and semiconductor markets. PMT focuses on various applications including broadcast transmission, CO2 laser cutting, diagnostic imaging, dielectric and induction heating, high energy transfer, high voltage switching, plasma, power conversion, radar and radiation oncology. PMT also offers its customers technical services for both microwave and industrial equipment.
Canvys provides customized display solutions serving the corporate enterprise, financial, healthcare, industrial and medical original equipment manufacturers markets. Our engineers design, manufacture, source and support a full spectrum of solutions to match the needs of our customers. We offer long term availability and proven custom display solutions that include touch screens, protective panels, custom enclosures, All-In-One computers, specialized cabinet finishes and application specific software packages and certification services. We partner with both private label manufacturing companies and leading branded hardware vendors to offer the highest quality display and touch solutions and customized computing platforms.
Healthcare manufactures, repairs, refurbishes and distributes high value replacement parts and equipment for the healthcare market including hospitals, medical centers, asset management companies, independent service organizations and multi-vendor service providers. Products include diagnostic imaging replacement parts for CT and MRI systems; replacement CT and MRI tubes; CT service training; MRI coils, cold heads and RF amplifiers; hydrogen thyratrons, klystrons, magnetrons; flat panel detector upgrades; pre-owned CT systems; and additional replacement solutions currently under development for the diagnostic imaging service market. Through a combination of newly developed products and partnerships, service offerings and training programs, we believe we can help our customers improve efficiency and deliver better clinical outcomes while lowering the cost of healthcare delivery.
We currently have operations in the following major geographic regions: North America, Asia/Pacific, Europe and Latin America.
Customer Concentration: No one customer represented more than 10 percent of our total accounts receivable balance as of May 30, 2020 or June 1, 2019. No one customer accounted for more than 10 percent of the Company’s consolidated net sales in either fiscal 2020 or fiscal 2019. LAM Research Corporation individually accounted for 11 percent of the Company’s consolidated net sales in fiscal 2018.
Supplier Concentration: One of our suppliers represented 16 percent of our total cost of sales in fiscal 2020 and 11 percent in fiscal 2019. The amount owed to this supplier was approximately $1.3 million as of May 30, 2020 and $2.2 million as of June 1, 2019.
33
|
2. |
BASIS OF PRESENTATION |
The accompanying consolidated financial statements have been prepared in accordance with U.S. GAAP for all fiscal years presented.
The consolidated financial statements include our wholly owned subsidiaries. All intercompany transactions and account balances have been eliminated in consolidation.
Our fiscal year 2020 began on June 2, 2019 and ended on May 30, 2020, our fiscal year 2019 began on June 3, 2018 and ended on June 1, 2019 and our fiscal year 2018 began on May 28, 2017 and ended on June 2, 2018. Unless otherwise noted, all references to a particular year in this document shall mean our fiscal year.
|
3. |
SIGNIFICANT ACCOUNTING POLICIES AND DISCLOSURES |
Use of Estimates: The preparation of financial statements in conformity with GAAP requires management to make significant estimates and assumptions that affect the reported amounts of assets and liabilities and disclosure of contingent assets and liabilities at the date of the financial statements and the reported amounts of revenues and expenses during the reporting period. Management continuously evaluates its critical accounting policies and estimates, including the allowance for doubtful accounts, revenue recognition, inventory obsolescence, intangible assets, loss contingencies and income taxes. Management bases the estimates on historical experience and on various other assumptions believed to be reasonable under the circumstances, however, actual results could differ from those estimates.
Fair Values of Financial Instruments: The fair values of financial instruments are determined based on quoted market prices and market interest rates as of the end of the reporting period. Our financial instruments include investments, accounts receivable, accounts payable and accrued liabilities. The fair values of these financial instruments approximate carrying values at May 30, 2020 and June 1, 2019.
Cash and Cash Equivalents: We consider short-term, highly liquid investments that are readily convertible to known amounts of cash, and so near their maturity that they present insignificant risk of changes in value because of changes in interest rates, and that have a maturity of three months or less, when purchased, to be cash equivalents. The carrying amounts reported in the balance sheet for cash and cash equivalents approximate the fair market value of these assets.
Allowance for Doubtful Accounts: Our allowance for doubtful accounts includes estimated losses that result from uncollectible receivables. The estimates are influenced by the following: continuing credit evaluation of customers’ financial conditions; aging of receivables, individually and in the aggregate; a large number of customers which are widely dispersed across geographic areas; and collectability and delinquency history by geographic area. Significant changes in one or more of these considerations may require adjustments affecting net income and net carrying value of accounts receivable. The allowance for doubtful accounts was approximately $0.3 million as of both May 30, 2020 and June 1, 2019.
Loss Contingencies: We accrue a liability for loss contingencies when it is probable that a liability has been incurred and the amount can be reasonably estimated. When only a range of possible loss can be established, the most probable amount in the range is accrued. If no amount within this range is a better estimate than any other amount within the range, the minimum amount in the range is accrued. If we determine that there is at least a reasonable possibility that a loss may have been incurred, we will include a disclosure describing the contingency.
Revenue Recognition: Revenue is recognized when control of the promised goods is transferred to our customers, which is simultaneous with the title transferring to the customer, in an amount that reflects the transaction price consideration that we expect to receive in exchange for those goods. Control refers to the ability of the customer to direct the use of, and obtain substantially all of, the remaining benefits from the goods. Our transaction price consideration is fixed, unless otherwise disclosed below as variable consideration. Generally, our contracts require our customers to pay for goods after we deliver products to them. Terms are generally on open account, payable net 30 days in North America, and vary throughout Asia/Pacific, Europe and Latin America subject to customary credit checks.
The Company also sells products that are manufactured or assembled in our manufacturing facility. These products can either be built to the customer’s prints/designs or are products that we stock in our warehouse to sell to any customer that places an order. The manufacturing business does not include a separate service bundled with the product sold or sold in addition to the product.
The Company recognizes services revenue when the repair, installation or training is performed. Based on our analysis of services revenue, ASU 2014-09 has an immaterial impact on the timing, amount or characterization of services revenue recognized by the Company. The services we provide are relatively short in duration and typically completed in one to two weeks. Therefore, at each reporting date, the amount of unbilled work performed is insignificant. The services revenue has consistently accounted for less than 5% of the Company’s total revenues and is expected to continue at that level.
34
Prior to the adoption of ASU 2014-09, our product sales are recognized as revenue upon shipment, when title passes to the customer, when delivery has occurred or services have been rendered and when collectability is reasonably assured. We also record estimated discounts and returns based on our historical experience. Our products are often manufactured to meet the specific design needs of our customers’ applications. Our engineers work closely with customers to ensure that our products will meet their needs. Our customers are under no obligation to compensate us for designing the products we sell.
Foreign Currency Translation: The functional currency is the local currency at all foreign locations, with the exception of Hong Kong, which the functional currency is the U.S. dollar. Balance sheet items for our foreign entities, included in our consolidated balance sheets, are translated into U.S. dollars at end-of-period spot rates. Gains and losses resulting from translation of foreign subsidiary financial statements are credited or charged directly to accumulated other comprehensive income, a component of stockholders’ equity. Revenues and expenses are translated at the current rate on the date of the transaction. Gains and losses resulting from foreign currency transactions are included in income. Foreign exchange (gain) loss reflected in our consolidated statements of comprehensive (loss) income were less than $0.1 million during fiscal 2020 and fiscal 2019 and a loss of $0.2 million during fiscal 2018.
Shipping and Handling Fees and Costs: Shipping and handling costs billed to customers are reported as revenue and the related costs are reported as a component of cost of sales.
Inventories, net: Our consolidated inventories are stated at the lower of cost and net realizable value, generally using a weighted-average cost method. Our net inventories include approximately $51.8 million of finished goods, $3.6 million of raw materials and $2.1 million of work-in-progress as of May 30, 2020 as compared to approximately $47.2 million of finished goods, $4.2 million of raw materials and $1.8 million of work-in-progress as of June 1, 2019. The inventory reserve as of May 30, 2020 was $5.4 million compared to $4.6 million as of June 1, 2019.
Provisions for obsolete or slow moving inventories are recorded based upon regular analysis of stock rotation privileges, obsolescence, the exiting of certain markets and assumptions about future demand and market conditions. If future demand changes in the industry or market conditions differ from management’s estimates, additional provisions may be necessary.
We recorded provisions to our inventory reserves of $1.0 million, $1.1 million and $0.8 million during fiscal 2020, fiscal 2019 and fiscal 2018, respectively, which were included in cost of sales. The provisions were primarily for obsolete and slow moving parts. The parts were written down to estimated realizable value.
Income Taxes: We recognize deferred tax assets and liabilities based on the differences between financial statement carrying amounts and the tax bases of assets and liabilities. We regularly review our deferred tax assets for recoverability and determine the need for a valuation allowance based on a number of factors, including both positive and negative evidence. These factors include historical taxable income or loss, projected future taxable income or loss, the expected timing of the reversals of existing temporary differences, and the implementation of tax planning strategies. In circumstances where we, or any of our affiliates, have incurred three years of cumulative losses which constitute significant negative evidence, positive evidence of equal or greater significance is needed to overcome the negative evidence before a tax benefit is recognized for deductible temporary differences and loss carryforwards.
Investments: We invested in time deposits and certificates of deposit (“CDs”) in the amount of $16.0 million and $8.0 million as of May 30, 2020 and June 1, 2019, respectively, which mature in less than twelve months.
We liquidated our investments in equity securities in fiscal 2018. Proceeds from the liquidation were $0.9 million with gross realized gains of $0.2 million for fiscal 2018. Prior to the liquidation of our investment in equity securities, our investments in equity securities were classified as available-for-sale and were carried at their fair value based on quoted market prices.
Intangible Assets: Intangible assets are initially recorded at their fair market values determined by quoted market prices in active markets, if available, or recognized valuation models. Intangible assets that have finite useful lives are amortized over their useful lives either on a straight-line basis or over their projected future cash flows and are tested for impairment when events or changes in circumstances occur that indicate possible impairment. Our intangible assets represent the fair value for trade name, customer relationships, non-compete agreements and technology acquired in connection with the acquisitions.
Property, Plant and Equipment: Property, plant and equipment are stated at cost, net of accumulated depreciation. Improvements and replacements are capitalized while expenditures for maintenance and repairs are charged to expense as incurred. Provisions for depreciation are computed using the straight-line method over the estimated useful life of the asset. Depreciation expense was approximately $3.1 million, $2.9 million and $2.6 million during fiscal 2020, fiscal 2019 and fiscal 2018, respectively.
35
Property, plant and equipment consist of the following (in thousands):
|
|
|
May 30, 2020 |
|
|
June 1, 2019 |
|
||
|
Land and improvements |
|
$ |
1,385 |
|
|
$ |
1,301 |
|
|
Buildings and improvements |
|
|
22,525 |
|
|
|
22,986 |
|
|
Computer, communications equipment and software |
|
|
10,775 |
|
|
|
9,943 |
|
|
Construction in progress |
|
|
750 |
|
|
|
979 |
|
|
Machinery and other equipment |
|
|
14,326 |
|
|
|
13,884 |
|
|
|
|
$ |
49,761 |
|
|
$ |
49,093 |
|
|
Accumulated depreciation |
|
|
(32,087 |
) |
|
|
(29,982 |
) |
|
Property, plant, and equipment, net |
|
$ |
17,674 |
|
|
$ |
19,111 |
|
Construction in progress at May 30, 2020 includes $0.2 million related to our Healthcare growth initiatives. All projects are expected to be completed before the end of fiscal 2021.
Supplemental disclosure information of the estimated useful life of the assets:
|
Land improvements |
|
10 years |
|
Buildings and improvements |
|
10 - 30 years |
|
Computer, communications equipment and software |
|
3 - 10 years |
|
Machinery and other equipment |
|
3 - 20 years |
We review property and equipment, definite-lived intangible assets and other long-lived assets for impairment whenever adverse events or changes in circumstances indicate that the carrying amounts of such assets may not be recoverable.
If adverse events do occur, our impairment review is based on an undiscounted cash flow analysis at the lowest level at which cash flows of the long-lived assets are largely independent of other groups of our assets and liabilities. This analysis requires management judgment with respect to changes in technology, the continued success of product lines and future volume, revenue and expense growth rates. We conduct annual reviews for idle and underutilized equipment and review business plans for possible impairment. Impairment occurs when the carrying value of the assets exceeds the future undiscounted cash flows expected to be earned by the use of the asset or asset group. When impairment is indicated, the estimated future cash flows are then discounted to determine the estimated fair value of the asset or asset group and an impairment charge is recorded for the difference between the carrying value and the estimated fair value.
Additionally, we also evaluate the remaining useful life of each reporting period to determine whether events and circumstances warrant a revision to the remaining period of depreciation or amortization. If the estimate of a long lived asset’s remaining useful life is changed, the remaining carrying amount of the asset is amortized prospectively over that revised remaining useful life.
Accrued Liabilities: Accrued liabilities consist of the following (in thousands):
|
|
|
May 30, 2020 |
|
|
June 1, 2019 |
|
||
|
Compensation and payroll taxes |
|
$ |
3,469 |
|
|
$ |
2,846 |
|
|
Accrued severance |
|
|
650 |
|
|
|
520 |
|
|
Professional fees |
|
|
471 |
|
|
|
471 |
|
|
Deferred revenue |
|
|
1,671 |
|
|
|
2,260 |
|
|
Other accrued expenses |
|
|
4,063 |
|
|
|
5,176 |
|
|
Accrued Liabilities |
|
$ |
10,324 |
|
|
$ |
11,273 |
|
Warranties: We offer warranties for the limited number of specific products we manufacture. Our warranty terms generally range from one to three years.
We estimate the cost to perform under the warranty obligation and recognize this estimated cost at the time of the related product sale. We record expense related to our warranty obligations as cost of sales in our consolidated statements of comprehensive (loss) income. Each quarter, we assess actual warranty costs incurred on a product-by-product basis and compare the warranty costs to our estimated warranty obligation. With respect to new products, estimates are based generally on knowledge of the products and warranty experience.
36
Warranty reserves are established for costs that are expected to be incurred after the sale and delivery of products under warranty. Warranty reserves are included in accrued liabilities on our consolidated balance sheets. The warranty reserves are determined based on known product failures, historical experience and other available evidence.
Changes in the warranty reserve during fiscal 2020 and fiscal 2019 were as follows (in thousands):
|
|
|
Warranty Reserve |
|
|
|
Balance at June 2, 2018 |
|
$ |
149 |
|
|
Accruals for products sold |
|
|
185 |
|
|
Utilization |
|
|
(39 |
) |
|
Balance at June 1, 2019 |
|
$ |
295 |
|
|
Accruals for products sold |
|
|
201 |
|
|
Utilization |
|
|
(30 |
) |
|
Balance at May 30, 2020 |
|
$ |
466 |
|
Other Non-Current Liabilities: Other non-current liabilities of $0.8 million at May 30, 2020 and $0.8 million at June 1, 2019, primarily represent employee-benefits obligations in various non-US locations.
37
Share-Based Compensation: We measure and recognize share-based compensation cost at fair value for all share-based payments, including stock options and restricted stock awards. We estimate fair value using the Black-Scholes option-pricing model, which requires assumptions such as expected volatility, risk-free interest rate, expected life and dividends. Compensation cost is recognized using a graded vesting schedule over the applicable vesting period. Share-based compensation expense totaled approximately $0.7 million during fiscal 2020, $0.7 million during fiscal 2019 and $0.5 million during fiscal 2018.
Stock options granted generally vest over a period of five years and have contractual terms to exercise of 10 years. A summary of stock option activity is as follows (in thousands, except option prices and years):
|
|
|
Number of Options |
|
|
Weighted Average Exercise Price |
|
|
Weighted Average Remaining Contractual Life |
|
|
Aggregate Intrinsic Value (1) |
|
||||
|
Options Outstanding at May 27, 2017 |
|
|
1,073 |
|
|
$ |
9.38 |
|
|
|
|
|
|
|
|
|
|
Granted |
|
|
200 |
|
|
|
6.08 |
|
|
|
|
|
|
|
|
|
|
Exercised |
|
|
(16 |
) |
|
|
5.85 |
|
|
|
|
|
|
|
|
|
|
Forfeited |
|
|
(11 |
) |
|
|
8.05 |
|
|
|
|
|
|
|
|
|
|
Cancelled |
|
|
(51 |
) |
|
|
9.36 |
|
|
|
|
|
|
|
|
|
|
Options Outstanding at June 2, 2018 |
|
|
1,195 |
|
|
$ |
8.89 |
|
|
|
|
|
|
|
|
|
|
Granted |
|
|
279 |
|
|
|
9.02 |
|
|
|
|
|
|
|
|
|
|
Exercised |
|
|
(46 |
) |
|
|
5.61 |
|
|
|
|
|
|
|
|
|
|
Forfeited |
|
|
(58 |
) |
|
|
8.10 |
|
|
|
|
|
|
|
|
|
|
Cancelled |
|
|
(6 |
) |
|
|
5.03 |
|
|
|
|
|
|
|
|
|
|
Options Outstanding at June 1, 2019 |
|
|
1,364 |
|
|
$ |
9.08 |
|
|
|
|
|
|
|
|
|
|
Granted |
|
|
187 |
|
|
|
5.61 |
|
|
|
|
|
|
|
|
|
|
Exercised |
|
|
(10 |
) |
|
|
5.67 |
|
|
|
|
|
|
|
|
|
|
Cancelled |
|
|
(114 |
) |
|
|
6.87 |
|
|
|
|
|
|
|
|
|
|
Options Outstanding at May 30, 2020 |
|
|
1,427 |
|
|
$ |
8.83 |
|
|
|
5.6 |
|
|
$ |
— |
|
|
Options Vested at May 30, 2020 |
|
|
931 |
|
|
$ |
9.78 |
|
|
|
4.3 |
|
|
$ |
— |
|
|
(1) |
Includes only those options that were in-the-money as of May 30, 2020. Stock options for which the exercise price exceeded the market price have been omitted. Fluctuations in the intrinsic value of both outstanding and exercisable options may result from changes in underlying stock price and timing and volume of option grants, exercises and forfeitures. |
There were 10,249 stock options exercised during fiscal 2020, with cash received of $0.1 million. The total intrinsic value of options exercised totaled less than $0.1 million during fiscal 2020, fiscal 2019 and fiscal 2018. The weighted average fair value of stock option grants was $0.81 during fiscal 2020, $1.71 during fiscal 2019 and $0.85 during fiscal 2018. As of May 30, 2020, total unrecognized compensation costs related to unvested stock options and restricted stock awards was approximately $1.1 million, which is expected to be recognized over the remaining weighted average period of approximately two to four years. The total grant date fair value of stock options vested during fiscal 2020 was $0.3 million.
The fair value of stock options is estimated using the Black-Scholes option-pricing model with the following weighted average assumptions:
|
|
|
Fiscal Year Ended |
|
|||||||||
|
|
|
May 30, 2020 |
|
|
June 1, 2019 |
|
|
June 2, 2018 |
|
|||
|
Expected volatility |
|
|
24.48 |
% |
|
|
22.24 |
% |
|
|
21.92 |
% |
|
Risk-free interest rate |
|
|
1.91 |
% |
|
|
2.82 |
% |
|
|
2.22 |
% |
|
Expected lives (years) |
|
|
6.50 |
|
|
|
6.36 |
|
|
|
6.31 |
|
|
Annual cash dividend |
|
$ |
0.24 |
|
|
$ |
0.24 |
|
|
$ |
0.24 |
|
The expected volatility assumptions are based on historical experience commensurate with the expected term. The risk-free interest rate is based on the yield of a treasury note with a remaining term equal to the expected life of the stock option.
38
The expected stock option life assumption is based on the Securities and Exchange Commission’s (“SEC”) guidance in Staff Accounting Bulletin (“SAB”) No. 107 (“SAB No. 107”). For stock options granted during fiscal 2020, fiscal 2019 and fiscal 2018, we believe that our historical stock option experience does not provide a reasonable basis upon which to estimate expected term. We utilized the Safe Harbor option, or Simplified Method, to determine the expected term of these options in accordance with SAB No. 107 for options granted. We intend to continue to utilize the Simplified Method for future grants in accordance with SAB No. 110 until such time that we believe that our historical stock option experience will provide a reasonable basis to estimate an expected term.
The following table summarizes information about stock options outstanding at May 30, 2020 (in thousands, except option prices and years):
|
|
|
Outstanding |
|
|
Vested |
|
||||||||||||||||||||||||||
|
Exercise Price Range |
|
Shares |
|
|
Weighted Average Exercise Price |
|
|
Weighted Average Life |
|
|
Aggregate Intrinsic Value |
|
|
Shares |
|
|
Weighted Average Exercise Price |
|
|
Weighted Average Life |
|
|
Aggregate Intrinsic Value |
|
||||||||
|
$5.49 to $6.47 |
|
|
430 |
|
|
$ |
5.76 |
|
|
|
7.7 |
|
|
$ |
— |
|
|
|
169 |
|
|
$ |
5.82 |
|
|
|
6.8 |
|
|
$ |
— |
|
|
$6.90 to $9.89 |
|
|
490 |
|
|
$ |
8.49 |
|
|
|
7.1 |
|
|
$ |
— |
|
|
|
254 |
|
|
$ |
8.49 |
|
|
|
6.4 |
|
|
$ |
— |
|
|
$9.99 to $13.76 |
|
|
507 |
|
|
$ |
11.75 |
|
|
|
2.4 |
|
|
$ |
— |
|
|
|
508 |
|
|
$ |
11.75 |
|
|
|
2.4 |
|
|
$ |
— |
|
|
Total |
|
|
1,427 |
|
|
$ |
8.83 |
|
|
|
5.6 |
|
|
$ |
— |
|
|
|
931 |
|
|
$ |
9.78 |
|
|
|
4.3 |
|
|
$ |
— |
|
As of May 30, 2020, a summary of restricted stock award transactions was as follows (in thousands):
|
|
|
Unvested Restricted Shares |
|
|
|
Unvested at June 2, 2018 |
|
|
78 |
|
|
Granted |
|
|
69 |
|
|
Vested |
|
|
(26 |
) |
|
Canceled |
|
|
(5 |
) |
|
Unvested at June 1, 2019 |
|
|
116 |
|
|
Granted |
|
|
73 |
|
|
Vested |
|
|
(47 |
) |
|
Unvested at May 30, 2020 |
|
|
142 |
|
Compensation effects arising from issuing stock awards have been charged against income and recorded as additional paid-in-capital in the consolidated statements of stockholders’ equity during fiscal 2020, fiscal 2019 and fiscal 2018.
The Employees’ 2011 Long-Term Incentive Compensation Plan authorizes the issuance of up to 2,500,000 shares as incentive stock options, non-qualified stock options or stock awards. Under this plan, 885,000 shares are reserved for future issuance. The Plan authorizes the granting of stock options at the fair market value at the date of grant. Generally, these options become exercisable over five years and expire up to 10 years from the date of grant. Restricted stock awards vest on the anniversary of the grant date in three equal installments.
Earnings per Share: We have authorized 17,000,000 shares of common stock, and 3,000,000 shares of Class B common stock. The Class B common stock has 10 votes per share and has transferability restrictions; however, Class B common stock may be converted into common stock on a share-for-share basis at any time. With respect to dividends and distributions, shares of common stock and Class B common stock rank equally and have the same rights, except that Class B common stock cash dividends are limited to 90% of the amount of Class A common stock cash dividends.
In accordance with ASC 260-10, Earnings Per Share (“ASC 260”), our Class B common stock is considered a participating security requiring the use of the two-class method for the computation of basic and diluted earnings per share. The two-class computation method for each period reflects the cash dividends paid per share for each class of stock, plus the amount of allocated undistributed earnings per share computed using the participation percentage which reflects the dividend rights of each class of stock. Basic and diluted earnings per share were computed using the two-class method as prescribed in ASC 260. The shares of Class B common stock are considered to be participating convertible securities since the shares of Class B common stock are convertible on a share-for-share basis into shares of common stock and may participate in dividends with common stock according to a predetermined formula which is 90% of the amount of Class A common stock cash dividends.
39
The earnings per share (“EPS”) presented in our consolidated statements of comprehensive (loss) income are based on the following (in thousands, except per share amounts):
|
|
|
For the Fiscal Year Ended |
|
|||||||||||||||||||||
|
|
|
May 30, 2020 |
|
|
June 1, 2019 |
|
|
June 2, 2018 |
|
|||||||||||||||
|
|
|
Basic |
|
|
Diluted |
|
|
Basic |
|
|
Diluted |
|
|
Basic |
|
|
Diluted |
|
||||||
|
Numerator for Basic and Diluted EPS: |
|
|
|
|
|
|
|
|
|
|
|
|
|
|
|
|
|
|
|
|
|
|
|
|
|
(Loss) income from continuing operations |
|
$ |
(1,838 |
) |
|
$ |
(1,838 |
) |
|
$ |
(7,328 |
) |
|
$ |
(7,328 |
) |
|
$ |
2,326 |
|
|
$ |
2,326 |
|
|
Less dividends: |
|
|
|
|
|
|
|
|
|
|
|
|
|
|
|
|
|
|
|
|
|
|
|
|
|
Common stock |
|
|
2,648 |
|
|
|
2,648 |
|
|
|
2,621 |
|
|
|
2,621 |
|
|
|
2,586 |
|
|
|
2,586 |
|
|
Class B common stock |
|
|
453 |
|
|
|
453 |
|
|
|
455 |
|
|
|
455 |
|
|
|
462 |
|
|
|
462 |
|
|
Undistributed losses |
|
$ |
(4,939 |
) |
|
$ |
(4,939 |
) |
|
$ |
(10,404 |
) |
|
$ |
(10,404 |
) |
|
$ |
(722 |
) |
|
$ |
(722 |
) |
|
Common stock undistributed losses |
|
$ |
(4,217 |
) |
|
$ |
(4,217 |
) |
|
$ |
(8,866 |
) |
|
$ |
(8,866 |
) |
|
$ |
(613 |
) |
|
$ |
(613 |
) |
|
Class B common stock undistributed losses |
|
|
(722 |
) |
|
|
(722 |
) |
|
|
(1,538 |
) |
|
|
(1,538 |
) |
|
|
(109 |
) |
|
|
(109 |
) |
|
Total undistributed losses |
|
$ |
(4,939 |
) |
|
$ |
(4,939 |
) |
|
$ |
(10,404 |
) |
|
$ |
(10,404 |
) |
|
$ |
(722 |
) |
|
$ |
(722 |
) |
|
Income from discontinued operations |
|
$ |
— |
|
|
$ |
— |
|
|
$ |
— |
|
|
$ |
— |
|
|
$ |
1,496 |
|
|
$ |
1,496 |
|
|
Less dividends: |
|
|
|
|
|
|
|
|
|
|
|
|
|
|
|
|
|
|
|
|
|
|
|
|
|
Common stock |
|
|
2,648 |
|
|
|
2,648 |
|
|
|
2,621 |
|
|
|
2,621 |
|
|
|
2,586 |
|
|
|
2,586 |
|
|
Class B common stock |
|
|
453 |
|
|
|
453 |
|
|
|
455 |
|
|
|
455 |
|
|
|
462 |
|
|
|
462 |
|
|
Undistributed losses |
|
$ |
(3,101 |
) |
|
$ |
(3,101 |
) |
|
$ |
(3,076 |
) |
|
$ |
(3,076 |
) |
|
$ |
(1,552 |
) |
|
$ |
(1,552 |
) |
|
Common stock undistributed losses |
|
$ |
(2,648 |
) |
|
$ |
(2,648 |
) |
|
$ |
(2,621 |
) |
|
$ |
(2,621 |
) |
|
$ |
(1,317 |
) |
|
$ |
(1,318 |
) |
|
Class B common stock undistributed losses |
|
|
(453 |
) |
|
|
(453 |
) |
|
|
(455 |
) |
|
|
(455 |
) |
|
|
(235 |
) |
|
|
(234 |
) |
|
Total undistributed losses |
|
$ |
(3,101 |
) |
|
$ |
(3,101 |
) |
|
$ |
(3,076 |
) |
|
$ |
(3,076 |
) |
|
$ |
(1,552 |
) |
|
$ |
(1,552 |
) |
|
Net (loss) income |
|
$ |
(1,838 |
) |
|
$ |
(1,838 |
) |
|
$ |
(7,328 |
) |
|
$ |
(7,328 |
) |
|
$ |
3,822 |
|
|
$ |
3,822 |
|
|
Less dividends: |
|
|
|
|
|
|
|
|
|
|
|
|
|
|
|
|
|
|
|
|
|
|
|
|
|
Common stock |
|
|
2,648 |
|
|
|
2,648 |
|
|
|
2,621 |
|
|
|
2,621 |
|
|
|
2,586 |
|
|
|
2,586 |
|
|
Class B common stock |
|
|
453 |
|
|
|
453 |
|
|
|
455 |
|
|
|
455 |
|
|
|
462 |
|
|
|
462 |
|
|
Undistributed (losses) income |
|
$ |
(4,939 |
) |
|
$ |
(4,939 |
) |
|
$ |
(10,404 |
) |
|
$ |
(10,404 |
) |
|
$ |
774 |
|
|
$ |
774 |
|
|
Common stock undistributed (losses) income |
|
$ |
(4,217 |
) |
|
$ |
(4,217 |
) |
|
$ |
(8,866 |
) |
|
$ |
(8,866 |
) |
|
$ |
657 |
|
|
$ |
657 |
|
|
Class B common stock undistributed (losses) income |
|
|
(722 |
) |
|
|
(722 |
) |
|
|
(1,538 |
) |
|
|
(1,538 |
) |
|
|
117 |
|
|
|
117 |
|
|
Total undistributed (losses) income |
|
$ |
(4,939 |
) |
|
$ |
(4,939 |
) |
|
$ |
(10,404 |
) |
|
$ |
(10,404 |
) |
|
$ |
774 |
|
|
$ |
774 |
|
|
Denominator for Basic and Diluted EPS: |
|
|
|
|
|
|
|
|
|
|
|
|
|
|
|
|
|
|
|
|
|
|
|
|
|
Common stock weighted average shares |
|
|
11,026 |
|
|
|
11,026 |
|
|
|
10,923 |
|
|
|
10,923 |
|
|
|
10,765 |
|
|
|
10,765 |
|
|
Class B common stock weighted average shares, and shares under if-converted method for diluted EPS |
|
|
2,097 |
|
|
|
2,097 |
|
|
|
2,106 |
|
|
|
2,106 |
|
|
|
2,137 |
|
|
|
2,137 |
|
|
Effect of dilutive securities |
|
|
|
|
|
|
|
|
|
|
|
|
|
|
|
|
|
|
|
|
|
|
|
|
|
Dilutive stock options |
|
|
|
|
|
|
— |
|
|
|
|
|
|
|
— |
|
|
|
|
|
|
|
59 |
|
|
Denominator for diluted EPS adjusted for weighted average shares and assumed conversions |
|
|
|
|
|
|
13,123 |
|
|
|
|
|
|
|
13,029 |
|
|
|
|
|
|
|
12,961 |
|
|
(Loss) income from continuing operations per share: |
|
|
|
|
|
|
|
|
|
|
|
|
|
|
|
|
|
|
|
|
|
|
|
|
|
Common stock |
|
$ |
(0.14 |
) |
|
$ |
(0.14 |
) |
|
$ |
(0.57 |
) |
|
$ |
(0.57 |
) |
|
$ |
0.18 |
|
|
$ |
0.18 |
|
|
Class B common stock |
|
$ |
(0.13 |
) |
|
$ |
(0.13 |
) |
|
$ |
(0.51 |
) |
|
$ |
(0.51 |
) |
|
$ |
0.16 |
|
|
$ |
0.16 |
|
|
Income from discontinued operations per share: |
|
|
|
|
|
|
|
|
|
|
|
|
|
|
|
|
|
|
|
|
|
|
|
|
|
Common stock |
|
$ |
— |
|
|
$ |
— |
|
|
$ |
— |
|
|
$ |
— |
|
|
$ |
0.12 |
|
|
$ |
0.12 |
|
|
Class B common stock |
|
$ |
— |
|
|
$ |
— |
|
|
$ |
— |
|
|
$ |
— |
|
|
$ |
0.11 |
|
|
$ |
0.11 |
|
|
Net (loss) income per share: |
|
|
|
|
|
|
|
|
|
|
|
|
|
|
|
|
|
|
|
|
|
|
|
|
|
Common stock |
|
$ |
(0.14 |
) |
|
$ |
(0.14 |
) |
|
$ |
(0.57 |
) |
|
$ |
(0.57 |
) |
|
$ |
0.30 |
|
|
$ |
0.30 |
|
|
Class B common stock |
|
$ |
(0.13 |
) |
|
$ |
(0.13 |
) |
|
$ |
(0.51 |
) |
|
$ |
(0.51 |
) |
|
$ |
0.27 |
|
|
$ |
0.27 |
|
|
Note: |
Common stock options that were anti-dilutive and not included in diluted earnings per common share for fiscal 2020, fiscal 2019 and fiscal 2018 were 1,120, 882 and 0, respectively. |
40
New Accounting Pronouncements
In May 2014, the FASB issued ASU No. 2014-09 (“ASU 2014-09”), Revenue from Contracts with Customers, which amends guidance for revenue recognition. ASU 2014-09 is principles based guidance that can be applied to all contracts with customers, enhancing comparability of revenue recognition practices across entities, industries, jurisdictions and capital markets. The core principle of the guidance is that entities should recognize revenue to depict the transfer of promised goods or services to customers in an amount that reflects the consideration to which the entity expects to be entitled in exchange for those goods and services. The guidance details the steps entities should apply to achieve the core principle. In August 2015, the FASB issued an amendment to defer the effective date for all entities by one year. For public entities, ASU 2014-09 is effective for annual reporting periods beginning after December 15, 2017, including interim periods within that reporting period. Early adoption is permitted as of annual reporting periods beginning after December 15, 2016. Companies have the option of using either a full or modified retrospective approach in applying this standard. During fiscal 2016, 2017, 2018 and 2019 the FASB issued additional updates that further clarify the guidance provided in ASU 2014-09.
Effective June 3, 2018, the Company adopted the standard using the modified retrospective method to all contracts. As a result, financial information for the reporting period beginning June 3, 2018 was reported under the new standard, while comparative financial information has not been adjusted and continues to be reported in accordance with the previous standard. The adoption of this standard did not impact the timing of revenue recognition for our customer sales. The adoption did not result in the recognition of a cumulative adjustment to beginning retained earnings, nor did it have a material impact on the consolidated financial statements. For the Company, the most significant impact of the new standard is the addition of required disclosures within the notes to the financial statements. See Note 4 “Revenue Recognition” of the notes to our consolidated financial statements.
In February 2016, the FASB issued ASU 2016-02 (“ASU 2016-02”), Leases (“Topic 842”). ASU 2016-02 establishes a right-of-use (“ROU”) model that requires a lessee to record an ROU asset and a lease liability on the balance sheet for all leases with terms longer than 12 months. Leases will be classified as either financing or operating, with classification affecting the pattern of expense recognition in the income statement. ASU 2016-02 is effective for fiscal years beginning after December 15, 2018, including interim periods within those fiscal years. The new standard was effective for the Company on June 2, 2019. See Note 8 “Lease Obligations and Other Commitments” of the notes to our consolidated financial statements.
In June 2016, the FASB issued ASU No. 2016-13, Financial Instruments—Credit Losses (Topic 326): Measurement of Credit Losses on Financial Instruments. ASU 2016-13 (as amended by ASU 2018-19, ASU 2019-04, ASU 2019-05, ASU 2019-10, ASU 2019-11 and 2020-02) introduces a new forward-looking approach, based on expected losses, to estimate credit losses on certain types of financial instruments, including trade receivables. The estimate of expected credit losses will require entities to incorporate considerations of historical information, current information and reasonable and supportable forecasts. This ASU also expands the disclosure requirements to enable users of financial statements to understand the entity’s assumptions, models and methods for estimating expected credit losses. The new standard is effective for smaller reporting companies for fiscal years, and interim periods within those fiscal years, beginning after December 15, 2022. Early adoption is permitted. The Company is currently in the process of evaluating the impact of adoption on its consolidated financial statements.
|
4. |
REVENUE RECOGNITION |
The Company has a number of defined revenue streams across our reportable segments. For each of these revenue streams, all products are typically sold directly by the Company to the end customer. Distribution is the Company’s largest revenue stream. The distribution business does not include a separate service bundled with the product sold or sold on top of the product. Distribution typically includes products purchased from our suppliers, stocked in our warehouses and then sold to our customers. Revenue is recognized when control of the promised goods is transferred to our customers, which is simultaneous with the title transferring to the customer, in an amount that reflects the transaction price consideration that we expect to receive in exchange for those goods. Control refers to the ability of the customer to direct the use of, and obtain substantially all of, the remaining benefits from the goods. Our transaction price consideration is fixed, unless otherwise disclosed below as variable consideration. Generally, our contracts require our customers to pay for goods after we deliver products to them. Terms are generally on open account, payable net 30 days in North America, and vary throughout Asia/Pacific, Europe and Latin America subject to customary credit checks.
The Company also sells products that are manufactured or assembled in our manufacturing facility. These products can either be built to the customer’s prints/designs or are products that we stock in our warehouse to sell to any customer that places an order. The manufacturing business does not include a separate service bundled with the product sold or sold in addition to the product.
The Company recognizes services revenue when the repair, installation or training is performed. Based on our analysis of services revenue, ASU 2014-09 has an immaterial impact on the timing, amount or characterization of services revenue recognized by the Company. The services we provide are relatively short in duration and typically completed in one to two weeks. Therefore, at each reporting date, the amount of unbilled work performed is insignificant. The services revenue has consistently accounted for less than 5% of the Company’s total revenues and is expected to continue at that level.
41
Contracts with customers
A contract is an agreement between two or more parties that creates enforceable rights and obligations. A revenue contract exists for us once a customer purchase order is received, reviewed and accepted. Prior to accepting a customer purchase order, we review the credit worthiness of the customer. Purchase orders are deemed to meet the collectability criterion once the customer’s credit is approved. Contract assets arise when the Company transfers a good or performs a service in advance of receiving consideration from the customer and contract liabilities arise when the Company receives consideration from its customer in advance of performance.
Contract Liabilities: Contract liabilities and revenue recognized were as follows (in thousands):
|
|
|
June 1, 2019 |
|
|
Additions |
|
|
Revenue Recognized |
|
|
May 30, 2020 |
|
||||
|
Contract liabilities (deferred revenue) |
|
$ |
2,260 |
|
|
$ |
2,083 |
|
|
$ |
(2,672 |
) |
|
$ |
1,671 |
|
The Company receives advance payments or deposits from our customers before revenue is recognized resulting in contract liabilities. Contract liabilities are included in accrued liabilities in the consolidated balance sheets.
Performance obligations and satisfaction of performance obligation in the contract
Each accepted purchase order identifies a distinct good or service as the performance obligation. The goods are generally standard products we purchased from a supplier and stocked on our shelves. They can also be customized products purchased from a supplier or products that are customized or have value added to them in-house prior to shipping to the customer. Our contracts for customized products generally include termination provisions if a customer cancels its order. However, we recognize revenue at a point in time because the termination provisions do not require, upon cancelation, the customer to pay fees that are commensurate with the work performed. Each purchase order explicitly states the goods or service that we promise to transfer to the customer. The promises to the customer are limited only to those goods or service. The performance obligation is our promise to deliver both goods that were produced by the Company and resale of goods that we purchase from our suppliers. Our shipping and handling activities for destination shipments are performed prior to the customer obtaining control. As such, they are not a separate promised service. For shipping point, The Company is making the election under ASC 606-10-25-18B to account for shipping and handling as activities to fulfill the promise to transfer the goods. The goods we provide to our customers are distinct in that our customers benefit from the goods we sell them through use in their own processes. Our customers are generally not resellers, but rather businesses that incorporate our products into their processes from which they generate an economic benefit. The goods are also distinct in that each item sold to the customer is clearly identified on both the purchase order and resulting invoice. Each product we sell benefits the customer independently of the other products. Each item on each purchase order from the customer can be used by the customer unrelated to any other products we provide to the customer.
Determine the transaction price and variable consideration
The transaction price for each product is the amount invoiced to the customer. Each product on a purchase order is a separate performance obligation with an observable standalone selling price. The transaction price is a fixed price per unit, except for the variable consideration. The Company elects to exclude sales tax from the transaction price. With the exception of sale with right of return, variable consideration has been identified only in the form of customer early payment discounts, which are immaterial to the Company’s financial statements. As there is not a material impact on our financial statements, we will continue to account for customer discounts when they are taken by the customer and address further if they grow.
Recognize revenue when the entity satisfies a performance obligation
We recognize revenue when title transfers to the customer, at the shipping point for FOB shipping contracts and at the customer’s delivery location for FOB destination contracts. We believe that the transfer of title best represents when the customer obtains control of the goods. Prior to that date, we do not have right to payment, and the significant risks and rewards remain with us. The significant risks and rewards of ownership of the inventory transfer simultaneously with the transfer of title. The customer’s acceptance of the goods is based on objective measurements, not subjective.
42
Additional considerations
Sale with right of return:
Our return policy is available to customers in our terms and conditions found on our website www.rell.com. The policy varies by business unit. The Company allows returns with prior written authorization and we allow returns within ten days of shipment for replacement parts.
The Company maintains a reserve for returns based on historical trends that covers all contracts and revenue streams using the expected value method because we have a large number of contracts with similar characteristics, which is considered variable consideration. The reserve for returns creates a refund liability on our balance sheet as a contra Trade Accounts Receivable as well as an asset in inventory. We value the inventory at cost due to there being minimal or no costs to the Company as we generally require the customer to pay freight and we typically do not have costs associated with activities such as relabeling or repackaging.
The reserve is considered immaterial at each balance sheet date for further consideration. Returns for defective product are typically covered by our suppliers’ warranty, thus, returns for defective product are not factored into our reserve.
Warranties:
We offer warranties for the limited number of specific products we manufacture. Our warranty terms generally range from one to three years. We estimate the cost to perform under the warranty obligation and recognize this estimated cost at the time of the related product sale. Each quarter, we assess actual warranty costs incurred on a product-by-product basis and compare the warranty costs to our estimated warranty obligation. With respect to new products, estimates are based generally on knowledge of the products and warranty experience. See Note 3, Warranties, for further information regarding the impact of warranties concerning ASU 2014-09.
Principal versus agent considerations:
Principal versus agent guidance was considered for customized products that are provided by our suppliers versus manufactured by the Company. The Company acts as the principal as we are responsible for satisfying the performance obligation. We have primary responsibility for fulfilling the contract, we have inventory risk prior to delivery to our customer, we establish prices, our consideration is not in the form of a commission and we bear the credit risk. The Company recognizes revenue in the gross amount of consideration.
See Note 11, Segment Reporting, for a disaggregation of revenue by reportable segment and geographic region, which represents how our chief operating decision maker reviews information internally to evaluate our financial performance and to make resource allocation and other decisions for the Company.
|
5. |
DISCONTINUED OPERATIONS |
On September 12, 2017, the Company received an income tax refund from the State of Illinois of approximately $2.0 million, which included interest earned. The refund was a result of the conclusion of the Illinois amended return related to the sale of the RF, Wireless and Power Division in 2011. A net benefit of $1.5 million, which included $0.5 million of professional fee costs incurred to pursue the refund, was recognized in the second quarter of fiscal 2018 in discontinued operations.
|
6. |
RELATED PARTY TRANSACTION |
On June 15, 2015, the Company entered into a lease agreement for the IMES facility with LDL, LLC. The Executive Vice President of IMES, Lee A. McIntyre III (former owner of IMES), has an ownership interest in LDL, LLC. The lease agreement has been extended as detailed in Exhibit 10.2, filed with this Annual Report on Form 10-K. The lease agreement provides for monthly payments over five years with total future minimum lease payments of $0.8 million. Rental expense related to this lease amounted to $0.1 million for the fiscal years ended May 30, 2020, June 1, 2019 and June 2, 2018.
|
7. |
GOODWILL AND INTANGIBLE ASSETS |
Goodwill
As a result of the Company’s annual impairment review as of March 3, 2019, and after reviewing the totality of events and circumstances as provided in ASU 2011-08, we determined that it was more likely than not that the fair value for the IMES reporting unit was less than its carrying value. Accordingly, we performed the quantitative impairment test using the income method, which was
43
based on a discounted future cash flow approach that used the significant assumptions of projected revenue, projected operational profit, terminal growth rates and the cost of capital. The Guideline Public Company Method was also considered in the goodwill impairment assessment.
The quantitative impairment test determined that the IMES reporting unit’s carrying value exceeded its fair value by an amount that exceeded the recorded goodwill balance. As a result, in the fourth quarter of fiscal year 2019, the Company recorded a non-cash goodwill impairment charge of $6.3 million for the full amount of the goodwill associated with the IMES reporting unit.
Intangible Assets
Intangible assets are initially recorded at their fair market values determined by quoted market prices in active markets, if available, or recognized valuation models. Intangible assets that have finite useful lives are amortized over their useful lives and are tested for impairment when events or changes in circumstances occur that indicate possible impairment. No impairment was recognized in fiscal 2020, fiscal 2019 or fiscal 2018.
Our intangible assets represent the fair value for trade name, customer relationships, non-compete agreements and technology acquired in connection with our acquisitions. Intangible assets subject to amortization were as follows (in thousands):
|
|
|
May 30, 2020 |
|
|
June 1, 2019 |
|
||
|
Gross Amounts: |
|
|
|
|
|
|
|
|
|
Trade Name |
|
$ |
659 |
|
|
$ |
659 |
|
|
Customer Relationships (1) |
|
|
3,388 |
|
|
|
3,394 |
|
|
Non-compete Agreements |
|
|
177 |
|
|
|
177 |
|
|
Technology |
|
|
230 |
|
|
|
230 |
|
|
Total Gross Amounts |
|
$ |
4,454 |
|
|
$ |
4,460 |
|
|
Accumulated Amortization: |
|
|
|
|
|
|
|
|
|
Trade Name |
|
$ |
659 |
|
|
$ |
659 |
|
|
Customer Relationships |
|
|
1,000 |
|
|
|
796 |
|
|
Non-compete Agreements |
|
|
161 |
|
|
|
139 |
|
|
Technology |
|
|
129 |
|
|
|
103 |
|
|
Total Accumulated Amortization |
|
$ |
1,949 |
|
|
$ |
1,697 |
|
|
Net Intangibles |
|
$ |
2,505 |
|
|
$ |
2,763 |
|
Under ASC 350, companies must perform the annual test for impairment for indefinite life intangible assets, for which the Company has none, as well as test definite life assets for impairment in the event of a “trigger event” such as adverse changes in the business climate or market which might negatively impact the value of a reporting unit. The Company identified an impairment “trigger event” for the IMES reporting unit due to adverse changes in the business climate related to COVID-19. The Company tested the IMES definite life intangible assets and other long lived assets using the undiscounted cash flows of the reporting unit (the asset group) analyzed over a period of ten years, with a residual period, compared to the carrying value of the asset group and determined that the intangible assets and other long lived assets were not impaired as of May 30, 2020. Estimates contain management’s best estimates of economic and market conditions over the projected period, including growth rates in revenue and costs and best estimates of future expected changes in operating margins and capital expenditures. For the remainder of the Company’s intangible assets, we determined that they were not impaired as of May 30, 2020 on the basis that no adverse events or changes in circumstances were identified that could indicate that the carrying amounts of such assets may not be recoverable.
44
The amortization expense associated with the intangible assets subject to amortization for the next five years is presented in the following table (in thousands):
|
Fiscal Year |
|
Amortization Expense |
|
|
|
2021 |
|
$ |
245 |
|
|
2022 |
|
|
252 |
|
|
2023 |
|
|
245 |
|
|
2024 |
|
|
231 |
|
|
2025 |
|
|
219 |
|
|
Thereafter |
|
|
1,313 |
|
|
Total amortization expense |
|
$ |
2,505 |
|
The amortization expense associated with the intangible assets totaled approximately $0.3 million during both fiscal 2020 and fiscal 2019 and $0.4 million during fiscal 2018. The weighted average number of years of amortization expense remaining is 13.3 years.
|
8. |
LEASE OBLIGATIONS AND OTHER COMMITMENTS |
In February 2016, the FASB issued ASU 2016-02 (“ASU 2016-02”), Leases (“Topic 842”). ASU 2016-02 establishes a right-of-use (“ROU”) model that requires a lessee to record an ROU asset and a lease liability on the balance sheet for all leases with terms longer than 12 months. Leases will be classified as either financing or operating, with classification affecting the pattern of expense recognition in the income statement.
ASU 2016-02 is effective for fiscal years beginning after December 15, 2018, including interim periods within those fiscal years. A modified retrospective transition approach is required for lessees for capital and operating leases existing at, or entered into after, the beginning of the earliest comparative period presented in the financial statements, with certain practical expedients available. The Company elects the practical expedients (which must be elected as a package and applied consistently to all of our leases) for which we will not reassess: (1) whether any expired or existing contracts are or contains leases, (2) the lease classification for any expired or existing leases and (3) the initial indirect costs for any existing leases. We have also elected the practical expedient to combine lease and non-lease components for all of our leases. We have adopted an accounting policy to not apply the requirements of Topic 842 to leases with a term of 12 months or less, which the Company has within our facility leases. Short-term leases will be reassessed if events occur that disqualify them from short-term status.
The new standard was effective for the Company on June 2, 2019. The FASB issued ASU 2018-11, targeted improvements to Topic 842, which includes an option to not restate comparative periods in transition and elect to use the effective date of Topic 842 as the date of initial application of transition. We adopted the new standard applying the new transition method allowed under ASU 2018-11. As a result of adopting Topic 842, at May 30, 2020, we recognized operating right-of-use assets of $3.0 million, financing right-of-use assets of $0.4 million, operating lease liabilities of $3.1 million and financing lease liabilities of $0.3 million. Several leases include renewal clauses which vary in length and may not include specific rent renewal amounts. The Company will revise the value of the right of use assets and associated lease liabilities when the Company is reasonably certain it will renew the lease. The standard did not have a material impact on our results of operations or cash flows.
45
The gross amounts of assets and liabilities related to both operating and financing leases at May 30, 2020 were as follows (in thousands):
|
Lease Type |
|
Amount |
|
|
|
Operating lease ROU asset |
|
$ |
3,018 |
|
|
Financing lease ROU asset |
|
|
401 |
|
|
Total Lease ROU asset |
|
$ |
3,419 |
|
|
|
|
|
|
|
|
Operating lease liability current |
|
$ |
1,329 |
|
|
Financing lease liability current |
|
|
156 |
|
|
Total lease liability current |
|
$ |
1,485 |
|
|
|
|
|
|
|
|
Operating lease liability non-current |
|
$ |
1,778 |
|
|
Financing lease liability non-current |
|
|
163 |
|
|
Total lease liability non-current |
|
$ |
1,941 |
|
The components of lease costs were as follows (in thousands):
|
Lease Type |
|
Classification |
|
Fiscal Year Ended May 30, 2020 |
|
|
|
Consolidated operating lease expense |
|
Operating expenses |
|
$ |
1,963 |
|
|
|
|
|
|
|
|
|
|
Consolidated financing lease amortization |
|
Operating expenses |
|
|
62 |
|
|
Consolidated financing lease interest |
|
Interest expense |
|
|
22 |
|
|
Consolidated financing lease expense |
|
|
|
|
84 |
|
|
|
|
|
|
|
|
|
|
Net lease cost |
|
|
|
$ |
2,047 |
|
Rent expense for fiscal 2020, fiscal 2019 and fiscal 2018 was $1.8 million, $1.7 million, and $1.8 million, respectively.
Our future lease commitments for minimum rentals, including common area maintenance charges and property taxes during the next five years are as follows (in thousands):
|
Fiscal Year |
|
Operating Leases |
|
|
Financing Leases |
|
|
Total |
|
|||
|
2021 |
|
$ |
1,472 |
|
|
$ |
181 |
|
|
$ |
1,653 |
|
|
2022 |
|
|
711 |
|
|
|
151 |
|
|
|
862 |
|
|
2023 |
|
|
488 |
|
|
|
— |
|
|
|
488 |
|
|
2024 |
|
|
347 |
|
|
|
— |
|
|
|
347 |
|
|
2025 |
|
|
217 |
|
|
|
— |
|
|
|
217 |
|
|
Thereafter |
|
|
116 |
|
|
|
— |
|
|
|
116 |
|
|
Total lease payments |
|
|
3,351 |
|
|
|
332 |
|
|
|
3,683 |
|
|
Less imputed interest |
|
|
244 |
|
|
|
13 |
|
|
|
257 |
|
|
Net minimum lease payments |
|
$ |
3,107 |
|
|
$ |
319 |
|
|
$ |
3,426 |
|
46
The approximate future minimum lease payments under operating and financing leases at June 1, 2019 were as follows (in thousands):
|
Fiscal Year (1) |
|
Payments |
|
|
|
2020 |
|
$ |
1,586 |
|
|
2021 |
|
|
1,367 |
|
|
2022 |
|
|
509 |
|
|
2023 |
|
|
340 |
|
|
2024 |
|
|
289 |
|
|
Thereafter |
|
|
234 |
|
|
(1) |
On June 2, 2019, the Company elected the modified retrospective method of transition to adopt the new lease standard Topic 842, which resulted in no restatement of prior period results. At June 1, 2019, prior to adoption of the new lease standard, operating lease obligations were not included as a liability on the balance sheet. Therefore, the operating lease obligations were included in the table for comparative purposes only and the total lease liability was not included as it is not applicable. |
The weighted average remaining lease terms and interest rates of leases held by the Company as of May 30, 2020 were as follows:
|
Lease Type |
|
Weighted Average Remaining Lease Term in Years |
|
Weighted Average Interest Rate |
|
|
Operating leases |
|
3.4 |
|
4.6% |
|
|
Financing leases |
|
1.9 |
|
4.6% |
|
The cash outflows of the leasing activity of the Company as lessee for fiscal 2020 were as follows (in thousands):
|
Cash Flow Source |
|
Classification |
|
Amount |
|
|
|
Operating cash flows from operating leases |
|
Operating activities |
|
$ |
924 |
|
|
Operating cash flows from financing leases |
|
Operating activities |
|
|
149 |
|
|
Finance cash flows from financing leases |
|
Financing activities |
|
|
166 |
|
|
9. |
INCOME TAXES |
(Loss) income from continuing operations before income taxes included the following components (in thousands):
|
|
|
Fiscal Year Ended |
|
|||||||||
|
|
|
May 30, 2020 |
|
|
June 1, 2019 |
|
|
June 2, 2018 |
|
|||
|
United States |
|
$ |
(3,716 |
) |
|
$ |
(9,971 |
) |
|
$ |
(211 |
) |
|
Foreign |
|
|
2,502 |
|
|
|
3,660 |
|
|
|
4,071 |
|
|
(Loss) income before income taxes |
|
$ |
(1,214 |
) |
|
$ |
(6,311 |
) |
|
$ |
3,860 |
|
47
The provision for income taxes for fiscal 2020, fiscal 2019 and fiscal 2018 consisted of the following (in thousands):
|
|
|
Fiscal Year Ended |
|
|||||||||
|
|
|
May 30, 2020 |
|
|
June 1, 2019 |
|
|
June 2, 2018 |
|
|||
|
Current: |
|
|
|
|
|
|
|
|
|
|
|
|
|
Federal |
|
$ |
— |
|
|
$ |
33 |
|
|
$ |
— |
|
|
State |
|
|
— |
|
|
|
3 |
|
|
|
(12 |
) |
|
Foreign |
|
|
616 |
|
|
|
652 |
|
|
|
1,220 |
|
|
Total current |
|
$ |
616 |
|
|
$ |
688 |
|
|
$ |
1,208 |
|
|
Deferred: |
|
|
|
|
|
|
|
|
|
|
|
|
|
Federal |
|
$ |
(88 |
) |
|
$ |
(104 |
) |
|
$ |
124 |
|
|
State |
|
|
— |
|
|
|
— |
|
|
|
— |
|
|
Foreign |
|
|
96 |
|
|
|
433 |
|
|
|
202 |
|
|
Total deferred |
|
$ |
8 |
|
|
$ |
329 |
|
|
$ |
326 |
|
|
Income tax provision |
|
$ |
624 |
|
|
$ |
1,017 |
|
|
$ |
1,534 |
|
The differences between income taxes at the U.S. federal statutory income tax rate of 21.0% for both fiscal 2020 and fiscal 2019 and 29.2% for fiscal 2018 and the reported income tax provision for fiscal 2020, fiscal 2019 and fiscal 2018 are summarized as follows:
|
|
|
Fiscal Year Ended |
|
|||||||||
|
|
|
May 30, 2020 |
|
|
June 1, 2019 |
|
|
June 2, 2018 |
|
|||
|
Federal statutory rate |
|
|
21.0 |
% |
|
|
21.0 |
% |
|
|
29.2 |
% |
|
Effect of: |
|
|
|
|
|
|
|
|
|
|
|
|
|
State income taxes, net of federal tax benefit |
|
|
6.6 |
|
|
|
5.4 |
|
|
|
0.3 |
|
|
Deemed repatriation tax |
|
|
— |
|
|
|
— |
|
|
|
(50.0 |
) |
|
Foreign taxes at other rates |
|
|
(15.3 |
) |
|
|
(4.1 |
) |
|
|
(0.1 |
) |
|
Permanent tax differences |
|
|
(41.1 |
) |
|
|
(16.1 |
) |
|
|
6.7 |
|
|
Deferred remeasurement |
|
|
— |
|
|
|
— |
|
|
|
45.1 |
|
|
Tax reserves |
|
|
— |
|
|
|
— |
|
|
|
3.6 |
|
|
Additional U.S. tax on undistributed foreign earnings |
|
|
— |
|
|
|
— |
|
|
|
(12.5 |
) |
|
Change in valuation allowance for deferred tax assets |
|
|
(29.8 |
) |
|
|
(22.8 |
) |
|
|
15.1 |
|
|
Return to provision adjustments |
|
|
1.4 |
|
|
|
(0.5 |
) |
|
|
0.1 |
|
|
Closure of foreign audits |
|
|
— |
|
|
|
— |
|
|
|
2.2 |
|
|
Other |
|
|
5.8 |
|
|
|
1.0 |
|
|
|
— |
|
|
Effective tax rate |
|
|
(51.4 |
)% |
|
|
(16.1 |
)% |
|
|
39.7 |
% |
48
Deferred income taxes reflect the net tax effect of temporary differences between the carrying amounts of assets and liabilities for financial reporting purposes and the amounts used for income tax purposes. Our deferred tax assets and liabilities reflect continuing operations as of May 30, 2020 and June 1, 2019. Significant components were as follows (in thousands):
|
|
|
Fiscal Year Ended |
|
|||||
|
|
|
May 30, 2020 |
|
|
June 1, 2019 |
|
||
|
Deferred tax assets: |
|
|
|
|
|
|
|
|
|
NOL carryforwards - foreign and domestic |
|
$ |
7,834 |
|
|
$ |
7,458 |
|
|
Inventory valuations |
|
|
1,388 |
|
|
|
1,179 |
|
|
Goodwill |
|
|
1,390 |
|
|
|
1,578 |
|
|
Foreign tax credits |
|
|
1,782 |
|
|
|
1,782 |
|
|
Severance reserve |
|
|
165 |
|
|
|
188 |
|
|
Foreign capital loss |
|
|
1,167 |
|
|
|
1,129 |
|
|
Other |
|
|
1,847 |
|
|
|
1,737 |
|
|
Subtotal |
|
$ |
15,573 |
|
|
$ |
15,051 |
|
|
Valuation allowance - foreign and domestic |
|
|
(12,322 |
) |
|
|
(11,706 |
) |
|
Net deferred tax assets after valuation allowance |
|
$ |
3,251 |
|
|
$ |
3,345 |
|
|
Deferred tax liabilities: |
|
|
|
|
|
|
|
|
|
Accelerated depreciation |
|
$ |
(2,944 |
) |
|
$ |
(2,908 |
) |
|
Tax on undistributed earnings |
|
|
(24 |
) |
|
|
(141 |
) |
|
Other |
|
13 |
|
|
21 |
|
||
|
Subtotal |
|
$ |
(2,955 |
) |
|
$ |
(3,028 |
) |
|
Net deferred tax assets |
|
$ |
296 |
|
|
$ |
317 |
|
|
Supplemental disclosure of net deferred tax assets, excluding valuation allowance: |
|
|
|
|
|
|
|
|
|
Domestic |
|
$ |
10,925 |
|
|
$ |
10,194 |
|
|
Foreign |
|
$ |
1,693 |
|
|
$ |
1,829 |
|
|
Total |
|
$ |
12,618 |
|
|
$ |
12,023 |
|
As of May 30, 2020, we had approximately $3.7 million of net deferred tax assets related to federal net operating loss (“NOL”) carryforwards, compared to $3.1 million as of June 1, 2019. Net deferred tax assets related to domestic state NOL carryforwards at May 30, 2020 amounted to approximately $3.8 million, compared to $3.9 million at June 1, 2019. Net deferred tax assets related to foreign NOL carryforwards as of May 30, 2020 totaled approximately $0.3 million with various or indefinite expiration dates. The amount of net deferred tax assets related to foreign NOL carryforwards was $0.4 million as of June 1, 2019. We also had a domestic net deferred tax asset of $1.8 million of foreign tax credit carryforwards as of May 30, 2020, compared to $1.8 million as of June 1, 2019. We did not have any alternative minimum tax credit carryforward as of May 30, 2020.
We have historically determined that undistributed earnings of our foreign subsidiaries, to the extent of cash available, will be repatriated to the U.S. The deferred tax liability on the outside basis difference is now primarily withholding tax on future dividend distributions. Accordingly, we have reduced the deferred tax liability related to undistributed earnings of our foreign subsidiaries from $0.2 million in fiscal 2019 to less than $0.1 million in fiscal 2020.
Management assesses the available positive and negative evidence to estimate if sufficient future taxable income will be generated to use the existing deferred tax assets. A significant component of objective evidence evaluated was the cumulative income or loss incurred in each jurisdiction over the three-year period ended May 30, 2020. Such objective evidence limits the ability to consider subjective evidence such as future income projections. We considered other positive evidence in determining the need for a valuation allowance in the U.S. including the subpart F and GILTI inclusions of our foreign earnings. The weight of this positive evidence is not sufficient to outweigh other negative evidence in evaluating our need for a valuation allowance in the U.S. jurisdiction.
As of May 30, 2020, a valuation allowance of $12.3 million was established to record only the portion of the deferred tax asset that will more likely than not be realized. The valuation allowance as of June 1, 2019 was $11.7 million. We recorded a valuation allowance for all domestic federal and state net deferred tax assets considering the significant cumulative losses in the U.S. jurisdiction, the reversal of the deferred tax liability for foreign earnings and no forecast of additional U.S. income. The valuation allowance also related to deferred tax assets in foreign jurisdictions where historical taxable losses have been incurred. The amount of the deferred tax asset considered realizable, however, could be adjusted if estimates of future taxable income during the carryforward period are increased, or if objective negative evidence in the form of cumulative losses is no longer present and additional weight may be given to subjective evidence such as our projections for growth.
49
Income taxes paid, including foreign estimated tax payments, were $1.0 million, $0.3 million and $0.5 million, during fiscal 2020, fiscal 2019 and fiscal 2018, respectively.
In the normal course of business, we are subject to examination by taxing authorities throughout the world. Generally, years prior to fiscal 2015 are closed for examination under the statute of limitation for U.S. federal, U.S. state and local or non-U.S. tax jurisdictions. We are currently under examination in Thailand (fiscal 2008 through 2011). Our primary foreign tax jurisdictions are Germany and the Netherlands. We have tax years open in Germany beginning in fiscal 2015 and the Netherlands beginning in fiscal 2018.
The uncertain tax positions from continuing operations as of both May 30, 2020 and June 1, 2019 were $0.1 million. We record penalties and interest related to uncertain tax positions in the income tax expense line item within the Consolidated Statements of Comprehensive (Loss) Income. Accrued interest and penalties are included within the related tax liability line in the Consolidated Balance Sheets. We have not recorded a liability for interest and penalties as of May 30, 2020 or June 1, 2019. It is not expected that there will be a change in the unrecognized tax benefits due to the expiration of various statutes of limitations within the next 12 months.
The following table summarizes the activity related to the unrecognized tax benefits (in thousands):
|
|
|
Fiscal Year Ended |
|
|||||
|
|
|
May 30, 2020 |
|
|
June 1, 2019 |
|
||
|
Unrecognized tax benefits, beginning of period |
|
$ |
130 |
|
|
$ |
138 |
|
|
Currency translation adjustment |
|
|
(1 |
) |
|
|
(8 |
) |
|
Unrecognized tax benefits, end of period |
|
$ |
129 |
|
|
$ |
130 |
|
|
10. |
EMPLOYEE BENEFIT PLANS |
Employee Profit Sharing Plan: The employee profit sharing plan is a defined contribution profit sharing plan. The profit sharing plan has a 401(k) provision whereby we match 50% of employee contributions up to 4.0% of pay. Charges to expense for matching contributions to this plan were $0.5 million, $0.5 million and $0.4 million, during fiscal 2020, fiscal 2019 and fiscal 2018, respectively.
|
11. |
SEGMENT AND GEOGRAPHIC INFORMATION |
In accordance with ASC 280-10, Segment Reporting, we have identified three reportable segments: PMT, Canvys and Healthcare.
PMT combines our core engineered solutions capabilities, power grid and microwave tube business with new RF, Wireless and disruptive power technologies. As a manufacturer, technology partner and authorized distributor, PMT’s strategy is to provide specialized technical expertise and engineered solutions based on our core engineering and manufacturing capabilities on a global basis. We provide solutions and add value through design-in support, systems integration, prototype design and manufacturing, testing, logistics and aftermarket technical service and repair—all through our existing global infrastructure. PMT’s focus is on products for power, RF and microwave applications for customers in 5G, alternative energy, aviation, broadcast, communications, industrial, marine, medical, military, scientific and semiconductor markets. PMT focuses on various applications including broadcast transmission, CO2 laser cutting, diagnostic imaging, dielectric and induction heating, high energy transfer, high voltage switching, plasma, power conversion, radar and radiation oncology. PMT also offers its customers technical services for both microwave and industrial equipment.
Canvys provides customized display solutions serving the corporate enterprise, financial, healthcare, industrial and medical original equipment manufacturers markets. Our engineers design, manufacture, source and support a full spectrum of solutions to match the needs of our customers. We offer long term availability and proven custom display solutions that include touch screens, protective panels, custom enclosures, all-in-ones, specialized cabinet finishes and application specific software packages and certification services. We partner with both private label manufacturing companies and leading branded hardware vendors to offer the highest quality display and touch solutions and customized computing platforms.
50
Healthcare manufactures, refurbishes and distributes high value replacement parts for the healthcare market including hospitals, medical centers, asset management companies, independent service organizations and multi-vendor service providers. Products include Diagnostic Imaging replacement parts for CT and MRI systems; replacement CT and MRI tubes; CT service training; MRI coils, cold heads and RF amplifiers; hydrogen thyratrons, klystrons, magnetrons; flat panel detector upgrades; and additional replacement solutions currently under development for the diagnostic imaging service market. Through a combination of newly developed products and partnerships, service offerings and training programs, we believe we can help our customers improve efficiency and deliver better clinical outcomes while lowering the cost of healthcare delivery.
The CEO, who is the Chief Operating Decision Maker, evaluates performance and allocates resources primarily based on the gross profit of each segment.
Operating results by segment are summarized in the following table (in thousands):
|
|
|
Fiscal Year Ended |
|
|||||||||
|
|
|
May 30, 2020 |
|
|
June 1, 2019 |
|
|
June 2, 2018 |
|
|||
|
PMT |
|
|
|
|
|
|
|
|
|
|
|
|
|
Net Sales |
|
$ |
118,480 |
|
|
$ |
128,902 |
|
|
$ |
128,296 |
|
|
Gross Profit |
|
|
38,288 |
|
|
|
40,254 |
|
|
|
43,254 |
|
|
Canvys |
|
|
|
|
|
|
|
|
|
|
|
|
|
Net Sales |
|
$ |
28,926 |
|
|
$ |
27,968 |
|
|
$ |
26,683 |
|
|
Gross Profit |
|
|
9,313 |
|
|
|
9,085 |
|
|
|
8,410 |
|
|
Healthcare |
|
|
|
|
|
|
|
|
|
|
|
|
|
Net Sales |
|
$ |
8,492 |
|
|
$ |
9,782 |
|
|
$ |
8,233 |
|
|
Gross Profit |
|
|
2,072 |
|
|
|
2,396 |
|
|
|
3,418 |
|
A reconciliation of assets to the relevant consolidated amount is as follows (in thousands):
|
|
|
May 30, 2020 |
|
|
June 1, 2019 |
|
||
|
Segment assets |
|
$ |
89,231 |
|
|
$ |
88,470 |
|
|
Cash and cash equivalents |
|
|
30,535 |
|
|
|
42,019 |
|
|
Investments - current |
|
|
16,000 |
|
|
|
8,000 |
|
|
Other current assets (1) |
|
|
2,545 |
|
|
|
3,227 |
|
|
Net property, plant and equipment |
|
|
10,267 |
|
|
|
10,772 |
|
|
Operating lease ROU asset |
|
|
1,285 |
|
|
|
— |
|
|
Financing lease ROU asset |
|
|
401 |
|
|
|
— |
|
|
Other assets - non-current deferred income taxes |
|
|
456 |
|
|
|
529 |
|
|
Total assets |
|
$ |
150,720 |
|
|
$ |
153,017 |
|
|
(1) |
Other current assets include miscellaneous receivables and prepaid expenses. |
Assets are not disclosed by reportable segment as the Company does not track assets by reportable segment and certain assets are not specific to any reportable segment.
Capital expenditures for our Healthcare segment during fiscal 2020 and fiscal 2019 were approximately $0.4 million and $1.2 million, respectively. In addition, we also had capital expenditures during fiscal 2020 and fiscal 2019 related to the Company’s ERP system as well as facilities that were not specific to any particular reportable segment.
Geographic net sales information is primarily grouped by customer destination into five areas: North America; Asia/Pacific; Europe; Latin America; and Other.
51
Net sales and gross profit by geographic region are summarized in the following table (in thousands):
|
|
|
Fiscal Year Ended |
|
|||||||||
|
|
|
May 30, 2020 |
|
|
June 1, 2019 |
|
|
June 2, 2018 |
|
|||
|
Net Sales |
|
|
|
|
|
|
|
|
|
|
|
|
|
North America |
|
$ |
65,259 |
|
|
$ |
66,228 |
|
|
$ |
67,662 |
|
|
Asia/Pacific |
|
|
32,979 |
|
|
|
34,681 |
|
|
|
32,607 |
|
|
Europe |
|
|
49,394 |
|
|
|
55,038 |
|
|
|
53,818 |
|
|
Latin America |
|
|
8,308 |
|
|
|
10,653 |
|
|
|
9,123 |
|
|
Other (1) |
|
|
(42 |
) |
|
|
52 |
|
|
|
2 |
|
|
Total |
|
$ |
155,898 |
|
|
$ |
166,652 |
|
|
$ |
163,212 |
|
|
Gross Profit |
|
|
|
|
|
|
|
|
|
|
|
|
|
North America |
|
$ |
24,494 |
|
|
$ |
24,776 |
|
|
$ |
25,996 |
|
|
Asia/Pacific |
|
|
10,629 |
|
|
|
10,905 |
|
|
|
10,794 |
|
|
Europe |
|
|
15,483 |
|
|
|
17,425 |
|
|
|
18,071 |
|
|
Latin America |
|
|
2,804 |
|
|
|
3,863 |
|
|
|
3,602 |
|
|
Other (1) |
|
|
(3,737 |
) |
|
|
(5,234 |
) |
|
|
(3,381 |
) |
|
Total |
|
$ |
49,673 |
|
|
$ |
51,735 |
|
|
$ |
55,082 |
|
|
(1) |
Other includes primarily net sales not allocated to a specific geographical region, unabsorbed value-add costs and other unallocated expenses. |
Major Customers
During fiscal 2020 and fiscal 2019, no one customer accounted for more than 10 percent of the Company’s consolidated net sales. During fiscal 2018, LAM Research Corporation (“LAM”) individually accounted for 11 percent of the Company’s consolidated net sales. No other customer accounted for more than 10 percent of the Company’s consolidated net sales in fiscal 2018. LAM sales were included in the PMT segment.
We sell our products to customers in diversified industries and perform periodic credit evaluations of our customers’ financial condition. Terms are generally on open account, payable net 30 days in North America, and vary throughout Asia/Pacific, Europe and Latin America. Estimates of credit losses are recorded in the financial statements based on monthly reviews of outstanding accounts.
Net assets by geographic region are summarized in the following table (in thousands):
|
|
|
Fiscal Year Ended |
|
|||||||||
|
|
|
May 30, 2020 |
|
|
June 1, 2019 |
|
|
June 2, 2018 |
|
|||
|
Net Assets |
|
|
|
|
|
|
|
|
|
|
|
|
|
North America |
|
$ |
81,533 |
|
|
$ |
74,054 |
|
|
$ |
77,857 |
|
|
Asia/Pacific |
|
|
10,370 |
|
|
|
14,889 |
|
|
|
17,254 |
|
|
Europe |
|
|
24,973 |
|
|
|
32,807 |
|
|
|
37,911 |
|
|
Latin America |
|
|
1,784 |
|
|
|
2,007 |
|
|
|
2,159 |
|
|
Total |
|
$ |
118,660 |
|
|
$ |
123,757 |
|
|
$ |
135,181 |
|
The Company had long-lived assets of $20.2 million as of May 30, 2020 and $21.9 million as of June 1, 2019. The long-lived assets, which include our fixed assets and intangibles, were primarily in the US. There were approximately $0.6 million of long-lived assets that belong to our foreign affiliates as of May 30, 2020 and $0.9 million as of June 1, 2019.
The Company had depreciation and amortization expense of $3.4 million, $3.2 million and $3.0 million for fiscal 2020, fiscal 2019 and fiscal 2018, respectively. The depreciation and amortization, which includes our fixed assets and intangibles, were primarily in the US. Depreciation and amortization expense that belong to our foreign affiliates was approximately $0.3 million for fiscal 2020 and $0.2 million and $0.3 for fiscal 2019 and fiscal 2018, respectively.
52
|
12. |
RISKS AND UNCERTAINTIES |
Litigation
On October 15, 2018, Varex Imaging Corporation (“Varex”) filed its original Complaint (Case No. 1:18-cv-06911) against Richardson Electronics Ltd. (“Richardson”) in the Northern District of Illinois, which was subsequently amended on November 27, 2018. Varex alleged counts of infringement of U.S. Patent Nos. 6,456,692 and 6,519,317. Subsequently, on October 24, 2018, Varex filed a motion for preliminary injunction to stop the sale of Richardson’s ALTA750 TM product. Richardson filed an opposition to the preliminary injunction. In January 2019, the Court took evidence on the preliminary injunction issue. On September 30, 2019, the Court denied Varex’s Motion for Preliminary Injunction. Richardson believes the lawsuit to be without merit and a loss is not probable or estimable based on the information at the time the financial statements were issued.
Company Response to COVID-19
On January 30, 2020, the World Health Organization (“WHO”) announced a global health emergency because of a new strain of coronavirus originating in Wuhan, China (the “COVID-19 outbreak”) and the risks to the international community as the virus spreads globally.
In March 2020, the WHO classified the COVID-19 outbreak as a pandemic based on the rapid increase in global exposure. Thereafter, most U.S. states imposed “shelter in place” directives on their populations to stem the spread of COVID-19. Of specific interest to the Company, shelter in place directives were imposed in the states of Illinois, Massachusetts and South Carolina.
The shelter in place directives generally required the closure of businesses that did not provide essential functions. The Company was considered a critical supplier of products to healthcare and critical infrastructure businesses. Several of our largest customers mandated that we continue to supply parts so as not to disrupt the supply chain and their ability to serve critical industries. As such, the Company qualified as an “Essential Business”. Essential Businesses were allowed to continue to operate during shelter in place directives. We continued our manufacturing and distribution operations even when a shelter in place directive was issued. We limited the number of people in any one of our facilities by requiring only employees who could not perform their work remotely to physically work in a Company US-based facility. The Company advised all other employees that could perform their job functions remotely to do so. As such, the Company’s operations remained operational.
The impact of the COVID-19 outbreak continues to evolve. As such, the full magnitude that the pandemic will have on the Company’s financial condition, liquidity and future results of operations is uncertain. Management is actively monitoring the global situation on its financial condition, liquidity, operations, suppliers, industry and workforce. As the spread of COVID-19 continues, our ability to meet customer demands for products may be impaired or, similarly, our customers may experience adverse business consequences due to COVID-19. Reduced demand for products or impaired ability to meet customer demand (including disruptions at our transportation service providers or vendors) could have a material adverse effect on our business, operations and financial performance. Some of the decline in fiscal 2020 PMT sales and the decrease in Healthcare sales was primarily due to the COVID-19 global pandemic. While we had some COVID-19 related longer lead times as well as delays impacting new product development schedules, we did not experience a major interruption in our supply chain. Given the daily evolution of the COVID-19 outbreak and the global responses to curb its spread, the Company is not presently able to estimate the effects of COVID-19 on its results of operations, financial condition or liquidity for fiscal year 2021.
Company Response to CARES Act
On March 27, 2020, Congress enacted the Coronavirus Aid, Relief, and Economic Security (“CARES”) Act to provide certain relief as a result of the COVID-19 outbreak. The CARES Act includes provisions relating to refundable payroll tax credits, deferral of employer side social security payments, net operating loss carryback periods, alternative minimum tax credit refunds, increased limitations on qualified charitable contributions and technical corrections to tax depreciation methods for qualified improvement property. The Company continues to examine how these provisions in the CARES Act will impact its financial position, results of operations and cash flows. In fiscal 2020, the Company deferred $0.2 million of employer side social security tax payments. The Company has estimated and recorded the overall effects of the CARES Act and does not anticipate a material change.
|
13. |
FAIR VALUE MEASUREMENTS |
ASC 820, Fair Value Measurements and Disclosures (“ASC 820”), defines fair value, establishes a framework for measuring fair value in accordance with accounting principles generally accepted in the United States and expands disclosures about fair value measurements.
53
ASC 820 establishes a three-tier fair value hierarchy, which prioritizes the inputs used in measuring fair value. These tiers include: Level 1, defined as observable inputs such as quoted prices in active markets; Level 2, defined as inputs other than quoted prices in active markets that are either directly or indirectly observable; and Level 3, defined as unobservable inputs in which little or no market data exists; therefore requiring an entity to develop its own assumptions.
As of May 30, 2020, we held investments that were required to be measured at fair value on a recurring basis. Our investments consist of time deposits and CDs, where face value is equal to fair value.
Investments measured at fair value on a recurring basis subject to the disclosure requirements of ASC 820 as of May 30, 2020 and June 1, 2019 were as follows (in thousands):
|
|
|
Level 1 |
|
|
Level 2 |
|
|
Level 3 |
|
|||
|
May 30, 2020 |
|
|
|
|
|
|
|
|
|
|
|
|
|
Time deposits/CDs |
|
$ |
16,000 |
|
|
$ |
— |
|
|
$ |
— |
|
|
Total |
|
$ |
16,000 |
|
|
$ |
— |
|
|
$ |
— |
|
|
June 1, 2019 |
|
|
|
|
|
|
|
|
|
|
|
|
|
Time deposits/CDs |
|
$ |
8,000 |
|
|
$ |
— |
|
|
$ |
— |
|
|
Total |
|
$ |
8,000 |
|
|
$ |
— |
|
|
$ |
— |
|
|
14. |
VALUATION AND QUALIFYING ACCOUNTS |
The following table presents the valuation and qualifying account activity for fiscal years ended May 30, 2020, June 1, 2019 and June 2, 2018, (in thousands):
|
Description |
|
Balance at beginning of period |
|
|
Charged to expense |
|
|
|
Deductions |
|
|
|
Balance at end of period |
|
||||
|
Year ended May 30, 2020 |
|
|
|
|
|
|
|
|
|
|
|
|
|
|
|
|
|
|
|
Allowance for doubtful accounts |
|
$ |
339 |
|
|
$ |
349 |
|
(1) |
|
$ |
(354 |
) |
(2) |
|
$ |
334 |
|
|
Inventory provisions |
|
|
4,568 |
|
|
|
1,013 |
|
(3) |
|
|
(188 |
) |
(4) |
|
|
5,393 |
|
|
Year ended June 1, 2019 |
|
|
|
|
|
|
|
|
|
|
|
|
|
|
|
|
|
|
|
Allowance for doubtful accounts |
|
$ |
309 |
|
|
$ |
402 |
|
(1) |
|
$ |
(372 |
) |
(2) |
|
$ |
339 |
|
|
Inventory provisions |
|
|
4,027 |
|
|
|
1,076 |
|
(3) |
|
|
(535 |
) |
(4) |
|
|
4,568 |
|
|
Year ended June 2, 2018 |
|
|
|
|
|
|
|
|
|
|
|
|
|
|
|
|
|
|
|
Allowance for doubtful accounts |
|
$ |
398 |
|
|
$ |
223 |
|
(1) |
|
$ |
(312 |
) |
(2) |
|
$ |
309 |
|
|
Inventory provisions |
|
|
3,456 |
|
|
|
773 |
|
(3) |
|
|
(202 |
) |
(4) |
|
|
4,027 |
|
Notes:
|
(1) |
Charges to bad debt expense. |
|
(2) |
Uncollectible amounts written off, net of recoveries and foreign currency translation. |
|
(3) |
Charges to cost of sales. Included in fiscal 2020 were inventory write-downs of $0.6 million for PMT, $0.1 million for Canvys and $0.3 million for Healthcare. |
|
(4) |
Inventory disposed of or sold, net of foreign currency translation. |
54
|
15. |
SELECTED QUARTERLY FINANCIAL DATA (UNAUDITED) |
|
Description |
|
First Quarter |
|
|
Second Quarter |
|
|
Third Quarter |
|
|
Fourth Quarter |
|
|
||||
|
Fiscal 2020 |
|
|
|
|
|
|
|
|
|
|
|
|
|
|
|
|
|
|
Net sales |
|
$ |
40,653 |
|
|
$ |
39,634 |
|
|
$ |
38,249 |
|
|
$ |
37,362 |
|
|
|
Gross profit |
|
|
12,951 |
|
|
|
12,680 |
|
|
|
12,670 |
|
|
|
11,372 |
|
|
|
Income (loss) from continuing operations |
|
|
157 |
|
|
|
(622 |
) |
|
|
(93 |
) |
|
|
(1,280 |
) |
|
|
Net income (loss) |
|
|
157 |
|
|
|
(622 |
) |
|
|
(93 |
) |
|
|
(1,280 |
) |
|
|
Net income (loss) |
|
|
|
|
|
|
|
|
|
|
|
|
|
|
|
|
|
|
Common stock - basic |
|
$ |
0.01 |
|
|
$ |
(0.05 |
) |
|
$ |
(0.01 |
) |
|
$ |
(0.10 |
) |
|
|
Class B common stock - basic |
|
$ |
0.01 |
|
|
$ |
(0.04 |
) |
|
$ |
(0.01 |
) |
|
$ |
(0.09 |
) |
|
|
Common stock - diluted |
|
$ |
0.01 |
|
|
$ |
(0.05 |
) |
|
$ |
(0.01 |
) |
|
$ |
(0.10 |
) |
|
|
Class B common stock - diluted |
|
$ |
0.01 |
|
|
$ |
(0.04 |
) |
|
$ |
(0.01 |
) |
|
$ |
(0.09 |
) |
|
|
Fiscal 2019 |
|
|
|
|
|
|
|
|
|
|
|
|
|
|
|
|
|
|
Net sales |
|
$ |
44,157 |
|
|
$ |
41,314 |
|
|
$ |
39,018 |
|
|
$ |
42,163 |
|
|
|
Gross profit |
|
|
13,953 |
|
|
|
12,971 |
|
|
|
12,299 |
|
|
|
12,512 |
|
|
|
Income (loss) from continuing operations |
|
|
431 |
|
|
|
(304 |
) |
|
|
(1,078 |
) |
|
|
(6,377 |
) |
(1) |
|
Net income (loss) |
|
|
431 |
|
|
|
(304 |
) |
|
|
(1,078 |
) |
|
|
(6,377 |
) |
(1) |
|
Net income (loss) |
|
|
|
|
|
|
|
|
|
|
|
|
|
|
|
|
|
|
Common stock - basic |
|
$ |
0.03 |
|
|
$ |
(0.02 |
) |
|
$ |
(0.08 |
) |
|
$ |
(0.50 |
) |
|
|
Class B common stock - basic |
|
$ |
0.03 |
|
|
$ |
(0.02 |
) |
|
$ |
(0.08 |
) |
|
$ |
(0.44 |
) |
|
|
Common stock - diluted |
|
$ |
0.03 |
|
|
$ |
(0.02 |
) |
|
$ |
(0.08 |
) |
|
$ |
(0.50 |
) |
|
|
Class B common stock - diluted |
|
$ |
0.03 |
|
|
$ |
(0.02 |
) |
|
$ |
(0.08 |
) |
|
$ |
(0.44 |
) |
|
|
(1) |
Includes non-cash impairment of goodwill. Refer to Note 7 “Goodwill and Intangible Assets” of the notes to our consolidated financial statements. |
55
Report of Independent Registered Public Accounting Firm
Board of Directors and Stockholders
Richardson Electronics, Ltd.
LaFox, Illinois
Opinion on Internal Control over Financial Reporting
We have audited Richardson Electronics, Ltd.’s (the “Company’s”) internal control over financial reporting as of May 30, 2020, based on criteria established in Internal Control – Integrated Framework (2013) issued by the Committee of Sponsoring Organizations of the Treadway Commission (the “COSO criteria”). In our opinion, the Company maintained, in all material respects, effective internal control over financial reporting as of May 30, 2020, based on the COSO criteria.
We also have audited, in accordance with the standards of the Public Company Accounting Oversight Board (United States) (“PCAOB”), the consolidated balance sheets of the Company and subsidiaries as of May 30, 2020, and June 1, 2019, the related consolidated statements of comprehensive (loss) income, stockholders’ equity, and cash flows for each of the three years in the period ended May 30, 2020, and the related notes and our report dated August 3, 2020, expressed an unqualified opinion thereon.
Basis for Opinion
The Company’s management is responsible for maintaining effective internal control over financial reporting and for its assessment of the effectiveness of internal control over financial reporting, included in the accompanying Item 9A, Management’s Report on Internal Control over Financial Reporting. Our responsibility is to express an opinion on the Company’s internal control over financial reporting based on our audit. We are a public accounting firm registered with the PCAOB and are required to be independent with respect to the Company in accordance with U.S. federal securities laws and the applicable rules and regulations of the Securities and Exchange Commission and the PCAOB.
We conducted our audit of internal control over financial reporting in accordance with the standards of the PCAOB. Those standards require that we plan and perform the audit to obtain reasonable assurance about whether effective internal control over financial reporting was maintained in all material respects. Our audit included obtaining an understanding of internal control over financial reporting, assessing the risk that a material weakness exists, and testing and evaluating the design and operating effectiveness of internal control based on the assessed risk. Our audit also included performing such other procedures as we considered necessary in the circumstances. We believe that our audit provides a reasonable basis for our opinion.
Definition and Limitations of Internal Control over Financial Reporting
A company’s internal control over financial reporting is a process designed to provide reasonable assurance regarding the reliability of financial reporting and the preparation of financial statements for external purposes in accordance with generally accepted accounting principles. A company’s internal control over financial reporting includes those policies and procedures that (1) pertain to the maintenance of records that, in reasonable detail, accurately and fairly reflect the transactions and dispositions of the assets of the company; (2) provide reasonable assurance that transactions are recorded as necessary to permit preparation of financial statements in accordance with generally accepted accounting principles, and that receipts and expenditures of the company are being made only in accordance with authorizations of management and directors of the company; and (3) provide reasonable assurance regarding prevention or timely detection of unauthorized acquisition, use, or disposition of the company’s assets that could have a material effect on the financial statements.
Because of its inherent limitations, internal control over financial reporting may not prevent or detect misstatements. Also, projections of any evaluation of effectiveness to future periods are subject to the risk that controls may become inadequate because of changes in conditions, or that the degree of compliance with the policies or procedures may deteriorate.
/s/ BDO USA, LLP
Chicago, Illinois
August 3, 2020
56
ITEM 9A. CONTROLS AND PROCEDURES
|
(a) |
Evaluation of Disclosure Controls and Procedures |
Management of the Company, with the participation of the Chief Executive Officer and the Chief Financial Officer, evaluated the effectiveness of the design and operation of the Company’s disclosure controls and procedures (as defined in Rules 13a-15(e) and 15d-15(e) of the Securities Exchange Act of 1934, as amended (the “Exchange Act”)) as of May 30, 2020.
Disclosure controls and procedures are intended to provide reasonable assurance that information required to be disclosed in the Company’s Exchange Act reports is recorded, processed, summarized and reported within the time periods specified by the Securities and Exchange Commission’s rules and forms, and that such information is accumulated and communicated to management, including the Company’s Chief Executive Officer and Chief Financial Officer, as appropriate to allow timely decisions regarding required disclosure. Based on this evaluation, the Company’s Chief Executive Officer and Chief Financial Officer have concluded that the Company’s disclosure controls and procedures were effective as of May 30, 2020.
|
(b) |
Management’s Report on Internal Control over Financial Reporting |
The Company’s management is responsible for establishing and maintaining adequate internal control over financial reporting, as defined in Exchange Act Rules 13a-15(f) and 15d-15(f). Because of its inherent limitations, internal control over financial reporting may not prevent or detect misstatements. Also, projections of any evaluation of effectiveness of future periods are subject to the risk that controls may become inadequate because of changes in conditions, or that the degree of compliance with the policies or procedures may deteriorate.
A material weakness is a deficiency in internal control over financial reporting that results in more than a remote likelihood that a material misstatement of the annual or interim financial statements will not be prevented or detected.
Under the supervision of the Chief Executive Officer and Chief Financial Officer, management conducted an assessment of the effectiveness of our internal control over financial reporting as of May 30, 2020, based on the framework in the Internal Control-Integrated Framework (2013) published by the Committee of Sponsoring Organizations of the Treadway Commission (“COSO”). Based on that assessment, management has concluded that the Company’s internal control over financial reporting was effective as of May 30, 2020.
Management’s assessment of the effectiveness of our internal control over financial reporting as of May 30, 2020 has been audited by BDO USA, LLP, an independent registered public accounting firm, as stated in their report, which is included herein.
|
(c) |
Changes in Internal Control over Financial Reporting |
There have been no changes in the Company’s internal control over financial reporting during the most recent fiscal quarter that have materially affected, or are reasonably likely to materially affect, the Company’s internal control over financial reporting.
None
57
ITEM 10. Directors, Executive Officers and Corporate Governance
Information concerning directors and executive officers of the registrant will be contained in our Proxy Statement to be issued in connection with our Annual Meeting of Stockholders scheduled to be held on October 6, 2020, and is incorporated herein by reference.
ITEM 11. Executive Compensation
Information concerning executive compensation will be contained in our Proxy Statement to be issued in connection with our Annual Meeting of Stockholders scheduled to be held on October 6, 2020, and is incorporated herein by reference.
ITEM 12. Security Ownership of Certain Beneficial Owners and Management and Related Stockholder Matters
Information concerning security ownership of certain beneficial owners and management will be contained in our Proxy Statement to be issued in connection with our Annual Meeting of Stockholders scheduled to be held on October 6, 2020, and is incorporated herein by reference.
Equity Compensation Plan Information
The following table sets forth information as of May 30, 2020, with respect to compensation plans under which equity securities were authorized for issuance:
|
Plan Category |
|
Number of Securities to be Issued Upon Exercise of Outstanding Options, Warrants and Rights |
|
|
|
Weighted Average Per Share Exercise Price of Outstanding Options, Warrants and Rights |
|
|
|
Number of Securities Remaining Available for Future Issuance Under Equity Compensation Plans (Excluding Securities Reflected in the First Column) |
|
|||
|
Equity Compensation Plans Approved by Security Holders |
|
|
1,403,648 |
|
|
|
$ |
8.76 |
|
|
|
|
884,879 |
|
|
Equity Compensation Plans Not Approved by Security Holders |
|
|
23,564 |
|
(1) |
|
$ |
12.95 |
|
(1) |
|
|
— |
|
|
Total |
|
|
1,427,212 |
|
|
|
$ |
8.83 |
|
|
|
|
884,879 |
|
|
(1) |
Options issued in 1987 pursuant to an employment contract with a former officer and director of Richardson Electronics, Ltd. |
ITEM 13. Certain Relationships and Related Transactions and Director Independence
Information concerning certain relationships and related transactions will be contained in our Proxy Statement to be issued in connection with our Annual Meeting of Stockholders scheduled to be held on October 6, 2020, and is incorporated herein by reference.
ITEM 14. Principal Accountant Fees and Services
Information concerning accountant fees and services will be contained in our Proxy Statement to be issued in connection with our Annual Meeting of Stockholders scheduled to be held on October 6, 2020, and is incorporated herein by reference.
58
ITEM 15. Exhibits and Financial Statement Schedules
|
(a) |
Exhibit |
See Exhibit Index.
|
(b) |
Financial Statements and Financial Statement Schedules. |
Our consolidated financial statements being filed as part of this Form 10-K are filed on Item 8 of this Form 10-K. All other schedules for which provision is made in the applicable accounting regulations of the Securities and Exchange Commission are not required under the related instructions or are inapplicable, and therefore have been omitted.
59
PART IV
ITEM 15. Exhibits and Financial Statement Schedules
|
(a) |
List of Documents Filed as a Part of This Report: |
|
|
(1) |
Index to Consolidated Financial Statements: |
Consolidated Balance Sheets as of May 30, 2020 and June 1, 2019.
Consolidated Statements of Comprehensive (Loss) Income for each of the three years ended May 30, 2020, June 1, 2019 and June 2, 2018.
Consolidated Statements of Cash Flows for each of the three years ended May 30, 2020, June 1, 2019 and June 2, 2018.
Consolidated Statements of Stockholders’ Equity for each of the three years ended May 30, 2020, June 1, 2019 and June 2, 2018.
Notes to Consolidated Financial Statements.
Report of BDO USA, LLP, Independent Registered Public Accounting Firm.
|
|
(2) |
Index to Financial Statement Schedules: |
All schedules have been omitted because the required information is included in the consolidated financial statements or the notes thereto, or is not applicable or required.
None
60
|
Exhibit Number |
|
Description |
|
|
|
|
|
2(a) |
|
|
|
|
|
|
|
2(b) |
|
|
|
|
|
|
|
2(c) |
|
|
|
|
|
|
|
3(a) |
|
|
|
|
|
|
|
3(b) |
|
|
|
|
|
|
|
4* |
|
|
|
|
|
|
|
10(a) † |
|
|
|
|
|
|
|
10(a)(i) † |
|
|
|
|
|
|
|
10(a)(ii)† |
|
|
|
|
|
|
|
10(b) † |
|
|
|
|
|
|
|
10(c) † |
|
|
|
|
|
|
|
10(d) † |
|
|
|
|
|
|
|
10(d)(i) † |
|
|
|
|
|
|
|
10(e) † |
|
|
|
|
|
|
|
10(f) † |
|
|
|
|
|
|
|
10(g) † |
|
61
|
|
|
|
|
10(g)(i) † |
|
|
|
|
|
|
|
10(g)(ii) † |
|
|
|
|
|
|
|
10(h) † |
|
|
|
|
|
|
|
10(i) † |
|
|
|
|
|
|
|
10(j) † |
|
|
|
|
|
|
|
10(k) † |
|
|
|
|
|
|
|
10(l) † |
|
|
|
|
|
|
|
10.1 † |
|
|
|
|
|
|
|
10.2 †* |
|
|
|
|
|
|
|
14 |
|
Corporate Code of Conduct (incorporated by reference to and Form 8-K filed on June 4, 2012). |
|
|
|
|
|
21* |
|
|
|
|
|
|
|
23.1* |
|
Consent of Independent Registered Public Accounting Firm - BDO USA, LLP. |
|
|
|
|
|
31.1* |
|
|
|
|
|
|
|
31.2* |
|
|
|
|
|
|
|
32* |
|
Certifications pursuant to Section 906 of the Sarbanes-Oxley Act of 2002 (filed pursuant to Part I). |
|
|
|
|
|
101* |
|
The following financial information from our Annual Report on Form 10-K for the fourth quarter and fiscal year ended May 30, 2020, filed with the SEC on August 3, 2020, formatted in Extensible Business Reporting Language (XBRL): (i) the Consolidated Balance Sheets, (ii) the Consolidated Statements of (Loss) Income and Comprehensive (Loss) Income, (iii) the Consolidated Statements of Cash Flows, (iv) the Consolidated Statement of Stockholder’s Equity and (v) Notes to Consolidated Financial Statements. |
|
† |
Executive Compensation Plan or Agreement |
|
* |
Filed herewith |
62
Pursuant to the requirements of Section 13 or 15(d) of the Securities Exchange Act of 1934, the registrant has duly caused this report to be signed on its behalf by the undersigned, thereunto duly authorized.
|
|
Signature |
|
Title |
|
Date |
|
|
|
|
|
|
|
|
By: |
/s/ Edward J. Richardson |
|
Chairman of the Board, Chief Executive Officer |
|
August 3, 2020 |
|
|
Edward J. Richardson |
|
(Principal Executive Officer), President and Director |
|
|
Pursuant to the requirements of the Securities Exchange Act of 1934, this report has been signed below by the following persons on behalf of the registrant and in the capacities and on the dates indicated.
|
Signature |
|
Title |
|
Date |
|
|
|
|
|
|
|
/s/ Edward J. Richardson |
|
Chairman of the Board, Chief Executive Officer |
|
August 3, 2020 |
|
Edward J. Richardson |
|
(Principal Executive Officer), President and Director |
|
|
|
|
|
|
|
|
|
/s/ Robert J. Ben |
|
Chief Financial Officer and Chief Accounting Officer |
|
August 3, 2020 |
|
Robert J. Ben |
|
(Principal Financial and Accounting Officer) |
|
|
|
|
|
|
|
|
|
/s/ Paul J. Plante |
|
Director |
|
August 3, 2020 |
|
Paul J. Plante |
|
|
|
|
|
|
|
|
|
|
|
/s/ Jacques Belin |
|
Director |
|
August 3, 2020 |
|
Jacques Belin |
|
|
|
|
|
|
|
|
|
|
|
/s/ James Benham |
|
Director |
|
August 3, 2020 |
|
James Benham |
|
|
|
|
|
|
|
|
|
|
|
/s/ Kenneth Halverson |
|
Director |
|
August 3, 2020 |
|
Kenneth Halverson |
|
|
|
|
|
|
|
|
|
|
|
/s/ Robert Kluge |
|
Director |
|
August 3, 2020 |
|
Robert Kluge |
|
|
|
|
63