Attached files
| file | filename |
|---|---|
| EX-99.1 - EX-99.1 - SOUTH STATE Corp | ssb-20200730xex99d1.htm |
| 8-K - 8-K - SOUTH STATE Corp | ssb-20200730x8k.htm |
| Earnings Call 2Q 2020 Friday, July 31, 2020 Exhibit 99.2 |

| Disclaimer Statements included in this communication, which are not historical in nature are intended to be, and are hereby identified as, forward looking statements for purposes of the safe harbor provided by Section 27A of the Securities Act of 1933 and Section 21E of the Securities Exchange Act of 1934. Forward looking statements are based on, among other things, management’s beliefs, assumptions, current expectations, estimates and projections about the financial services industry, the economy and South State. Words and phrases such as “may,” “approximately,” “continue,” “should,” “expects,” “projects,” “anticipates,” “is likely,” “look ahead,” “look forward,” “believes,” “will,” “intends,” “estimates,” “strategy,” “plan,” “could,” “potential,” “possible” and variations of such words and similar expressions are intended to identify such forward-looking statements. South State cautions readers that forward looking statements are subject to certain risks, uncertainties and assumptions that are difficult to predict with regard to, among other things, timing, extent, likelihood and degree of occurrence, which could cause actual results to differ materially from anticipated results. Such risks, uncertainties and assumptions, include, among others, the following: (1) economic downturn risk, potentially resulting in deterioration in the credit markets, greater than expected noninterest expenses, excessive loan losses and other negative consequences, which risks could be exacerbated by potential negative economic developments resulting from federal spending cuts and/or one or more federal budget-related impasses or actions; (2) increased expenses, loss of revenues, and increased regulatory scrutiny associated with our total assets having exceeded $10.0 billion; (3) controls and procedures risk, including the potential failure or circumvention of our controls and procedures or failure to comply with regulations related to controls and procedures; (4) ownership dilution risk associated with potential acquisitions in which South State’s stock may be issued as consideration for an acquired company; (5) potential deterioration in real estate values; (6) the impact of competition with other financial institutions, including pricing pressures (including those resulting from the CARES Act) and the resulting impact, including as a result of compression to net interest margin; (7) credit risks associated with an obligor’s failure to meet the terms of any contract with the bank or otherwise fail to perform as agreed under the terms of any loan-related document; (8) interest risk involving the effect of a change in interest rates on the bank’s earnings, the market value of the bank’s loan and securities portfolios, and the market value of South State’s equity; (9) liquidity risk affecting the bank’s ability to meet its obligations when they come due; (10) risks associated with an anticipated increase in South State’s investment securities portfolio, including risks associated with acquiring and holding investment securities or potentially determining that the amount of investment securities South State desires to acquire are not available on terms acceptable to South State; (11) price risk focusing on changes in market factors that may affect the value of traded instruments in “mark-to-market” portfolios; (12) transaction risk arising from problems with service or product delivery; (13) compliance risk involving risk to earnings or capital resulting from violations of or nonconformance with laws, rules, regulations, prescribed practices, or ethical standards; (14) regulatory change risk resulting from new laws, rules, regulations, accounting principles, proscribed practices or ethical standards, including, without limitation, the possibility that regulatory agencies may require higher levels of capital above the current regulatory-mandated minimums and including the impact of the recently enacted CARES Act, the Consumer Financial Protection Bureau rules and regulations, and the possibility of changes in accounting standards, policies, principles and practices, including changes in accounting principles relating to loan loss recognition (CECL); (15) strategic risk resulting from adverse business decisions or improper implementation of business decisions; (16) reputation risk that adversely affects earnings or capital arising from negative public opinion; (17) terrorist activities risk that results in loss of consumer confidence and economic disruptions; (18) cybersecurity risk related to the dependence of South State on internal computer systems and the technology of outside service providers, as well as the potential impacts of third party security breaches, subjects each company to potential business disruptions or financial losses resulting from deliberate attacks or unintentional events; (19) greater than expected noninterest expenses; (20) noninterest income risk resulting from the effect of regulations that prohibit financial institutions from charging consumer fees for paying overdrafts on ATM and one-time debit card transactions, unless the consumer consents or opts‑in to the overdraft service for those types of transactions; (21) excessive loan losses; (22) failure to realize synergies and other financial benefits from, and to limit liabilities associated with, mergers and acquisitions within the expected time frame; (23) potential deposit attrition, higher than expected costs, customer loss and business disruption associated with merger and acquisition integration, including, without limitation, and potential difficulties in maintaining relationships with key personnel; (24) the risks of fluctuations in market prices for South State common stock that may or may not reflect economic condition or performance of South State; (25) the payment of dividends on South State common stock is subject to regulatory supervision as well as the discretion of the board of directors of South State, South State’s performance and other factors; (26) operational, technological, cultural, regulatory, legal, credit and other risks associated with the exploration, consummation and integration of potential future acquisition, whether involving stock or cash consideration; (27) major catastrophes such as earthquakes, floods or other natural or human disasters, including infectious disease outbreaks, including the recent outbreak of a novel strain of coronavirus, a respiratory illness, the related disruption to local, regional and global economic activity and financial markets, and the impact that any of the foregoing may have on South State and its customers and other constituencies; and (28) risks related to the merger of South State and CenterState, including, among others, (i) the risk that the cost savings and any revenue synergies from the merger may not be fully realized or may take longer than anticipated to be realized, (ii) the risk that the integration of each party’s operations will be materially delayed or will be more costly or difficult than expected or that the parties are otherwise unable to successfully integrate each party’s businesses into the other’s businesses, (iii) the amount of the costs, fees, expenses and charges related to the merger, (iv) reputational risk and the reaction of each company's customers, suppliers, employees or other business partners to the merger, and (29) other factors that may affect future results of South State and CenterState, as disclosed in South State’s Annual Report on Form 10-K, as amended, Quarterly Reports on Form 10-Q, and Current Reports on Form 8-K, and CenterState’s Annual Report on Form 10-K, Quarterly Reports on Form 10-Q, and Current Reports on Form 8-K, in each case filed by South State or CenterState, as applicable, with the U.S. Securities and Exchange Commission (“SEC”) and available on the SEC’s website at http://www.sec.gov, any of which could cause actual results to differ materially from future results expressed, implied or otherwise anticipated by such forward-looking statements. All forward-looking statements speak only as of the date they are made and are based on information available at that time. South State does not undertake any obligation to update or otherwise revise any forward-looking statements, whether as a result of new information, future events, or otherwise, except as required by federal securities laws. As forward-looking statements involve significant risks and uncertainties, caution should be exercised against placing undue reliance on such statements. The combined historical information referred to in this presentation as the “Combined Business Basis” is presented based on the reported GAAP results of the Company and CenterState for the applicable periods without adjustment. The Combined Business Basis financial information included in this release has not been prepared in accordance with Article 11 of Regulation S-X, and therefore does not reflect any of the pro forma adjustments that would be required thereby. All Combined Business Basis financial information should be reviewed in connection the historical information of the Company and CenterState, as applicable, included in the Appendix to this presentation. |
| How We Operate the Company Soundness Profitability Growth |
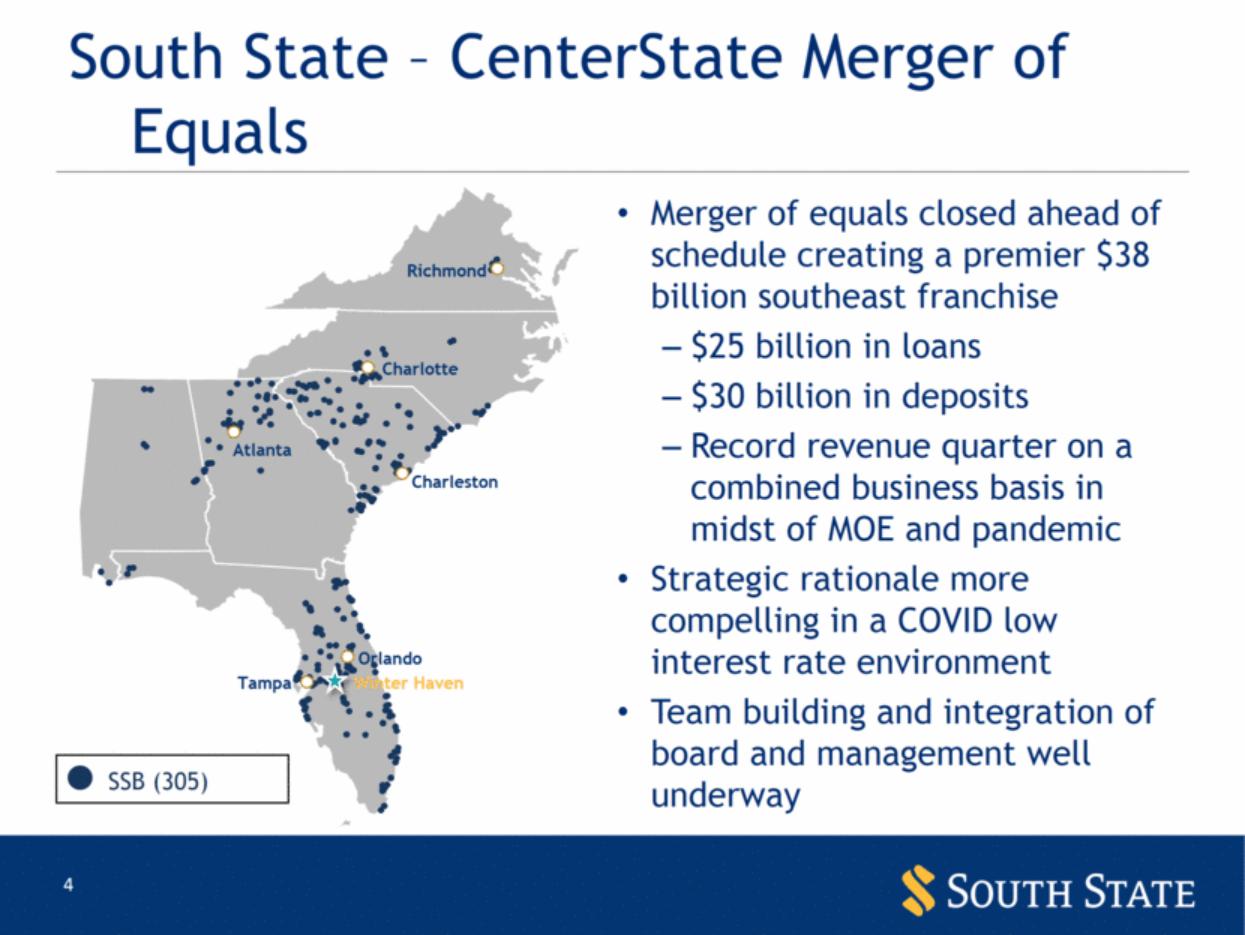
| South State – CenterState Merger of Equals Winter Haven Tampa Orlando Charleston Atlanta Charlotte Richmond SSB (305) Merger of equals closed ahead of schedule creating a premier $38 billion southeast franchise $25 billion in loans $30 billion in deposits Record revenue quarter on a combined business basis in midst of MOE and pandemic Strategic rationale more compelling in a COVID low interest rate environment Team building and integration of board and management well underway |
| Quarterly Highlights Strong and consistent Pre-Provision Net Revenue (“PPNR”) performance across the two combined companies Significant loss absorption capacity exists through allowance and credit marks Credit metrics remain solid, with low losses and low past dues Liquidity at bank and holding company very strong $4.3 billion cash/FFS at bank $294 million cash at parent company Completion of $200 million sub debt offering at CenterState in May, prior to MOE closing CECL merger accounting and $151 million provision expense, $120 million of which was for acquired non-PCD loans & UFC (day 1 impact plus Q2 expense), led to reported net loss |
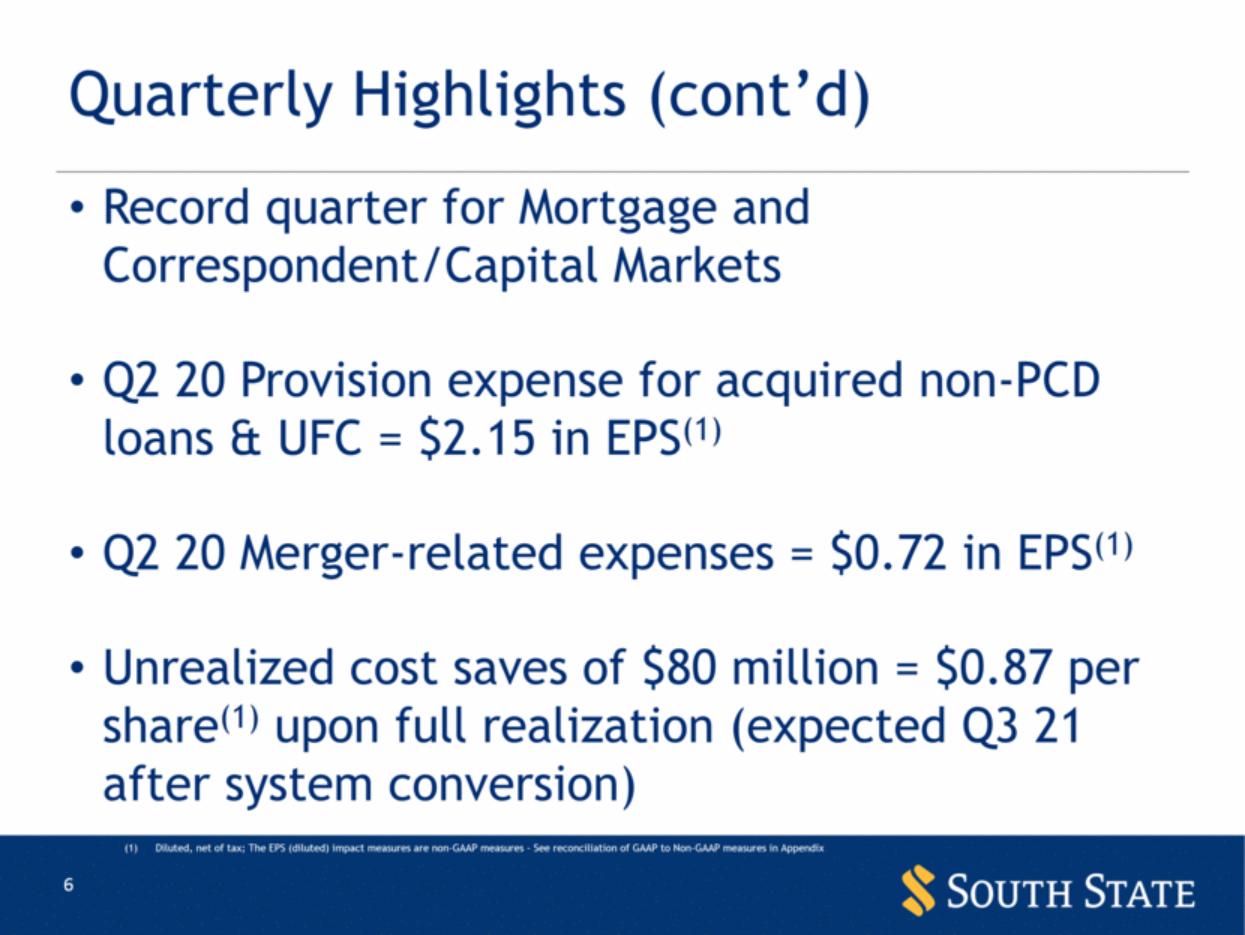
| Quarterly Highlights (cont’d) Record quarter for Mortgage and Correspondent/Capital Markets Q2 20 Provision expense for acquired non-PCD loans & UFC = $2.15 in EPS(1) Q2 20 Merger-related expenses = $0.72 in EPS(1) Unrealized cost saves of $80 million = $0.87 per share(1) upon full realization (expected Q3 21 after system conversion) Diluted, net of tax; The EPS (diluted) impact measures are non-GAAP measures - See reconciliation of GAAP to Non-GAAP measures in Appendix |
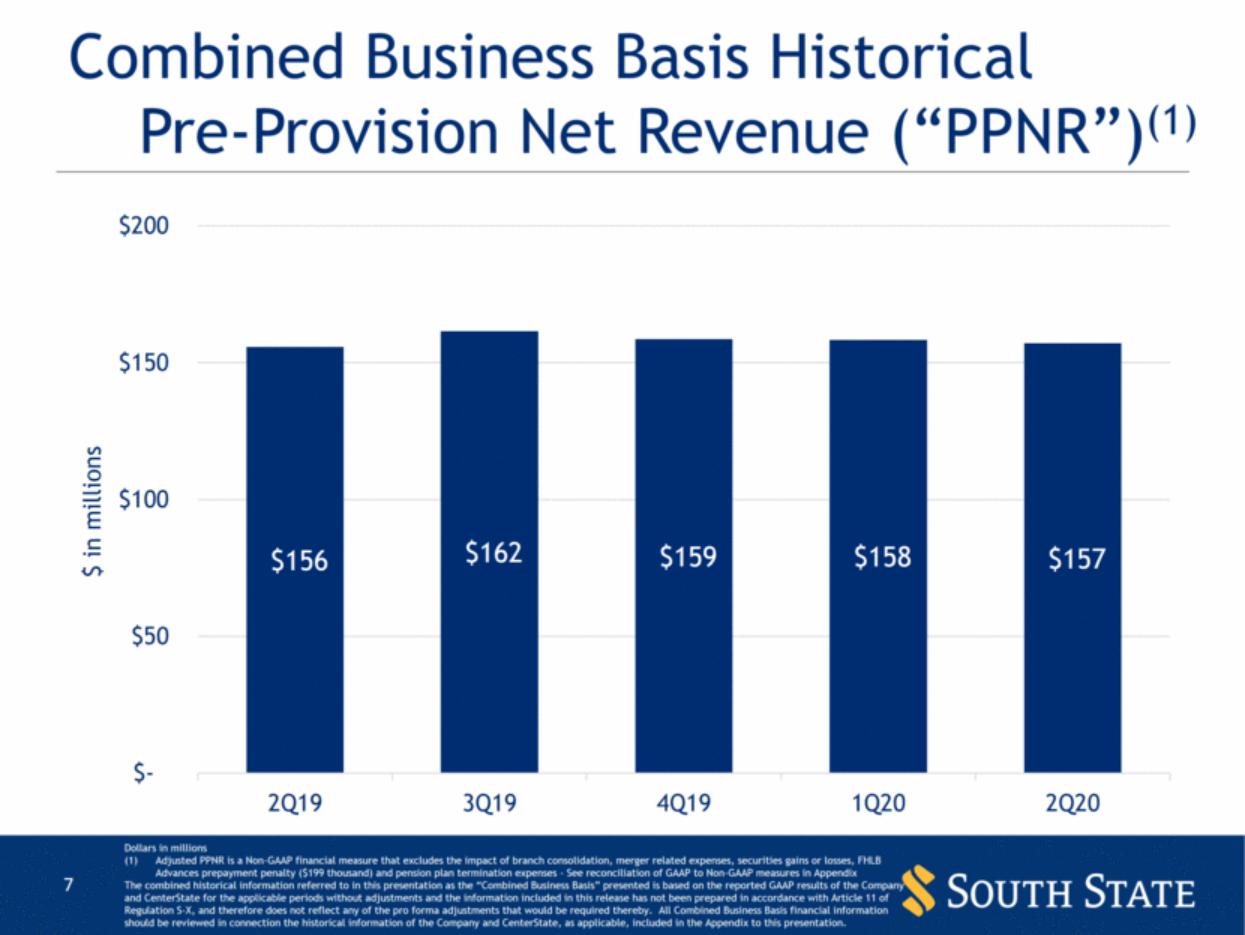
| Combined Business Basis Historical Pre-Provision Net Revenue (“PPNR”)(1) Dollars in millions Adjusted PPNR is a Non-GAAP financial measure that excludes the impact of branch consolidation, merger related expenses, securities gains or losses, FHLB Advances prepayment penalty ($199 thousand) and pension plan termination expenses - See reconciliation of GAAP to Non-GAAP measures in Appendix The combined historical information referred to in this presentation as the “Combined Business Basis” presented is based on the reported GAAP results of the Company and CenterState for the applicable periods without adjustments and the information included in this release has not been prepared in accordance with Article 11 of Regulation S-X, and therefore does not reflect any of the pro forma adjustments that would be required thereby. All Combined Business Basis financial information should be reviewed in connection the historical information of the Company and CenterState, as applicable, included in the Appendix to this presentation. $156 $162 $159 $158 $157 $- $50 $100 $150 $200 2Q19 3Q19 4Q19 1Q20 2Q20 $ in millions |
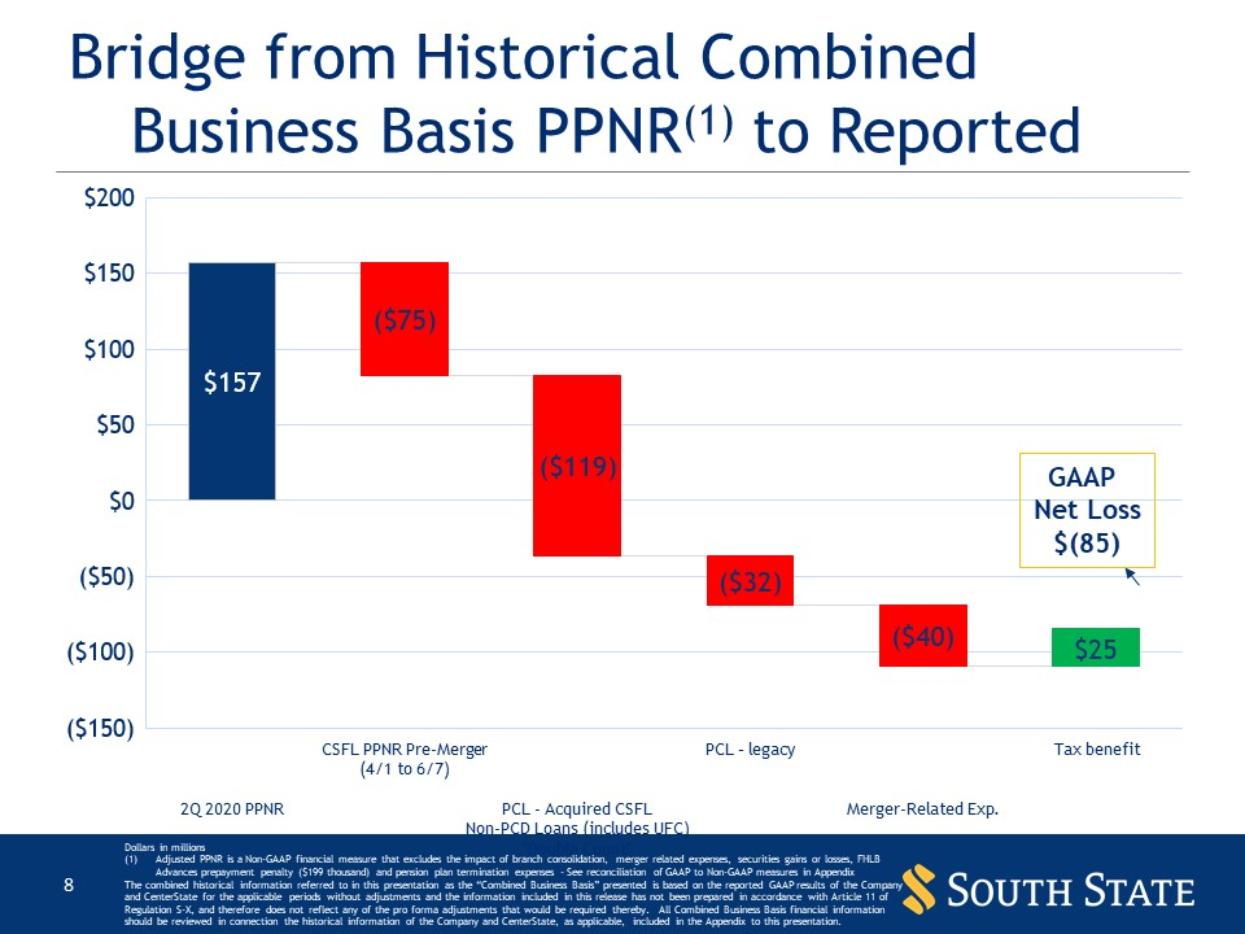
| Bridge from Historical Combined Business Basis PPNR(1) to Reported Dollars in millions Adjusted PPNR is a Non-GAAP financial measure that excludes the impact of branch consolidation, merger related expenses, securities gains or losses, FHLB Advances prepayment penalty ($199 thousand) and pension plan termination expenses - See reconciliation of GAAP to Non-GAAP measures in Appendix The combined historical information referred to in this presentation as the “Combined Business Basis” presented is based on the reported GAAP results of the Company and CenterState for the applicable periods without adjustments and the information included in this release has not been prepared in accordance with Article 11 of Regulation S-X, and therefore does not reflect any of the pro forma adjustments that would be required thereby. All Combined Business Basis financial information should be reviewed in connection the historical information of the Company and CenterState, as applicable, included in the Appendix to this presentation. GAAP Net Loss $(85) The image part with relationship ID rId4 was not found in the file. |
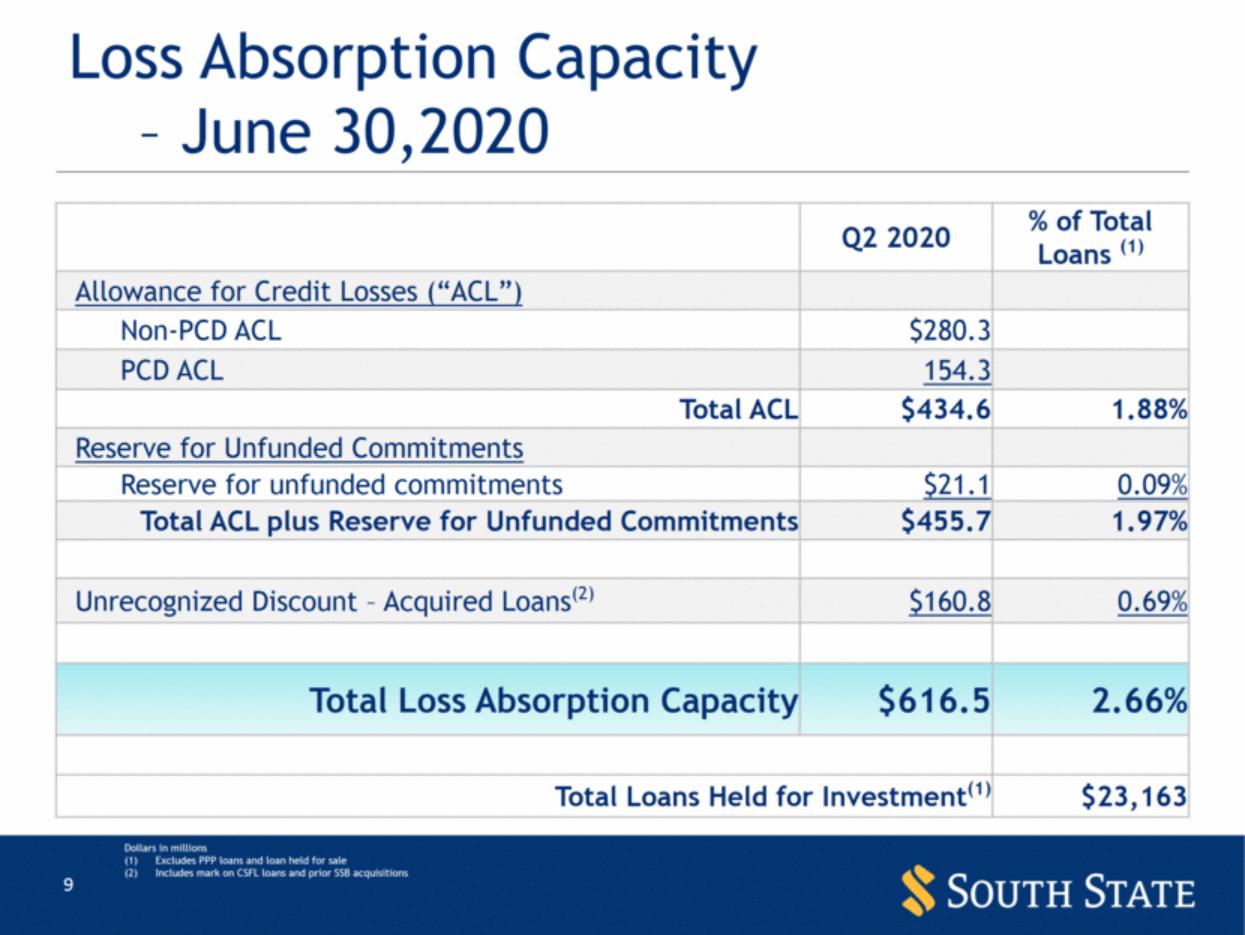
| Loss Absorption Capacity – June 30,2020 Dollars in millions Excludes PPP loans and loan held for sale Includes mark on CSFL loans and prior SSB acquisitions Q2 2020 % of Total Loans (1) Allowance for Credit Losses (“ACL”) Non-PCD ACL $280.3 PCD ACL 154.3 Total ACL $434.6 1.88% Reserve for Unfunded Commitments Reserve for unfunded commitments $21.1 0.09% Total ACL plus Reserve for Unfunded Commitments $455.7 1.97% Unrecognized Discount – Acquired Loans(2) $160.8 0.69% Total Loss Absorption Capacity $616.5 2.66% Total Loans Held for Investment(1) $23,163 |
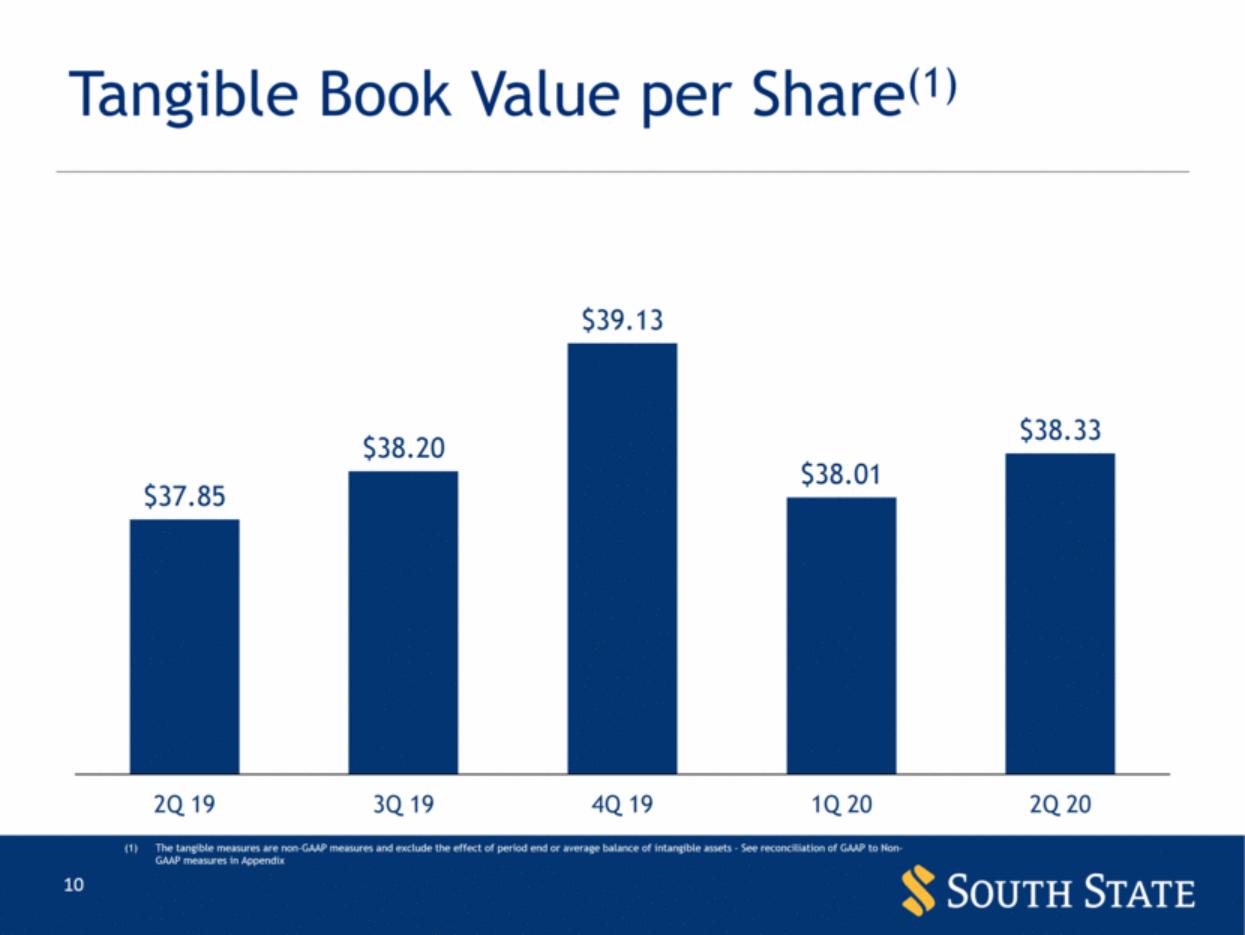
| Tangible Book Value per Share(1) The tangible measures are non-GAAP measures and exclude the effect of period end or average balance of intangible assets - See reconciliation of GAAP to Non-GAAP measures in Appendix $37.85 $38.20 $39.13 $38.01 $38.33 2Q 19 3Q 19 4Q 19 1Q 20 2Q 20 |
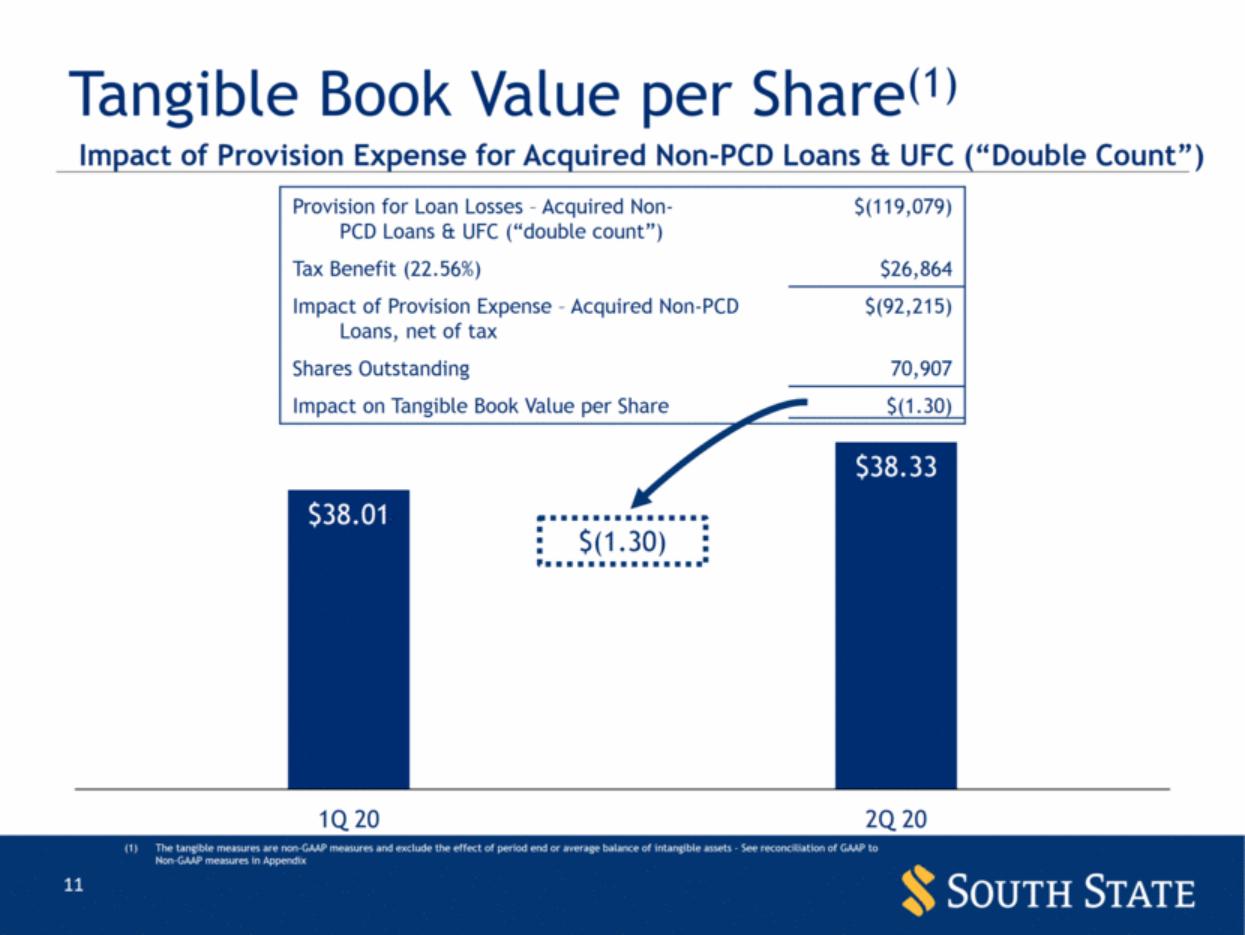
| Tangible Book Value per Share(1) $(1.30) Provision for Loan Losses – Acquired Non- PCD Loans & UFC (“double count”) $(119,079) Tax Benefit (22.56%) $26,864 Impact of Provision Expense – Acquired Non-PCD Loans, net of tax $(92,215) Shares Outstanding 70,907 Impact on Tangible Book Value per Share $(1.30) Impact of Provision Expense for Acquired Non-PCD Loans & UFC (“Double Count”) The tangible measures are non-GAAP measures and exclude the effect of period end or average balance of intangible assets - See reconciliation of GAAP to Non-GAAP measures in Appendix $38.01 $38.33 1Q 20 2Q 20 |
| Financial Highlights - Reported |

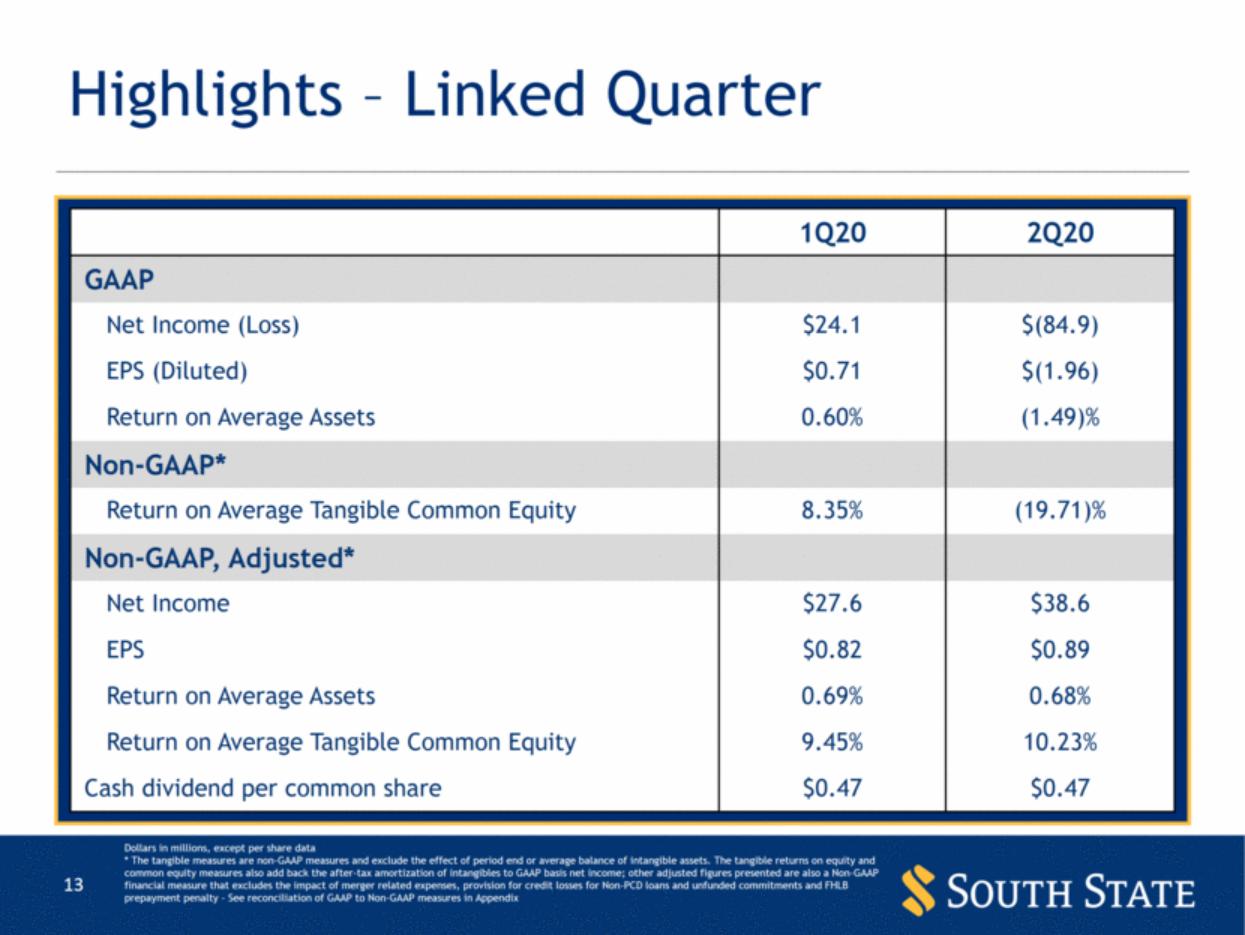
| 1Q20 2Q20 GAAP Net Income (Loss) $24.1 $(84.9) EPS (Diluted) $0.71 $(1.96) Return on Average Assets 0.60% (1.49)% Non-GAAP* Return on Average Tangible Common Equity 8.35% (19.71)% Non-GAAP, Adjusted* Net Income $27.6 $38.6 EPS $0.82 $0.89 Return on Average Assets 0.69% 0.68% Return on Average Tangible Common Equity 9.45% 10.23% Cash dividend per common share $0.47 $0.47 Highlights – Linked Quarter Dollars in millions, except per share data * The tangible measures are non-GAAP measures and exclude the effect of period end or average balance of intangible assets. The tangible returns on equity and common equity measures also add back the after-tax amortization of intangibles to GAAP basis net income; other adjusted figures presented are also a Non-GAAP financial measure that excludes the impact of merger related expenses, provision for credit losses for Non-PCD loans and unfunded commitments and FHLB prepayment penalty - See reconciliation of GAAP to Non-GAAP measures in Appendix |
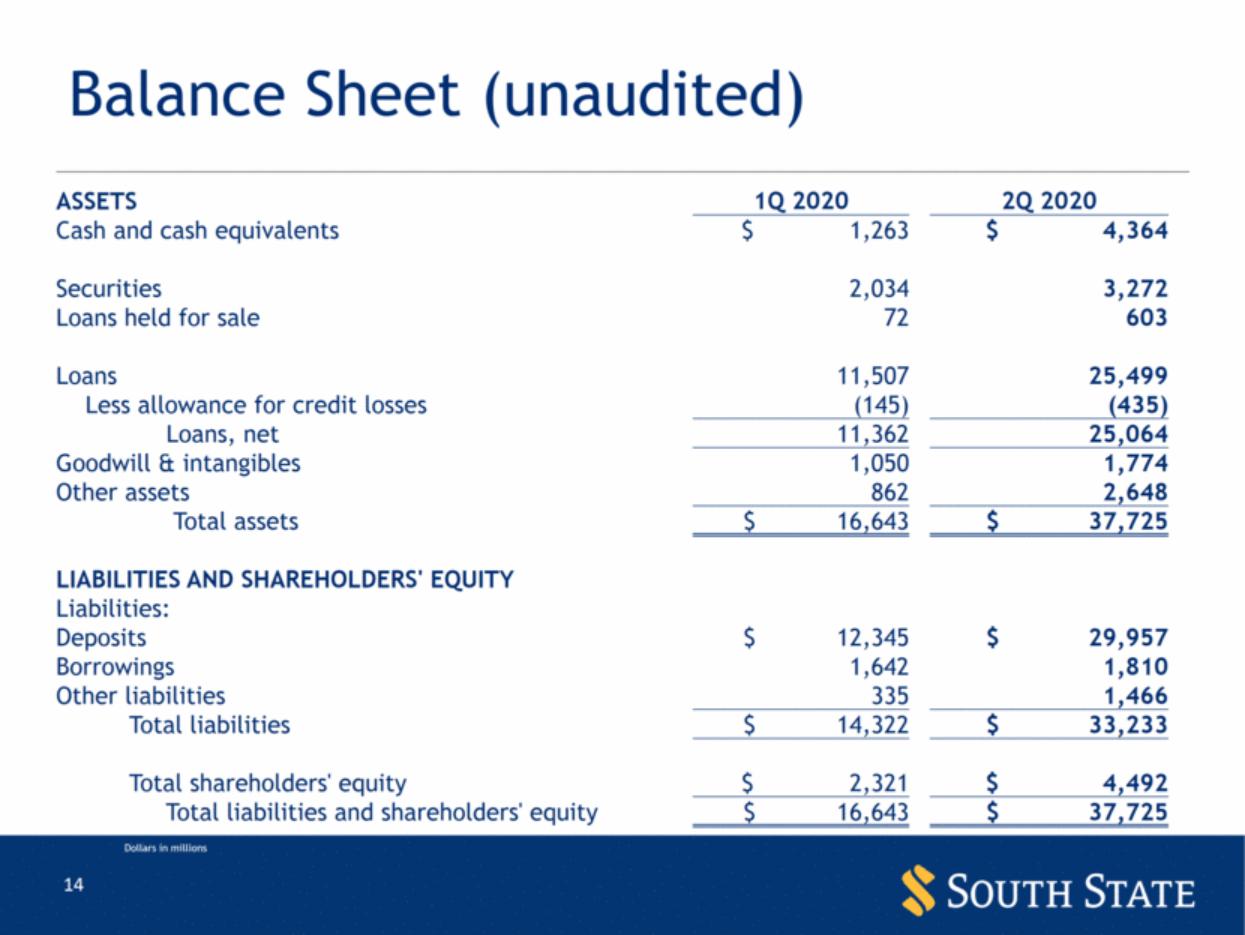
| Balance Sheet (unaudited) Dollars in millions ASSETS 1Q 2020 2Q 2020 Cash and cash equivalents $ 1,263 $ 4,364 Securities 2,034 3,272 Loans held for sale 72 603 Loans 11,507 25,499 Less allowance for credit losses (145) (435) Loans, net 11,362 25,064 Goodwill & intangibles 1,050 1,774 Other assets 862 2,648 Total assets $ 16,643 $ 37,725 LIABILITIES AND SHAREHOLDERS' EQUITY Liabilities: Deposits $ 12,345 $ 29,957 Borrowings 1,642 1,810 Other liabilities 335 1,466 Total liabilities $ 14,322 $ 33,233 Total shareholders' equity $ 2,321 $ 4,492 Total liabilities and shareholders' equity $ 16,643 $ 37,725 |
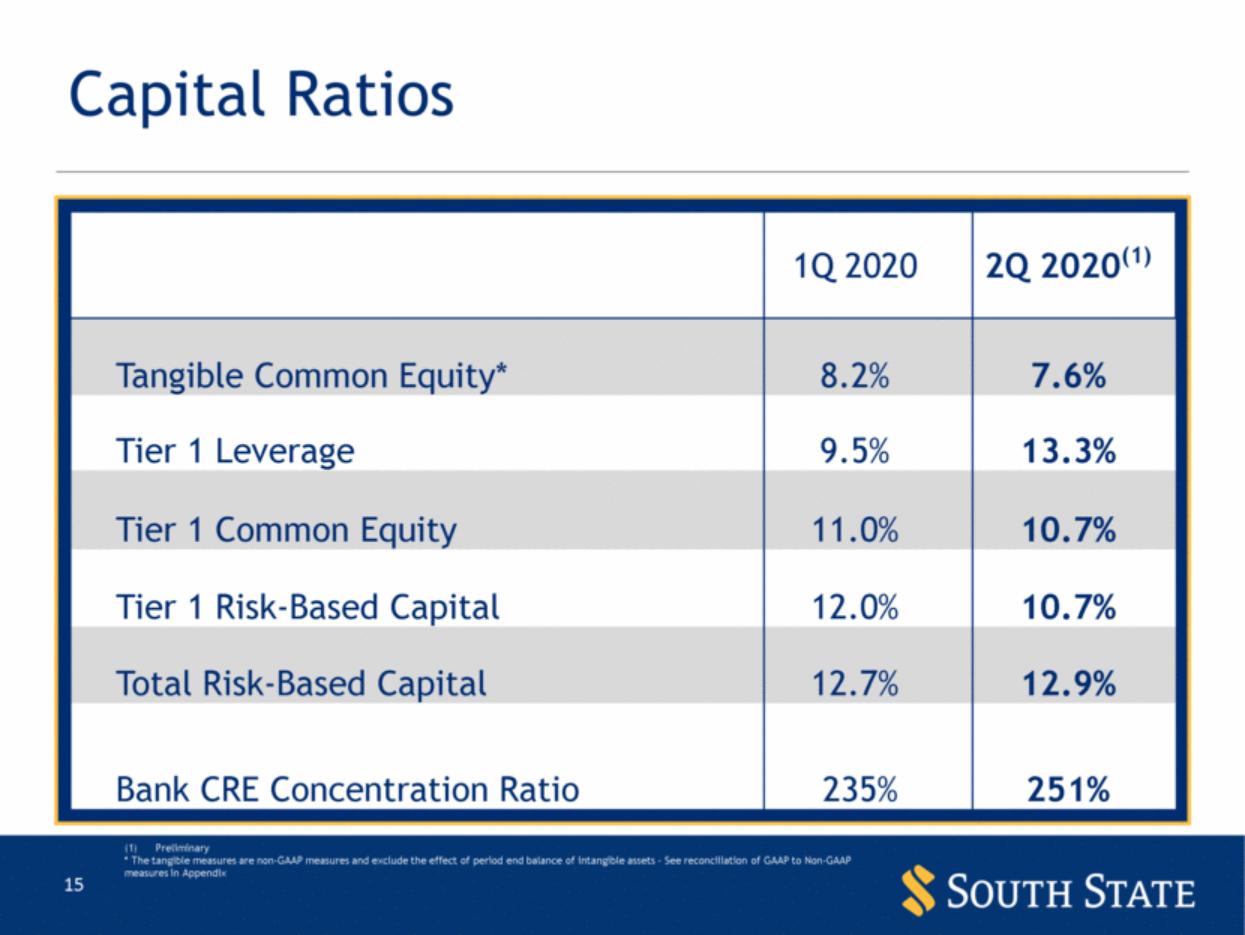
| Capital Ratios Preliminary * The tangible measures are non-GAAP measures and exclude the effect of period end balance of intangible assets - See reconciliation of GAAP to Non-GAAP measures in Appendix 1Q 2020 2Q 2020(1) Tangible Common Equity* 8.2% 7.6% Tier 1 Leverage 9.5% 13.3% Tier 1 Common Equity 11.0% 10.7% Tier 1 Risk-Based Capital 12.0% 10.7% Total Risk-Based Capital 12.7% 12.9% Bank CRE Concentration Ratio 235% 251% 15 |
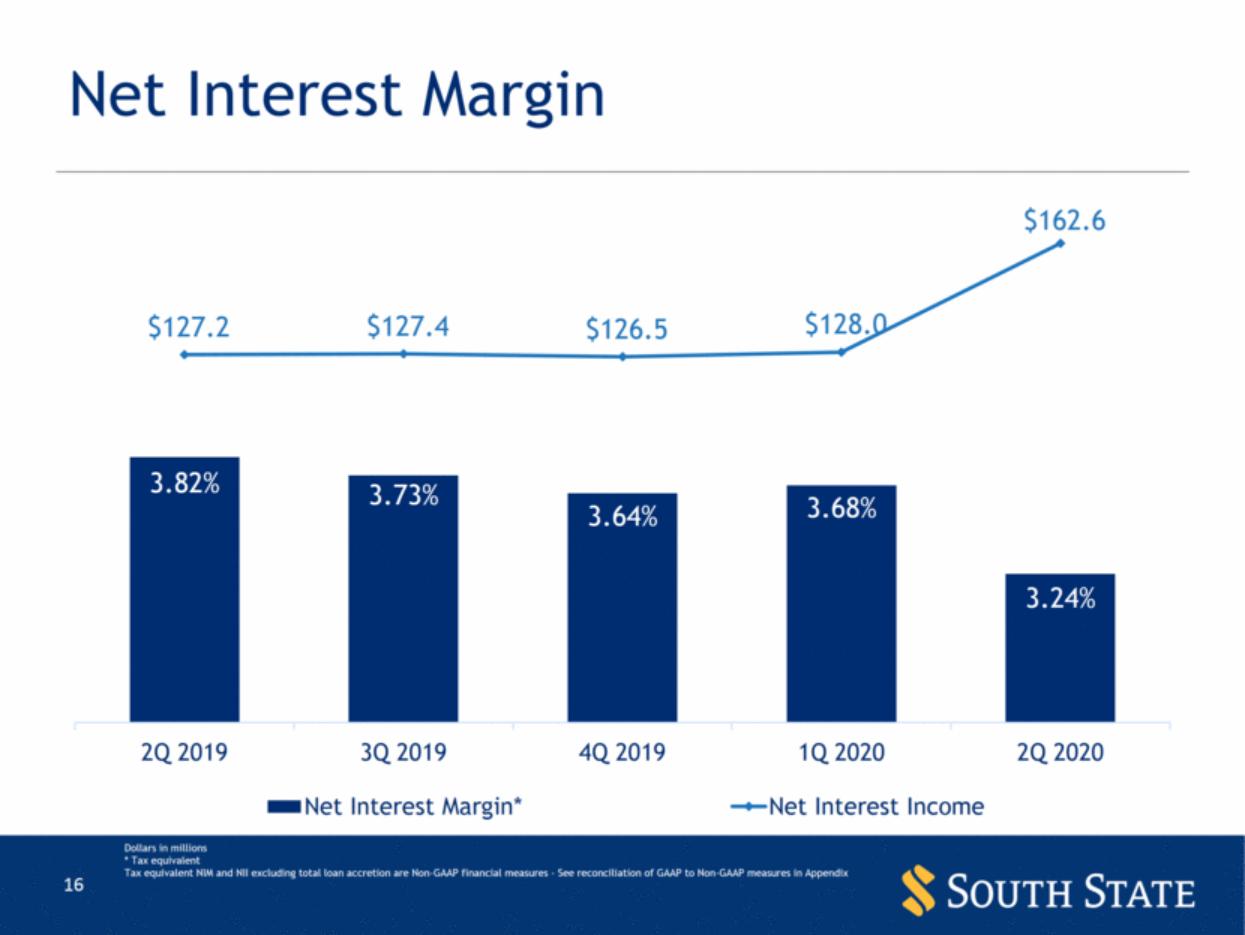
| Net Interest Margin Dollars in millions * Tax equivalent Tax equivalent NIM and NII excluding total loan accretion are Non-GAAP financial measures - See reconciliation of GAAP to Non-GAAP measures in Appendix 3.82% 3.73% 3.64% 3.68% 3.24% $127.2 $127.4 $126.5 $128.0 $162.6 2Q 2019 3Q 2019 4Q 2019 1Q 2020 2Q 2020 Net Interest Margin* Net Interest Income |
| Combined Business Basis Historical Performance |
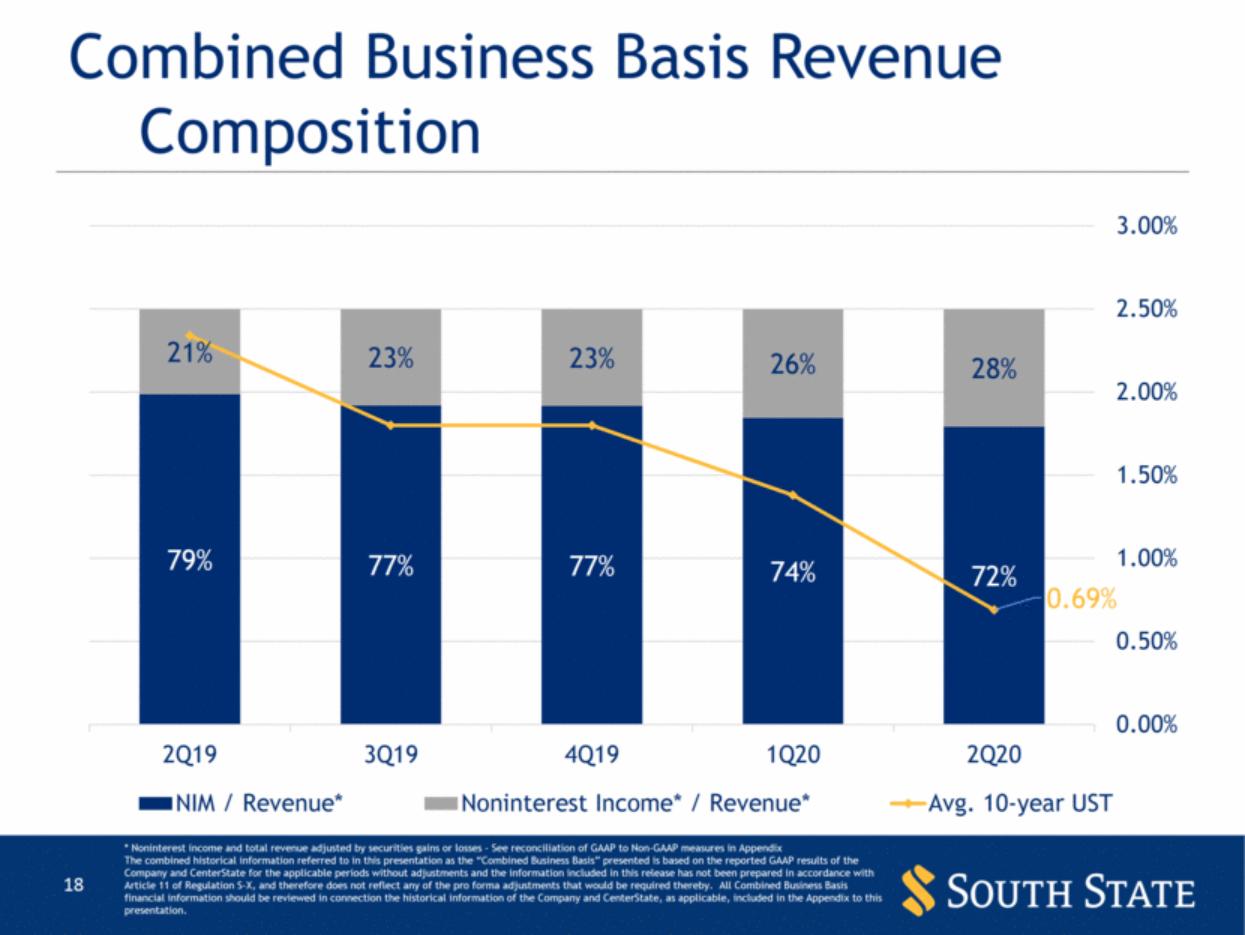
| Combined Business Basis Revenue Composition * Noninterest income and total revenue adjusted by securities gains or losses - See reconciliation of GAAP to Non-GAAP measures in Appendix The combined historical information referred to in this presentation as the “Combined Business Basis” presented is based on the reported GAAP results of the Company and CenterState for the applicable periods without adjustments and the information included in this release has not been prepared in accordance with Article 11 of Regulation S-X, and therefore does not reflect any of the pro forma adjustments that would be required thereby. All Combined Business Basis financial information should be reviewed in connection the historical information of the Company and CenterState, as applicable, included in the Appendix to this presentation. 79% 77% 77% 74% 72% 21% 23% 23% 26% 28% 0.69% 0.00% 0.50% 1.00% 1.50% 2.00% 2.50% 3.00% 0 0 0 1 1 1 1 2Q19 3Q19 4Q19 1Q20 2Q20 NIM / Revenue* Noninterest Income* / Revenue* Avg. 10-year UST |
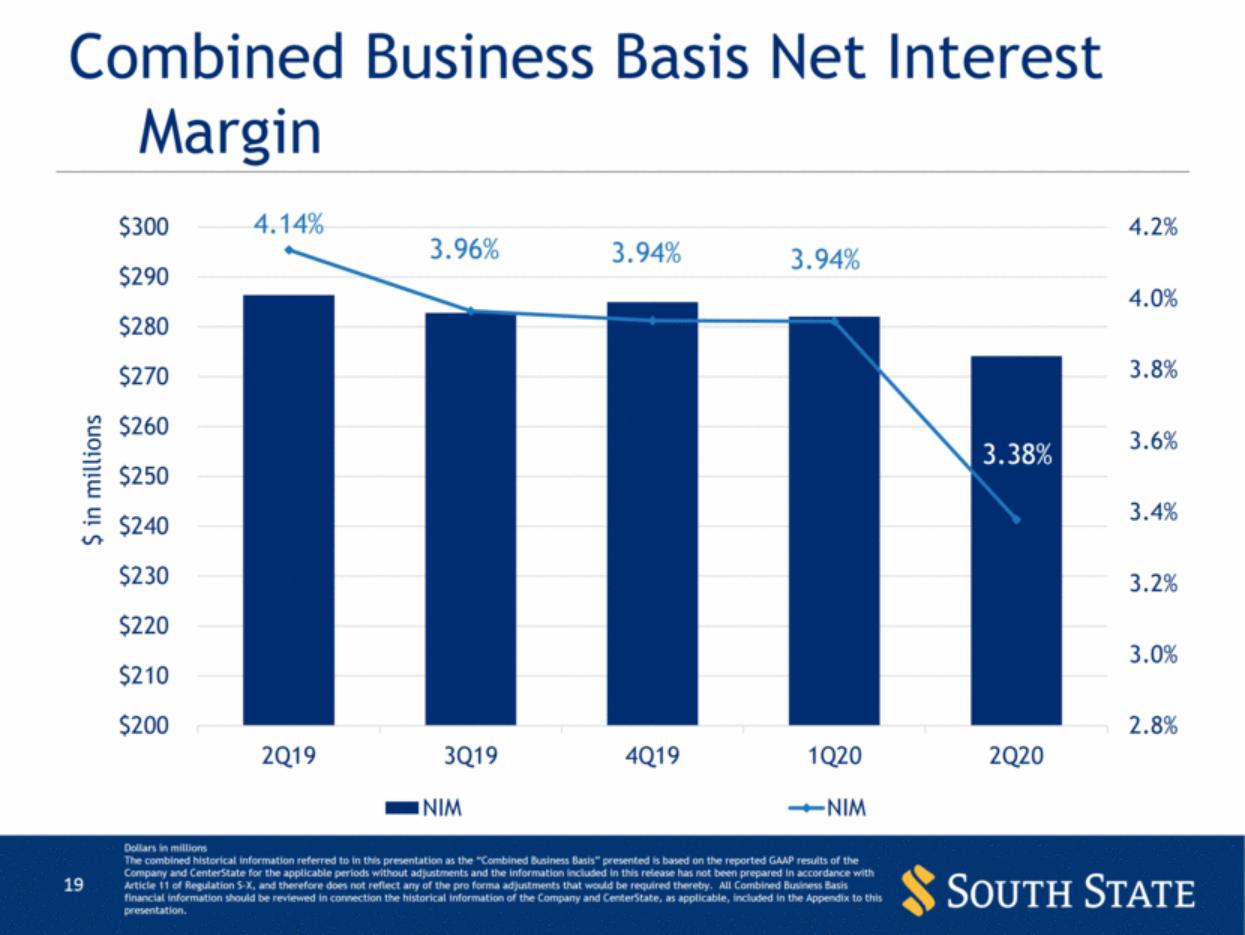
| Combined Business Basis Net Interest Margin Dollars in millions The combined historical information referred to in this presentation as the “Combined Business Basis” presented is based on the reported GAAP results of the Company and CenterState for the applicable periods without adjustments and the information included in this release has not been prepared in accordance with Article 11 of Regulation S-X, and therefore does not reflect any of the pro forma adjustments that would be required thereby. All Combined Business Basis financial information should be reviewed in connection the historical information of the Company and CenterState, as applicable, included in the Appendix to this presentation. 4.14% 3.96% 3.94% 3.94% 3.38% 2.8% 3.0% 3.2% 3.4% 3.6% 3.8% 4.0% 4.2% $200 $210 $220 $230 $240 $250 $260 $270 $280 $290 $300 2Q19 3Q19 4Q19 1Q20 2Q20 $ in millions NIM NIM |
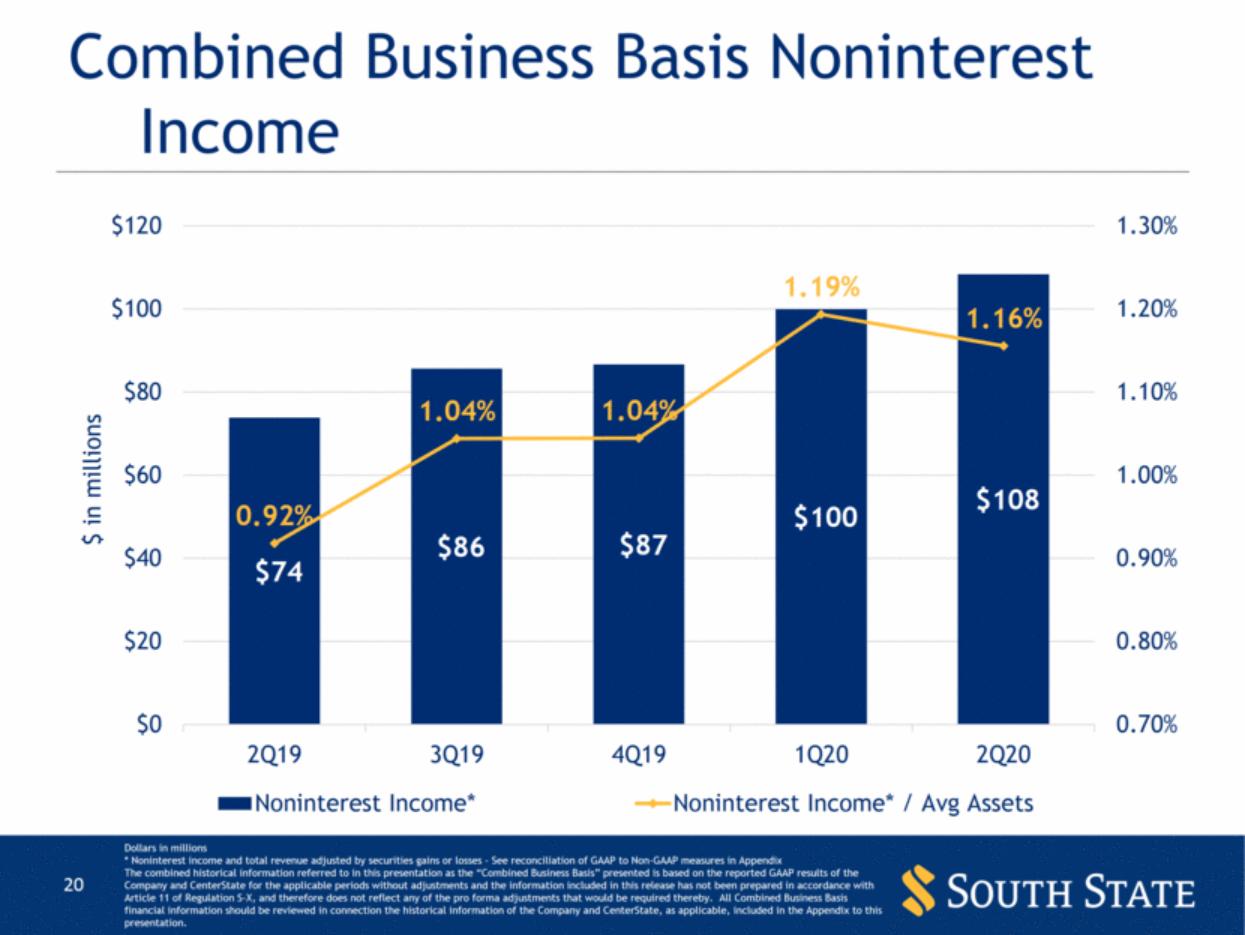
| Combined Business Basis Noninterest Income Dollars in millions * Noninterest income and total revenue adjusted by securities gains or losses - See reconciliation of GAAP to Non-GAAP measures in Appendix The combined historical information referred to in this presentation as the “Combined Business Basis” presented is based on the reported GAAP results of the Company and CenterState for the applicable periods without adjustments and the information included in this release has not been prepared in accordance with Article 11 of Regulation S-X, and therefore does not reflect any of the pro forma adjustments that would be required thereby. All Combined Business Basis financial information should be reviewed in connection the historical information of the Company and CenterState, as applicable, included in the Appendix to this presentation. $74 $86 $87 $100 $108 0.92% 1.04% 1.04% 1.19% 1.16% $0 $20 $40 $60 $80 $100 $120 2Q19 3Q19 4Q19 1Q20 2Q20 0.70% 0.80% 0.90% 1.00% 1.10% 1.20% 1.30% $ in millions Noninterest Income* Noninterest Income* / Avg Assets |
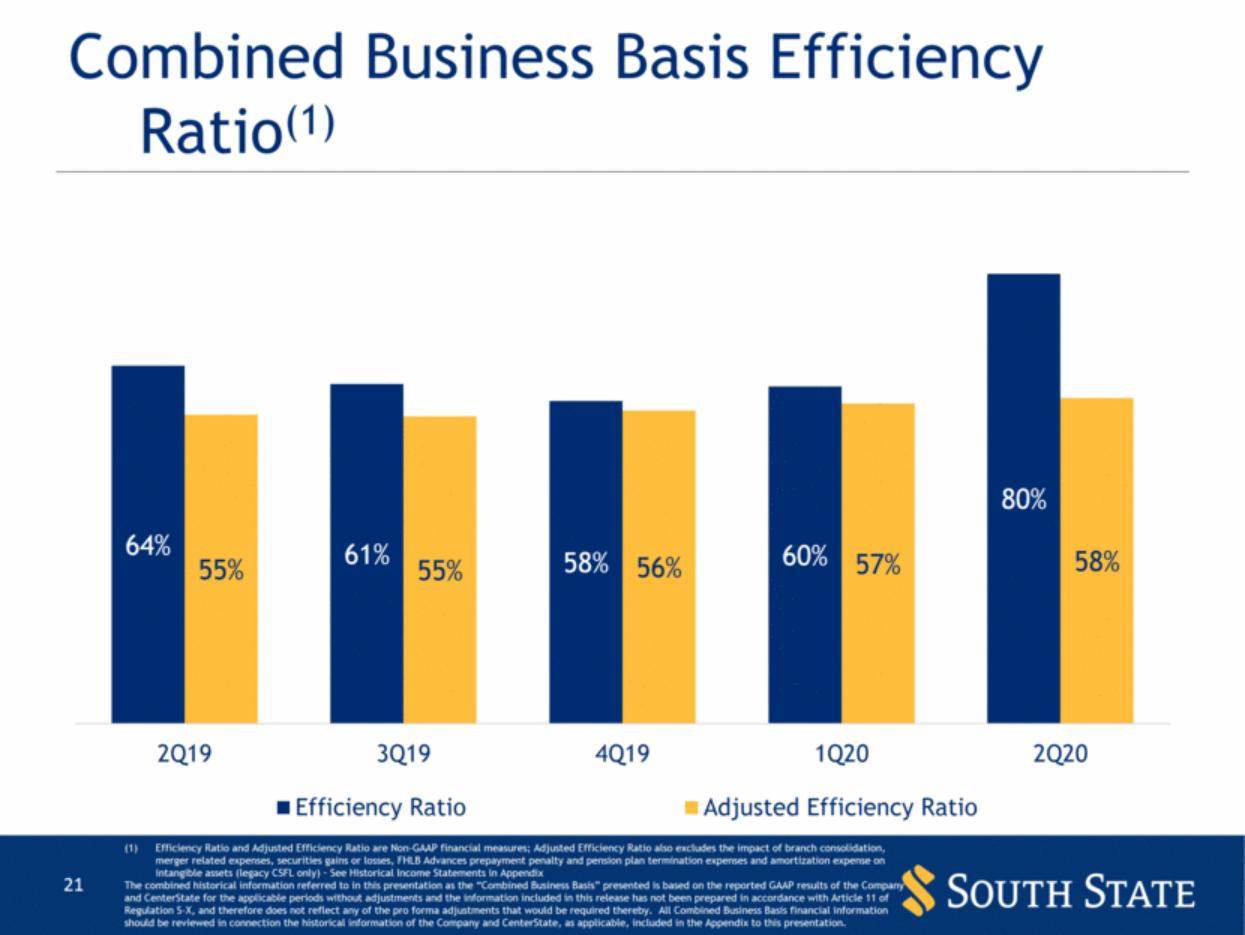
| Combined Business Basis Efficiency Ratio(1) Efficiency Ratio and Adjusted Efficiency Ratio are Non-GAAP financial measures; Adjusted Efficiency Ratio also excludes the impact of branch consolidation, merger related expenses, securities gains or losses, FHLB Advances prepayment penalty and pension plan termination expenses and amortization expense on intangible assets (legacy CSFL only) – See Historical Income Statements in Appendix The combined historical information referred to in this presentation as the “Combined Business Basis” presented is based on the reported GAAP results of the Company and CenterState for the applicable periods without adjustments and the information included in this release has not been prepared in accordance with Article 11 of Regulation S-X, and therefore does not reflect any of the pro forma adjustments that would be required thereby. All Combined Business Basis financial information should be reviewed in connection the historical information of the Company and CenterState, as applicable, included in the Appendix to this presentation. 64% 61% 58% 60% 80% 55% 55% 56% 57% 58% 2Q19 3Q19 4Q19 1Q20 2Q20 Efficiency Ratio Adjusted Efficiency Ratio |
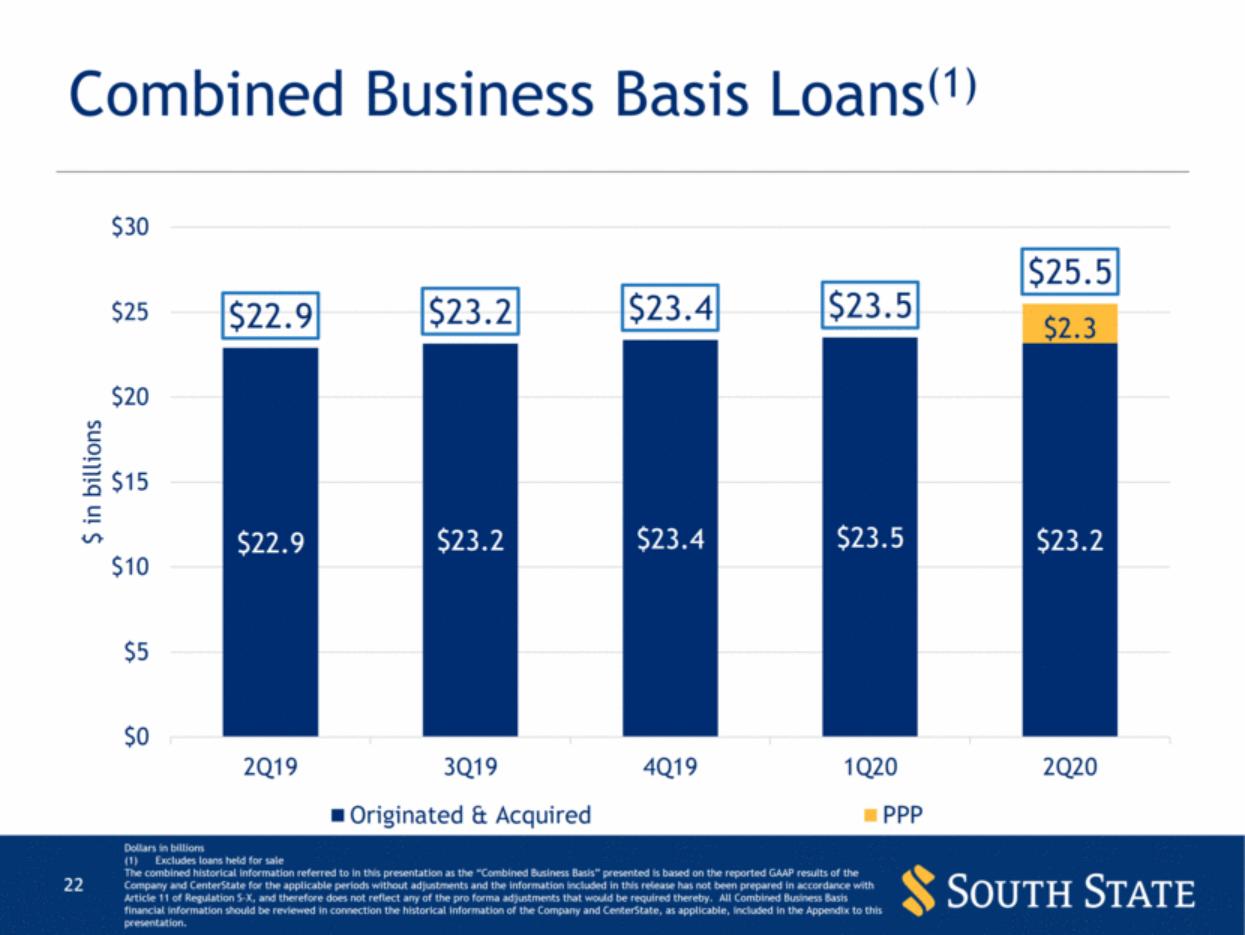
| Combined Business Basis Loans(1) Dollars in billions Excludes loans held for sale The combined historical information referred to in this presentation as the “Combined Business Basis” presented is based on the reported GAAP results of the Company and CenterState for the applicable periods without adjustments and the information included in this release has not been prepared in accordance with Article 11 of Regulation S-X, and therefore does not reflect any of the pro forma adjustments that would be required thereby. All Combined Business Basis financial information should be reviewed in connection the historical information of the Company and CenterState, as applicable, included in the Appendix to this presentation. $22.9 $23.2 $23.4 $23.5 $23.2 $2.3 $22.9 $23.2 $23.4 $23.5 $25.5 $0 $5 $10 $15 $20 $25 $30 2Q19 3Q19 4Q19 1Q20 2Q20 $ in billions Originated & Acquired PPP |
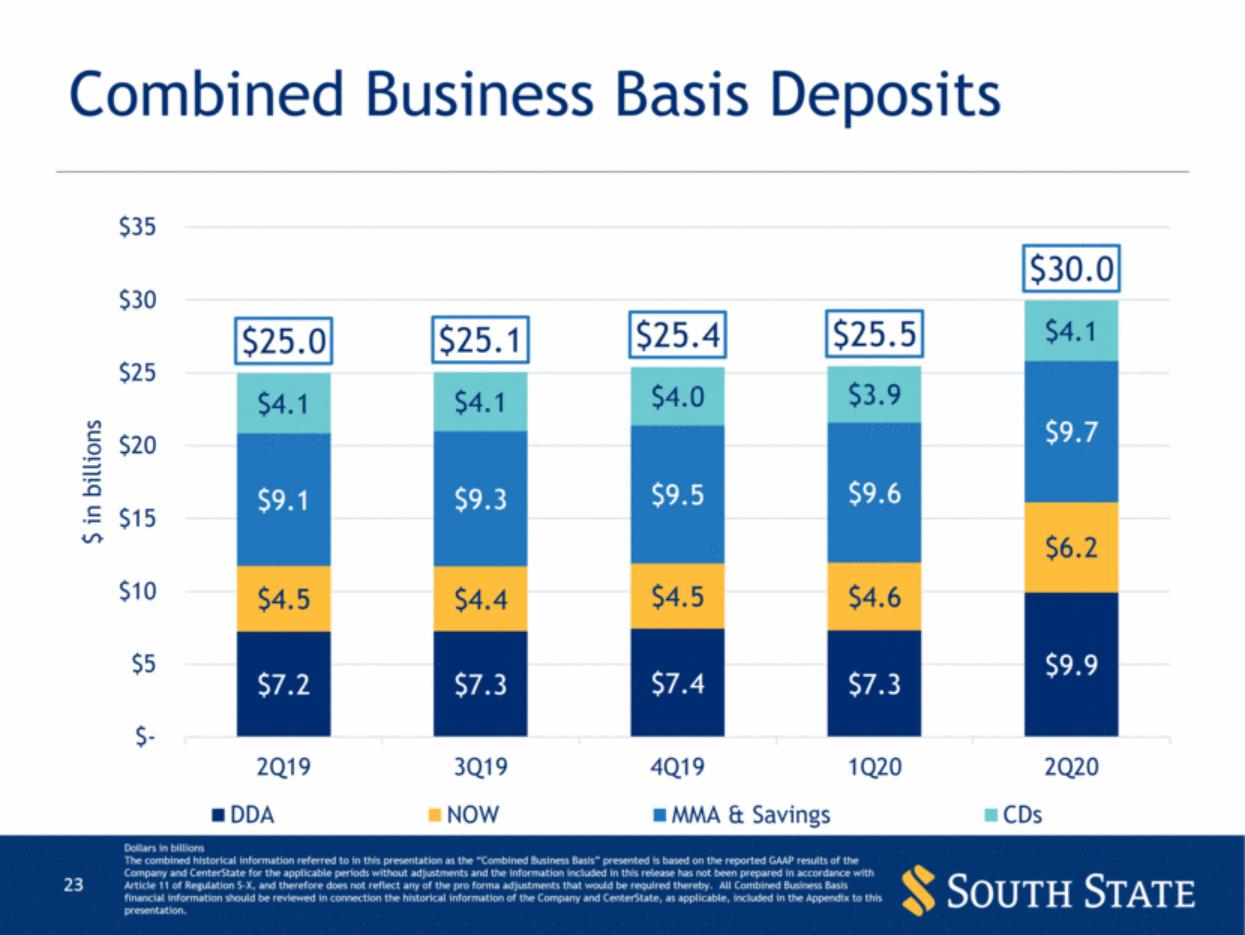
| Combined Business Basis Deposits Dollars in billions The combined historical information referred to in this presentation as the “Combined Business Basis” presented is based on the reported GAAP results of the Company and CenterState for the applicable periods without adjustments and the information included in this release has not been prepared in accordance with Article 11 of Regulation S-X, and therefore does not reflect any of the pro forma adjustments that would be required thereby. All Combined Business Basis financial information should be reviewed in connection the historical information of the Company and CenterState, as applicable, included in the Appendix to this presentation. $7.2 $7.3 $7.4 $7.3 $9.9 $4.5 $4.4 $4.5 $4.6 $6.2 $9.1 $9.3 $9.5 $9.6 $9.7 $4.1 $4.1 $4.0 $3.9 $4.1 $25.0 $25.1 $25.4 $25.5 $30.0 $- $5 $10 $15 $20 $25 $30 $35 2Q19 3Q19 4Q19 1Q20 2Q20 $ in billions DDA NOW MMA & Savings CDs |
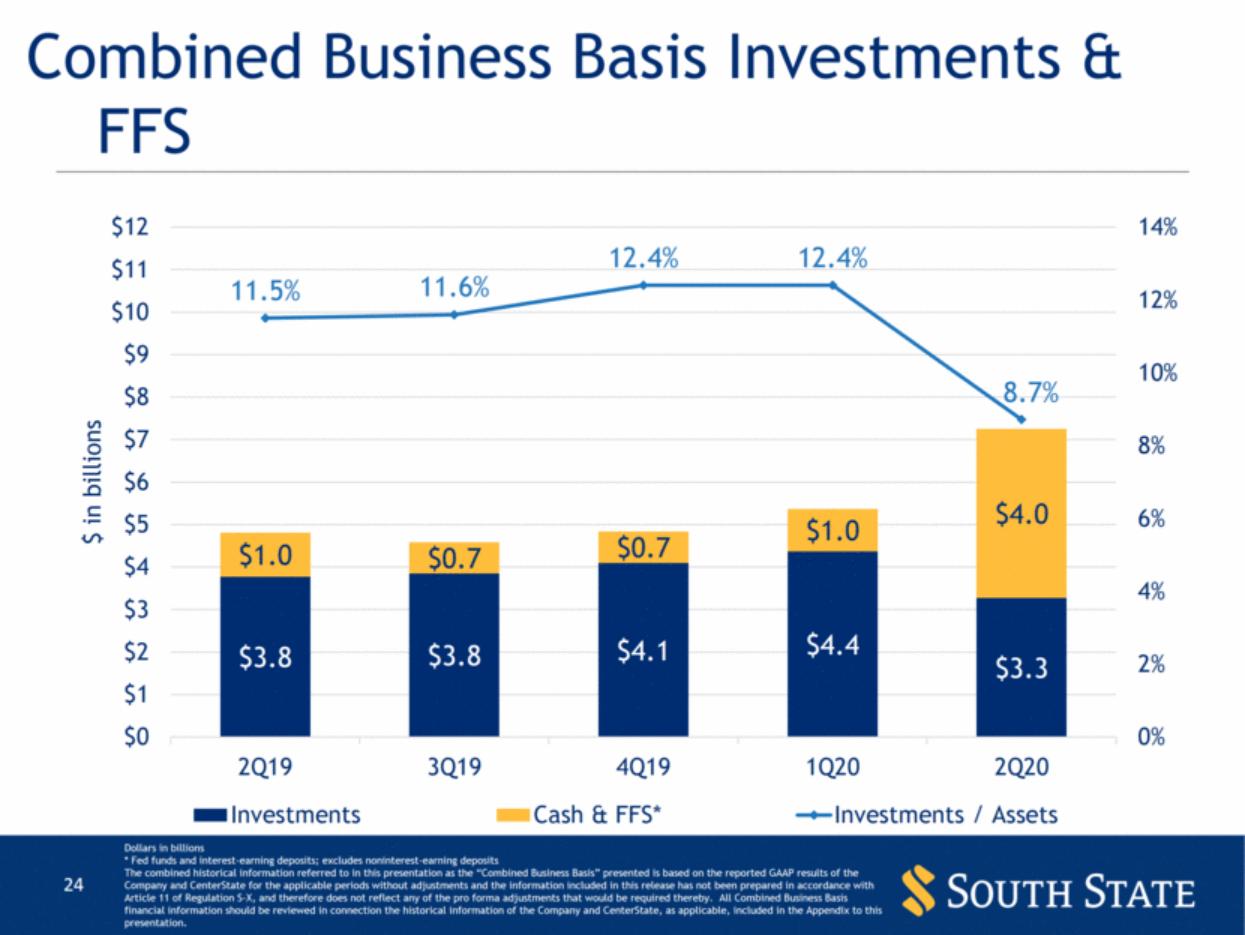
| Combined Business Basis Investments & FFS Dollars in billions * Fed funds and interest-earning deposits; excludes noninterest-earning deposits The combined historical information referred to in this presentation as the “Combined Business Basis” presented is based on the reported GAAP results of the Company and CenterState for the applicable periods without adjustments and the information included in this release has not been prepared in accordance with Article 11 of Regulation S-X, and therefore does not reflect any of the pro forma adjustments that would be required thereby. All Combined Business Basis financial information should be reviewed in connection the historical information of the Company and CenterState, as applicable, included in the Appendix to this presentation. $3.8 $3.8 $4.1 $4.4 $3.3 $1.0 $0.7 $0.7 $1.0 $4.0 11.5% 11.6% 12.4% 12.4% 8.7% $0 $1 $2 $3 $4 $5 $6 $7 $8 $9 $10 $11 $12 2Q19 3Q19 4Q19 1Q20 2Q20 0% 2% 4% 6% 8% 10% 12% 14% $ in billions Investments Cash & FFS* Investments / Assets |
| Asset Quality |

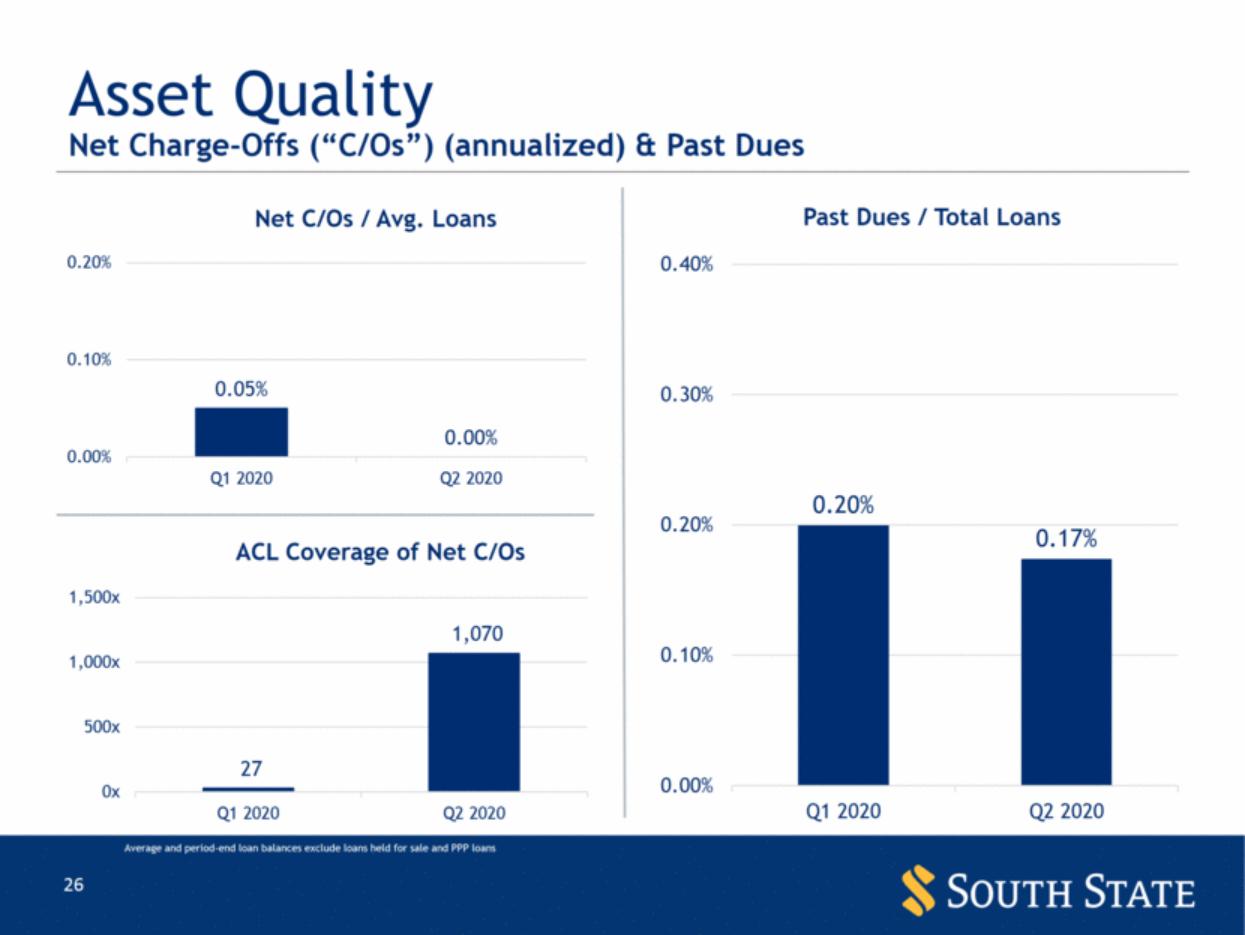
| Asset Quality Average and period-end loan balances exclude loans held for sale and PPP loans Net Charge-Offs (“C/Os”) (annualized) & Past Dues 0.05% 0.00% 0.00% 0.10% 0.20% Q1 2020 Q2 2020 Net C/Os / Avg . Loans 27 1,070 0x 500x 1,000x 1,500x Q1 2020 Q2 2020 ACL Coverage of Net C/Os 0.20% 0.17% 0.00% 0.10% 0.20% 0.30% 0.40% Q1 2020 Q2 2020 Past Dues / Total Loans |
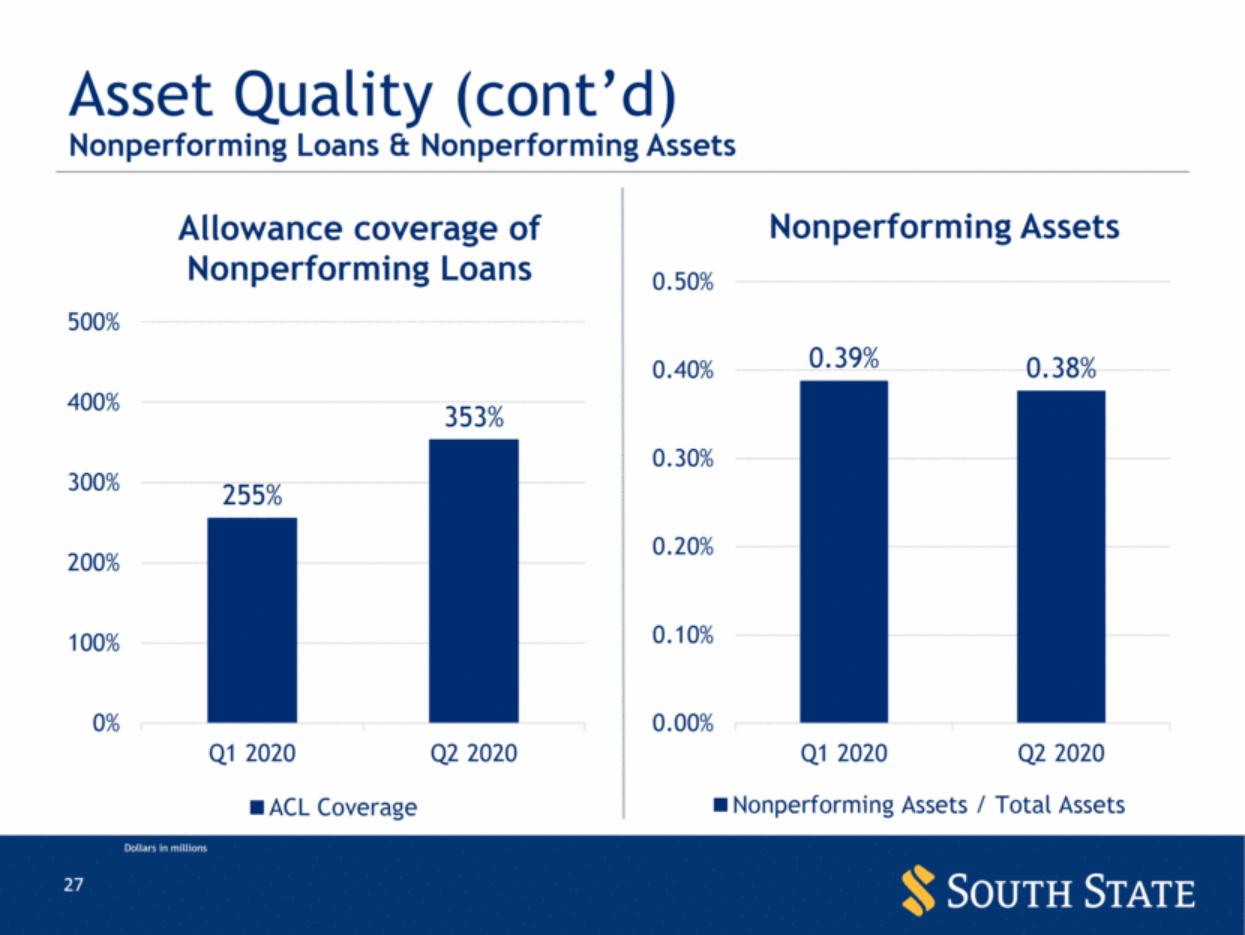
| Asset Quality (cont’d) Dollars in millions Nonperforming Loans & Nonperforming Assets 255% 353% 0% 100% 200% 300% 400% 500% Q1 2020 Q2 2020 Allowance coverage of Nonperforming Loans ACL Coverage 0.39% 0.38% 0.00% 0.10% 0.20% 0.30% 0.40% 0.50% Q1 2020 Q2 2020 Nonperforming Assets Nonperforming Assets / Total Assets |
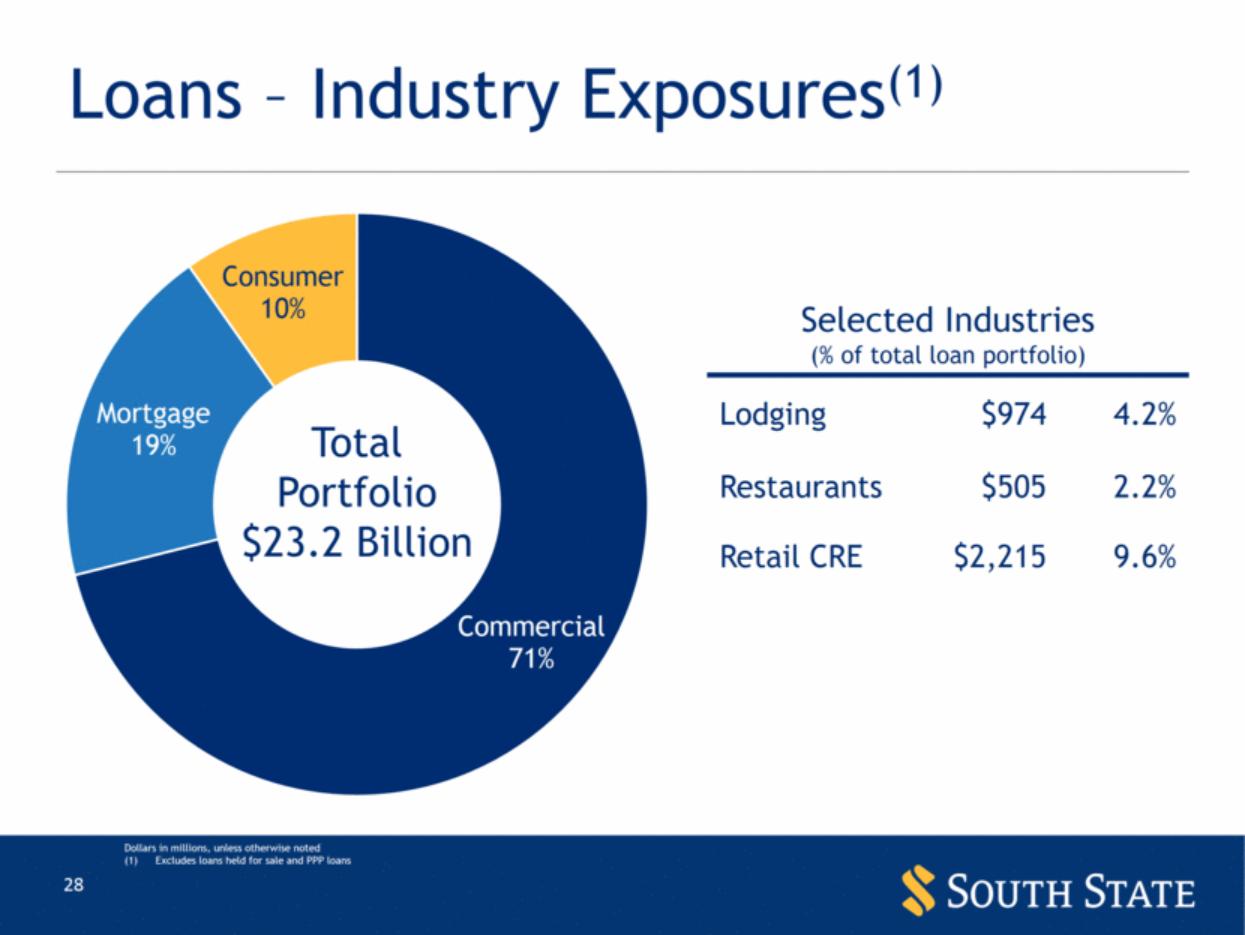
| Loans – Industry Exposures(1) Selected Industries (% of total loan portfolio) Lodging $974 4.2% Restaurants $505 2.2% Retail CRE $2,215 9.6% Dollars in millions, unless otherwise noted Excludes loans held for sale and PPP loans Total Portfolio $23.2 Billion Commercial 71% Mortgage 19% Consumer 10% |
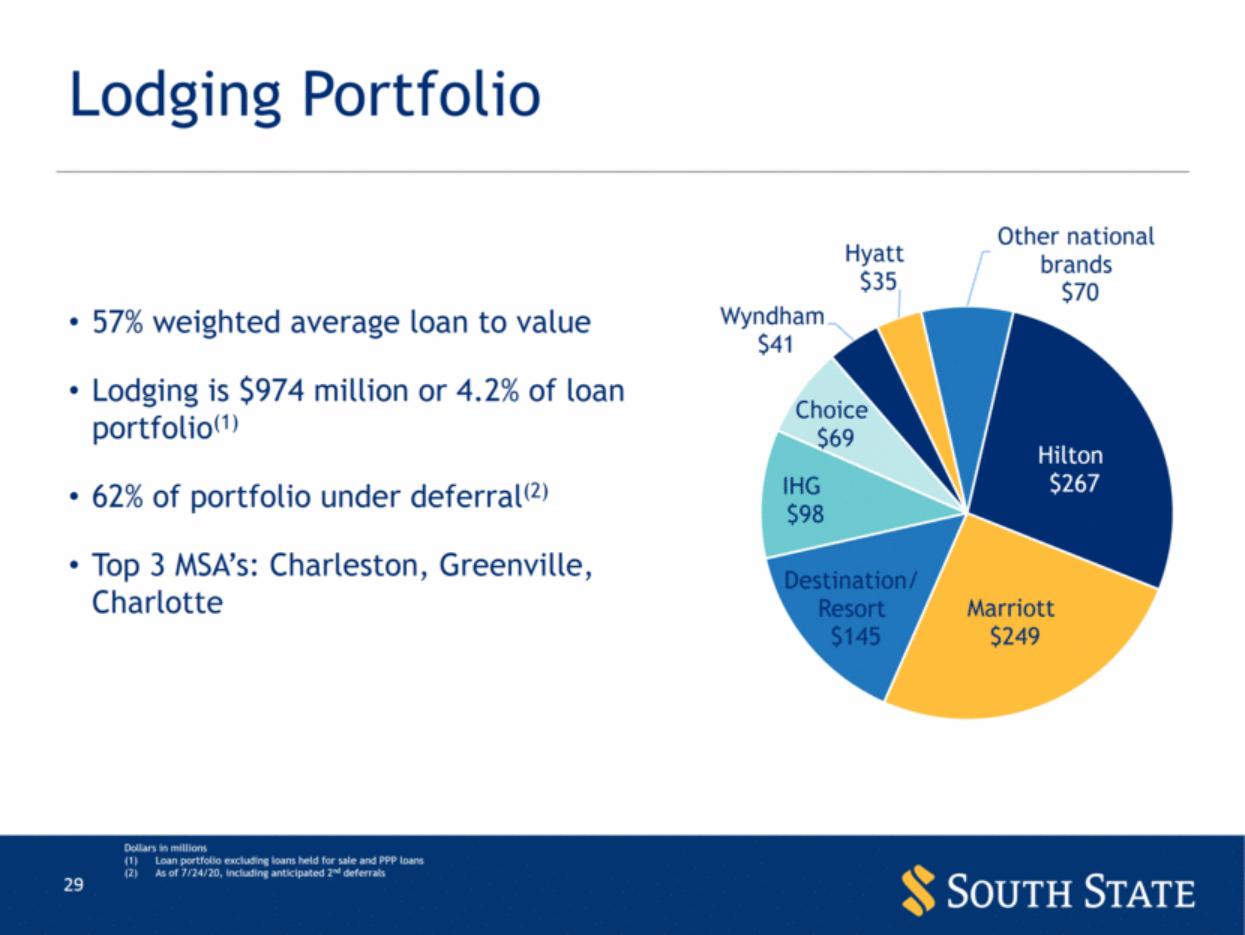
| Lodging Portfolio 57% weighted average loan to value Lodging is $974 million or 4.2% of loan portfolio(1) 62% of portfolio under deferral(2) Top 3 MSA’s: Charleston, Greenville, Charlotte Dollars in millions Loan portfolio excluding loans held for sale and PPP loans As of 7/24/20, including anticipated 2nd deferrals Hilton $267 Marriott $249 Destination/ Resort $145 IHG $98 Choice $69 Wyndham $41 Hyatt $35 Other national brands $70 |
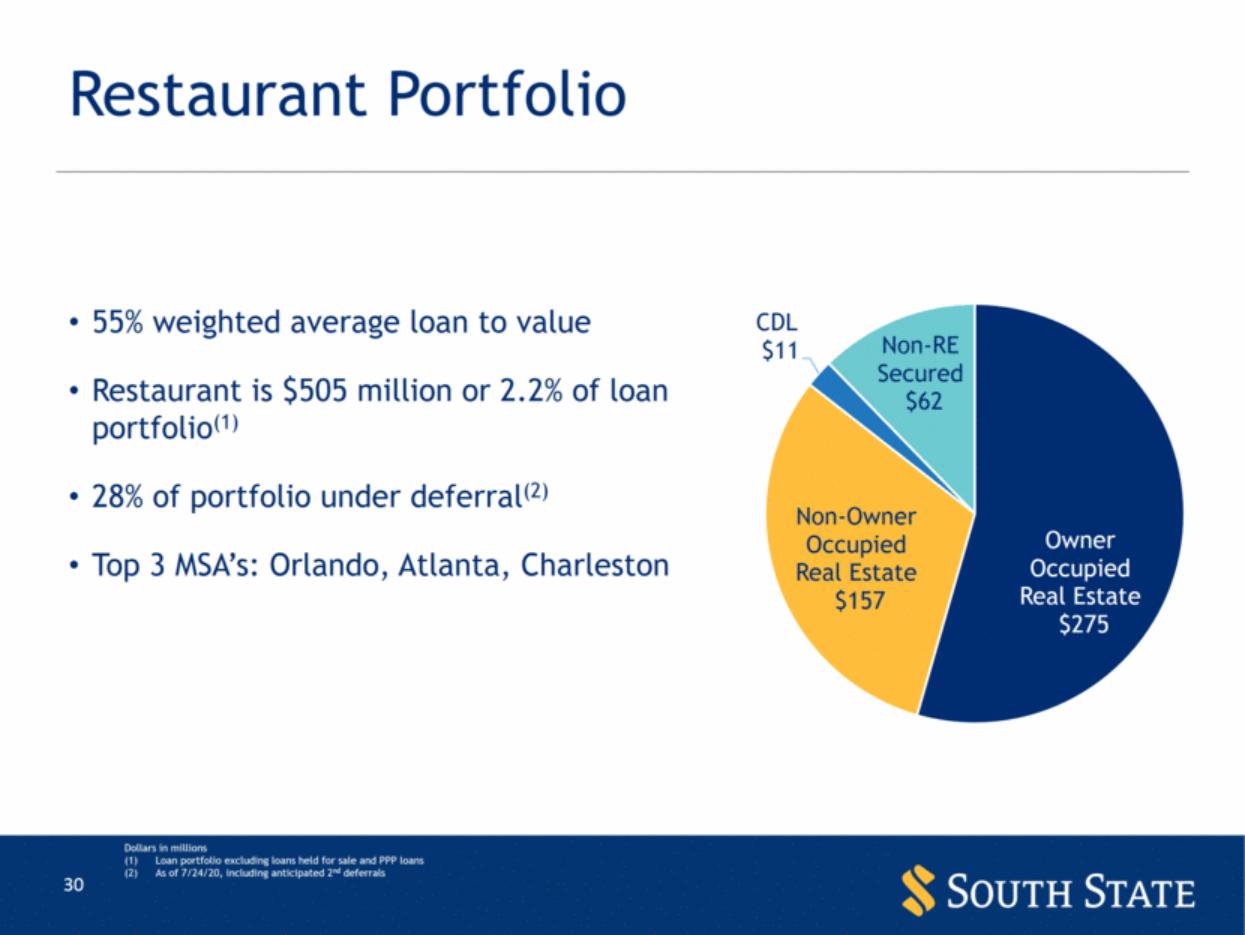
| Restaurant Portfolio 55% weighted average loan to value Restaurant is $505 million or 2.2% of loan portfolio(1) 28% of portfolio under deferral(2) Top 3 MSA’s: Orlando, Atlanta, Charleston Dollars in millions Loan portfolio excluding loans held for sale and PPP loans As of 7/24/20, including anticipated 2nd deferrals 30 Owner Occupied Real Estate $275 Non - Owner Occupied Real Estate $157 CDL $11 Non - RE Secured $62 |
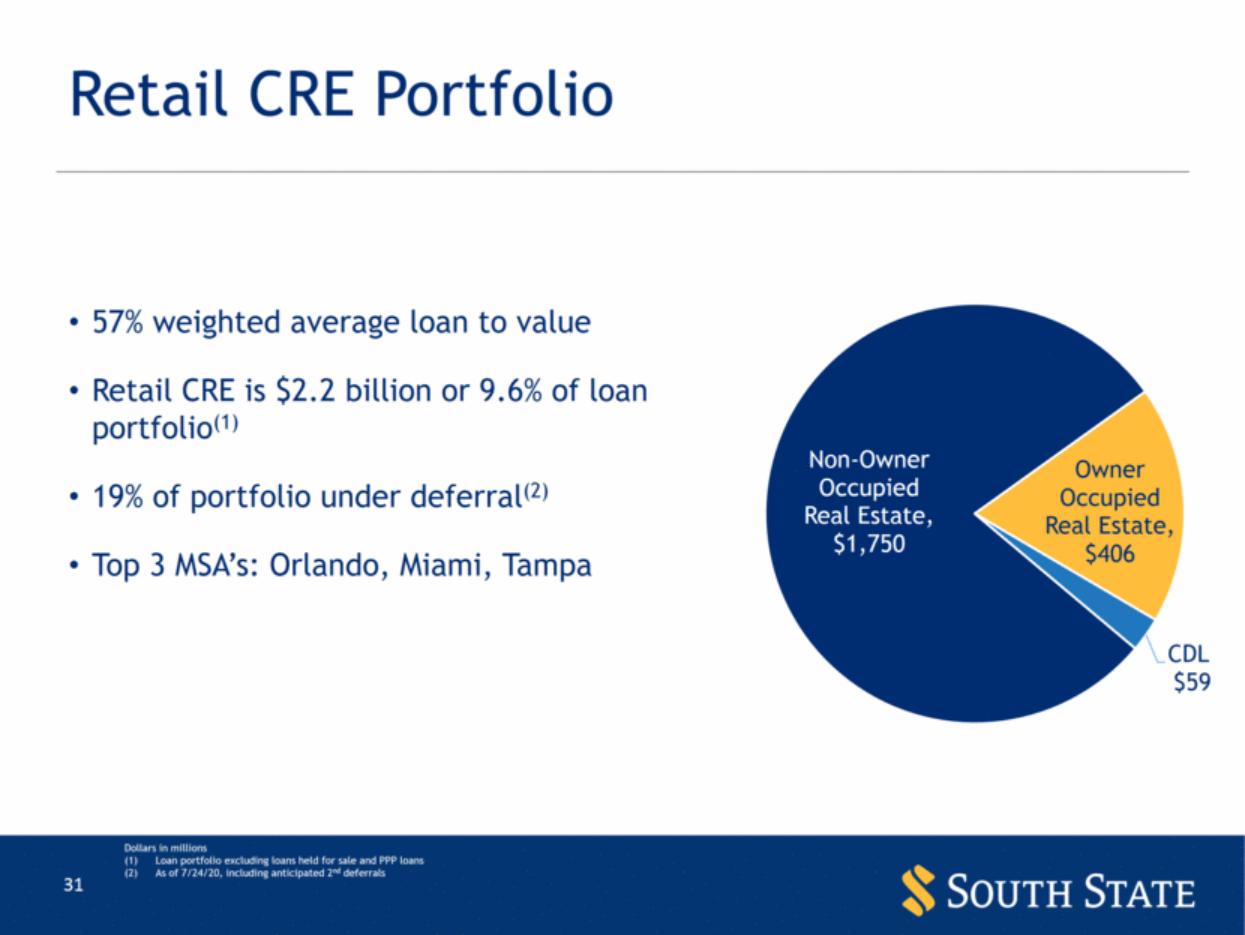
| Retail CRE Portfolio 57% weighted average loan to value Retail CRE is $2.2 billion or 9.6% of loan portfolio(1) 19% of portfolio under deferral(2) Top 3 MSA’s: Orlando, Miami, Tampa Dollars in millions Loan portfolio excluding loans held for sale and PPP loans As of 7/24/20, including anticipated 2nd deferrals Non - Owner Occupied Real Estate , $1,750 Owner Occupied Real Estate , $406 CDL $59 |
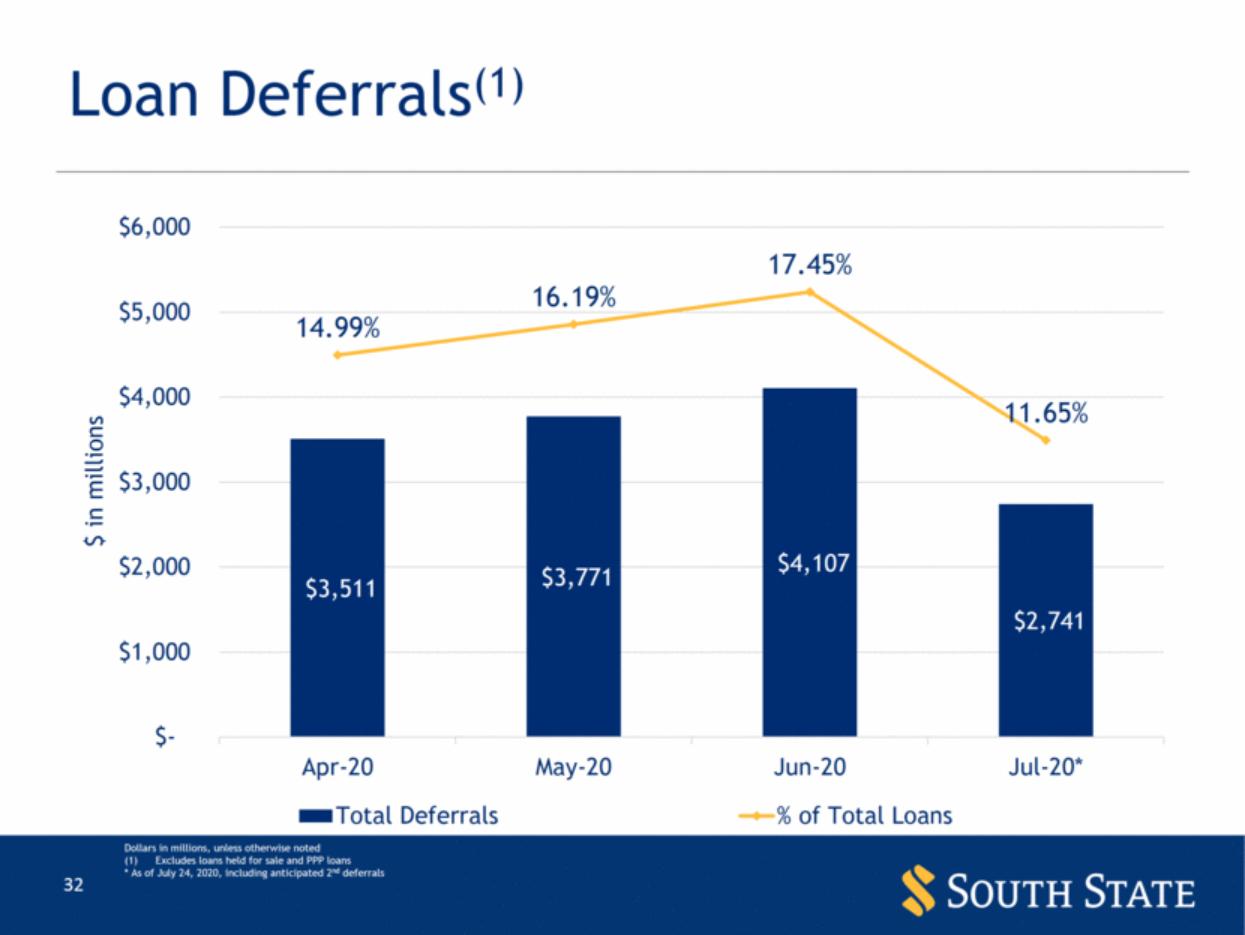
| Loan Deferrals(1) Dollars in millions, unless otherwise noted Excludes loans held for sale and PPP loans * As of July 24, 2020, including anticipated 2nd deferrals $3,511 $3,771 $4,107 $2,741 14.99% 16.19% 17.45% 11.65% 0.00% 5.00% 10.00% 15.00% 20.00% $- $1,000 $2,000 $3,000 $4,000 $5,000 $6,000 Apr-20 May-20 Jun-20 Jul-20* $ in millions Total Deferrals % of Total Loans |
| Appendix |

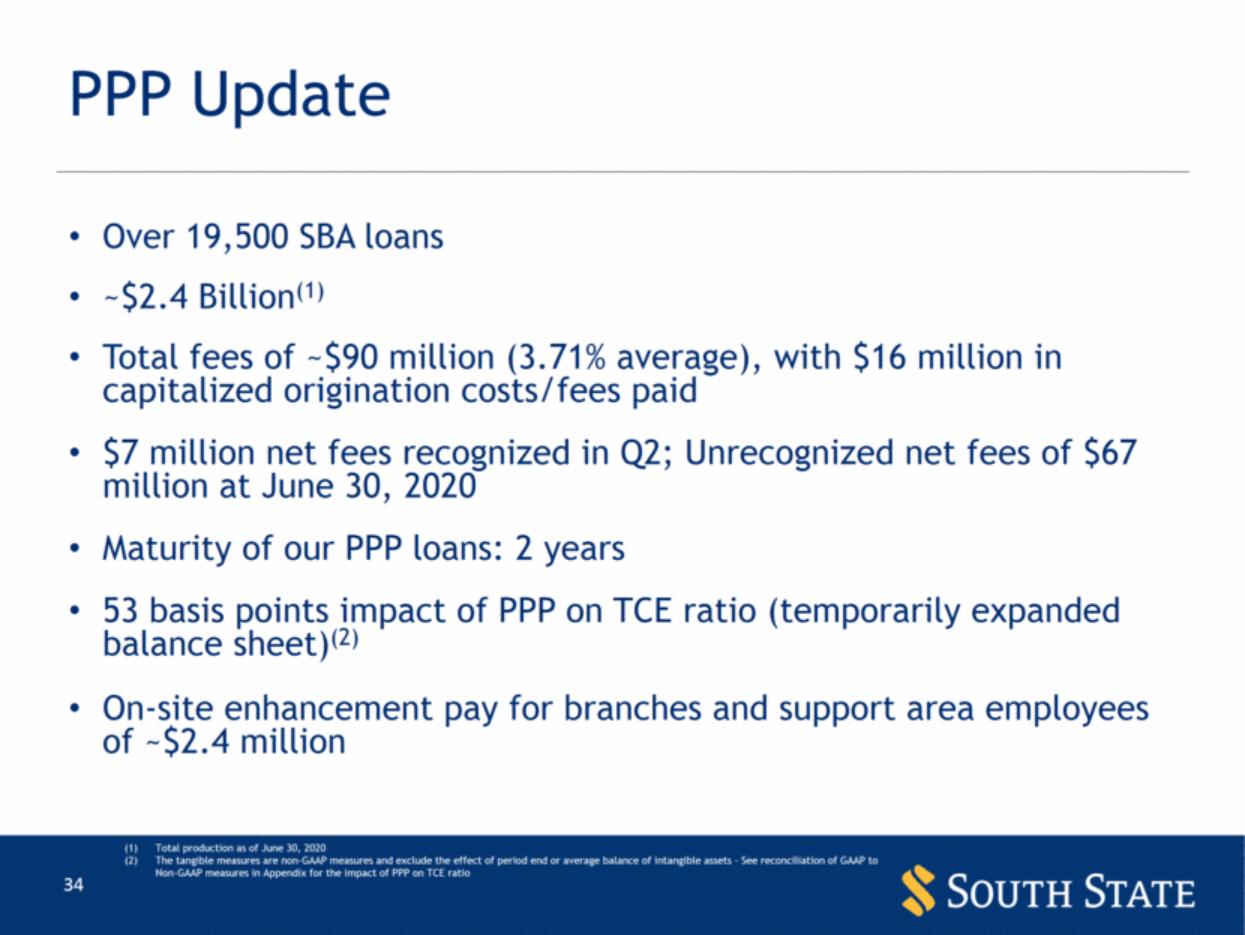
| PPP Update Over 19,500 SBA loans ~$2.4 Billion(1) Total fees of ~$90 million (3.71% average), with $16 million in capitalized origination costs/fees paid $7 million net fees recognized in Q2; Unrecognized net fees of $67 million at June 30, 2020 Maturity of our PPP loans: 2 years 53 basis points impact of PPP on TCE ratio (temporarily expanded balance sheet)(2) On-site enhancement pay for branches and support area employees of ~$2.4 million Total production as of June 30, 2020 The tangible measures are non-GAAP measures and exclude the effect of period end or average balance of intangible assets - See reconciliation of GAAP to Non-GAAP measures in Appendix for the impact of PPP on TCE ratio |
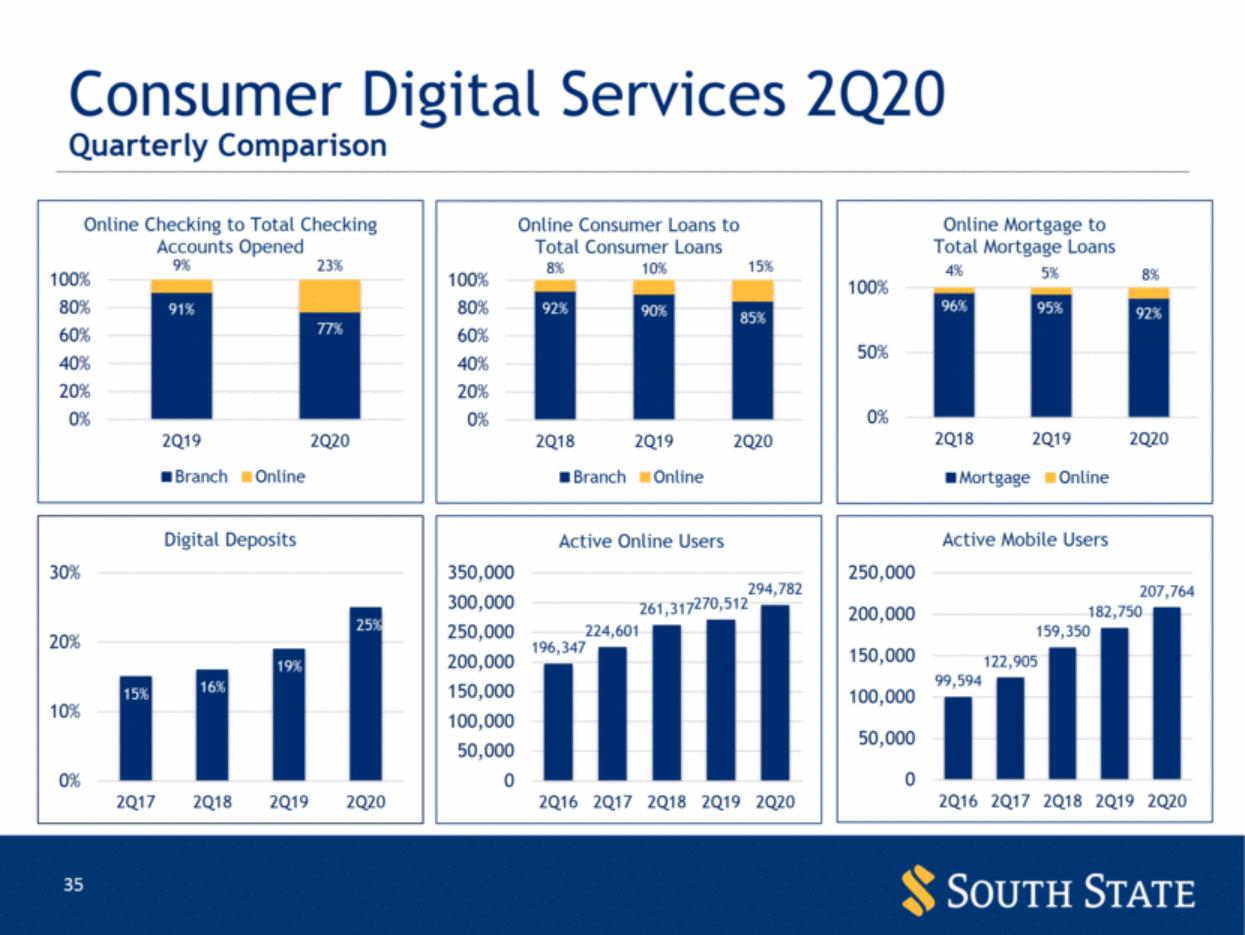
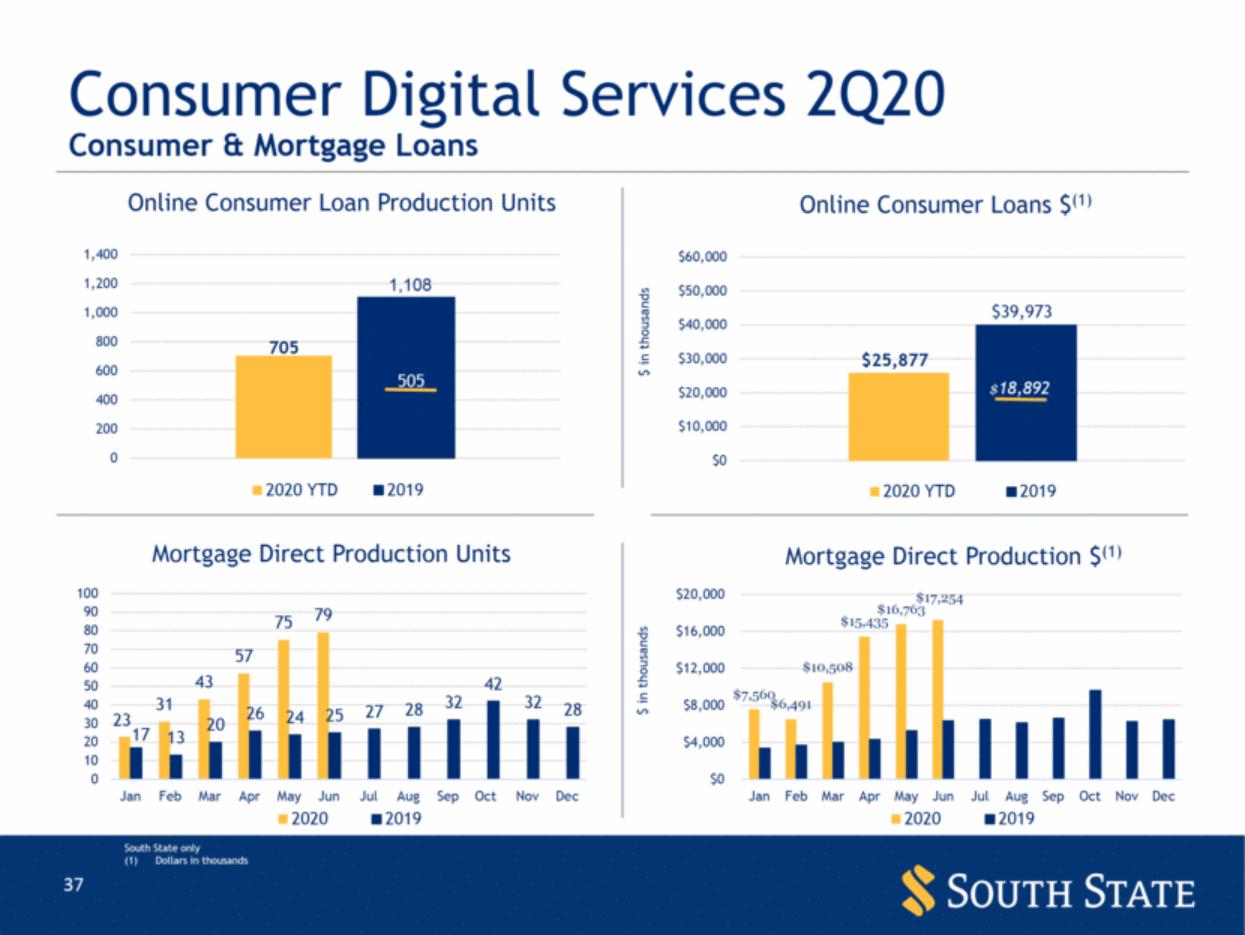
| Consumer Digital Services 2Q20 Quarterly Comparison |
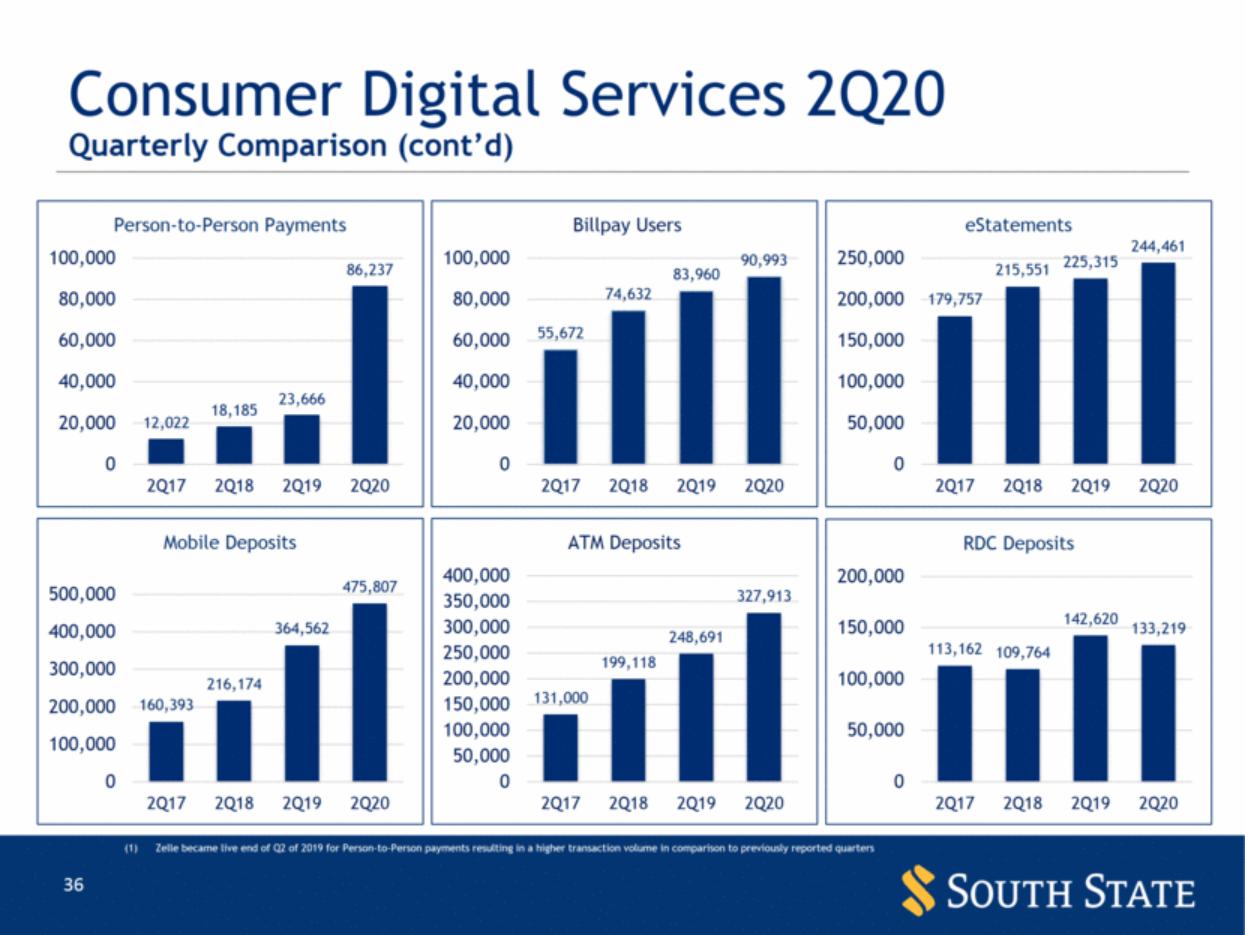
| Consumer Digital Services 2Q20 Quarterly Comparison (cont’d) Zelle became live end of Q2 of 2019 for Person-to-Person payments resulting in a higher transaction volume in comparison to previously reported quarters |
| South State only Dollars in thousands Consumer Digital Services 2Q20 Consumer & Mortgage Loans 705 1,108 0 200 400 600 800 1,000 1,200 1,400 Online Consumer Loan Production Units 2020 YTD 2019 505 $25,877 $39,973 $0 $10,000 $20,000 $30,000 $40,000 $50,000 $60,000 $ in thousands Online Consumer Loans $ (1) 2020 YTD 2019 $ 18,892 23 31 43 57 75 79 17 13 20 26 24 25 27 28 32 42 32 28 0 10 20 30 40 50 60 70 80 90 100 Jan Feb Mar Apr May Jun Jul Aug Sep Oct Nov Dec Mortgage Direct Production Units 2020 2019 $7,560 $6,491 $10,508 $15,435 $16,763 $17,254 $0 $4,000 $8,000 $12,000 $16,000 $20,000 Jan Feb Mar Apr May Jun Jul Aug Sep Oct Nov Dec $ in thousands Mortgage Direct Production $ (1) 2020 2019 |
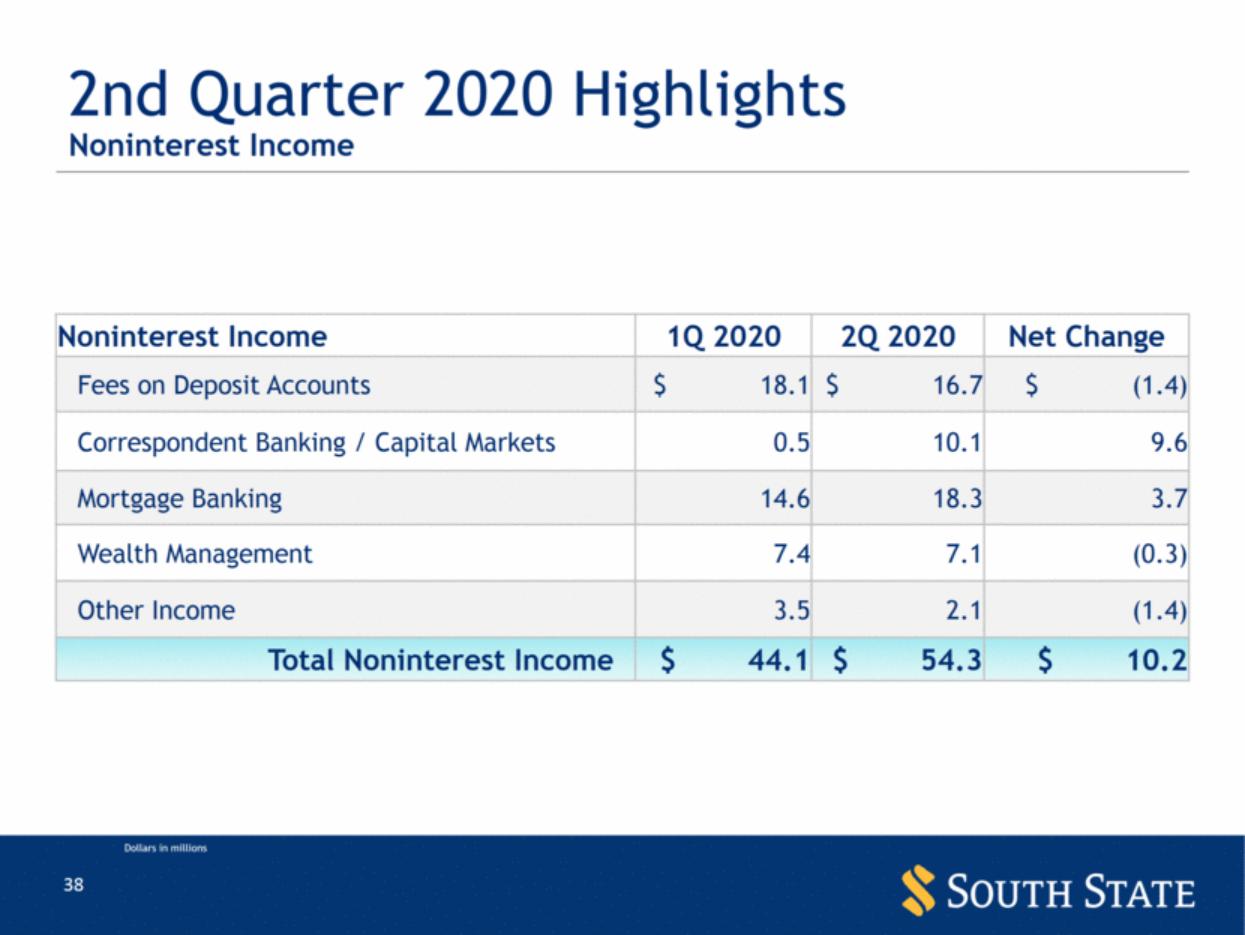
| 2nd Quarter 2020 Highlights Noninterest Income 1Q 2020 2Q 2020 Net Change Fees on Deposit Accounts $ 18.1 $ 16.7 $ (1.4) Correspondent Banking / Capital Markets 0.5 10.1 9.6 Mortgage Banking 14.6 18.3 3.7 Wealth Management 7.4 7.1 (0.3) Other Income 3.5 2.1 (1.4) Total Noninterest Income $ 44.1 $ 54.3 $ 10.2 Dollars in millions Noninterest Income |
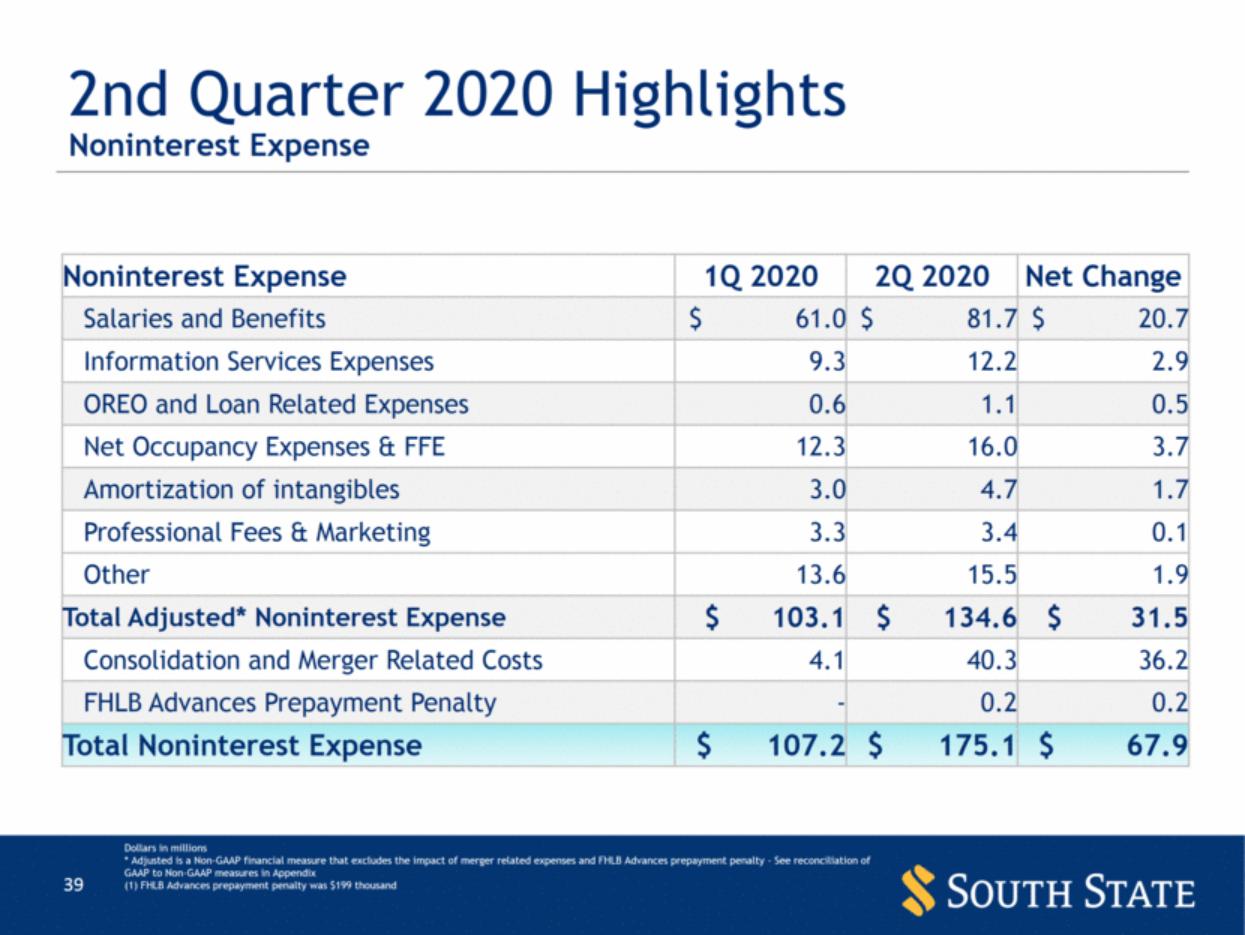
| 2nd Quarter 2020 Highlights Dollars in millions * Adjusted is a Non-GAAP financial measure that excludes the impact of merger related expenses and FHLB Advances prepayment penalty - See reconciliation of GAAP to Non-GAAP measures in Appendix (1) FHLB Advances prepayment penalty was $199 thousand Noninterest Expense Noninterest Expense 1Q 2020 2Q 2020 Net Change Salaries and Benefits $ 61.0 $ 81.7 $ 20.7 Information Services Expenses 9.3 12.2 2.9 OREO and Loan Related Expenses 0.6 1.1 0.5 Net Occupancy Expenses & FFE 12.3 16.0 3.7 Amortization of intangibles 3.0 4.7 1.7 Professional Fees & Marketing 3.3 3.4 0.1 Other 13.6 15.5 1.9 Total Adjusted* Noninterest Expense $ 103.1 $ 134.6 $ 31.5 Consolidation and Merger Related Costs 4.1 40.3 36.2 FHLB Advances Prepayment Penalty - 0.2 0.2 Total Noninterest Expense $ 107.2 $ 175.1 $ 67.9 |
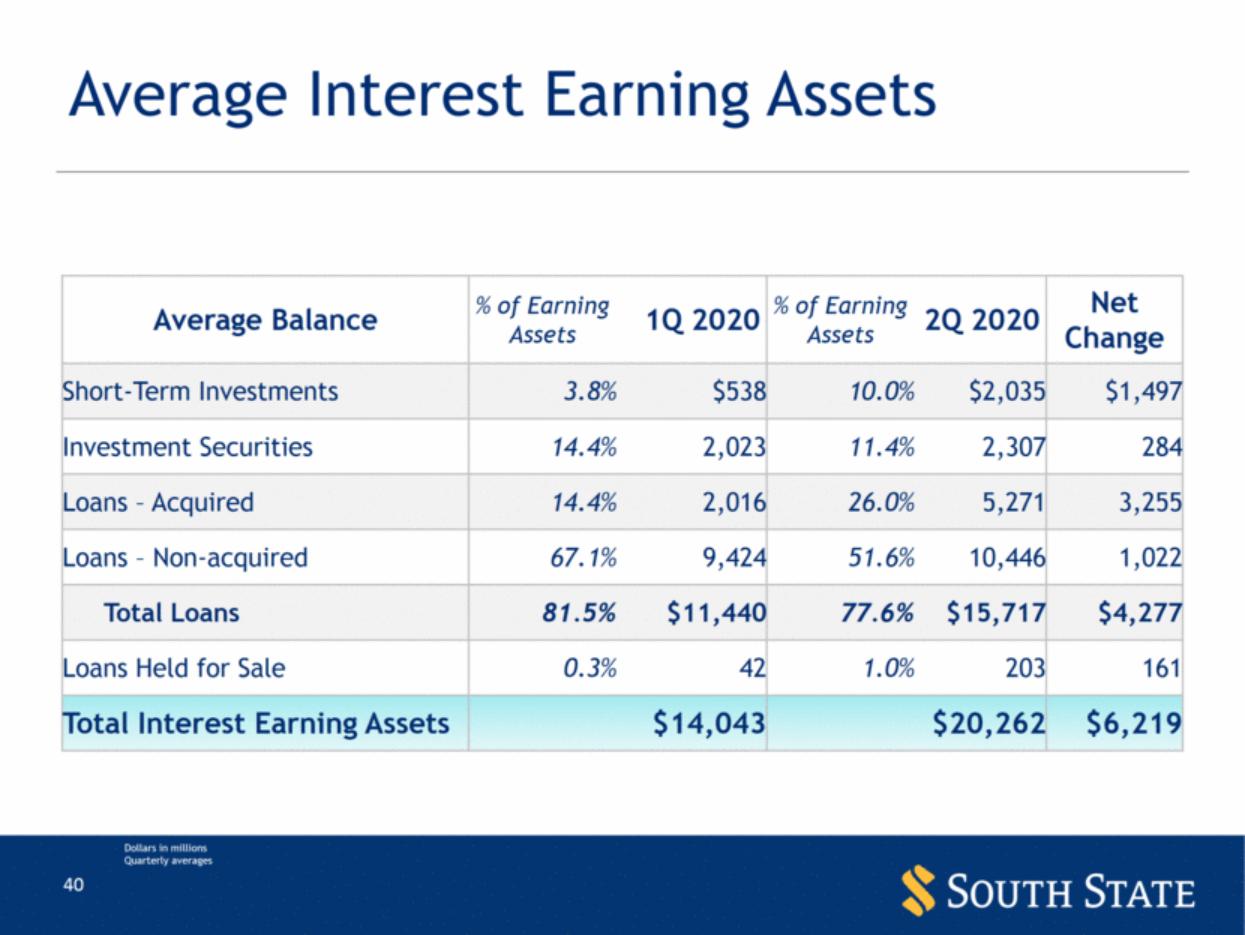
| Average Interest Earning Assets Dollars in millions Quarterly averages Average Balance % of Earning Assets 1Q 2020 % of Earning Assets 2Q 2020 Net Change Short-Term Investments 3.8% $538 10.0% $2,035 $1,497 Investment Securities 14.4% 2,023 11.4% 2,307 284 Loans – Acquired 14.4% 2,016 26.0% 5,271 3,255 Loans – Non-acquired 67.1% 9,424 51.6% 10,446 1,022 Total Loans 81.5% $11,440 77.6% $15,717 $4,277 Loans Held for Sale 0.3% 42 1.0% 203 161 Total Interest Earning Assets $14,043 $20,262 $6,219 |
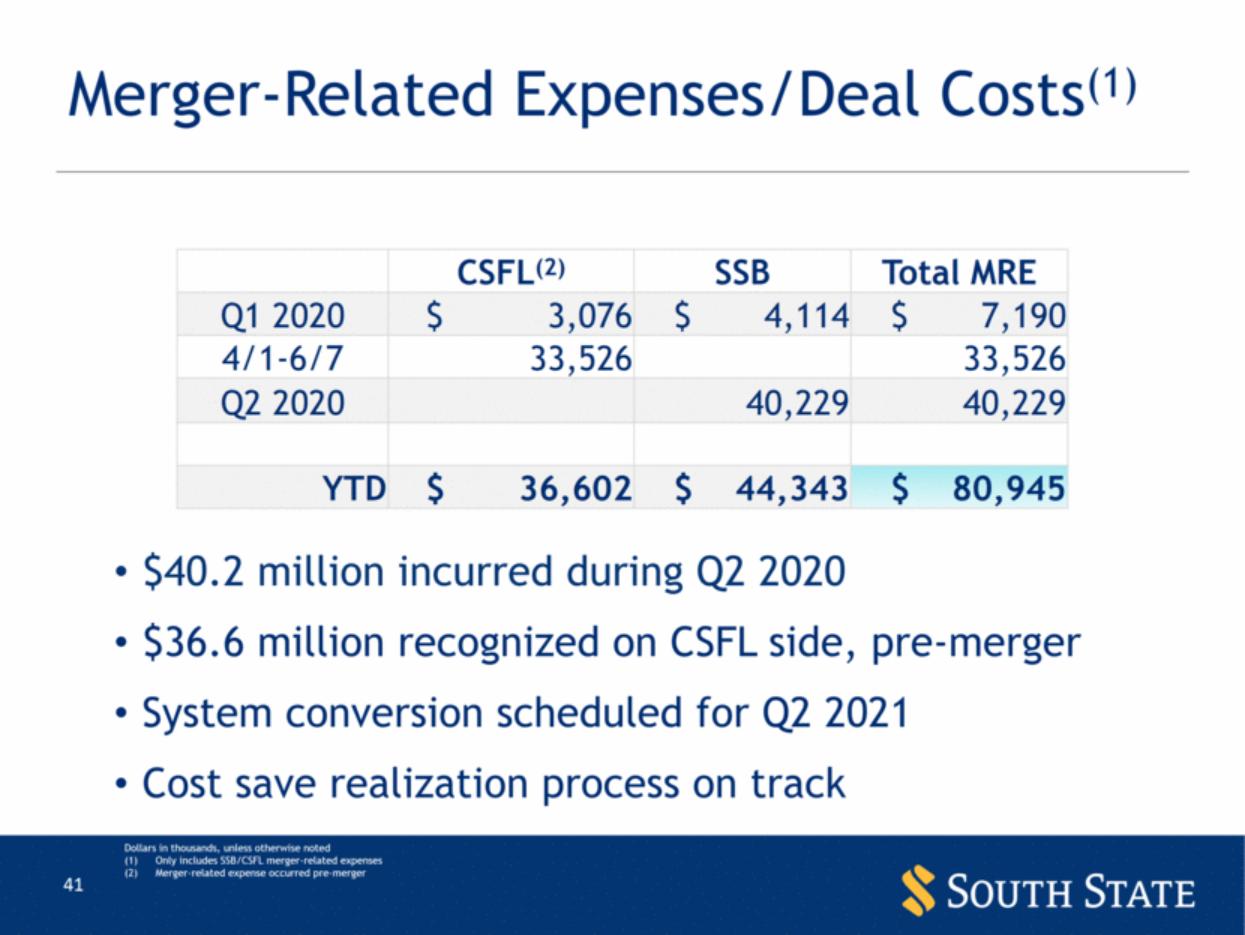
| Merger-Related Expenses/Deal Costs(1) $40.2 million incurred during Q2 2020 $36.6 million recognized on CSFL side, pre-merger System conversion scheduled for Q2 2021 Cost save realization process on track Dollars in thousands, unless otherwise noted Only includes SSB/CSFL merger-related expenses Merger-related expense occurred pre-merger CSFL(2) SSB Total MRE Q1 2020 $ 3,076 $ 4,114 $ 7,190 4/1-6/7 33,526 33,526 Q2 2020 40,229 40,229 YTD $ 36,602 $ 44,343 $ 80,945 |
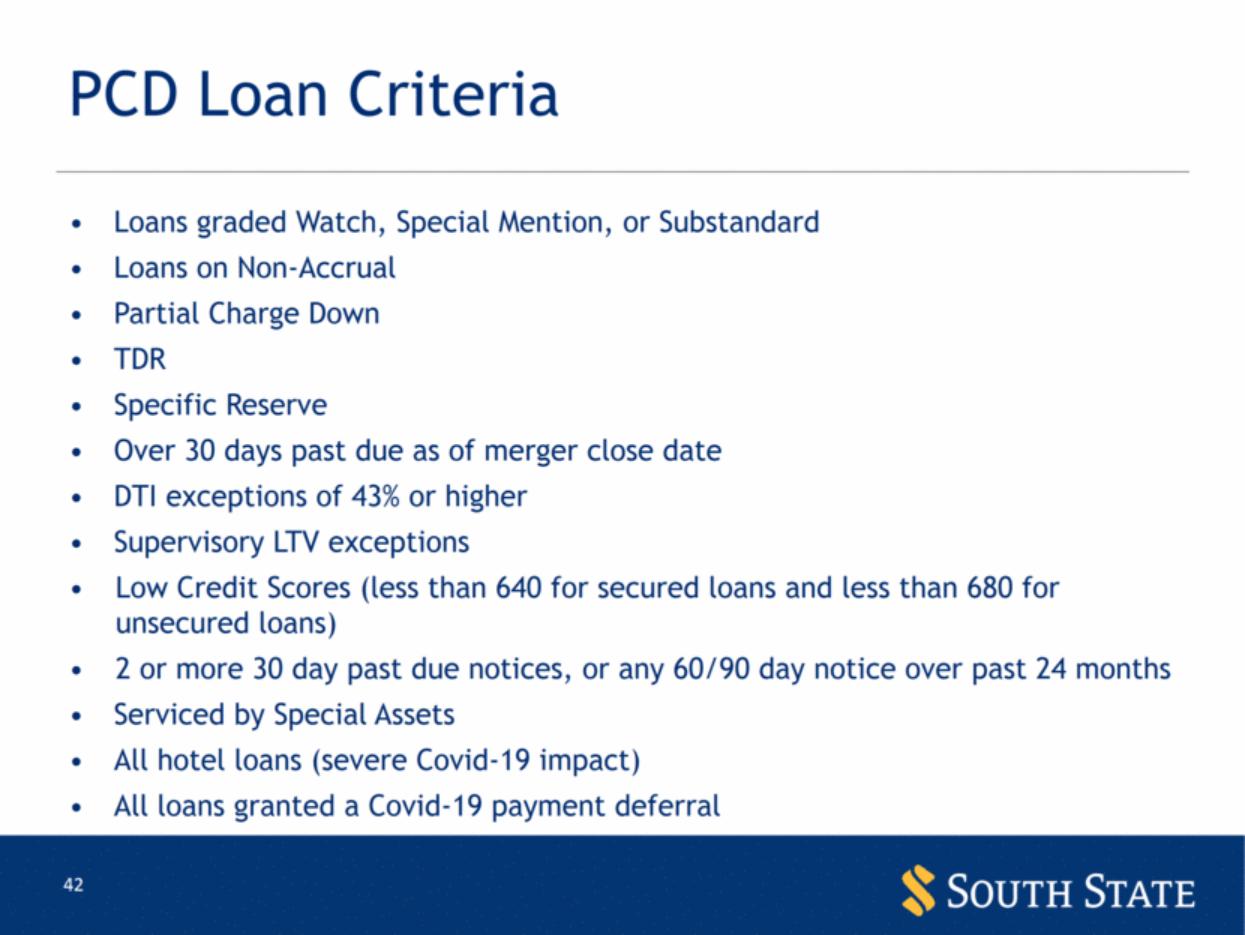
| PCD Loan Criteria • Loans graded Watch, Special Mention, or Substandard • Loans on Non-Accrual • Partial Charge Down • TDR • Specific Reserve • Over 30 days past due as of merger close date • DTI exceptions of 43% or higher • Supervisory LTV exceptions • Low Credit Scores (less than 640 for secured loans and less than 680 for unsecured loans) • 2 or more 30 day past due notices, or any 60/90 day notice over past 24 months • Serviced by Special Assets • All hotel loans (severe Covid-19 impact) • All loans granted a Covid-19 payment deferral |
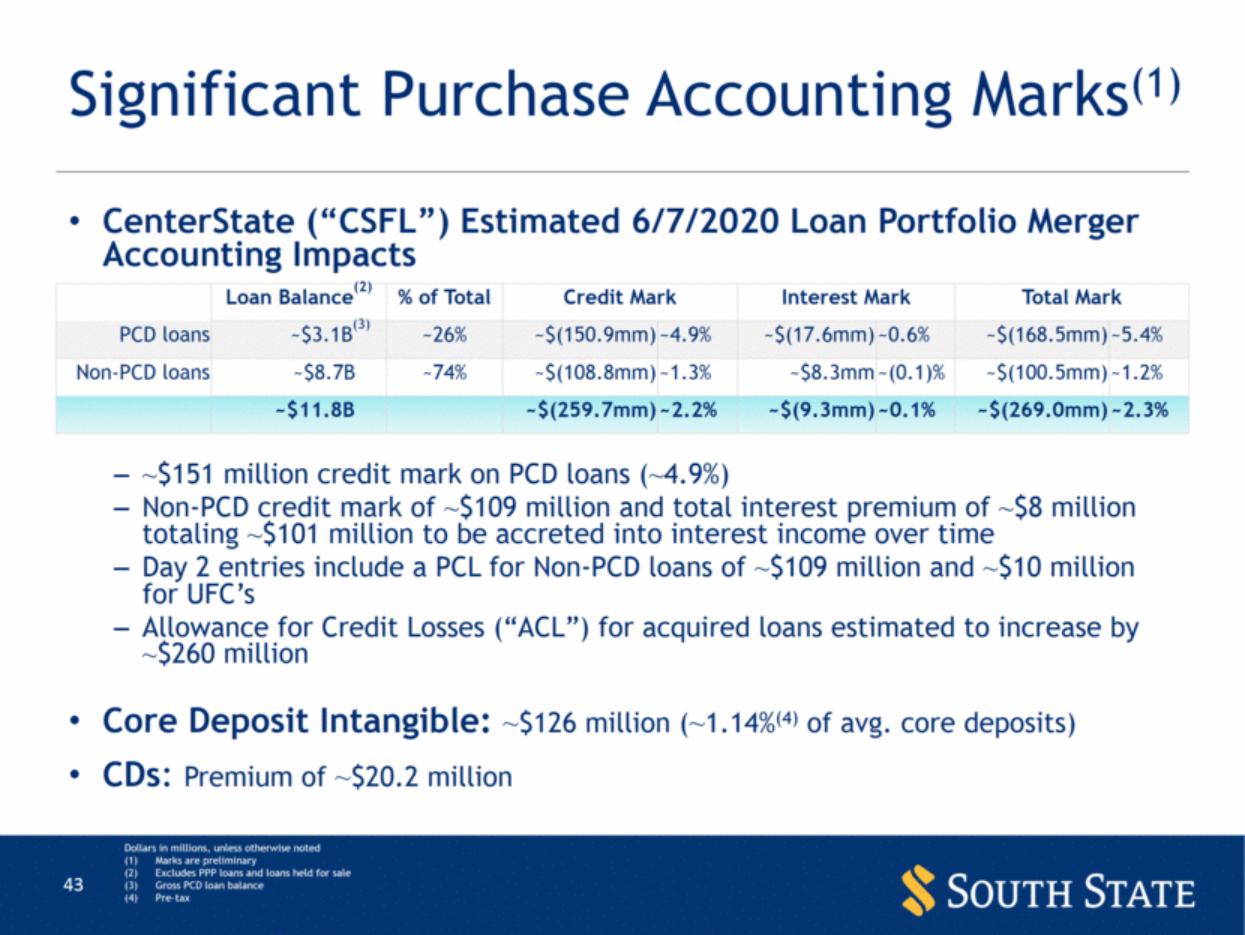
| Significant Purchase Accounting Marks(1) CenterState (“CSFL”) Estimated 6/7/2020 Loan Portfolio Merger Accounting Impacts ~$151 million credit mark on PCD loans (~4.9%) Non-PCD credit mark of ~$109 million and total interest premium of ~$8 million totaling ~$101 million to be accreted into interest income over time Day 2 entries include a PCL for Non-PCD loans of ~$109 million and ~$10 million for UFC’s Allowance for Credit Losses (“ACL”) for acquired loans estimated to increase by ~$260 million Core Deposit Intangible: ~$126 million (~1.14%(4) of avg. core deposits) CDs: Premium of ~$20.2 million Dollars in millions, unless otherwise noted Marks are preliminary Excludes PPP loans and loans held for sale Gross PCD loan balance Pre-tax Loan Balance(2) % of Total Credit Mark Interest Mark Total Mark PCD loans ~$3.1B(3) ~26% ~$(150.9mm) ~4.9% ~$(17.6mm) ~0.6% ~$(168.5mm) ~5.4% Non-PCD loans ~$8.7B ~74% ~$(108.8mm) ~1.3% ~$8.3mm ~(0.1)% ~$(100.5mm) ~1.2% ~$11.8B ~$(259.7mm) ~2.2% ~$(9.3mm) ~0.1% ~$(269.0mm) ~2.3% |
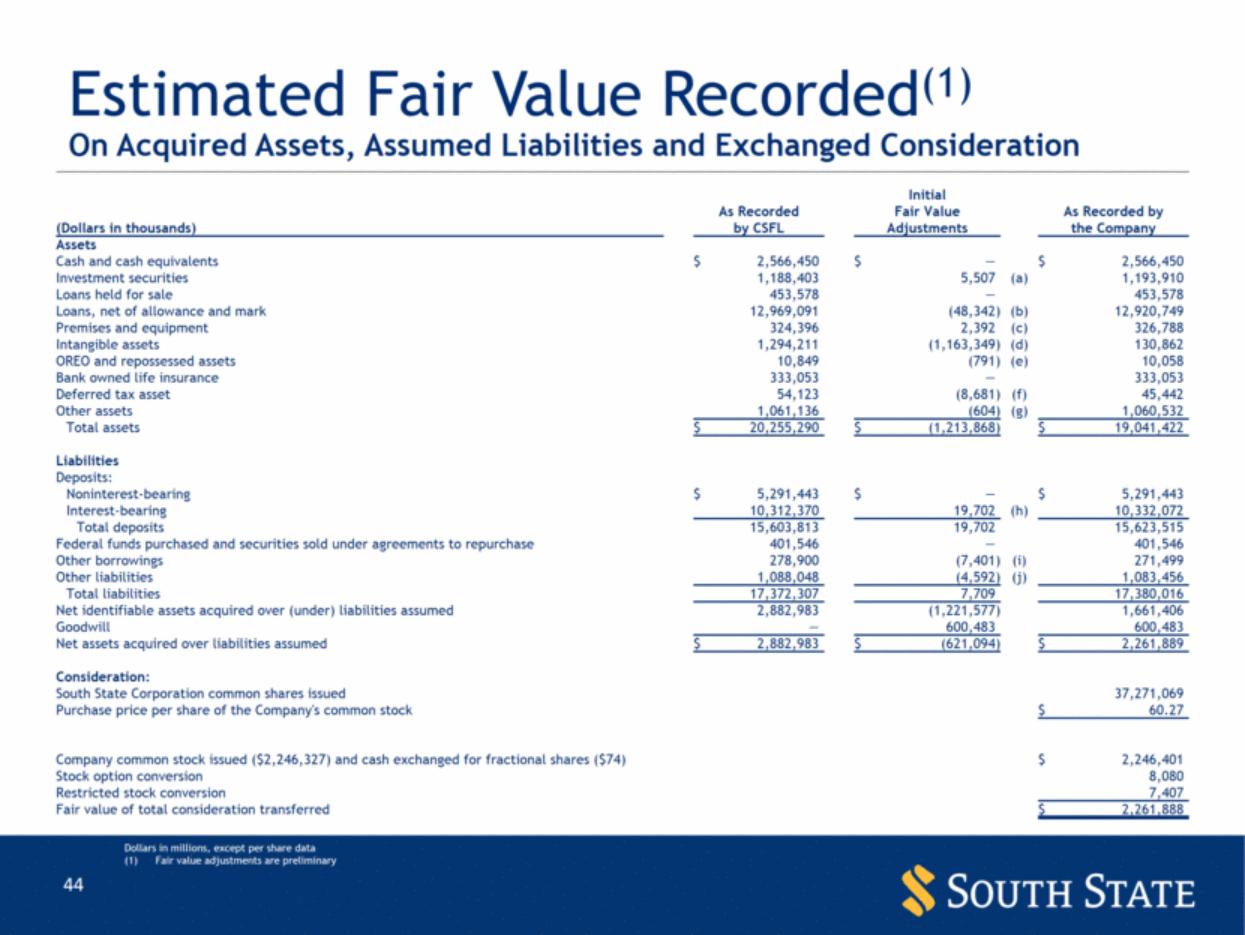
| On Acquired Assets, Assumed Liabilities and Exchanged Consideration Estimated Fair Value Recorded(1) Initial As Recorded Fair Value As Recorded by (Dollars in thousands) by CSFL Adjustments the Company Assets Cash and cash equivalents $ 2,566,450 $ — $ 2,566,450 Investment securities 1,188,403 5,507 (a) 1,193,910 Loans held for sale 453,578 — 453,578 Loans, net of allowance and mark 12,969,091 (48,342) (b) 12,920,749 Premises and equipment 324,396 2,392 (c) 326,788 Intangible assets 1,294,211 (1,163,349) (d) 130,862 OREO and repossessed assets 10,849 (791) (e) 10,058 Bank owned life insurance 333,053 — 333,053 Deferred tax asset 54,123 (8,681) (f) 45,442 Other assets 1,061,136 (604) (g) 1,060,532 Total assets $ 20,255,290 $ (1,213,868) $ 19,041,422 Liabilities Deposits: Noninterest-bearing $ 5,291,443 $ — $ 5,291,443 Interest-bearing 10,312,370 19,702 (h) 10,332,072 Total deposits 15,603,813 19,702 15,623,515 Federal funds purchased and securities sold under agreements to repurchase 401,546 — 401,546 Other borrowings 278,900 (7,401) (i) 271,499 Other liabilities 1,088,048 (4,592) (j) 1,083,456 Total liabilities 17,372,307 7,709 17,380,016 Net identifiable assets acquired over (under) liabilities assumed 2,882,983 (1,221,577) 1,661,406 Goodwill — 600,483 600,483 Net assets acquired over liabilities assumed $ 2,882,983 $ (621,094) $ 2,261,889 Consideration: South State Corporation common shares issued 37,271,069 Purchase price per share of the Company's common stock $ 60.27 Company common stock issued ($2,246,327) and cash exchanged for fractional shares ($74) $ 2,246,401 Stock option conversion 8,080 Restricted stock conversion 7,407 Fair value of total consideration transferred $ 2,261,888 Dollars in millions, except per share data Fair value adjustments are preliminary |
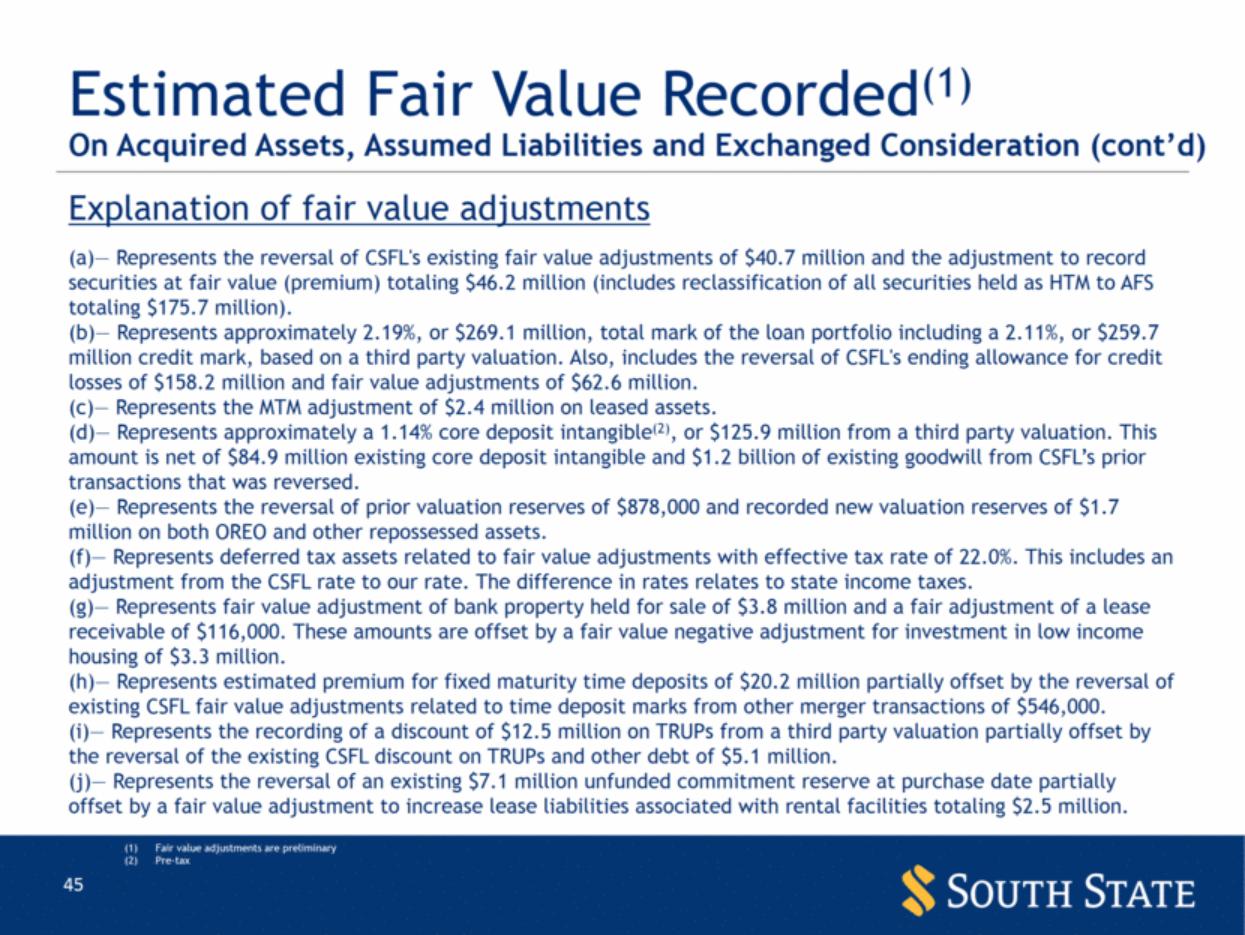
| On Acquired Assets, Assumed Liabilities and Exchanged Consideration (cont’d) Estimated Fair Value Recorded(1) Explanation of fair value adjustments (a)— Represents the reversal of CSFL's existing fair value adjustments of $40.7 million and the adjustment to record securities at fair value (premium) totaling $46.2 million (includes reclassification of all securities held as HTM to AFS totaling $175.7 million). (b)— Represents approximately 2.19%, or $269.1 million, total mark of the loan portfolio including a 2.11%, or $259.7 million credit mark, based on a third party valuation. Also, includes the reversal of CSFL's ending allowance for credit losses of $158.2 million and fair value adjustments of $62.6 million. (c)— Represents the MTM adjustment of $2.4 million on leased assets. (d)— Represents approximately a 1.14% core deposit intangible(2), or $125.9 million from a third party valuation. This amount is net of $84.9 million existing core deposit intangible and $1.2 billion of existing goodwill from CSFL’s prior transactions that was reversed. (e)— Represents the reversal of prior valuation reserves of $878,000 and recorded new valuation reserves of $1.7 million on both OREO and other repossessed assets. (f)— Represents deferred tax assets related to fair value adjustments with effective tax rate of 22.0%. This includes an adjustment from the CSFL rate to our rate. The difference in rates relates to state income taxes. (g)— Represents fair value adjustment of bank property held for sale of $3.8 million and a fair adjustment of a lease receivable of $116,000. These amounts are offset by a fair value negative adjustment for investment in low income housing of $3.3 million. (h)— Represents estimated premium for fixed maturity time deposits of $20.2 million partially offset by the reversal of existing CSFL fair value adjustments related to time deposit marks from other merger transactions of $546,000. (i)— Represents the recording of a discount of $12.5 million on TRUPs from a third party valuation partially offset by the reversal of the existing CSFL discount on TRUPs and other debt of $5.1 million. (j)— Represents the reversal of an existing $7.1 million unfunded commitment reserve at purchase date partially offset by a fair value adjustment to increase lease liabilities associated with rental facilities totaling $2.5 million. Fair value adjustments are preliminary Pre-tax |
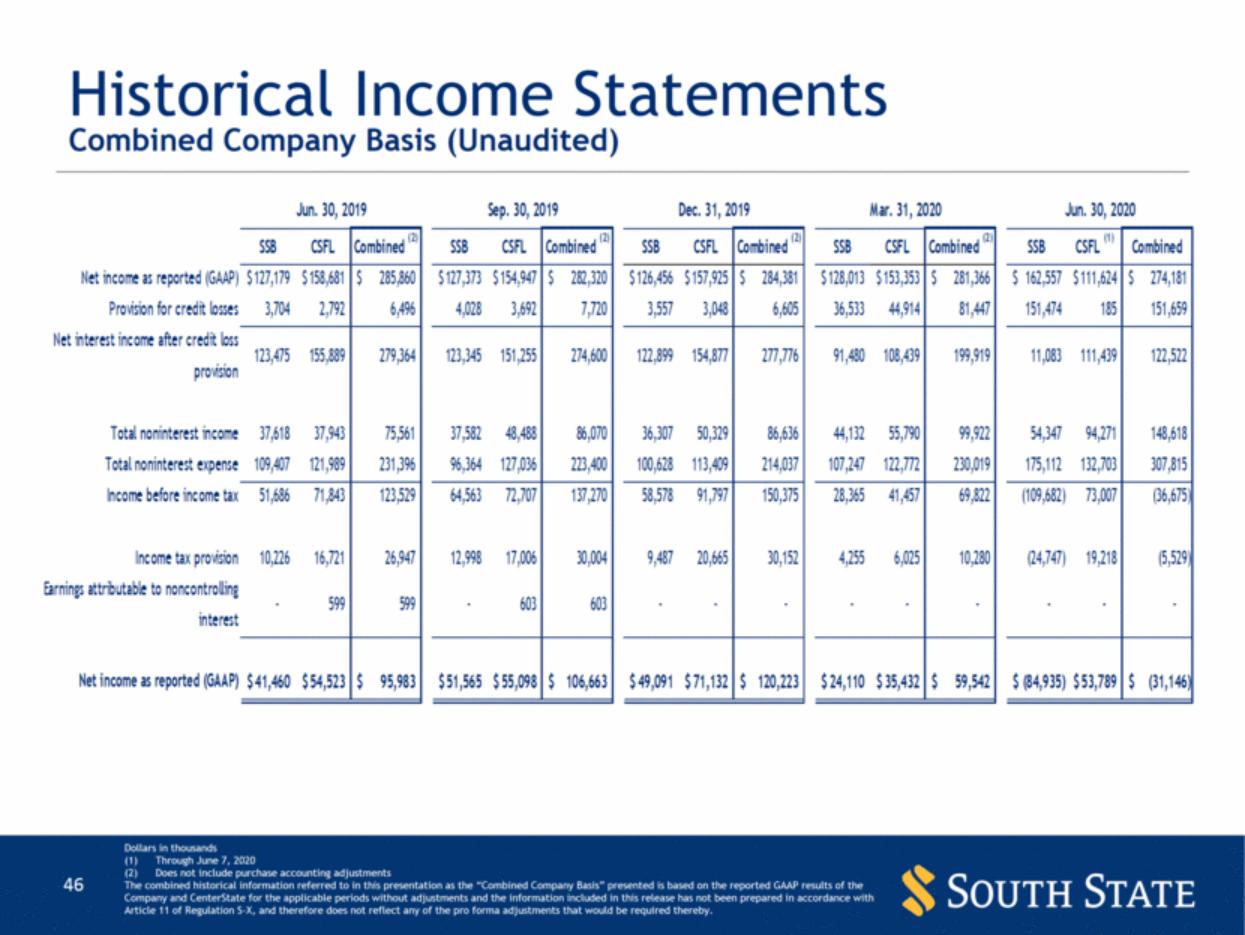
| Historical Income Statements Combined Company Basis (Unaudited) Dollars in thousands Through June 7, 2020 Does not include purchase accounting adjustments The combined historical information referred to in this presentation as the “Combined Company Basis” presented is based on the reported GAAP results of the Company and CenterState for the applicable periods without adjustments and the information included in this release has not been prepared in accordance with Article 11 of Regulation S-X, and therefore does not reflect any of the pro forma adjustments that would be required thereby. SSB CSFL Combined (2) SSB CSFL Combined (2) SSB CSFL Combined (2) SSB CSFL Combined (2) SSB CSFL (1) Combined Net income as reported (GAAP) 127,179 $ 158,681 $ 285,860 $ 127,373 $ 154,947 $ 282,320 $ 126,456 $ 157,925 $ 284,381 $ 128,013 $ 153,353 $ 281,366 $ 162,557 $ 111,624 $ 274,181 $ Provision for credit losses 3,704 2,792 6,496 4,028 3,692 7,720 3,557 3,048 6,605 36,533 44,914 81,447 151,474 185 151,659 Net interest income after credit loss provision 123,475 155,889 279,364 123,345 151,255 274,600 122,899 154,877 277,776 91,480 108,439 199,919 11,083 111,439 122,522 Total noninterest income 37,618 37,943 75,561 37,582 48,488 86,070 36,307 50,329 86,636 44,132 55,790 99,922 54,347 94,271 148,618 Total noninterest expense 109,407 121,989 231,396 96,364 127,036 223,400 100,628 113,409 214,037 107,247 122,772 230,019 175,112 132,703 307,815 Income before income tax 51,686 71,843 123,529 64,563 72,707 137,270 58,578 91,797 150,375 28,365 41,457 69,822 (109,682) 73,007 (36,675) Income tax provision 10,226 16,721 26,947 12,998 17,006 30,004 9,487 20,665 30,152 4,255 6,025 10,280 (24,747) 19,218 (5,529) Earnings attributable to noncontrolling interest - 599 599 - 603 603 - - - - - - - - - Net income as reported (GAAP) 41,460 $ 54,523 $ 95,983 $ 51,565 $ 55,098 $ 106,663 $ 49,091 $ 71,132 $ 120,223 $ 24,110 $ 35,432 $ 59,542 $ (84,935) $ 53,789 $ (31,146) $ Jun. 30, 2020 Mar. 31, 2020 Dec. 31, 2019 Sep. 30, 2019 Jun. 30, 2019 |
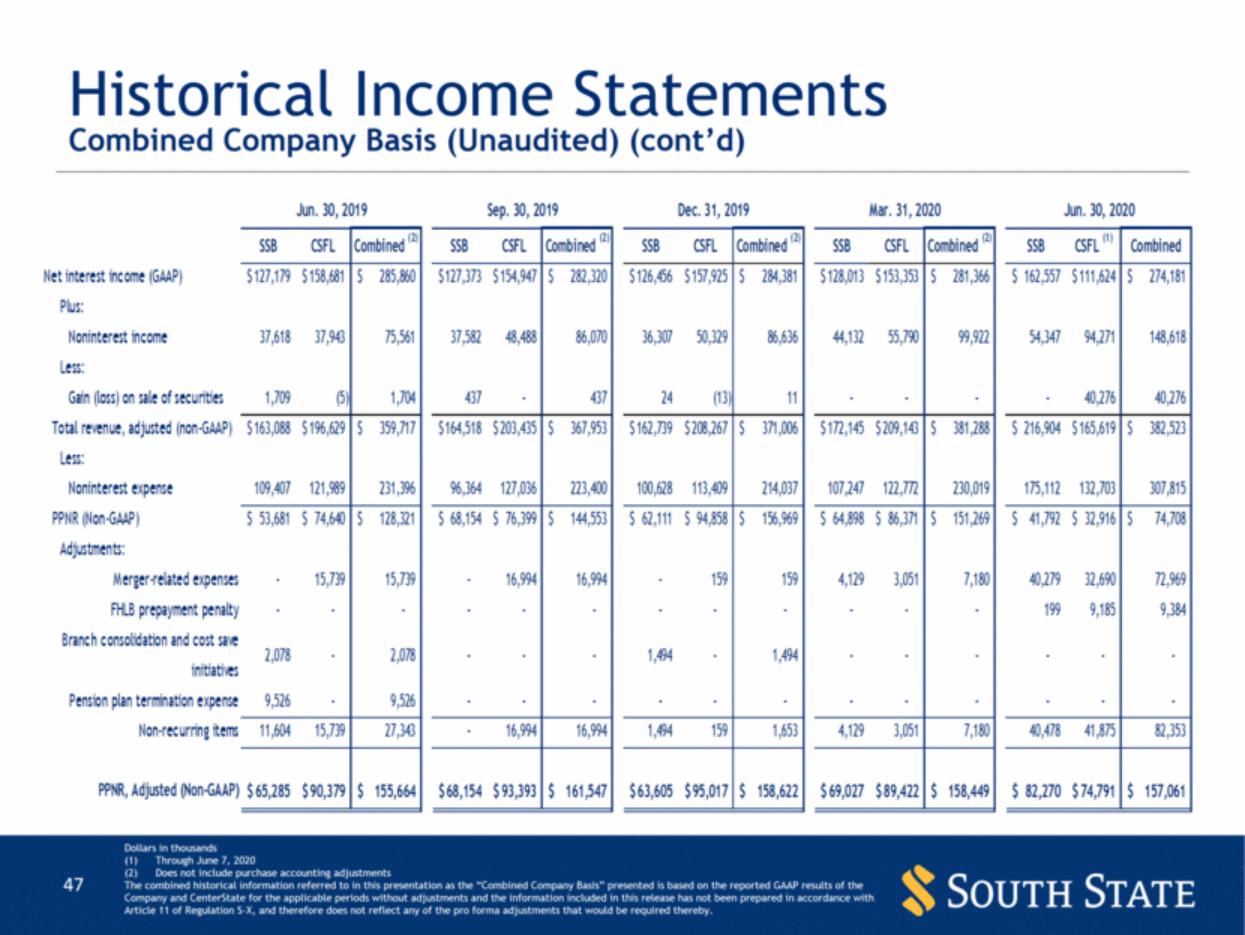
| Historical Income Statements Combined Company Basis (Unaudited) (cont’d) Dollars in thousands Through June 7, 2020 Does not include purchase accounting adjustments The combined historical information referred to in this presentation as the “Combined Company Basis” presented is based on the reported GAAP results of the Company and CenterState for the applicable periods without adjustments and the information included in this release has not been prepared in accordance with Article 11 of Regulation S-X, and therefore does not reflect any of the pro forma adjustments that would be required thereby. SSB CSFL Combined (2) SSB CSFL Combined (2) SSB CSFL Combined (2) SSB CSFL Combined (2) SSB CSFL (1) Combined Net interest income (GAAP) 127,179 $ 158,681 $ 285,860 $ 127,373 $ 154,947 $ 282,320 $ 126,456 $ 157,925 $ 284,381 $ 128,013 $ 153,353 $ 281,366 $ 162,557 $ 111,624 $ 274,181 $ Plus: Noninterest income 37,618 37,943 75,561 37,582 48,488 86,070 36,307 50,329 86,636 44,132 55,790 99,922 54,347 94,271 148,618 Less: Gain (loss) on sale of securities 1,709 (5) 1,704 437 - 437 24 (13) 11 - - - - 40,276 40,276 Total revenue, adjusted (non-GAAP) 163,088 $ 196,629 $ 359,717 $ 164,518 $ 203,435 $ 367,953 $ 162,739 $ 208,267 $ 371,006 $ 172,145 $ 209,143 $ 381,288 $ 216,904 $ 165,619 $ 382,523 $ Less: Noninterest expense 109,407 121,989 231,396 96,364 127,036 223,400 100,628 113,409 214,037 107,247 122,772 230,019 175,112 132,703 307,815 PPNR (Non-GAAP) 53,681 $ 74,640 $ 128,321 $ 68,154 $ 76,399 $ 144,553 $ 62,111 $ 94,858 $ 156,969 $ 64,898 $ 86,371 $ 151,269 $ 41,792 $ 32,916 $ 74,708 $ Adjustments: Merger-related expenses - 15,739 15,739 - 16,994 16,994 - 159 159 4,129 3,051 7,180 40,279 32,690 72,969 FHLB prepayment penalty - - - - - - - - - - - - 199 9,185 9,384 Branch consolidation and cost save initiatives 2,078 - 2,078 - - - 1,494 - 1,494 - - - - - - Pension plan termination expense 9,526 - 9,526 - - - - - - - - - - - - Non-recurring items 11,604 15,739 27,343 - 16,994 16,994 1,494 159 1,653 4,129 3,051 7,180 40,478 41,875 82,353 PPNR, Adjusted (Non-GAAP) 65,285 $ 90,379 $ 155,664 $ 68,154 $ 93,393 $ 161,547 $ 63,605 $ 95,017 $ 158,622 $ 69,027 $ 89,422 $ 158,449 $ 82,270 $ 74,791 $ 157,061 $ Jun. 30, 2020 Mar. 31, 2020 Dec. 31, 2019 Sep. 30, 2019 Jun. 30, 2019 |
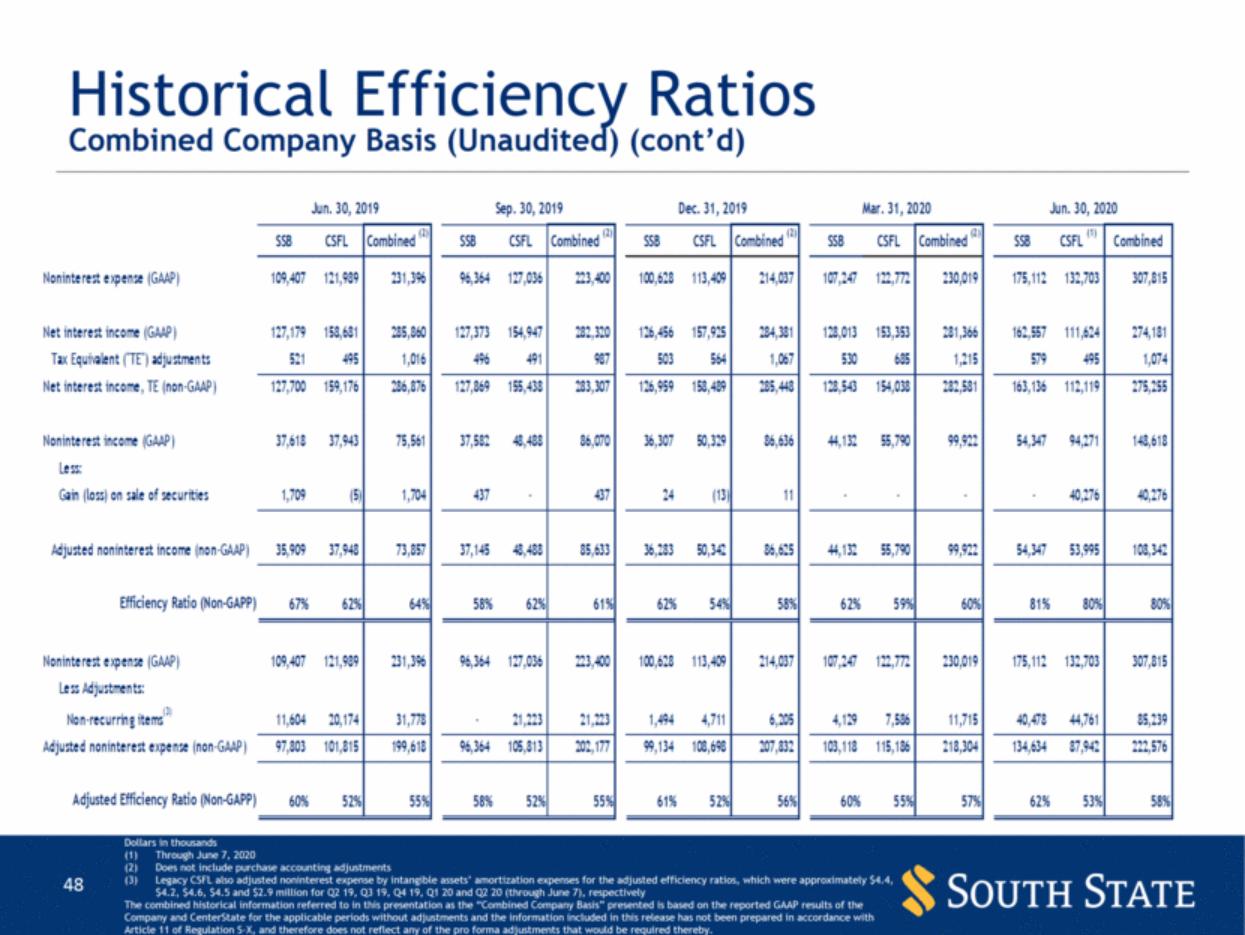
| Historical Efficiency Ratios Combined Company Basis (Unaudited) (cont’d) Dollars in thousands Through June 7, 2020 Does not include purchase accounting adjustments Legacy CSFL also adjusted noninterest expense by intangible assets’ amortization expenses for the adjusted efficiency ratios, which were approximately $4.4, $4.2, $4.6, $4.5 and $2.9 million for Q2 19, Q3 19, Q4 19, Q1 20 and Q2 20 (through June 7), respectively The combined historical information referred to in this presentation as the “Combined Company Basis” presented is based on the reported GAAP results of the Company and CenterState for the applicable periods without adjustments and the information included in this release has not been prepared in accordance with Article 11 of Regulation S-X, and therefore does not reflect any of the pro forma adjustments that would be required thereby. SSB CSFL Combined (2) SSB CSFL Combined (2) SSB CSFL Combined (2) SSB CSFL Combined (2) SSB CSFL (1) Combined Noninterest expense (GAAP) 109,407 121,989 231,396 96,364 127,036 223,400 100,628 113,409 214,037 107,247 122,772 230,019 175,112 132,703 307,815 Net interest income (GAAP) 127,179 158,681 285,860 127,373 154,947 282,320 126,456 157,925 284,381 128,013 153,353 281,366 162,557 111,624 274,181 Tax Equivalent ("TE") adjustments 521 495 1,016 496 491 987 503 564 1,067 530 685 1,215 579 495 1,074 Net interest income, TE (non-GAAP) 127,700 159,176 286,876 127,869 155,438 283,307 126,959 158,489 285,448 128,543 154,038 282,581 163,136 112,119 275,255 Noninterest income (GAAP) 37,618 37,943 75,561 37,582 48,488 86,070 36,307 50,329 86,636 44,132 55,790 99,922 54,347 94,271 148,618 Less: Gain (loss) on sale of securities 1,709 (5) 1,704 437 - 437 24 (13) 11 - - - - 40,276 40,276 Adjusted noninterest income (non-GAAP) 35,909 37,948 73,857 37,145 48,488 85,633 36,283 50,342 86,625 44,132 55,790 99,922 54,347 53,995 108,342 Efficiency Ratio (Non-GAPP) 67% 62% 64% 58% 62% 61% 62% 54% 58% 62% 59% 60% 81% 80% 80% Noninterest expense (GAAP) 109,407 121,989 231,396 96,364 127,036 223,400 100,628 113,409 214,037 107,247 122,772 230,019 175,112 132,703 307,815 Less Adjustments: Non-recurring items (3) 11,604 20,174 31,778 - 21,223 21,223 1,494 4,711 6,205 4,129 7,586 11,715 40,478 44,761 85,239 Adjusted noninterest expense (non-GAAP) 97,803 101,815 199,618 96,364 105,813 202,177 99,134 108,698 207,832 103,118 115,186 218,304 134,634 87,942 222,576 Adjusted Efficiency Ratio (Non-GAPP) 60% 52% 55% 58% 52% 55% 61% 52% 56% 60% 55% 57% 62% 53% 58% Jun. 30, 2020 Mar. 31, 2020 Dec. 31, 2019 Sep. 30, 2019 Jun. 30, 2019 |
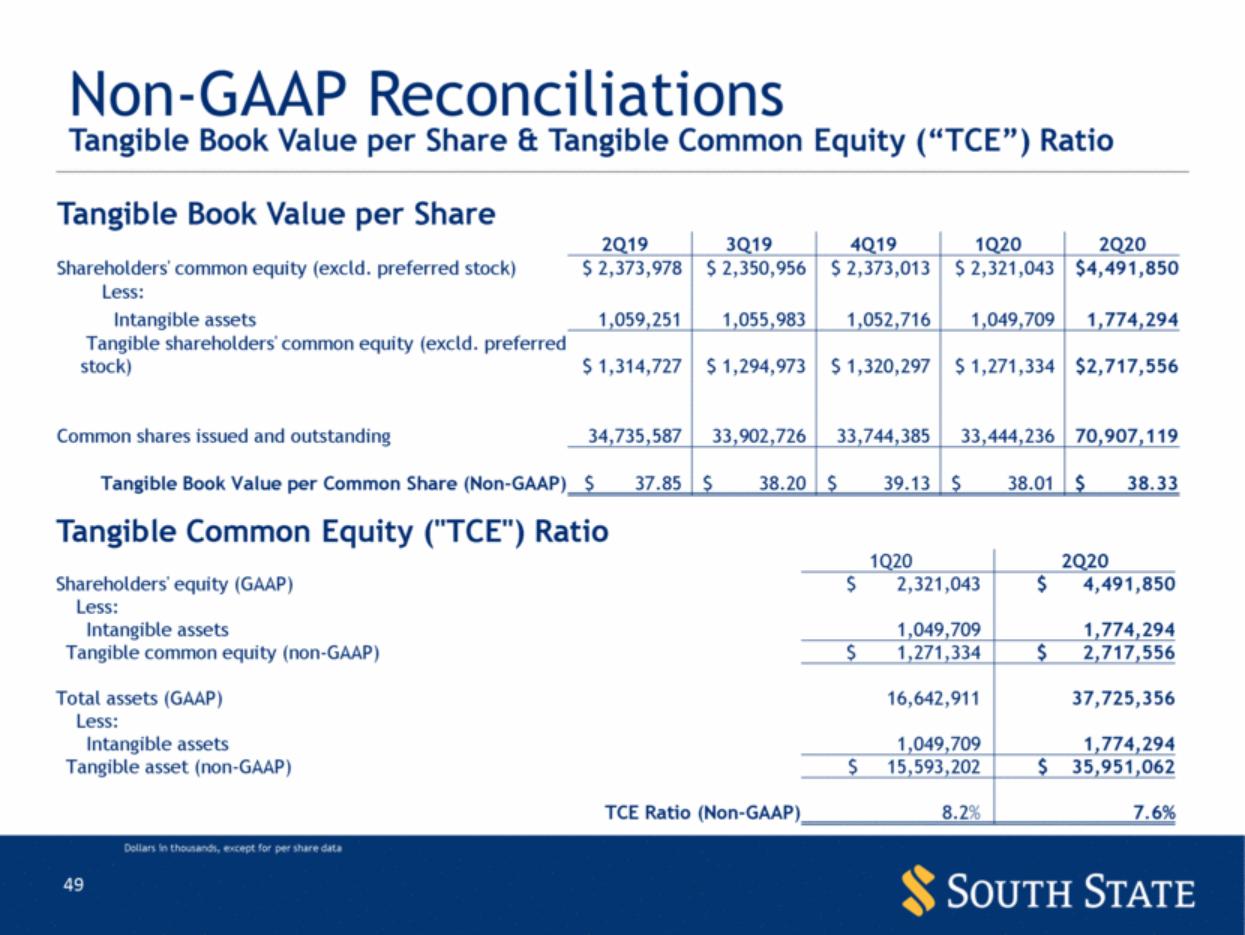
| Non-GAAP Reconciliations Tangible Book Value per Share & Tangible Common Equity (“TCE”) Ratio Dollars in thousands, except for per share data Tangible Book Value per Share 2Q19 3Q19 4Q19 1Q20 2Q20 Shareholders' common equity (excld. preferred stock) $ 2,373,978 $ 2,350,956 $ 2,373,013 $ 2,321,043 $4,491,850 Less: Intangible assets 1,059,251 1,055,983 1,052,716 1,049,709 1,774,294 Tangible shareholders' common equity (excld. preferred stock) $ 1,314,727 $ 1,294,973 $ 1,320,297 $ 1,271,334 $2,717,556 Common shares issued and outstanding 34,735,587 33,902,726 33,744,385 33,444,236 70,907,119 Tangible Book Value per Common Share (Non-GAAP) $ 37.85 $ 38.20 $ 39.13 $ 38.01 $ 38.33 Tangible Common Equity ("TCE") Ratio 1Q20 2Q20 Shareholders' equity (GAAP) $ 2,321,043 $ 4,491,850 Less: Intangible assets 1,049,709 1,774,294 Tangible common equity (non-GAAP) $ 1,271,334 $ 2,717,556 Total assets (GAAP) 16,642,911 37,725,356 Less: Intangible assets 1,049,709 1,774,294 Tangible asset (non-GAAP) $ 15,593,202 $ 35,951,062 TCE Ratio (Non-GAAP) 8.2% 7.6% 49 |
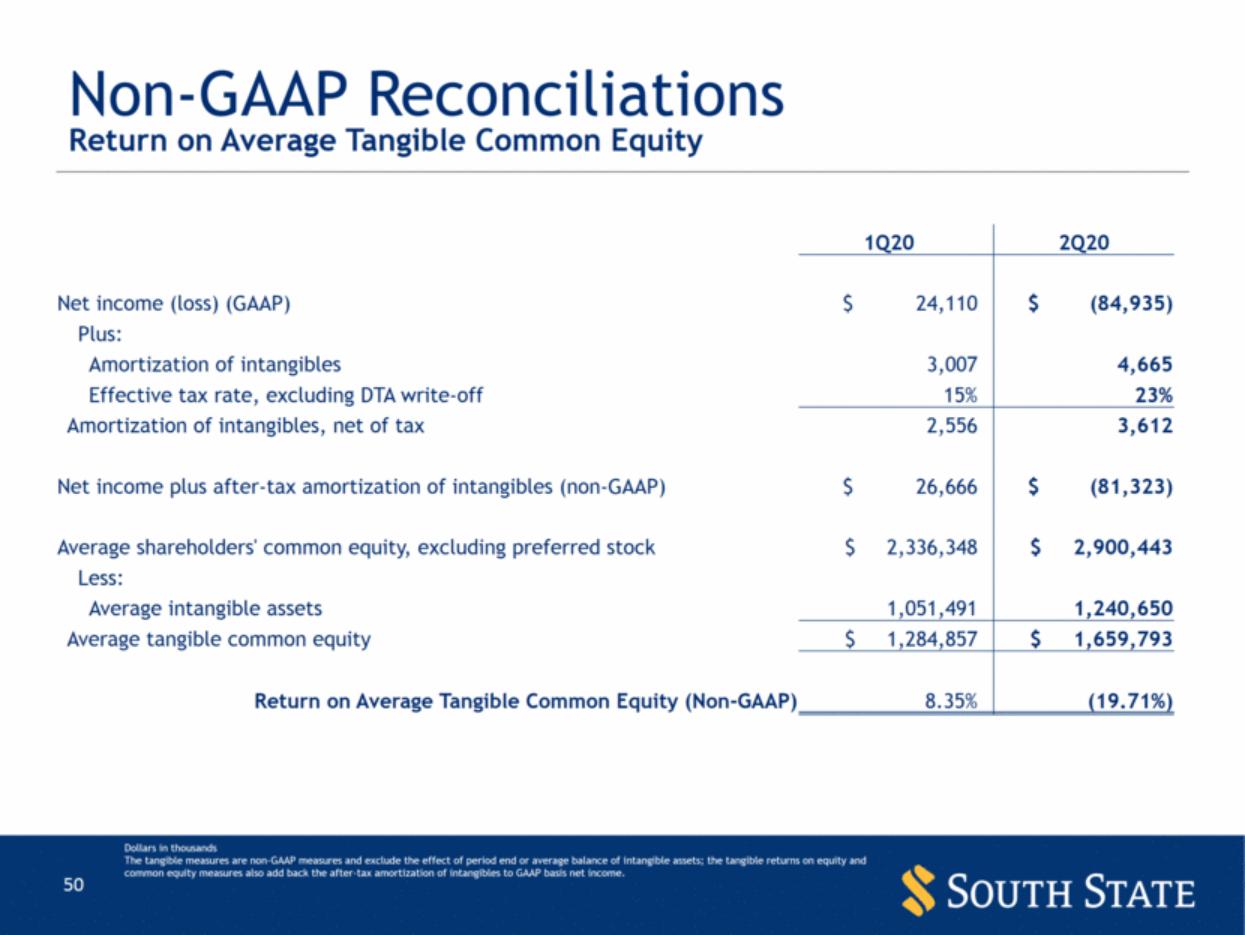
| Non-GAAP Reconciliations Return on Average Tangible Common Equity 1Q20 2Q20 Net income (loss) (GAAP) $ 24,110 $ (84,935) Plus: Amortization of intangibles 3,007 4,665 Effective tax rate, excluding DTA write-off 15% 23% Amortization of intangibles, net of tax 2,556 3,612 Net income plus after-tax amortization of intangibles (non-GAAP) $ 26,666 $ (81,323) Average shareholders' common equity, excluding preferred stock $ 2,336,348 $ 2,900,443 Less: Average intangible assets 1,051,491 1,240,650 Average tangible common equity $ 1,284,857 $ 1,659,793 Return on Average Tangible Common Equity (Non-GAAP) 8.35% (19.71%) Dollars in thousands The tangible measures are non-GAAP measures and exclude the effect of period end or average balance of intangible assets; the tangible returns on equity and common equity measures also add back the after-tax amortization of intangibles to GAAP basis net income. |
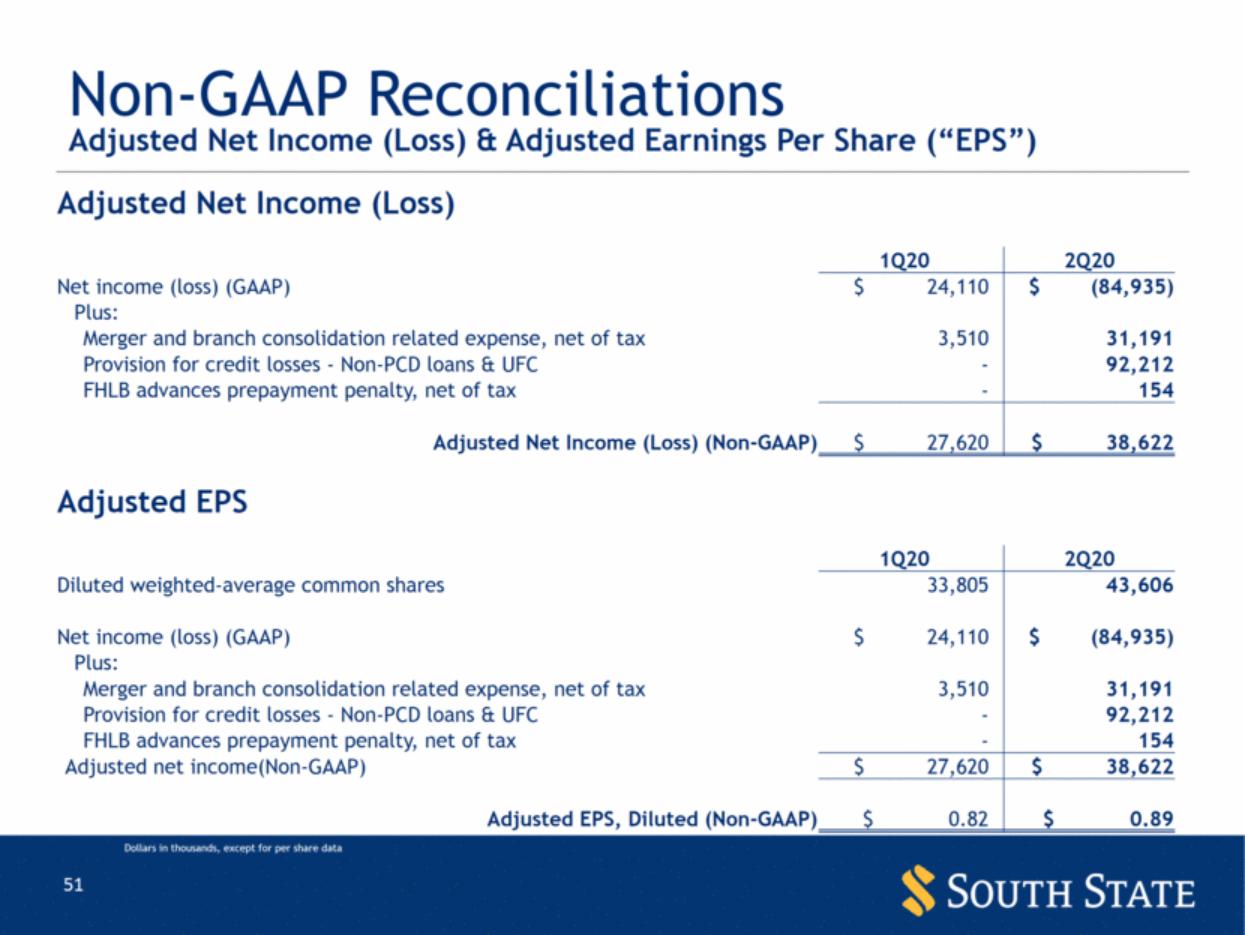
| Adjusted Net Income (Loss) 1Q20 2Q20 Net income (loss) (GAAP) $ 24,110 $ (84,935) Plus: Merger and branch consolidation related expense, net of tax 3,510 31,191 Provision for credit losses - Non-PCD loans & UFC - 92,212 FHLB advances prepayment penalty, net of tax - 154 Adjusted Net Income (Loss) (Non-GAAP) $ 27,620 $ 38,622 Adjusted EPS 1Q20 2Q20 Diluted weighted-average common shares 33,805 43,606 Net income (loss) (GAAP) $ 24,110 $ (84,935) Plus: Merger and branch consolidation related expense, net of tax 3,510 31,191 Provision for credit losses - Non-PCD loans & UFC - 92,212 FHLB advances prepayment penalty, net of tax - 154 Adjusted net income(Non-GAAP) $ 27,620 $ 38,622 Adjusted EPS, Diluted (Non-GAAP) $ 0.82 $ 0.89 Non-GAAP Reconciliations Adjusted Net Income (Loss) & Adjusted Earnings Per Share (“EPS”) Dollars in thousands, except for per share data |
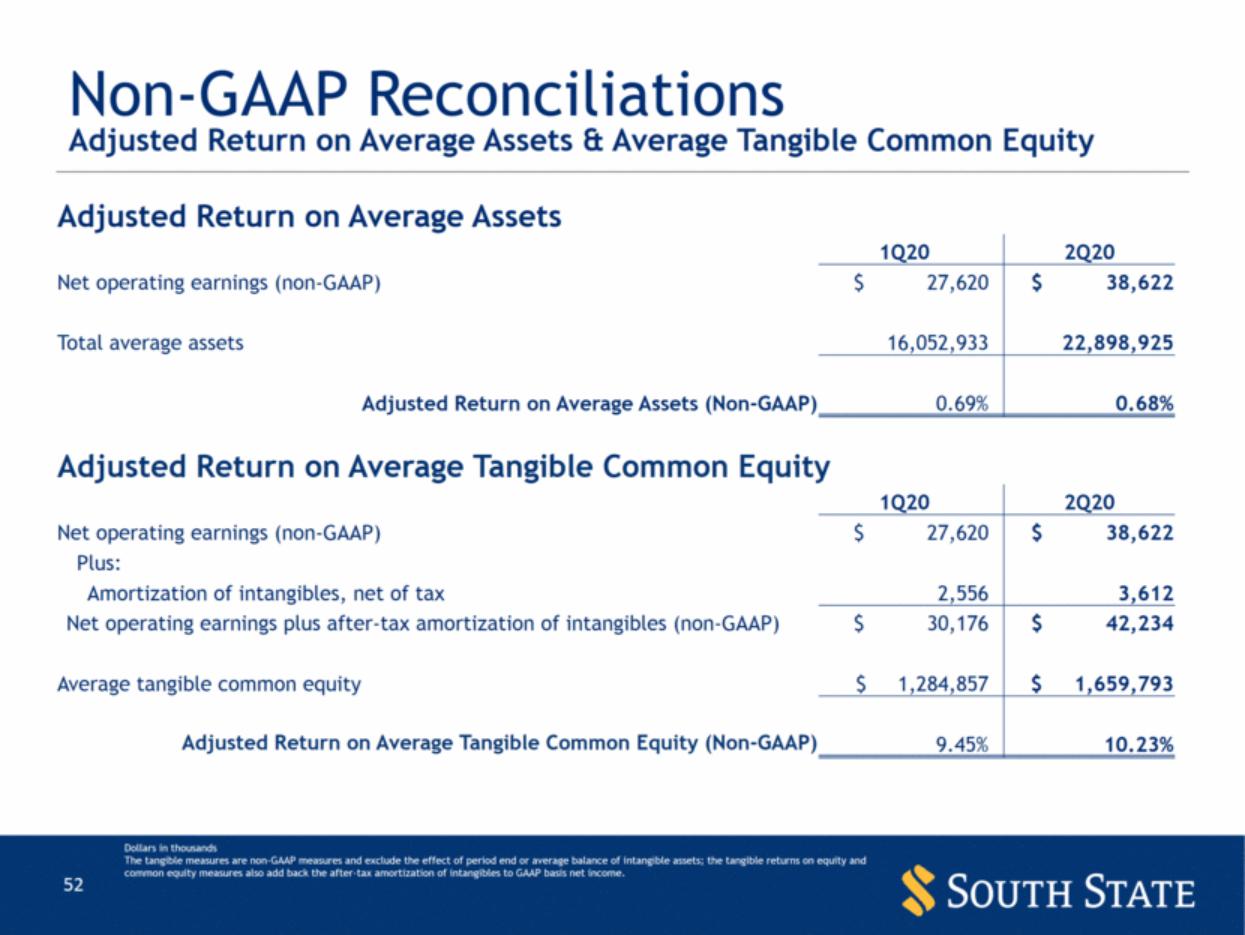
| Non-GAAP Reconciliations Adjusted Return on Average Assets & Average Tangible Common Equity Adjusted Return on Average Assets 1Q20 2Q20 Net operating earnings (non-GAAP) $ 27,620 $ 38,622 Total average assets 16,052,933 22,898,925 Adjusted Return on Average Assets (Non-GAAP) 0.69% 0.68% Adjusted Return on Average Tangible Common Equity 1Q20 2Q20 Net operating earnings (non-GAAP) $ 27,620 $ 38,622 Plus: Amortization of intangibles, net of tax 2,556 3,612 Net operating earnings plus after-tax amortization of intangibles (non-GAAP) $ 30,176 $ 42,234 Average tangible common equity $ 1,284,857 $ 1,659,793 Adjusted Return on Average Tangible Common Equity (Non-GAAP) 9.45% 10.23% Dollars in thousands The tangible measures are non-GAAP measures and exclude the effect of period end or average balance of intangible assets; the tangible returns on equity and common equity measures also add back the after-tax amortization of intangibles to GAAP basis net income. |
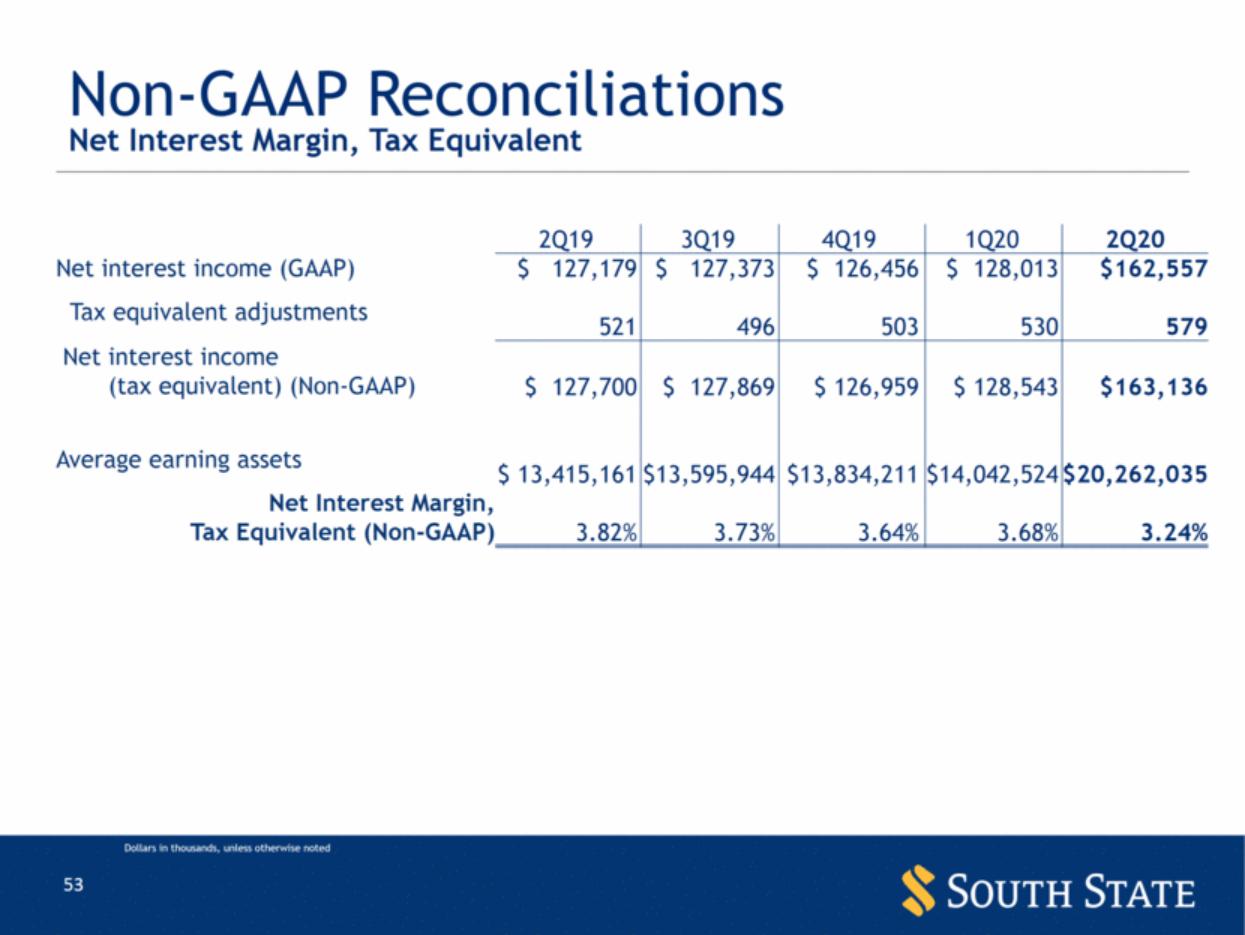
| Non-GAAP Reconciliations Net Interest Margin, Tax Equivalent Dollars in thousands, unless otherwise noted 2Q19 3Q19 4Q19 1Q20 2Q20 Net interest income (GAAP) $ 127,179 $ 127,373 $ 126,456 $ 128,013 $162,557 Tax equivalent adjustments 521 496 503 530 579 Net interest income (tax equivalent) (Non-GAAP) $ 127,700 $ 127,869 $ 126,959 $ 128,543 $163,136 Average earning assets $ 13,415,161 $13,595,944 $13,834,211 $14,042,524 $20,262,035 Net Interest Margin, Tax Equivalent (Non-GAAP) 3.82% 3.73% 3.64% 3.68% 3.24% |
| Non-GAAP Reconciliations Acquired Non-PCD Provision and Merger Expense Impact to EPS (Non-GAAP) Dollars in millions, except per share data Diluted At effective tax rate of 22.56% 2Q20 Net Loss (GAAP) $ (84,935) Weighted average common shares outstanding 43,318 Earnings Per Share ("EPS"), diluted $ (1.96) Q2 Provision expense on acquired non-PCD & UFC, net of tax(1) (93,094) EPS Impact $ (2.15) Q2 Merger expense, net of tax(1) (31,192) EPS Impact $ (0.72) Q3 projected weighted average common shares outstanding 71,011 Projected cost saves, net of tax(1) $ 61,952 EPS Impact $ 0.87 |

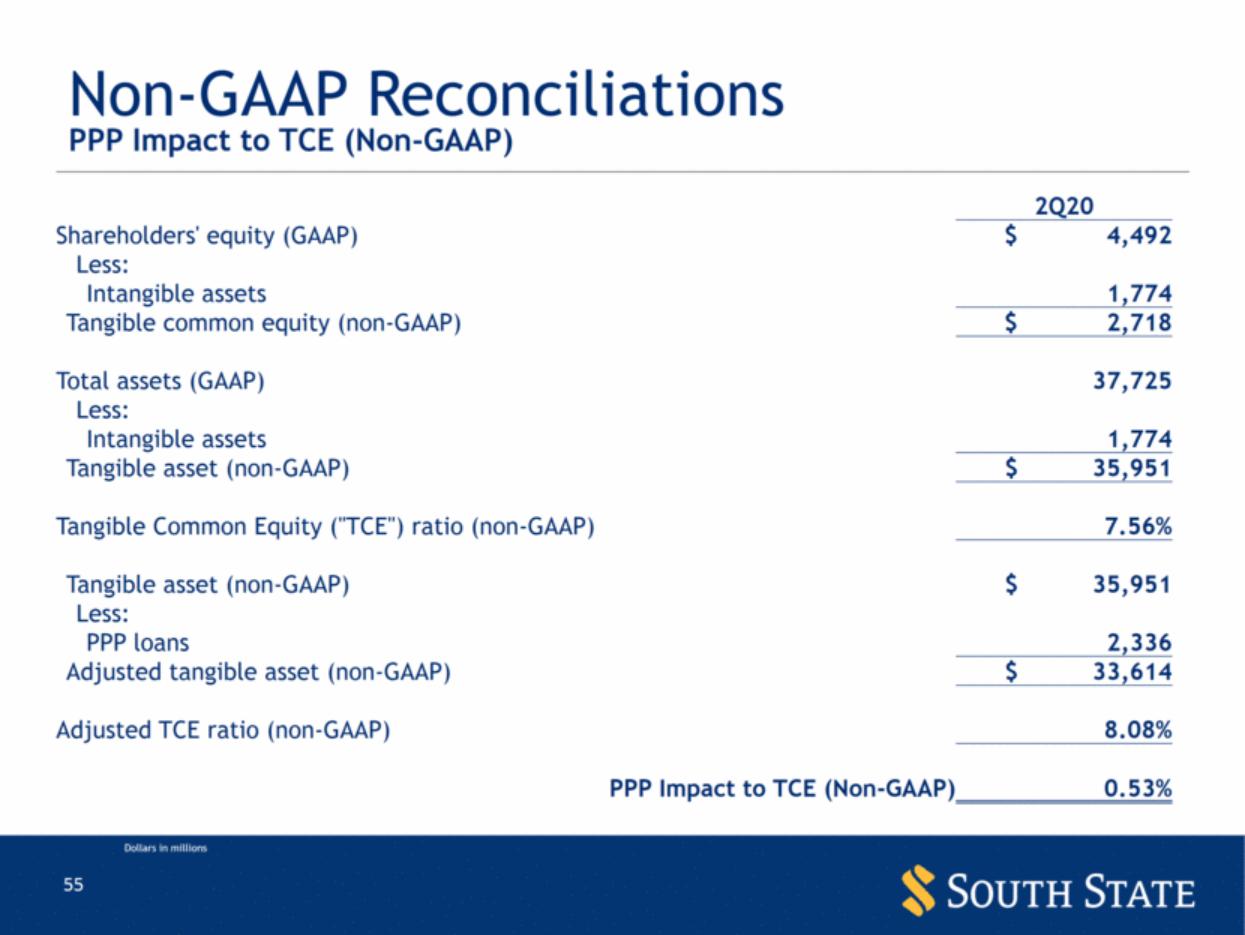
| Non-GAAP Reconciliations PPP Impact to TCE (Non-GAAP) Dollars in millions 2Q20 Shareholders' equity (GAAP) $ 4,492 Less: Intangible assets 1,774 Tangible common equity (non-GAAP) $ 2,718 Total assets (GAAP) 37,725 Less: Intangible assets 1,774 Tangible asset (non-GAAP) $ 35,951 Tangible Common Equity ("TCE") ratio (non-GAAP) 7.56% Tangible asset (non-GAAP) $ 35,951 Less: PPP loans 2,336 Adjusted tangible asset (non-GAAP) $ 33,614 Adjusted TCE ratio (non-GAAP) 8.08% PPP Impact to TCE (Non-GAAP) 0.53% |
| [LOGO] |