Attached files
| file | filename |
|---|---|
| EX-99.1 - EXHIBIT 99.1 - SANMINA CORP | tm2026219d1_ex99-1.htm |
| 8-K/A - FORM 8-K/A - SANMINA CORP | tm2026219d1_8ka.htm |
Exhibit 99.2

WHAT WE MAKE, MAKES A DIFFERENCE Concept to Delivery / Advanced Technology / Manufacturing & Global Supply Chain Solutions / Systems & Intelligence Sanmina July 29, 2020 Q3 FY20 Results

2 Safe Harbor Statement Certain statements made during this presentation, including the Company's outlook for the fourth quarter fiscal 2020 financial results, constitutes forward - looking statements within the meaning of the safe harbor provisions of Section 21E of the Securities Exchange Act of 1934. Actual results could differ materially from those projected in these statements as a result of a number of factors, mostly notably the ongoing impacts of the COVID - 19 pandemic, which have reduced demand from our customers, caused supply chain interruptions and created health risks for our employees, and which could result in restrictions on where we can build products, the levels of staffing we can maintain at our plants and the types of products we can build for our customers. Other factors that could cause our results to differ from our outlook include adverse changes to the key markets we target; significant uncertainties that can cause our future sales and net income to be variable; reliance on a small number of customers for a substantial portion of our sales; risks arising from our international operations; and the other factors set forth in the Company's annual and quarterly reports filed with the Securities Exchange Commission (“SEC ”). In addition, during the course of today's presentation, we will refer to certain non - GAAP financial information. The corresponding GAAP financial information and a reconciliation of the non - GAAP financial information during this presentation to their most directly comparable GAAP measures are included on slide 19 of this presentation. The Company is under no obligation to (and expressly disclaims any such obligation to) update or alter any of the forward - looking statements made in this earnings release, the conference call or the Investor Relations section of our website whethe r as a result of new information, future events or otherwise, unless otherwise required by law.

Q3 FY20 Non - GAAP P&L Summary 3
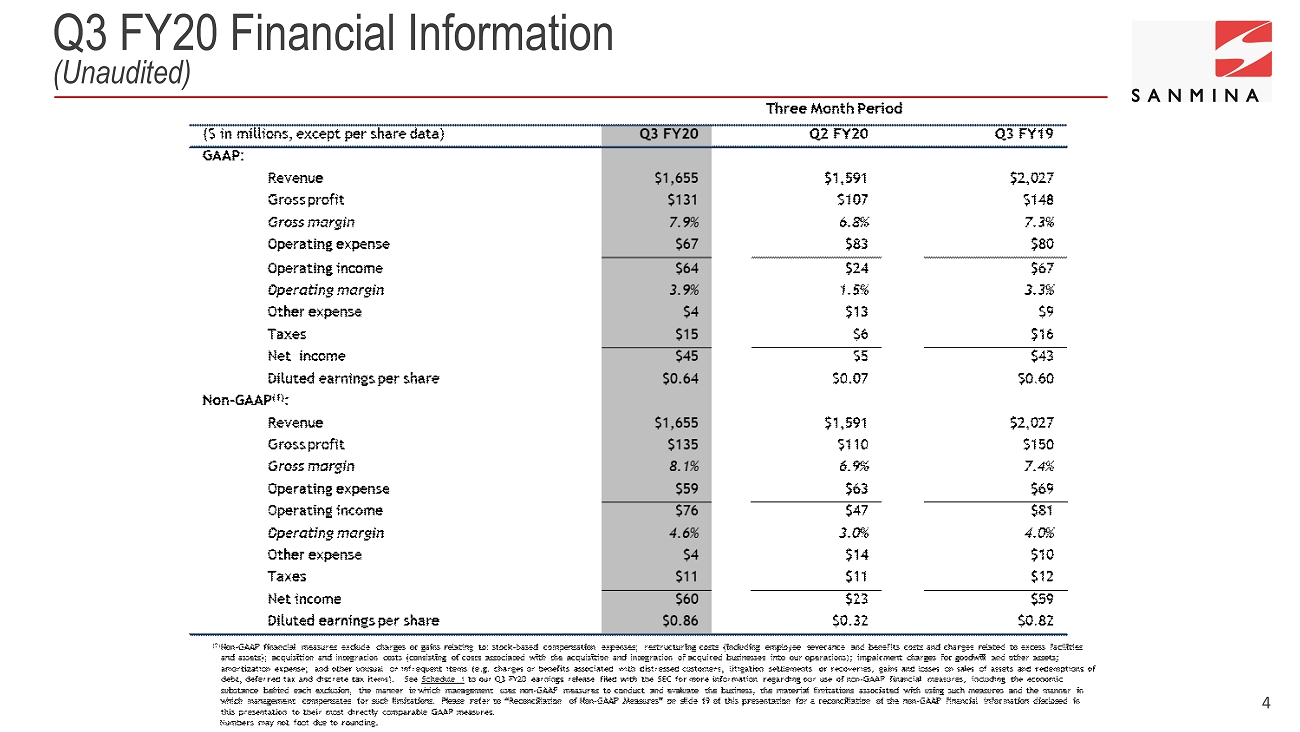
Q3 FY20 Financial Information (Unaudited) 4
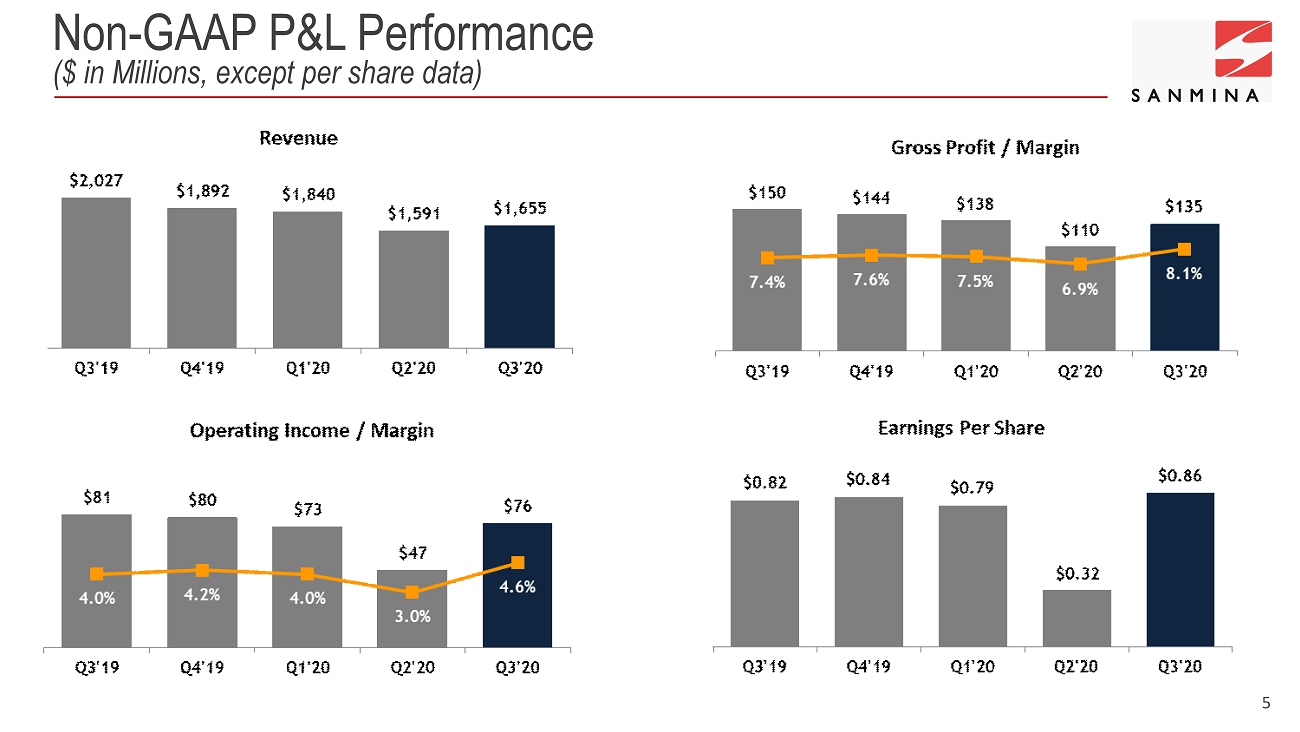
Non - GAAP P&L Performance ($ in Millions, except per share data ) 5

6 Segment Reporting - Revenue and Non - GAAP Gross Margin* ($ in Millions)
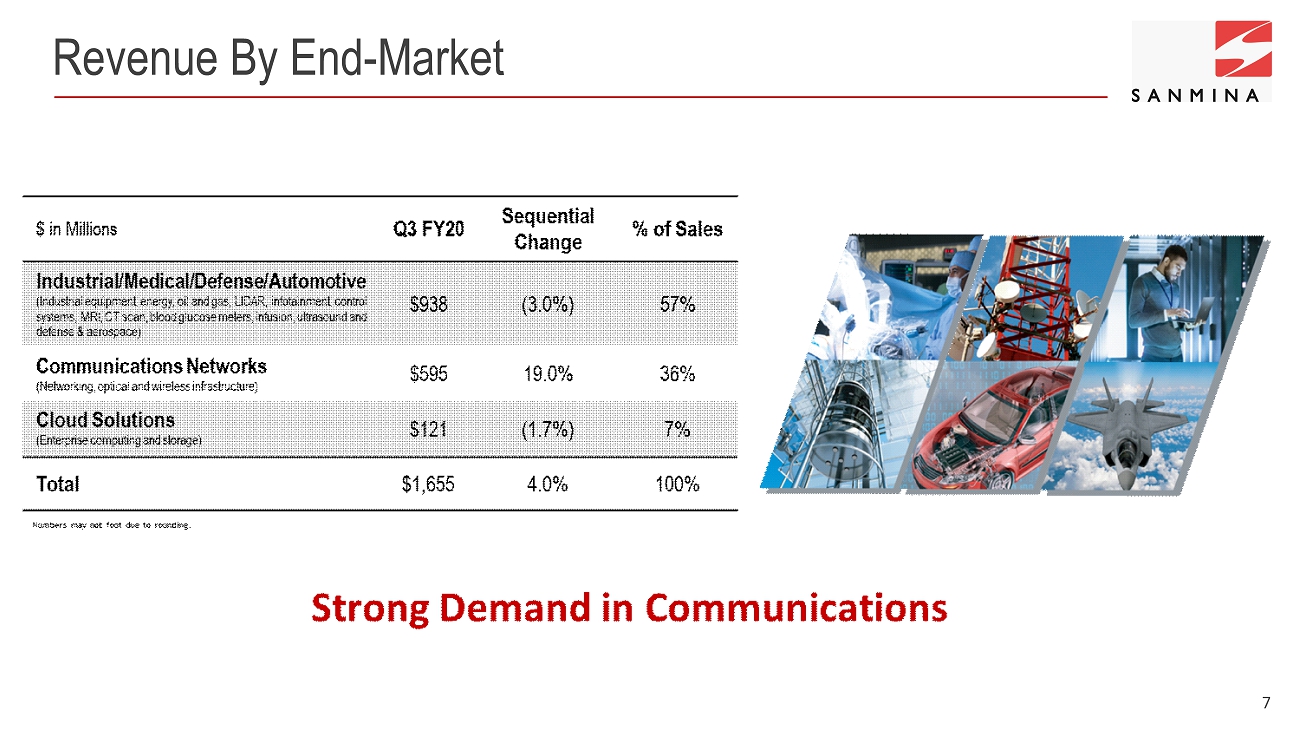
7 Revenue By End - Market
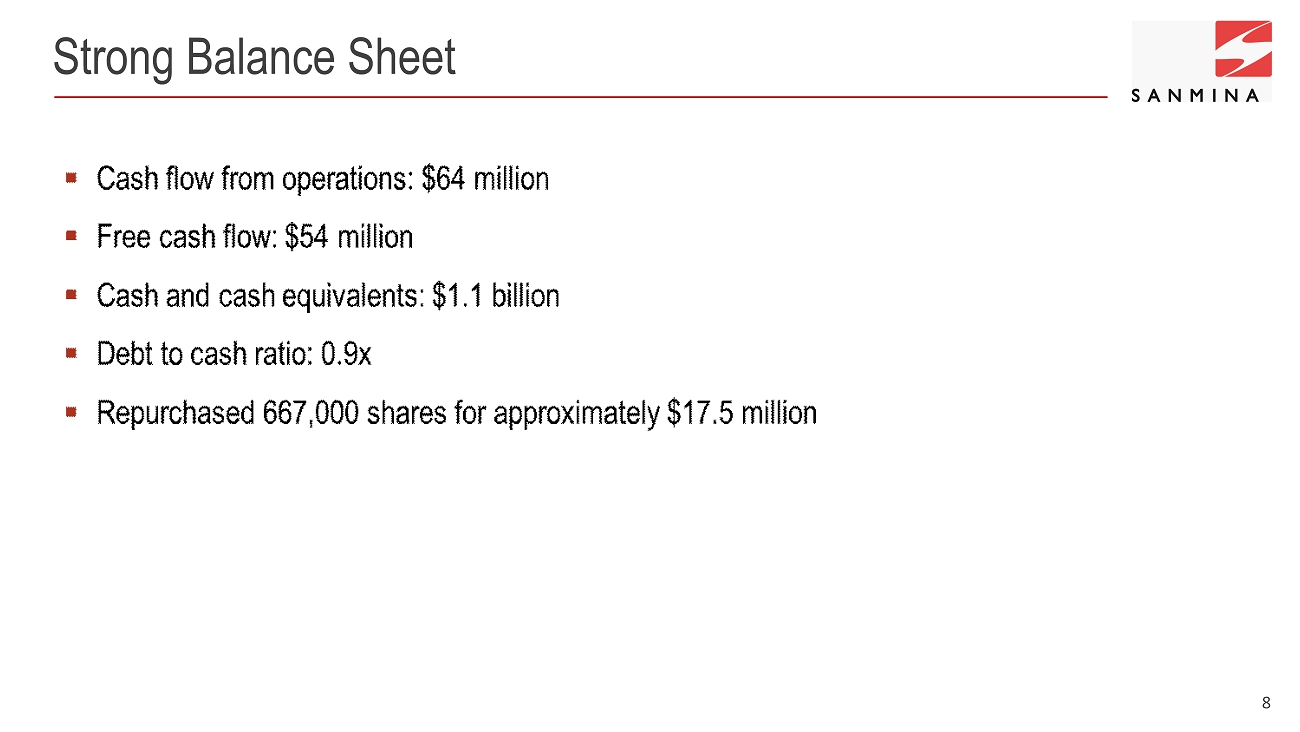
8 Strong Balance Sheet

9 Summary Balance Sheet ($ in Millions)
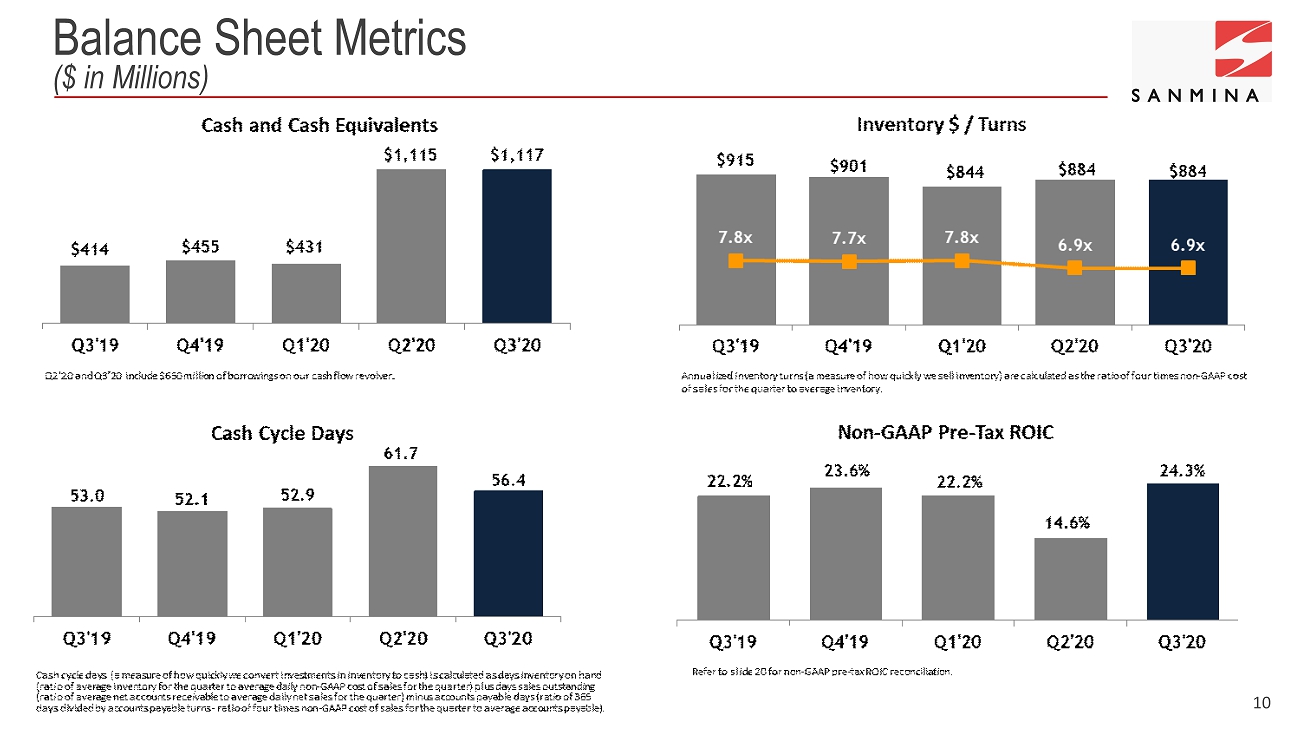
Balance Sheet Metrics ($ in Millions) 10

11 Q4 FY20 Outlook* *The outlook and statements made in this slide constitute forward - looking statements within the meaning of the safe harbor provisions of Section 21E of the Securities Exchange Act of 1934. Actual res ult s could differ materially from those projected in these statements as a result of a number of factors, mostly notably the ongoing impacts of the COVID - 19 pandemic which have and are ex pected to continue to reduce demand from our customers, interrupt the flow of components needed for our customers’ products, restrict the types of products we can build for our customers and create health risks to our employees and which could result in restrictions on where we can build products, the levels of staffing we can maintain at ou r p lants and the types of products we can build for our customers. Other factors that could cause our results to differ from our outlook include adverse changes to the key markets we target; s ign ificant uncertainties that can cause our future sales and net income to be variable; reliance on a small number of customers for a substantial portion of our sales; risks arising from our international operations; and the other factors set forth in the Company's annual and quarterly reports file d w ith the Securities Exchange Commission (“SEC ”). The Company is under no obligation to (and expressly disclaims any such obligation to) update or alter any of the forward - lookin g statements made in this earnings presentation, the conference call or the Investor Relations section of our website whether as a result of new information, future events or otherwise, unless otherwise required by law.

WHAT WE MAKE, MAKES A DIFFERENCE Concept to Delivery / Advanced Technology / Manufacturing & Global Supply Chain Solutions / Systems & Intelligence Sanmina CEO Remarks 12
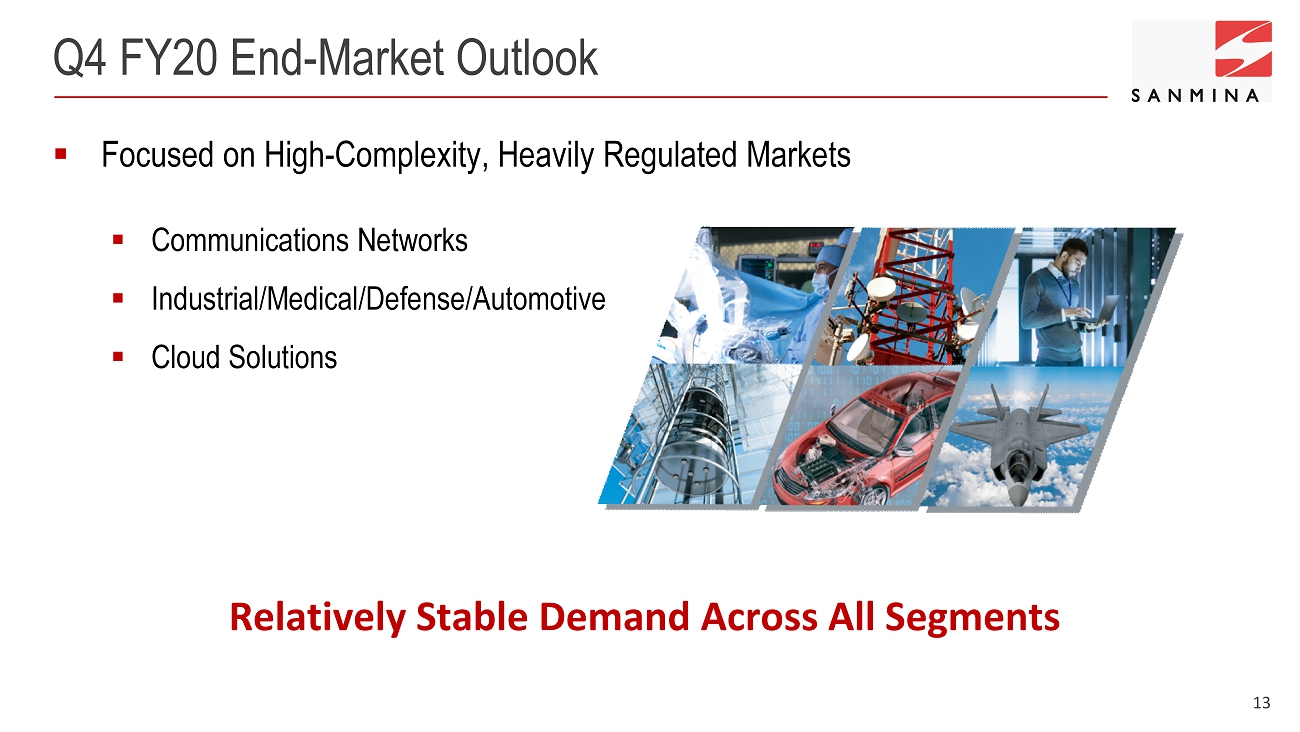
13 Q4 FY20 End - Market Outlook ▪ Focused on High - Complexity, Heavily Regulated Markets ▪ Communications Networks ▪ Industrial/Medical/Defense/Automotive ▪ Cloud Solutions Relatively Stable Demand Across All Segments

14 Key Initiatives
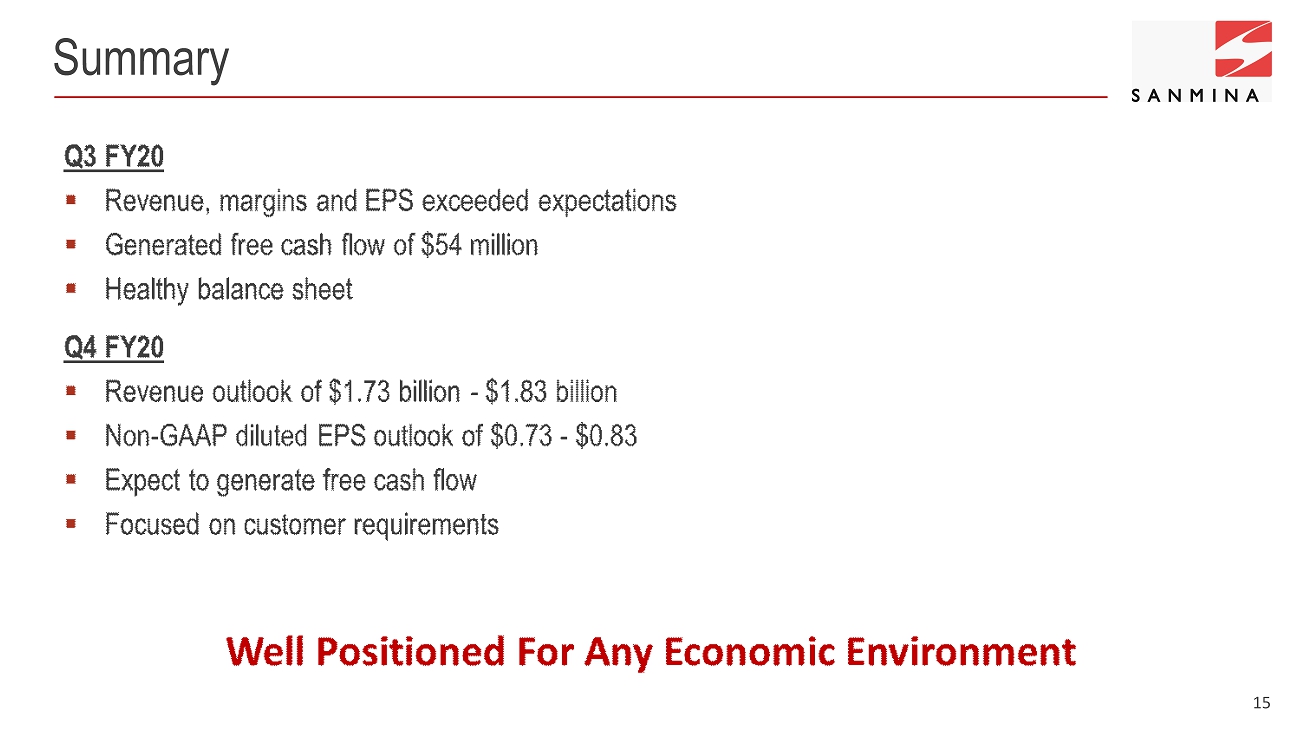
15 Summary


17 GAAP Condensed Consolidated Balance Sheet June 27, September 28, 2020 2019 ASSETS Current assets: Cash and cash equivalents 1,117,217$ 454,741$ Short-term investments 30,000 - Accounts receivable, net 1,042,011 1,128,379 Contract assets 381,249 396,300 Inventories 883,670 900,557 Prepaid expenses and other current assets 45,965 40,952 Total current assets 3,500,112 2,920,929 Property, plant and equipment, net 574,799 630,647 Deferred tax assets 277,285 279,803 Other 122,503 74,134 Total assets 4,474,699$ 3,905,513$ LIABILITIES AND STOCKHOLDERS' EQUITY Current liabilities: Accounts payable 1,252,116$ 1,336,914$ Accrued liabilities 175,793 180,107 Accrued payroll and related benefits 111,699 127,647 Short-term debt, including current portion of long-term debt 673,437 38,354 Total current liabilities 2,213,045 1,683,022 Long-term liabilities: Long-term debt 333,675 346,971 Other 274,497 232,947 Total long-term liabilities 608,172 579,918 Stockholders' equity 1,653,482 1,642,573 Total liabilities and stockholders' equity 4,474,699$ 3,905,513$ (Unaudited) ($ in thousands)

18 GAAP Condensed Consolidated Statement of Operations (Unaudited) June 27, June 29, June 27, June 29, 2020 2019 2020 2019 Net sales 1,654,691$ 2,026,995$ 5,085,412$ 6,341,652$ Cost of sales 1,523,218 1,879,200 4,711,636 5,891,418 Gross profit 131,473 147,795 373,776 450,234 Operating expenses: Selling, general and administrative 59,314 66,768 184,722 193,982 Research and development 5,181 7,272 16,148 21,308 Restructuring and other costs 2,875 6,381 27,253 11,912 Total operating expenses 67,370 80,421 228,123 227,202 Operating income 64,103 67,374 145,653 223,032 Interest income 764 330 1,492 888 Interest expense (8,460) (7,599) (20,377) (24,342) Other income (expense), net 3,200 (1,480) (3,142) (8,365) Interest and other, net (4,496) (8,749) (22,027) (31,819) Income before income taxes 59,607 58,625 123,626 191,213 Provision for income taxes 14,727 15,704 35,519 69,455 Net income 44,880$ 42,921$ 88,107$ 121,758$ Basic income per share 0.66$ 0.62$ 1.26$ 1.77$ Diluted income per share 0.64$ 0.60$ 1.23$ 1.70$ Weighted-average shares used in computing per share amounts: Basic 68,216 69,499 69,657 68,872 Diluted 69,645 72,007 71,504 71,460 ($ in thousands, except per share data) Nine Months EndedThree Months Ended

Reconciliation of Non - GAAP Measures (Unaudited) 19 ($ in thousands, except per share data) Q3'20 Q2'20 Q1'20 Q4'19 Q3'19 GAAP Gross Profit 131,473$ 107,421$ 134,882$ 141,704$ 147,795$ GAAP gross margin 7.9% 6.8% 7.3% 7.5% 7.3% Adjustments Stock compensation expense (1) 2,772 2,582 2,912 2,711 2,729 Distressed customer charges (2) 330 - - (49) (804) Non-GAAP Gross Profit 134,575$ 110,003$ 137,794$ 144,366$ 149,720$ Non-GAAP gross margin 8.1% 6.9% 7.5% 7.6% 7.4% GAAP Operating Expenses 67,370$ 83,052$ 77,701$ 78,619$ 80,421$ Adjustments Stock compensation expense (1) (4,582) (5,201) (3,994) (7,555) (5,407) Amortization of intangible assets (63) (63) (190) (190) (190) Distressed customer charges (2) (1,169) - - - - Restructuring costs (2,812) (8,356) (9,160) (2,411) (6,191) Goodwill and other asset impairments - (6,609) - (3,724) - Non-GAAP Operating Expenses 58,744$ 62,823$ 64,357$ 64,739$ 68,633$ GAAP Operating Income 64,103$ 24,369$ 57,181$ 63,085$ 67,374$ GAAP operating margin 3.9% 1.5% 3.1% 3.3% 3.3% Adjustments Stock compensation expense (1) 7,354 7,783 6,906 10,266 8,136 Amortization of intangible assets 63 63 190 190 190 Distressed customer charges (2) 1,499 - - (49) (804) Restructuring costs 2,812 8,356 9,160 2,411 6,191 Goodwill and other asset impairments - 6,609 - 3,724 - Non-GAAP Operating Income 75,831$ 47,180$ 73,437$ 79,627$ 81,087$ Non-GAAP operating margin 4.6% 3.0% 4.0% 4.2% 4.0% GAAP Interest and Other, net (4,496)$ (13,282)$ (4,249)$ (8,679)$ (8,749)$ Adjustments Litigation settlements (3) - (259) - (830) Non-GAAP Interest and Other, net (4,496)$ (13,541)$ (4,249)$ (8,679)$ (9,579)$ GAAP Provision for Income Taxes 14,727$ 6,205$ 14,587$ 34,649$ 15,704$ Adjustments Tax impact of non-GAAP adjustments 602 222 391 337 263 Discrete tax items 3,152 3,244 (2,526) (3,983) 2,240 Deferred tax adjustments (7,141) 1,189 (690) (20,666) (5,872) Non-GAAP Provision for Income Taxes 11,340$ 10,860$ 11,762$ 10,337$ 12,335$ GAAP Net Income 44,880$ 4,882$ 38,345$ 19,757$ 42,921$ Adjustments: Operating income adjustments (see above) 11,728 22,811 16,256 16,542 13,713 Litigation settlements (3) - (259) - - (830) Adjustments for taxes 3,387 (4,655) 2,825 24,312 3,369 Non-GAAP Net Income 59,995$ 22,779$ 57,426$ 60,611$ 59,173$ GAAP Net Income Per Share: Basic 0.66$ 0.07$ 0.55$ 0.28$ 0.62$ Diluted 0.64$ 0.07$ 0.53$ 0.27$ 0.60$ Non-GAAP Net Income Per Share: Basic 0.88$ 0.32$ 0.82$ 0.87$ 0.85$ Diluted 0.86$ 0.32$ 0.79$ 0.84$ 0.82$ Basic 68,216 70,584 70,178 69,898 69,499 Diluted 69,645 72,245 72,598 72,294 72,007 (1) Stock compensation expense was as follows: Q3'20 Q2'20 Q1'20 Q4'19 Q3'19 Cost of sales 2,772$ 2,582$ 2,912$ 2,711$ 2,729$ Selling, general and administrative 4,496 5,127 3,925 7,550 5,328 Research and development 86 74 69 5 79 Total 7,354$ 7,783$ 6,906$ 10,266$ 8,136$ (2) (3) Represents cash received in connection with certain litigation settlements. Earnings Per Share Outlook: Low High GAAP diluted earnings per share 0.62$ 0.72$ Stock compensation expense 0.11$ 0.11$ Non-GAAP diluted earnings per share 0.73$ 0.83$ Three Month Periods Three Month Periods Q4 FY20 EPS Range* * Due to uncertainty regarding the timing of recognition of restructuring charges, impairment charges and charges for other unusual or infrequent items, if any, that could be incurred during the fourth quarter, an estimate of such charges is not included in the outlook for Q4 FY20 GAAP EPS. Relates to accounts receivable and inventory write-downs (recoveries) associated with distressed customers. Weighted-average shares used in computing per share amounts:
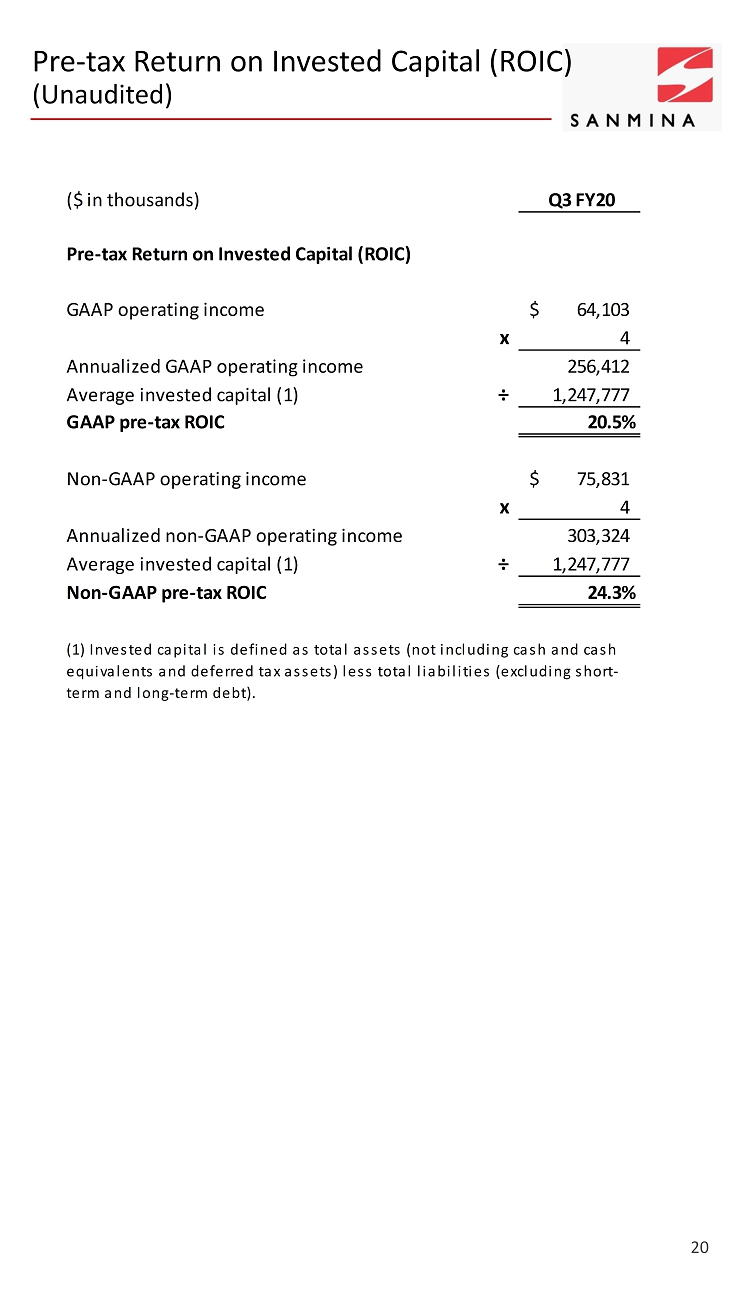
20 Pre - tax Return on Invested Capital (ROIC) (Unaudited) ($ in thousands) Q3 FY20 Pre-tax Return on Invested Capital (ROIC) GAAP operating income 64,103$ x 4 Annualized GAAP operating income 256,412 Average invested capital (1) ÷ 1,247,777 GAAP pre-tax ROIC 20.5% Non-GAAP operating income 75,831$ x 4 Annualized non-GAAP operating income 303,324 Average invested capital (1) ÷ 1,247,777 Non-GAAP pre-tax ROIC 24.3% (1) Invested capital is defined as total assets (not including cash and cash equivalents and deferred tax assets) less total liabilities (excluding short- term and long-term debt).

21 Condensed Consolidated Cash Flow (Unaudited) ($ in thousands) Q3'20 Q2'20 Q3'19 GAAP Net Income 44,880$ 4,882$ 42,921$ Depreciation and amortization 28,886 28,042 29,561 Other, net* 15,532 16,029 9,960 Net change in net working capital (25,531) 86,775 83,024 Cash provided by operating activities 63,767 135,728 165,466 Purchases of short-term investments (30,000) - - Purchases of long-term investments - - (499) Net purchases of property & equipment (9,441) (16,410) (26,145) Cash used in investing activities (39,441) (16,410) (26,644) Net share issuances <repurchases> (17,791) (64,163) 2,052 Net borrowing activities (4,688) 629,702 (132,416) Cash provided by (used in) financing activities (22,479) 565,539 (130,364) Effect of exchange rate changes 785 (836) 321 Net change in cash & cash equivalents 2,632$ 684,021$ 8,779$ Free cash flow: Cash provided by operating activities 63,767$ 135,728$ 165,466$ Net purchases of property & equipment (9,441) (16,410) (26,145) 54,326$ 119,318$ 139,321$ *Primarily changes in deferred income taxes and stock-based compensation expense. Three Month Periods