Attached files
| file | filename |
|---|---|
| EX-99.1 - EX-99.1 - REDWOOD TRUST INC | q22020earningsrelease.htm |
| 8-K - 8-K - REDWOOD TRUST INC | rwt-20200730.htm |
Exhibit 99.2

| T A B L E O F C O N T E N T S | ||
| Introduction | |||||
| Shareholder Letter | |||||
| Quarterly Results | |||||
Ñ Second Quarter Overview | |||||
Ñ Quarterly Earnings and Analysis | |||||
Ñ Book Value | |||||
Ñ Segment Results | |||||
Ñ Business Purpose Lending - Bridge Loan Overview | |||||
| Quarterly Positions | |||||
Ñ Capital Allocations | |||||
Ñ Financing Overview | |||||
Ñ Credit Overview | |||||
| Financial Tables | |||||
| Appendix | |||||
Ñ Segment Overview | |||||
Ñ Dividends and Taxable Income | |||||
Ñ Forward-Looking Statements | |||||
| Endnotes | |||||
| THE REDWOOD REVIEW I 2ND QUARTER 2020 | ||
1 | ||
| I N T R O D U C T I O N | ||
Note to Readers:
We file annual reports (on Form 10-K) and quarterly reports (on Form 10-Q) with the Securities and Exchange Commission. These filings and our earnings press releases provide information about Redwood and our financial results in accordance with generally accepted accounting principles (GAAP). These documents, as well as information about our business and a glossary of terms we use in this and other publications, are available through our website, www.redwoodtrust.com. We encourage you to review these documents.
Within this document, in addition to our GAAP results, we also present certain non-GAAP measures. When we present a non-GAAP measure, we accompany it with a description of that measure and a reconciliation to the comparable GAAP measure.
References herein to “Redwood,” the “company,” “we,” “us,” and “our” include Redwood Trust, Inc. and its consolidated subsidiaries. Note that because we generally round numbers in the tables to millions, except per share amounts, some numbers may not foot due to rounding. References to the “second quarter” refer to the quarter ended June 30, 2020, and references to the “first quarter” refer to the quarter ended March 31, 2020, unless otherwise specified.
Forward-looking statements:
This Redwood Review contains forward-looking statements within the meaning of the safe harbor provisions of the Private Securities Litigation Reform Act of 1995. Forward-looking statements involve numerous risks and uncertainties. Our actual results may differ from our expectations, estimates, and projections and, consequently, you should not rely on these forward-looking statements as predictions of future events. Forward-looking statements are not historical in nature and can be identified by words such as “anticipate,” “estimate,” “will,” “should,” “expect,” “believe,” “intend,” “seek,” “plan,” and similar expressions or their negative forms, or by references to strategy, plans, goals, or intentions. These forward-looking statements are subject to risks and uncertainties, including, among other things, those described in our Annual Report on Form 10-K under the caption “Risk Factors”, in our first quarter 2020 Form 10-Q under the caption "Risk Factors", and in our Current Report on Form 8-K filed on April 2, 2020. Many of these risks and uncertainties have been, and will be, exacerbated by the COVID-19 pandemic and any worsening of the global business and economic environment as a result. Other risks, uncertainties, and factors that could cause actual results to differ materially from those projected are described below and may be described from time to time in reports we file with the Securities and Exchange Commission, including reports on Forms 10-K, 10-Q, and 8-K. We undertake no obligation to update or revise forward-looking statements, whether as a result of new information, future events, or otherwise.
| Detailed endnotes are included at the end of this Redwood Review. | ||
| THE REDWOOD REVIEW I 2ND QUARTER 2020 | ||
2 | ||
| I N T R O D U C T I O N | ||
Statements regarding the following subjects, among others, are forward-looking by their nature: statements we make regarding Redwood’s business strategy and strategic focus, statements related to our financial outlook and expectations for 2020 and future years, statements regarding our available capital and sourcing additional capital both internally and from the capital markets, and other statements regarding pending business activities and expectations and estimates relating to our business and financial results. Additional detail regarding the forward-looking statements in this Redwood Review and the important factors that may affect our actual results in 2020 are described in the Appendix of this Redwood Review under the heading “Forward-Looking Statements.”
Pro forma financial information:
This Redwood Review also contains selected pro forma financial information, giving effect to a new financing arrangement entered into during July 2020, as if the transactions had occurred on June 30, 2020. The pro forma financial data as of June 30, 2020 reflect our estimates with respect to such information, based on information currently available to management and a number of assumptions, and may vary from our actual results. The pro forma financial information is not necessarily indicative of the expected financial position or results of Redwood’s operations for the second quarter of 2020, the third quarter of 2020, or any future period. Differences could result from numerous factors, including exposure to new or increased risks as a result of the impact of the COVID-19 pandemic, changes in market conditions or benchmark interest rates, changes in Redwood’s capital structure, changes in Redwood’s portfolio of investments, changes in Redwood’s operating expenses, and for other reasons, including those discussed in our Annual Report on Form 10-K for the year ended December 31, 2019, our Form 10-Q for the quarter ended March 31, 2020, the Current Report on Form 8-K filed on April 2, 2020, and any subsequent Quarterly Reports on Form 10-Q under the caption “Risk Factors.”
| Detailed endnotes are included at the end of this Redwood Review. | ||
| THE REDWOOD REVIEW I 2ND QUARTER 2020 | ||
3 | ||
| S H A R E H O L D E R L E T T E R | ||
Dear Fellow Shareholders:
The COVID-19 pandemic raged on in the second quarter, and our country is now experiencing a second round of lockdowns after a spike in coronavirus cases during July. While Redwood’s story through this crisis continues to be written, we’re extremely pleased with the progress we’ve made in response to the collapse of liquidity that the non-government mortgage sector experienced in March. We are now in a unique position to not only weather the storm, but also take advantage of a significant recovery in our business lines – which is now underway. There is still much to do, but we expect to look back on the second quarter of 2020 as one of meaningful strengthening for the Company.
Before we proceed with a discussion of our businesses, let’s review our financial results and condition. Our second quarter 2020 GAAP earnings were $1.00 per share, as compared to an $(8.28) loss per share in the first quarter. Our GAAP book value increased to $8.15 per share at June 30, 2020, from $6.32 per share at March 31, 2020. This represents a retrace of nearly one-third of the first quarter book value decline linked to unrealized losses in our investment portfolio. While not uniform in magnitude, asset valuations were materially higher and still possess significant upside to the extent the economy continues to recover.
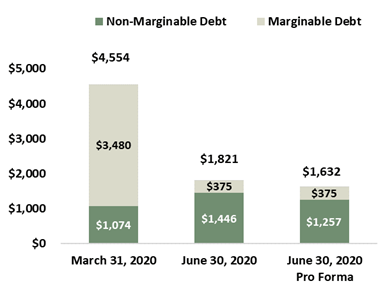
During the second quarter, we successfully recast most of our secured recourse debt. In aggregate, recourse debt declined from $4.6 billion at March 31, 2020, to $1.8 billion at June 30, 2020, reducing our recourse leverage ratio from 6.9x to 2.1x. On a pro forma basis(1) for a new non-recourse facility we entered into during July, our recourse debt had further decreased to $1.6 billion, and our recourse leverage ratio was 1.9x. Marginable debt, or that portion of recourse debt subject to daily, market-value based margin calls, represents only about 23% of our recourse debt, or $375 million at June 30th on a pro forma basis(1). When comparing our $529 million of unrestricted cash to our marginable debt at the end of the second quarter, our coverage was approximately 1.4x, leaving us with ample room above a prudent risk capital level to allocate significant capital to our operating businesses and new investments.
Importantly, the evolution of our capital structure has been managed organically, without the proverbial need for a crisis-driven, dilutive equity capital raise. Not only did we not require outside capital in the second quarter, we repurchased $125 million of our convertible debt at discounted levels, generating $25 million of realized gains. These repurchases also provide the lasting benefit of reduced debt service costs and leverage as we manage through the crisis. We will continue to opportunistically repurchase our long-term debt or common equity to the extent we believe valuations remain significantly detached from fundamentals.
With our capital structure enhancements largely complete, we paid a second quarter dividend of $0.125 per share on June 29, 2020. The second quarter dividend aligned with the current size of our balance sheet and reflected a sustainable level that we would hope to build upon as the economy and our business cash flows stabilize. We remain committed to delivering an attractive dividend to shareholders while remaining well positioned to opportunistically deploy capital going forward.
| Detailed endnotes are included at the end of this Redwood Review. | ||
| THE REDWOOD REVIEW I 2ND QUARTER 2020 | ||
4 | ||
| S H A R E H O L D E R L E T T E R | ||
When taking stock of the extreme market shocks brought about by COVID-19 and our go forward earnings, we believe it’s still premature to look too far ahead, as the true impact to the U.S. economy and the mortgage industry is yet to be seen. From a macro perspective, the recovery in financial markets remains meaningfully detached from the continued, and in many areas accelerating, health pandemic. Record job losses and the associated economic contraction have significantly outpaced the Great Financial Crisis in both speed and severity. The spectacular resiliency of the financial markets, as best we can tell, is still buoyed by extreme monetary and fiscal stimulus, with the prospect that risk assets can be supported – either directly or implicitly – by the Federal Reserve until a COVID-19 vaccine or effective treatments can be found.
Discomforted by the prospect of trying to predict and time the outcome of the pandemic – and with an election looming in November – we’ve put ourselves in a position to be patient and focused on the long-term through what may be a volatile next several months. The virtue of patience has had meaningful ancillary benefits, as we’ve been able to focus on the strategic evolution of our business model, and how our platforms will function in a post-pandemic world. We look forward to sharing some of our thinking on our second quarter earnings call.
For now, our residential and business purpose lending segments continue to operate in a significantly altered landscape. Myriad aspects of the mortgage process that historically took place in person, such as appraisals and closings, are now done remotely. Residential credit performance has fundamentally deteriorated from the record low delinquencies the industry enjoyed before the crisis, though continues to run better than most expected. As of June 30th, we received approximately 96% of payments due in June for residential loans underlying our Sequoia securitizations and we received approximately 96% of payments due for the single-family rental loans underlying our CoreVest securitizations. Forbearance rates for our Sequoia portfolio had stabilized in the 6.5% - 7.0% range of outstanding balances as of July 24, 2020. Importantly, we are now observing how the first group of borrowers exiting forbearance periods will perform, and the early signs are encouraging. Along these lines, it’s important to emphasize that Redwood’s servicer advancing obligations to date have been immaterial to our operations, largely thanks to the fact that a healthy percentage of underlying borrowers who have been granted forbearance periods have nonetheless continued to make their monthly mortgage payments. Over the longer-term, for borrowers who reach deeper stages of delinquency, “stop-advance” features built into many of our Sequoia securitization transactions will also mitigate our advancing obligations.
The rise in past-due mortgages, thus far, does not appear to be weakening the single-family housing sector. Thanks to record low mortgage rates, in some cases below 3% for agency mortgages and trending lower, refinance activity has remained elevated and home purchases have seen a resurgence in demand. By way of shelter-in-place orders and broader (perhaps secular) trends in working remotely, the concept of “home” has taken on greater significance for most Americans. Many children are now learning “virtually” right down the hall from their working parents. Particularly strong demand for suburban housing has been observed in many
| Detailed endnotes are included at the end of this Redwood Review. | ||
| THE REDWOOD REVIEW I 2ND QUARTER 2020 | ||
5 | ||
| S H A R E H O L D E R L E T T E R | ||
states where families look to exit dense metropolitan areas, seeking some outdoor space to call their own and that critical extra room. This is a remarkable shift in consumer preference from even a few short months ago, and one that, on balance, is positive for both our residential consumer and rental products, which are predominantly focused on single-family dwellings.
Our Residential Lending team entered the second half of the year primed for a relaunch with an idle period in the jumbo mortgage space slowly coming to an end. Since March, most lenders had significantly tightened their underwriting guidelines for newly originated loans due to the prospect of a severe recession and lack of Fed support to the non-agency sector. Additionally, constraints on the bandwidth of loan officers, who have remained largely focused on high margin refinance loans to agency-eligible borrowers, has weighed on jumbo origination activity. Based on our recent engagement with loan sellers and the gradual narrowing of the spread between agency and jumbo mortgage rates, we’ve begun to see a pickup in lock activity and expect this to grow meaningfully as we head into the fall. Even with this narrowing, we continue to see substantial relative value in non-agency whole loans, a sentiment shared by our loan-buying partners, both current and prospective. Our near-term focus continues to be on recasting our products and guidelines with loan sellers to reflect the economic environment in preparation for increased activity. Though our team’s efforts may not yet be reflected in our results, tremendous progress has been made and we’re excited about the resurgence underway.
To reach this point, we completed the difficult work of managing through our “pre-COVID” loan inventory, culminating with the sale of substantially all of those loans and the clearing out of our associated secured debt facilities. As part of this process, our residential team completed our Sequoia “MC1” securitization in late June, a transaction that brought the sale of these loans to a close. The deal priced better than we expected and allowed us to safely begin locking new loans in July.
As we move forward, our Residential team is focused on a few key strategic priorities. First, is to reaffirm our commitment to technology by upgrading our loan systems and transition toward the more automated underwriting and approval processes our sellers experience for conventional loans. Second, is to broaden our methods of loan distribution to complement traditional whole-loan sales and securitization – a key initiative as we closely manage our loan inventory levels going forward. Third, is to enhance our value-add to our loan sellers by continuing to refine how - and how quickly - we can purchase loans in a safe and sound manner. Thanks to our deep and valuable banking relationships, we have substantial warehouse capacity to fund new loans and now have access to non-marginable facilities that will help us manage our inventory going forward.
| Detailed endnotes are included at the end of this Redwood Review. | ||
| THE REDWOOD REVIEW I 2ND QUARTER 2020 | ||
6 | ||
| S H A R E H O L D E R L E T T E R | ||
Transitioning to our Business Purpose Lending segment, the recovery was very much underway at the end of the second quarter, and we have much to be excited about going forward. Our BPL team originated $234 million of loans in the second quarter, the majority in late May and June when we re-entered the market in earnest after securitizing a significant portion of the pre-COVID single-family rental loans on our balance sheet. Our origination footprint has remained largely consistent for SFR loans, and our bridge origination strategy has sharpened its focus on sponsors whose strategy is to ultimately hold and stabilize all or most of their portfolios. In addition to their institutional caliber, these sponsors often become accretive repeat customers for both SFR loans and fresh bridge financing to support new investments. Across our BPL products, we are commanding improved lending terms in both structure and coupon. As funding markets improve, we expect more competition to re-enter the space; however, we believe our operational advantage remains durable.
Our BPL business continued to make great progress in diversifying its outlets to distribute risk in the second quarter and through July. We completed two non-recourse financing arrangements for over 85% of our pre-COVID bridge portfolio, essentially match-funding a book that has thus far displayed solid performance through the pandemic (as noted above, these arrangements did not come with equity-linked options for the lenders). Investment demand remains very robust for our SFR and bridge loans, including significant inquiry for both loan purchases and opportunities to co-invest or provide private financing. We expect these options to become a reliable complement to traditional securitization. The attractive risk-adjusted returns in the space have kept BPL assets in strong demand and we continue to receive strong indications from investors in our SFR securitizations.
As we take stock of the year so far and look towards the fall, we are reminded that we are living in truly historic times. We face a pandemic that has created global economic disruption, trade and technology wars are looming, the fight against racism and social injustice is hitting an inflection point at a global scale, and the U.S. presidential election is a mere three months away. This presents an opportunity for all of us to examine our values, reset priorities and pause while we rethink how we want our world to function. As the times evolve, our corporate mission remains the same - to help make quality housing accessible to all Americans, whether rented or owned.
Thank you for your continued support.
 |  | |||||||
| Christopher J. Abate | Dashiell I. Robinson | |||||||
| Chief Executive Officer | President | |||||||
| Detailed endnotes are included at the end of this Redwood Review. | ||
| THE REDWOOD REVIEW I 2ND QUARTER 2020 | ||
7 | ||
| Q U A R T E R L Y R E S U L T S | ||
Second Quarter Overview
Key Financial Results and Metrics | ||||||||||||||
| Three Months Ended | ||||||||||||||
| 6/30/2020 | 3/31/2020 | |||||||||||||
| Earnings (Loss) per Share | $ | 1.00 | $ | (8.28) | ||||||||||
| Book Value per Share | $ | 8.15 | $ | 6.32 | ||||||||||
| Dividend per Share | $ | 0.125 | $ | 0.32 | ||||||||||
Economic Return on Book Value (1) | 31 | % | (58) | % | ||||||||||
| Unrestricted Cash (in millions) | $ | 529 | $ | 375 | ||||||||||
Recourse Leverage Ratio (2) | 2.1x | 6.9x | ||||||||||||
Ñ Our second quarter 2020 results benefited from a rebound in asset prices, as the COVID-19 induced spread widening we experienced in the first quarter partially reversed, benefiting our investment portfolio. As a result of the substantial work we completed repositioning our secured debt, we were able to maintain strategic assets in our portfolio and recover nearly one-third of the unrealized losses of $(5.36) per share recorded in the first quarter.
Ñ During the second quarter, we made significant progress repositioning our secured recourse debt structure, including reducing our recourse debt from $4.6 billion at March 31, 2020 to $1.8 billion at June 30, 2020, and reducing our marginable debt from $3.5 billion at March 31, 2020 to $375 million at June 30, 2020. As further described in the Financing Overview section that follows, in July we entered into an additional non-recourse financing arrangement that further reduced our recourse debt.
Ñ In connection with these activities our unrestricted cash position increased to $529 million at the end of the second quarter, including after repurchasing $125 million of our convertible debt at a discount, and without issuing any equity or equity-linked securities. At the end of the second quarter, our ratio of cash to marginable recourse debt(3) stood at 1.4x.
Ñ We reset operations in our mortgage banking businesses during the second quarter, increasing the pace of residential loan locks and business purpose loan originations in the second half of the quarter. We originated $234 million of business purpose loans in the second quarter, including $176 million of SFR loans and $58 million of bridge loans. Mortgage banking operating results for the second quarter, however, continued to be negatively impacted by the effects of COVID-19, as we completed the sales of most of our pre-COVID loan inventory and volumes were reduced compared to prior quarters.
| Detailed endnotes are included at the end of this Redwood Review. | ||
| THE REDWOOD REVIEW I 2ND QUARTER 2020 | ||
8 | ||
| Q U A R T E R L Y R E S U L T S | ||
Quarterly Earnings and Analysis
Below we present GAAP net income (loss) for the second and first quarters of 2020.
GAAP Net Income (Loss) | ||||||||||||||
($ in millions, except per share data) | ||||||||||||||
| Three Months Ended | ||||||||||||||
| 6/30/2020 | 3/31/2020 | |||||||||||||
| Net interest income | ||||||||||||||
| From investments | $ | 25 | $ | 43 | ||||||||||
| From mortgage banking activities | 2 | 8 | ||||||||||||
| Total net interest income | 27 | 51 | ||||||||||||
| Non-interest income (loss) | ||||||||||||||
| Residential mortgage banking activities, net | (8) | (23) | ||||||||||||
| Business purpose mortgage banking activities, net | 2 | (5) | ||||||||||||
| Investment fair value changes, net | 152 | (871) | ||||||||||||
| Other income, net | 1 | 2 | ||||||||||||
| Realized gains, net | 26 | 4 | ||||||||||||
| Total non-interest income (loss), net | 173 | (893) | ||||||||||||
| General and administrative expenses | (30) | (33) | ||||||||||||
| Other expenses | (5) | (91) | ||||||||||||
| (Provision for) benefit from income taxes | — | 22 | ||||||||||||
| Net income (loss) | $ | 165 | $ | (943) | ||||||||||
| Earnings (loss) per diluted common share | $ | 1.00 | $ | (8.28) | ||||||||||
GAAP Net Income (Loss) by Segment | ||||||||||||||
($ in millions) | ||||||||||||||
| Three Months Ended | ||||||||||||||
| 6/30/2020 | 3/31/2020 | |||||||||||||
| Residential Lending | $ | 33 | $ | (199) | ||||||||||
| Business Purpose Lending | 46 | (228) | ||||||||||||
| Third-Party Investments | 77 | (504) | ||||||||||||
| Corporate | 9 | (11) | ||||||||||||
| Net income (loss) | $ | 165 | $ | (943) | ||||||||||
| Detailed endnotes are included at the end of this Redwood Review. | ||
| THE REDWOOD REVIEW I 2ND QUARTER 2020 | ||
9 | ||
| Q U A R T E R L Y R E S U L T S | ||
Analysis of Earnings
Ñ Net interest income decreased in the second quarter, compared with the first quarter of 2020, primarily due to a decline in the average balance of our investments resulting from significant asset dispositions in March and through the second quarter. Additionally, we entered into several new financing arrangements during the second quarter, which carried higher borrowing costs associated with non-marginable and non-recourse features. See the Financing Overview section that follows for additional information on these borrowings.
Ñ Residential mortgage banking activities improved from the first quarter of 2020, but remained negative as we incurred incremental costs associated with the sale of our remaining loan inventory from the end of the first quarter and overall secondary market activity in jumbo loans slowed.
Ñ Business purpose mortgage banking activities improved from the first quarter of 2020, as origination volumes began to pick-up in late May and securitization pricing in the market improved into quarter-end.
Ñ Investment fair value changes increased significantly in the second quarter, as the fair value of our investment assets recovered nearly one-third of the unrealized losses recognized in the first quarter of 2020. See the "Securities Investments" table on the following page for detail on the change in values of our investments by asset type.
Ñ Realized gains, net in the second quarter included $25 million of gains on the repurchase of $125 million of convertible debt, which was repurchased below its carrying value, as well as gains of $1 million from sales of available-for-sale securities. Of note, the gains from extinguishment of debt are excluded from our diluted earnings per share, in accordance with GAAP.
Ñ General and administrative expenses decreased in the second quarter, primarily due to a reduction in our workforce that we implemented in late April, reducing headcount by approximately 35% and fixed compensation costs by approximately 25%.
Ñ Other expenses in the second quarter were primarily comprised of acquisition-related intangible amortization expense.
Ñ Income tax provision was minimal during the second quarter, as GAAP earnings at our taxable REIT subsidiaries were near break-even for the quarter, with net gains from investments offsetting losses from our mortgage banking operations.
| Detailed endnotes are included at the end of this Redwood Review. | ||
| THE REDWOOD REVIEW I 2ND QUARTER 2020 | ||
10 | ||
| Q U A R T E R L Y R E S U L T S | ||
Analysis of Changes in Investment Fair Values During the First Half of 2020
During the first quarter of 2020, we recorded unrealized fair value changes of $(615) million associated with assets we continued to hold for investment at March 31, 2020, including $(511) million of unrealized losses associated with our securities investments and $(104) million associated with business purpose loans and other investments. These fair value changes were recorded both through our income statement, within investment fair value changes, and on our balance sheet, within accumulated other comprehensive income.
The table below presents our securities investments at June 30, 2020, along with their unrealized losses recorded in the first quarter of 2020 and the value they recovered in the second quarter of 2020.
Securities Investments at June 30, 2020 | ||||||||||||||||||||||||||||||||||||||
($ in millions) | ||||||||||||||||||||||||||||||||||||||
| Interest-Only Securities | Subordinate Securities | Total Securities | Q1 2020 Unrealized Loss (1) | Q2 2020 Change in Value (2) | % Recovered | |||||||||||||||||||||||||||||||||
| Sequoia securities | $ | 28 | $ | 317 | $ | 345 | $ | (162) | $ | 80 | 49 | % | ||||||||||||||||||||||||||
| SFR securities | 51 | 152 | 203 | (68) | 15 | 22 | % | |||||||||||||||||||||||||||||||
| Third-party securities | ||||||||||||||||||||||||||||||||||||||
| Re-performing loan securities | 40 | 354 | 394 | (175) | 32 | 18 | % | |||||||||||||||||||||||||||||||
| Multifamily securities | 4 | 48 | 52 | (19) | 3 | 17 | % | |||||||||||||||||||||||||||||||
| Agency CRT securities | — | 50 | 50 | (58) | 39 | 67 | % | |||||||||||||||||||||||||||||||
| Other third-party securities | — | 36 | 36 | (29) | 13 | 43 | % | |||||||||||||||||||||||||||||||
| Total | $ | 123 | $ | 957 | $ | 1,080 | $ | (511) | $ | 182 | 35 | % | ||||||||||||||||||||||||||
Ñ The weighted average carrying price of our subordinate securities as compared to face value increased to approximately 60% at June 30, 2020, as compared to approximately 50% at March 31, 2020.
Ñ During the second quarter, we sold $82 million of securities for aggregate gains of $18 million, relative to their March 31, 2020 prices, but at a cumulative net loss of $18 million relative to their December 31, 2019 prices.
Aside from our securities investments, our remaining investments recovered $22 million of fair value in the second quarter of 2020.
We estimate that as of June 30, 2020, approximately $3.00 per share of the unrealized losses recognized in the first quarter of 2020 were associated with assets we continued to hold for investment at March 31, 2020, remained outstanding.
| Detailed endnotes are included at the end of this Redwood Review. | ||
| THE REDWOOD REVIEW I 2ND QUARTER 2020 | ||
11 | ||
| Q U A R T E R L Y R E S U L T S | ||
Book Value
Changes in Book Value per Share | ||||||||||||||
($ in per share) | ||||||||||||||
| Three Months Ended | ||||||||||||||
| 6/30/2020 | 3/31/2020 | |||||||||||||
| Beginning GAAP book value per share | $ | 6.32 | $ | 15.98 | ||||||||||
| Comprehensive Income (Loss) | ||||||||||||||
Fair value changes on investments held on or after March 31, 2020 (1) | 1.78 | (5.36) | ||||||||||||
Other Q1 2020 fair value changes on investments (2) | — | (3.08) | ||||||||||||
| Impairment of goodwill | — | (0.78) | ||||||||||||
| Change in value of long-term debt hedge | — | (0.29) | ||||||||||||
| Impact of convertible debt extinguishments | 0.22 | — | ||||||||||||
| Other comprehensive (loss) income, net | (0.06) | 0.16 | ||||||||||||
| Total comprehensive income (loss) per share | 1.94 | (9.35) | ||||||||||||
| Dividends | (0.13) | (0.32) | ||||||||||||
| Other, net | 0.02 | 0.01 | ||||||||||||
| Ending GAAP book value per share | $ | 8.15 | $ | 6.32 | ||||||||||
Ñ Our GAAP book value increased $1.83 per share during the second quarter of 2020, resulting primarily from positive investment fair value changes as well as from gains on extinguishment of our convertible debt.
Ñ Comprehensive income (loss) per share presented in the table above includes GAAP net income as well as other comprehensive income (recorded through accumulated other comprehensive income on our balance sheet), which is primarily comprised of fair value changes on our available-for-sale securities.
Ñ Our non-GAAP tangible book value(3) increased to $7.59 per share at the end of the second quarter, from $5.72 per share at the end of the first quarter of 2020.
Ñ During the second quarter, we recognized positive fair value changes of $1.78 per share on our investment assets, primarily driven by spread-tightening across our portfolios.
Ñ During the second quarter of 2020, we repurchased $125 million of convertible and exchangeable debt, cumulatively across all three of our outstanding issuances at prices below our carrying value, resulting in net gains of $25 million and a $0.22 per share benefit to book value.
| Detailed endnotes are included at the end of this Redwood Review. | ||
| THE REDWOOD REVIEW I 2ND QUARTER 2020 | ||
12 | ||
| Q U A R T E R L Y R E S U L T S | ||
Segment Results
This section provides additional information on quarterly results and activity for each of our business segments. In the second quarter of 2020, we combined our Third-Party Residential Investments and Multifamily Investments segments into a new segment called Third-Party Investments. A full description of our segments is included in the Appendix of this Redwood Review, and a detailed segment income statement is presented in Table 2 within the Financial Tables section of this Redwood Review.
Residential Lending
Ñ Our Residential Lending segment generated $33 million of net income during the second quarter of 2020, driven primarily by positive investment fair value changes in subordinate Sequoia securities.
Ñ During the second quarter of 2020, we completed the sale of nearly all our residential loans previously held for investment and financed at our Federal Home Loan Bank of Chicago facility (our "FHLBC Facility"), and repaid all but $1 million of borrowings under this facility. Additionally, during the second quarter, we completed the sale of nearly all of our loan inventory held at the end of the first quarter. These sales benefited our cash position, recourse leverage and marginable debt ratios, but reduced net interest income in the second quarter.
Ñ Additionally, during the second quarter, we sold $29 million of securities from our Residential Lending investment portfolio and retained $20 million of investment securities from a $271 million Sequoia securitization we completed during the quarter.
Ñ We purchased $56 million of loans during the quarter after regular resumption of locking loans. At June 30, 2020, we had $20 million of jumbo loans on our balance sheet and had identified $57 million of loans for purchase, nearly all of which are scheduled to be delivered into forward sale agreements.
Ñ During the second quarter, we completed a non-marginable warehouse facility that we are utilizing to finance existing loan inventory. We expect to modify or replace our remaining marginable facilities with non-marginable facilities to finance the bulk of our residential mortgage banking operations going forward.
| Detailed endnotes are included at the end of this Redwood Review. | ||
| THE REDWOOD REVIEW I 2ND QUARTER 2020 | ||
13 | ||
| Q U A R T E R L Y R E S U L T S | ||
Business Purpose Lending
Ñ Our Business Purpose Lending segment contributed $46 million of net income during the second quarter of 2020, driven primarily by positive investment fair value changes and net interest income from investments.
Ñ Since May, we have entered into two non-marginable, non-recourse facilities, each with two-year terms, that together will effectively provide match-funded financing for over 85% of the bridge loans we held at June 30, 2020. Additionally, we completed a separate non-marginable, full-recourse facility in the second quarter that will provide financing on our new bridge and single-family rental loan production going forward.
Ñ During the second quarter, we transferred all of our single-family rental loans previously financed at the FHLBC and held for investment to newly established non-marginable warehouse facilities, repaid our associated FHLBC debt, and now classify these loans as held-for-sale as part of our business purpose mortgage banking loan inventory.
Ñ Within our business purpose mortgage banking operations, in the second quarter we originated $176 million of single-family rental loans and $58 million of bridge loans. Additionally, we completed a $221 million single-family rental loan securitization, consisting of loans we held at the end of the first quarter, from which we retained $20 million of securities.
Third-Party Investments
Ñ Our Third-Party Investments segment contributed $77 million of net income during the second quarter of 2020, driven primarily by positive investment fair value changes and net interest income.
Ñ During the second quarter, we sold $53 million of third-party investments, including $35 million of residential subordinate securities and $19 million of CRT securities, and deployed $10 million into CRT securities.
Ñ During the second quarter, we reduced our marginable securities repo debt used to finance our third-party investments from $408 million to $269 million, while the fair value of our investments increased by over $30 million. Going forward, we expect to further reduce our use of marginable debt to finance this portfolio.
| Detailed endnotes are included at the end of this Redwood Review. | ||
| THE REDWOOD REVIEW I 2ND QUARTER 2020 | ||
14 | ||
| Q U A R T E R L Y R E S U L T S | ||
Business Purpose Lending - Bridge Loan Overview
Overview
Our Business Purpose Lending segment originates two primary types of loans: longer-duration single-family rental (SFR) loans (typically 5-10 year terms); and bridge loans (typically 12-18 month terms). We generally hold our SFR loans on our balance sheet in inventory with the intent to securitize through our CoreVest "CAFL" securitization platform. Our bridge loans are generally held for investment through the term of the loans.
Bridge lending is a key strategic focus that drives long-term value for our Business Purpose Lending segment, including through attractive risk-adjusted returns for our portfolio and sponsor conversion rates into adjacent products. The term “bridge lending” in the context of residential real estate applies to a wide range of borrower strategies, most notably traditional “fix-and-flip” lending to sponsors seeking to exit their investment after some amount of property improvement. Our current BPL bridge portfolio and lending strategy differ in several important ways.
While a portion of our in-place portfolio is traditional fix-and-flip, most of our short-term lending is strategically tailored towards experienced sponsors with a longer-term approach to real-estate investing, in most cases linked to stabilization (rather than immediate sale) of the underlying homes. These sponsors tend to make strong long-term clients that over time will utilize several lending products (including, for instance, Lines of Credit (LOCs) and SFR loans, as described below) that generate longer-duration credit investments for our portfolio. These products also have several credit-positive structural features, including cross-collateralization across a portfolio of underlying properties. Nearly 70% of our current bridge loan investments are comprised of these types of strategic products.
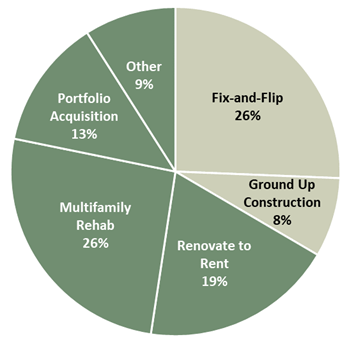 | ||||||||
| Bridge Portfolio by Borrower Strategy | ||||||||
| Borrower Strategy | UPB % | |||||||
| Strategic Lending | ||||||||
| Renovate to Rent | 19% | |||||||
| Multifamily Light Lift | 17% | |||||||
| Portfolio Acquisition | 13% | |||||||
| Multifamily Heavy Lift | 9% | |||||||
| Build to Rent | 6% | |||||||
| Model Home Lease | 3% | |||||||
| Total Strategic | 67% | |||||||
| Opportunistic Lending | ||||||||
| Fix-and-Flip | 26% | |||||||
| Ground Up Construction | 8% | |||||||
| Total Opportunistic | 33% | |||||||
| Detailed endnotes are included at the end of this Redwood Review. | ||
| THE REDWOOD REVIEW I 2ND QUARTER 2020 | ||
15 | ||
| Q U A R T E R L Y R E S U L T S | ||
Portfolio Strategy & Customer Retention
Our multi-product approach facilitates high levels of repeat business with our top customers. Since platform inception in 2012, almost 30% of CoreVest’s SFR origination volume has been generated by refinancing a CoreVest bridge loan, and over 70% of total funded dollar volume overall is from repeat sponsors. Year-to-date 2020, as we continue to focus on customer retention and a more tailored lending approach, bridge-to-SFR loan conversion is nearly 40%.
Our current bridge lending focus – with an emphasis on portfolio acquisition and stabilization strategies – correlates with recent trends in rental demand, particularly for single-family detached homes. Specifically, we intend to focus increasingly on LOC and build-to-rent opportunities, both of which offer the added structural benefit of cross-collateralization to our loan. Smaller-balance multifamily will also remain a focus, however on a more selective basis.
Portfolio Performance
Focusing on experienced sponsors and strategic products has resulted in strong bridge loan performance to date, including the past several months through the onset of the COVID-19 pandemic. As of June 30, 2020, 90+ delinquencies in the bridge book totaled 4.6% across all strategies.
Borrower Strategies
Below is a brief description of the borrower strategies presented in the table above.
Renovate to Rent – Sponsor acquires, renovates and rents out a portfolio of properties. Underlying homes generally require lighter levels of rehabilitation than typical fix-and-flip. As assets stabilize over time, cash-flow coverage builds during the hold period. Exit can be either traditional CoreVest SFR loan or portfolio sale to third-party investor.
Portfolio Acquisition – Sponsor pursuing primary strategies of (i) purchase of underperforming rental portfolio to upgrade homes and drive higher rents, and (ii) refinance of upgraded assets onto line-of-credit for ultimate refinance or sale. Projects typically entail lighter renovation with more experienced, vertically-integrated sponsors.
Build to Rent – Sponsor acquires and develops greenfield lots in a rental and/or for-sale neighborhood. New-build assets tend to be highest-quality for SFR programs. Financing typically occurs in phases to ensure proof of concept from construction through stabilization. Most projects provide tenants with additional indoor and private outdoor space, in keeping with increased demand leading up to and through COVID-19. Sponsor has ability to shift to for-sale product to be responsive to market demand.
| Detailed endnotes are included at the end of this Redwood Review. | ||
| THE REDWOOD REVIEW I 2ND QUARTER 2020 | ||
16 | ||
| Q U A R T E R L Y R E S U L T S | ||
Multifamily Light Lift – Sponsor purchases underperforming multifamily property with strategy to upgrade units, and sell or refinance. Project is pre-underwritten for GSE or CoreVest term loan refinance upon completion and stabilization, and typically has some in-place cash-flow during term of the bridge loan. Projects tend to carry reduced renovation risk. Borrowers are typically experienced, vertically-integrated sponsors.
Multifamily Heavy Lift – Sponsor purchases underperforming asset with strategy to meaningfully upgrade units and common areas. Project is usually pre-underwritten for GSE refinance upon completion and stabilization with phased construction for projects with extensive rehab requirements. Property cash-flow typically limited during initial phases of the project. Sponsors typically experienced and vertically integrated.
Model Home Lease – Lender purchases from and leases back model homes to experienced national and regional homebuilders on a triple net basis. Attractive cost basis for lender with reliable exit strategy over several years.
Fix-and-Flip – Typically single-family home purchase with light to medium rehab and exit strategy of sale to end user. Generally quick asset turns with properties located in an existing neighborhood with comparable sales. Standard rehabilitations limit change orders and budget variances, with property management and project completion generally straightforward in the event of default.
Ground-up Construction – Typically involves sponsor building condominium or multifamily projects for ultimate sale, with potential in certain cases to refinance into CoreVest SFR loan or GSE take-out. Program limited to high quality sponsors in high demand markets.
| Detailed endnotes are included at the end of this Redwood Review. | ||
| THE REDWOOD REVIEW I 2ND QUARTER 2020 | ||
17 | ||
| Q U A R T E R L Y P O S I T I O N S | ||
Capital Allocations
The following table presents our allocations of capital by segment as of March 31, 2020, June 30, 2020, and as of June 30, 2020 on a pro forma basis to give effect to a new financing arrangement that we entered into in July 2020.(1)
| Capital Allocation Detail | ||||||||||||||||||||||||||||||||||||||
| By Investment Type | ||||||||||||||||||||||||||||||||||||||
| ($ in millions) | ||||||||||||||||||||||||||||||||||||||
| March 31, 2020 | June 30, 2020 | June 30, 2020 Pro Forma (1) | ||||||||||||||||||||||||||||||||||||
Fair Value of Assets (2) | Total Recourse Debt | Fair Value of Assets (2) | Total Recourse Debt | Fair Value of Assets (2) | Total Recourse Debt | |||||||||||||||||||||||||||||||||
| Residential Lending | ||||||||||||||||||||||||||||||||||||||
| Residential loans | $ | 1,437 | $ | (1,190) | $ | — | $ | — | $ | — | $ | — | ||||||||||||||||||||||||||
| Sequoia securities | 275 | (259) | 345 | (224) | 345 | (224) | ||||||||||||||||||||||||||||||||
| MSRs/Other | 44 | (30) | 41 | (20) | 41 | (20) | ||||||||||||||||||||||||||||||||
| Mortgage banking residential loan inventory | 894 | (841) | 20 | (14) | 20 | (14) | ||||||||||||||||||||||||||||||||
| Total Residential Lending | 2,650 | (2,321) | 406 | (258) | 406 | (258) | ||||||||||||||||||||||||||||||||
| Business Purpose Lending | ||||||||||||||||||||||||||||||||||||||
| SFR securities | 167 | (103) | 203 | (103) | 203 | (103) | ||||||||||||||||||||||||||||||||
| Bridge loans | 817 | (626) | 372 | (256) | 118 | (67) | ||||||||||||||||||||||||||||||||
Net investment in bridge loans (3) | — | — | 87 | — | 151 | — | ||||||||||||||||||||||||||||||||
| Mortgage banking SFR loan inventory | 415 | (308) | 380 | (272) | 380 | (272) | ||||||||||||||||||||||||||||||||
| Platform premium | 69 | — | 65 | — | 65 | — | ||||||||||||||||||||||||||||||||
| Total Business Purpose Lending | 1,468 | (1,037) | 1,107 | (632) | 917 | (443) | ||||||||||||||||||||||||||||||||
| Third-Party Investments | ||||||||||||||||||||||||||||||||||||||
| RPL investments | 369 | (300) | 394 | (242) | 394 | (242) | ||||||||||||||||||||||||||||||||
| CRT & third-party securities | 73 | (32) | 86 | — | 86 | — | ||||||||||||||||||||||||||||||||
| Multifamily securities | 49 | (76) | 52 | (28) | 52 | (28) | ||||||||||||||||||||||||||||||||
| Other investments | 141 | — | 131 | — | 131 | — | ||||||||||||||||||||||||||||||||
| Total Third-Party Investments | 632 | (408) | 663 | (269) | 663 | (269) | ||||||||||||||||||||||||||||||||
Cash and cash equivalents (4) | 378 | — | 529 | — | 529 | — | ||||||||||||||||||||||||||||||||
| Other Assets and liabilities, net | 151 | — | 54 | — | 54 | — | ||||||||||||||||||||||||||||||||
| Corporate debt | — | (786) | — | (661) | — | (661) | ||||||||||||||||||||||||||||||||
| Total Corporate / Other | 529 | (786) | 583 | (661) | 583 | (661) | ||||||||||||||||||||||||||||||||
| Totals | $ | 5,279 | $ | (4,554) | $ | 2,759 | $ | (1,821) | $ | 2,569 | $ | (1,632) | ||||||||||||||||||||||||||
| GAAP Equity | $ | 725 | $ | 937 | $ | 937 | ||||||||||||||||||||||||||||||||
| Detailed endnotes are included at the end of this Redwood Review. | ||
| THE REDWOOD REVIEW I 2ND QUARTER 2020 | ||
18 | ||
| Q U A R T E R L Y P O S I T I O N S | ||
Financing Overview
We finance our business with a diversified mix of secured recourse and non-recourse debt, as well as unsecured corporate debt. In recent months, we have repositioned our secured recourse debt structure to minimize our exposure to marginable debt, and have also utilized new non-recourse structures to finance portions of our investment portfolio. The following is an analysis of our current financing structure and strategy.
Recourse Debt Analysis
The following summaries present the composition of our recourse debt and its characteristics as of March 31, 2020, and June 30, 2020 on an actual and pro forma basis(1) to give effect to a new financing arrangement that we entered into in July 2020.
Recourse Debt Balances at June 30, 2020 | |||||||||||||||||||||||||||||||||||||||||
($ in millions) | |||||||||||||||||||||||||||||||||||||||||
| Scheduled Maturity | Pro Forma | ||||||||||||||||||||||||||||||||||||||||
| Q3 2020 | Q4 2020 | 2021 | Beyond 2021 | Total | June 30, 2020 | ||||||||||||||||||||||||||||||||||||
Securities repurchase debt (2) | $ | 165 | $ | 58 | $ | 89 | $ | — | $ | 312 | $ | 312 | |||||||||||||||||||||||||||||
| Warehouse/secured revolving debt | — | — | 43 | 20 | 63 | 63 | |||||||||||||||||||||||||||||||||||
| Non-marginable warehouse debt | — | — | 14 | 485 | 499 | 309 | |||||||||||||||||||||||||||||||||||
| Non-marginable secured term debt | — | — | — | 285 | 285 | 285 | |||||||||||||||||||||||||||||||||||
| Non-marginable corporate unsecured debt | — | — | — | 661 | 661 | 661 | |||||||||||||||||||||||||||||||||||
| FHLB debt | — | — | — | 1 | 1 | 1 | |||||||||||||||||||||||||||||||||||
| Total debt | $ | 165 | $ | 58 | $ | 146 | $ | 1,452 | $ | 1,821 | $ | 1,632 | |||||||||||||||||||||||||||||
| Detailed endnotes are included at the end of this Redwood Review. | ||
| THE REDWOOD REVIEW I 2ND QUARTER 2020 | ||
19 | ||
| Q U A R T E R L Y P O S I T I O N S | ||
Ñ Our recourse leverage ratio was 2.1x at June 30, 2020 and 1.9x at June 30, 2020 on a pro forma basis(1). Our ratio of cash to marginable recourse debt(1) was 1.4x at June 30, 2020.
The following table presents our debt balances by asset type and debt type along with associated costs at June 30, 2020 on a pro forma basis(1), to give effect to a new financing arrangement we entered into in July 2020:
Recourse Debt Balances at June 30, 2020 Pro Forma (2) | ||||||||||||||||||||||||||||||||
($ in millions) | ||||||||||||||||||||||||||||||||
| Secured Debt | ||||||||||||||||||||||||||||||||
| Fair Value of Secured Assets | Non-Marginable Debt | Marginable Debt | Unsecured Debt | Total Debt | ||||||||||||||||||||||||||||
| Corporate debt | N/A | $ | 1 | $ | — | $ | 661 | $ | 662 | |||||||||||||||||||||||
Securities portfolio (3) | 1,036 | 285 | 332 | — | 617 | |||||||||||||||||||||||||||
| SFR loans | 380 | 231 | 42 | — | 272 | |||||||||||||||||||||||||||
| Bridge loans | 118 | 66 | 1 | — | 67 | |||||||||||||||||||||||||||
| Residential loans | 20 | 14 | — | — | 14 | |||||||||||||||||||||||||||
| Total | $ | 1,554 | $ | 597 | $ | 375 | $ | 661 | $ | 1,632 | ||||||||||||||||||||||
Ñ With the new non-marginable facilities we entered into since March 31, 2020, we have shifted our recourse funding structure almost entirely to non-marginable debt. Based on outstanding balances at June 30, 2020, our weighted average cost of debt(4) for our recourse borrowings was 4.7%. Going forward, we expect to fund the vast majority of our mortgage banking inventory in both our businesses with non-marginable debt, and expect to further reduce our use of marginable securities repo debt. Additionally, as described further below, we have entered into new non-recourse facilities to fund most of our existing bridge loan investments and expect to fund new bridge loans under non-marginable facilities.
Non-Recourse Debt Analysis
During the second quarter and in July of 2020, we entered into two new non-recourse, non-marginable facilities to finance our portfolio of existing business purpose bridge loans. These financings have two-year terms, and given the duration of the bridge loans, essentially provide match-funding for these assets. As this debt is non-recourse, we exclude the secured assets and the debt from our capital allocation table and present our net equity in these loans, which represents our net economic exposure. At June 30, 2020, on a pro forma basis for the facility that was closed in July, we had $695 million of bridge loans financed with $545 million of non-recourse debt, for a net economic exposure of $151 million to these assets.
| Detailed endnotes are included at the end of this Redwood Review. | ||
| THE REDWOOD REVIEW I 2ND QUARTER 2020 | ||
20 | ||
| Q U A R T E R L Y P O S I T I O N S | ||
Credit Overview
This section presents select credit characteristics for our major investment types, with current information as of June 30, 2020.
Residential Investments Credit Characteristics (1) | ||||||||||||||||||||
June 30, 2020 | ||||||||||||||||||||
($ in millions, except where noted) | ||||||||||||||||||||
| Sequoia Select Securities | Sequoia Choice Securities | Re-Performing Loan Securities | ||||||||||||||||||
| Market value | $ | 121 | $ | 196 | $ | 394 | ||||||||||||||
| Average FICO (at origination) | 770 | 743 | 609 | |||||||||||||||||
HPI updated LTV (2) | 43 | % | 66 | % | 68 | % | ||||||||||||||
| Average loan size (in thousands) | $ | 660 | $ | 711 | $ | 178 | ||||||||||||||
| Gross weighted average coupon | 4.0 | % | 4.9 | % | 4.5 | % | ||||||||||||||
| Current 3-month prepayment rate | 36 | % | 34 | % | 5 | % | ||||||||||||||
| 90+ days delinquency (as a % of UPB) | 0.3 | % | 0.8 | % | 9.9 | % | ||||||||||||||
| Investment thickness | 4 | % | 12 | % | 23 | % | ||||||||||||||
Sequoia Select Securities — As of June 30, 2020, we had securitized $21.4 billion of Sequoia Select loans since 2010. Our securitized Select portfolio includes fully documented loans to prime borrowers with an average FICO score (at loan origination) of 770, maximum loan-to-value (at origination) of 80%, and a maximum debt-to-income ratio (at origination) of 43%. We retain all first-loss securities from our Sequoia Select securitizations, and on average we have exposure up to 4% of credit losses resulting from loans underlying the securities (represented by the thickness of the securities we currently own as investments).
Sequoia Choice Securities — As of June 30, 2020, we had securitized $3.7 billion of Sequoia Choice loans, since 2017. Our securitized Choice portfolio includes fully documented loans to prime borrowers with an average FICO score (at loan origination) of 743, maximum loan-to-value (at origination) of 90%, and a maximum debt-to-income ratio (at origination) of 49.9%. We retain all of the first-loss securities issued as part of our Sequoia Choice program, and on average we have exposure up to the first 12% of credit losses resulting from loans underlying the securities, (represented by the thickness of the securities we currently own as investments).
Re-performing Loan Securities — As of June 30, 2020, we held $394 million of securities collateralized by re-performing loans, and on average we have exposure to up to 23% of the credit losses resulting from loans underlying the securities (represented by the thickness of the securities we currently own as investments). The collateral underlying these securities are seasoned re-performing, and to a lesser extent non-performing, loans. In most cases, these loans experienced a credit event leading up to the securitization and were modified in order to keep the borrower in their home and current in their payments under recast loan terms. Central to the investment thesis in these securities is the view that a significant percentage of the
| Detailed endnotes are included at the end of this Redwood Review. | ||
| THE REDWOOD REVIEW I 2ND QUARTER 2020 | ||
21 | ||
| Q U A R T E R L Y P O S I T I O N S | ||
underlying borrowers will improve upon their delinquency history and continue paying steadily under the modified or recast terms of the loan.
Business Purpose and Multifamily Investments Credit Characteristics | ||||||||||||||||||||
June 30, 2020 | ||||||||||||||||||||
($ in millions, except where noted) | ||||||||||||||||||||
| Multifamily B-Pieces | SFR Securities | BPL Bridge Loans | ||||||||||||||||||
| Market value | $ | 52 | $ | 203 | $ | 814 | ||||||||||||||
Average current DSCR (1) | 1.5x | 1.4x | N/A | |||||||||||||||||
LTV (at origination) (2) | 72 | % | 69 | % | 68 | % | ||||||||||||||
| Average loan size (in thousands) | $ | 21,044 | $ | 2,344 | $ | 368 | ||||||||||||||
| Gross weighted average coupon | 3.3 | % | 5.5 | % | 8.0 | % | ||||||||||||||
| 90+ days delinquency (as a % of UPB) | 0.0 | % | 1.8 | % | 4.6 | % | ||||||||||||||
| Investment thickness | 10 | % | 10 | % | N/A | |||||||||||||||
Multifamily B-Pieces — As of June 30, 2020, we had $52 million of multifamily b-pieces, which represent first-loss risk on $1.0 billion of underlying multifamily loan collateral across two separate Freddie Mac sponsored securitizations. On average, we have exposure to the first 10% of credit losses resulting from loans underlying the securities (represented by the thickness of the securities we currently own as investments).
SFR Securities — As of June 30, 2020, we had $203 million of SFR securities, comprised of subordinate and interest-only securities retained from the 12 CAFL securitizations completed by CoreVest through June 30, 2020. We own and retain the first-loss securities from the CAFL securitizations, and on average have exposure to the first 10% of credit losses (represented by the current thickness of the securities we currently own as investments).
BPL Bridge Loans — As of June 30, 2020, we had $814 million of bridge loans, including $372 million financed with recourse debt and a net investment of $87 million in $442 million of loans financed with $355 million of non-recourse debt. Our bridge loans and investments are collateralized by residential and multifamily properties, many of which are being rehabilitated for either re-sale or rental purposes. The average loan term at origination is approximately 12 months.
| Detailed endnotes are included at the end of this Redwood Review. | ||
| THE REDWOOD REVIEW I 2ND QUARTER 2020 | ||
22 | ||
| Q U A R T E R L Y P O S I T I O N S | ||
Current Update on Forbearances
In response to the personal financial impacts of the COVID-19 pandemic, many residential mortgage borrowers sought forbearance with respect to monthly mortgage payment obligations. Consistent with broader industry trends, within our own portfolio, after the initial set of forbearance requests during the months of March and April, late in the second quarter we observed a substantial decrease in inquiries about, and requests for, forbearance from borrowers.
Forbearances can impact our financial results in various ways, including through our exposure to credit in investment securities and loans, through our obligations to fund servicing advances, and through our obligations to repurchase loans we have sold.
Servicing Advance Obligations
Redwood's liquidity exposure to advancing obligations associated with residential mortgage servicing rights (MSRs) is primarily related to our Sequoia private-label residential mortgage backed securities (RMBS). Redwood owns the associated servicing for the vast majority of loans that we have securitized.
At June 30, 2020, mortgage loans in a delinquent status (whether or not subject to forbearance) accounted for approximately 4.0% of the aggregate principal (or notional) balance of Sequoia securitized loans for which we had servicing advance funding obligations, with respect to the monthly mortgage payment due at June 30, 2020 (compared to approximately 3.2% of principal balance that were in a delinquent status as of April 30, 2020). As of June 30, 2020, we had no servicing advances outstanding related to principal and interest on Sequoia securitized loans for which we had servicing advance funding obligations.
We estimate that for every 5 percentage point increase in the principal balance of Sequoia securitized mortgage loans in a delinquent status (whether or not subject to forbearance), our average monthly principal and interest servicing advance funding obligation would increase by approximately $3 million.
| Detailed endnotes are included at the end of this Redwood Review. | ||
| THE REDWOOD REVIEW I 2ND QUARTER 2020 | ||
23 | ||

| Detailed endnotes are included at the end of this Redwood Review. | ||
| THE REDWOOD REVIEW I 2ND QUARTER 2020 | ||
24 | ||
 | Table 1: GAAP Earnings (in thousands, except per share data) | |||||||||||||||||||||||||||||||||||||||||||
| 2020 Q2 | 2020 Q1 | 2019 Q4 | 2019 Q3 | 2019 Q2 | Six Months 2020 | |||||||||||||||||||||||||||||||||||||||
| Net interest income | ||||||||||||||||||||||||||||||||||||||||||||
| From investments | $ | 24,950 | $ | 43,115 | $ | 37,639 | $ | 27,679 | $ | 27,565 | $ | 68,065 | ||||||||||||||||||||||||||||||||
| From mortgage banking activities | 2,330 | 8,295 | 7,234 | 5,834 | 4,757 | 10,625 | ||||||||||||||||||||||||||||||||||||||
| Net interest income | 27,280 | 51,410 | 44,873 | 33,513 | 32,322 | 78,690 | ||||||||||||||||||||||||||||||||||||||
| Non-interest income (loss) | ||||||||||||||||||||||||||||||||||||||||||||
| Residential mortgage banking activities, net | (8,006) | (23,081) | 16,540 | 5,016 | 15,361 | (31,087) | ||||||||||||||||||||||||||||||||||||||
| Business purpose mortgage banking activities, net | 2,234 | (5,330) | 29,742 | 4,499 | 3,799 | (3,096) | ||||||||||||||||||||||||||||||||||||||
| Investment fair value changes, net | 152,228 | (870,832) | 759 | 11,444 | 3,138 | (718,604) | ||||||||||||||||||||||||||||||||||||||
| Realized gains, net | 25,965 | 3,852 | 5,594 | 4,714 | 2,827 | 29,817 | ||||||||||||||||||||||||||||||||||||||
| Other income | 955 | 2,437 | 5,417 | 4,356 | 4,859 | 3,392 | ||||||||||||||||||||||||||||||||||||||
| Total non-interest income (loss), net | 173,376 | (892,954) | 58,052 | 30,029 | 29,984 | (719,578) | ||||||||||||||||||||||||||||||||||||||
| Fixed compensation expense | (11,818) | (14,684) | (12,899) | (9,391) | (9,252) | (26,502) | ||||||||||||||||||||||||||||||||||||||
| Variable compensation expense (excluding commissions) | (3,278) | (11) | (10,372) | (3,489) | (3,573) | (3,289) | ||||||||||||||||||||||||||||||||||||||
| Equity compensation expense | (3,262) | (1,995) | (3,270) | (3,155) | (4,024) | (5,257) | ||||||||||||||||||||||||||||||||||||||
Acquisition-related equity compensation expense (1) | (1,212) | (1,212) | (1,010) | — | — | (2,424) | ||||||||||||||||||||||||||||||||||||||
| Loan acquisition costs (including commissions) | (2,152) | (4,726) | (4,830) | (1,993) | (1,964) | (6,878) | ||||||||||||||||||||||||||||||||||||||
| Other general and administrative expense | (8,370) | (10,040) | (10,062) | (8,787) | (7,442) | (18,410) | ||||||||||||||||||||||||||||||||||||||
| Total general and administrative expenses | (30,092) | (32,668) | (42,443) | (26,815) | (26,255) | (62,760) | ||||||||||||||||||||||||||||||||||||||
| Other expenses | (5,083) | (91,415) | (7,001) | (2,531) | (2,452) | (96,498) | ||||||||||||||||||||||||||||||||||||||
| (Provision for) benefit from income taxes | (37) | 22,229 | (4,338) | 114 | (2,333) | 22,192 | ||||||||||||||||||||||||||||||||||||||
| Net income (loss) | $ | 165,444 | $ | (943,398) | $ | 49,143 | $ | 34,310 | $ | 31,266 | $ | (777,954) | ||||||||||||||||||||||||||||||||
Diluted average shares (2) | 147,099 | 114,077 | 152,983 | 136,523 | 130,697 | 114,235 | ||||||||||||||||||||||||||||||||||||||
| Diluted earnings (loss) per common share | $ | 1.00 | $ | (8.28) | $ | 0.38 | $ | 0.31 | $ | 0.30 | $ | (6.82) | ||||||||||||||||||||||||||||||||
(1)Acquisition-related equity compensation expense relates to shares of restricted stock that were issued to members of CoreVest management as a component of the consideration paid to them for our purchase of their interests in CoreVest.
(2)Diluted average shares includes shares from the assumed conversion of our convertible and/or exchangeable debt in certain periods, in accordance with GAAP diluted EPS provisions. See Table 3 that follows for details of this calculation for the current and prior quarter and our respective Quarterly Reports on Form 10-Q and Annual Report on Form 10-K.
| THE REDWOOD REVIEW I 2ND QUARTER 2020 | Table 1: GAAP Earnings 25 | |||||||
| Table 2: Segment Results ($ in thousands) | ||||||||||||||||||||||||||||||||||||||||||||||||||||||||||||||||
| Three Months Ended June 30, 2020 | Three Months Ended March 31, 2020 | ||||||||||||||||||||||||||||||||||||||||||||||||||||||||||||||||
| Residential Lending | Business Purpose Lending | Third-Party Investments | Corporate / Other | Total | Residential Lending | Business Purpose Lending | Third-Party Investments | Corporate / Other | Total | ||||||||||||||||||||||||||||||||||||||||||||||||||||||||
| Net interest income (loss) | $ | 6,484 | $ | 14,905 | $ | 8,942 | $ | (3,051) | $ | 27,280 | $ | 19,229 | $ | 18,070 | $ | 13,439 | $ | 672 | $ | 51,410 | |||||||||||||||||||||||||||||||||||||||||||||
| Non-interest income (loss) | |||||||||||||||||||||||||||||||||||||||||||||||||||||||||||||||||
| Mortgage banking activities, net | (8,005) | 2,233 | — | — | (5,772) | (23,081) | (5,330) | — | — | (28,411) | |||||||||||||||||||||||||||||||||||||||||||||||||||||||
| Investment fair value changes, net | 35,085 | 40,401 | 76,972 | (230) | 152,228 | (196,635) | (142,130) | (531,558) | (509) | (870,832) | |||||||||||||||||||||||||||||||||||||||||||||||||||||||
| Other income, net | 230 | 476 | (509) | 758 | 955 | (497) | 1,693 | 1,241 | — | 2,437 | |||||||||||||||||||||||||||||||||||||||||||||||||||||||
| Realized gains, net | 205 | — | 578 | 25,182 | 25,965 | 1,796 | — | 2,056 | — | 3,852 | |||||||||||||||||||||||||||||||||||||||||||||||||||||||
| Total non-interest income (loss), net | 27,515 | 43,110 | 77,041 | 25,710 | 173,376 | (218,417) | (145,767) | (528,261) | (509) | (892,954) | |||||||||||||||||||||||||||||||||||||||||||||||||||||||
| General and administrative expenses | (3,875) | (10,293) | (2,106) | (13,818) | (30,092) | (5,632) | (14,333) | (1,788) | (10,915) | (32,668) | |||||||||||||||||||||||||||||||||||||||||||||||||||||||
| Other expenses | — | (3,884) | (1,065) | (134) | (5,083) | — | (92,985) | 1,882 | (312) | (91,415) | |||||||||||||||||||||||||||||||||||||||||||||||||||||||
| (Provision for) benefit from income taxes | 3,323 | 2,439 | (5,799) | — | (37) | 5,330 | 6,582 | 10,317 | — | 22,229 | |||||||||||||||||||||||||||||||||||||||||||||||||||||||
| Net income (loss) | $ | 33,447 | $ | 46,277 | $ | 77,013 | $ | 8,707 | $ | 165,444 | $ | (199,490) | $ | (228,433) | $ | (504,411) | $ | (11,064) | $ | (943,398) | |||||||||||||||||||||||||||||||||||||||||||||
| Residential and business purpose lending subcategories: | |||||||||||||||||||||||||||||||||||||||||||||||||||||||||||||||||
| Mortgage Banking | $ | (6,763) | $ | (7,789) | $ | (19,372) | $ | (102,175) | |||||||||||||||||||||||||||||||||||||||||||||||||||||||||
| Investments | 40,210 | 54,066 | (180,118) | (126,258) | |||||||||||||||||||||||||||||||||||||||||||||||||||||||||||||
| Net income (loss) | $ | 33,447 | $ | 46,277 | $ | (199,490) | $ | (228,433) | |||||||||||||||||||||||||||||||||||||||||||||||||||||||||
| THE REDWOOD REVIEW I 2ND QUARTER 2020 | Table 2: Segment Results 26 | |||||||
| Table 3: GAAP Basic and Diluted Earnings per Common Share (in thousands, except per share data) | ||||||||||||||||
| 2020 Q2 | 2020 Q1 | ||||||||||||||||
| GAAP Earnings per Common Share ("EPS"): | |||||||||||||||||
| Net income (loss) attributable to Redwood | $ | 165,444 | $ | (943,398) | |||||||||||||
| Adjust for dividends and undistributed earnings allocated to participating securities | (4,528) | (1,209) | |||||||||||||||
| Net income (loss) allocated to common shareholders for GAAP basic EPS | 160,916 | (944,607) | |||||||||||||||
| Incremental adjustment to dividends and undistributed earnings allocated to participating securities | 1,412 | — | |||||||||||||||
Adjust for interest expense and gain on extinguishment on convertible notes for the period, net of tax (1) | (15,835) | — | |||||||||||||||
| Net income (loss) allocated to common shareholders for GAAP diluted EPS | $ | 146,493 | $ | (944,607) | |||||||||||||
| Basic weighted average common shares outstanding | 114,383 | 114,077 | |||||||||||||||
| Net effect of dilutive equity awards | — | — | |||||||||||||||
Net effect of assumed convertible notes conversion to common shares (1) | 32,716 | — | |||||||||||||||
| Diluted weighted average common shares outstanding | 147,099 | 114,077 | |||||||||||||||
| GAAP Basic Earnings (Loss) per Common Share | $ | 1.41 | $ | (8.28) | |||||||||||||
| GAAP Diluted Earnings (Loss) per Common Share | $ | 1.00 | $ | (8.28) | |||||||||||||
(1)Certain convertible notes were determined to be dilutive during the second quarter of 2020 and were included in the calculation of diluted EPS under the "if-converted" method. Under this method, the periodic interest expense and gains on extinguishment of debt (net of applicable taxes) for dilutive notes is added back to the numerator and the number of shares that the notes are entitled to (if converted, regardless of whether they are in or out of the money) are included in the denominator.
| THE REDWOOD REVIEW I 2ND QUARTER 2020 | Table 3: GAAP Earnings per Basic and Diluted Common Share 27 | |||||||
| Table 4: Taxable and GAAP Income (1) Differences and Dividends (In thousands, except for per share data) | ||||||||||||||||||||||||||||||||||||||||
Estimated Six Months 2020 (2) | Estimated Twelve Months 2019 (2) | ||||||||||||||||||||||||||||||||||||||||
| Taxable Income | GAAP Income | Differences | Taxable Income | GAAP Income | Differences | ||||||||||||||||||||||||||||||||||||
| Taxable and GAAP Income Differences | |||||||||||||||||||||||||||||||||||||||||
| Interest income | $ | 149,856 | $ | 328,027 | $ | (178,171) | $ | 320,480 | $ | 622,281 | $ | (301,801) | |||||||||||||||||||||||||||||
| Interest expense | (80,744) | (249,337) | 168,593 | (183,550) | (479,808) | 296,258 | |||||||||||||||||||||||||||||||||||
| Net interest income | 69,112 | 78,690 | (9,578) | 136,930 | 142,473 | (5,543) | |||||||||||||||||||||||||||||||||||
| Realized credit losses | (945) | — | (945) | (534) | — | (534) | |||||||||||||||||||||||||||||||||||
| Mortgage banking activities, net | (30,147) | (34,183) | 4,036 | 80,146 | 87,266 | (7,120) | |||||||||||||||||||||||||||||||||||
| Investment fair value changes, net | (95,725) | (718,604) | 622,879 | 4,307 | 35,500 | (31,193) | |||||||||||||||||||||||||||||||||||
| General and administrative expenses | (59,633) | (62,760) | 3,127 | (109,737) | (118,672) | 8,935 | |||||||||||||||||||||||||||||||||||
| Other income | 10,218 | 3,392 | 6,826 | 23,397 | 19,257 | 4,140 | |||||||||||||||||||||||||||||||||||
| Realized gains, net | 23,908 | 29,817 | (5,909) | 62,613 | 23,821 | 38,792 | |||||||||||||||||||||||||||||||||||
| Other expenses | (3,718) | (96,498) | 92,780 | (3,351) | (13,022) | 9,671 | |||||||||||||||||||||||||||||||||||
| (Provision for) benefit from income taxes | (433) | 22,192 | (22,625) | (866) | (7,440) | 6,574 | |||||||||||||||||||||||||||||||||||
| (Loss) income | $ | (87,363) | $ | (777,954) | $ | 690,591 | $ | 192,905 | $ | 169,183 | $ | 23,722 | |||||||||||||||||||||||||||||
| REIT taxable (loss) income | $ | (20,378) | $ | 136,255 | |||||||||||||||||||||||||||||||||||||
| Taxable (loss) income at taxable subsidiaries | (66,985) | 56,650 | |||||||||||||||||||||||||||||||||||||||
| Taxable (loss) income | $ | (87,363) | $ | 192,905 | |||||||||||||||||||||||||||||||||||||
| Shares used for taxable EPS calculation | 114,940 | 114,353 | |||||||||||||||||||||||||||||||||||||||
| REIT taxable income per share | $ | (0.17) | $ | 1.28 | |||||||||||||||||||||||||||||||||||||
| Taxable (loss) income per share at taxable subsidiaries | $ | (0.58) | $ | 0.54 | |||||||||||||||||||||||||||||||||||||
Taxable (loss) income per share (3) | $ | (0.75) | $ | 1.82 | |||||||||||||||||||||||||||||||||||||
| Dividends | |||||||||||||||||||||||||||||||||||||||||
| Dividends declared | $ | 51,107 | $ | 126,139 | |||||||||||||||||||||||||||||||||||||
Dividends per share (4) | $ | 0.45 | $ | 1.20 | |||||||||||||||||||||||||||||||||||||
(1)Taxable income for 2020 and 2019 are estimates until we file our tax returns for these years. To the extent we expect to pay tax at the corporate level (generally as a result of activity at our TRS), we are required to record a tax provision for GAAP reporting purposes. Any tax provision (or benefit) is not necessarily the actual amount of tax currently due (or receivable as a refund) as a portion of our provision (or benefit) is deferred in nature. It is our intention to retain any excess inclusion income generated in 2020 at our TRS and not pass it through to our shareholders.
(2)Reconciliation of GAAP income to taxable income (loss) for prior quarters is provided in the respective Redwood Reviews for those quarters.
(3)Taxable income (loss) per share is based on the number of shares outstanding at the end of each quarter. The annual taxable income (loss) per share is the sum of the quarterly per share estimates.
(4)Dividends in 2019 are expected to be characterized as 73% ordinary dividend income (or $92 million) and 27% long-term capital gain dividend income (or $34 million).
| THE REDWOOD REVIEW I 2ND QUARTER 2020 | Table 4: Taxable and GAAP Income Differences and Dividends 28 | |||||||
| Table 5: Financial Ratios and Book Value ($ in thousands, except per share data) | ||||||||||||||||||||||||||||||||||||||||
| 2020 Q2 | 2020 Q1 | 2019 Q4 | 2019 Q3 | 2019 Q2 | Six Months 2020 | ||||||||||||||||||||||||||||||||||||
| Financial performance ratios | |||||||||||||||||||||||||||||||||||||||||
| Net interest income | $ | 27,280 | $ | 51,410 | $ | 44.873 | $ | 33,513 | $ | 32,322 | $ | 78,690 | |||||||||||||||||||||||||||||
| Corporate general and administrative expenses | $ | (13,818) | $ | (10,915) | $ | (15,436) | $ | (12,727) | $ | (12,448) | $ | (24,733) | |||||||||||||||||||||||||||||
| Total general and administrative expenses | $ | (30,092) | $ | (32,668) | $ | (42,443) | $ | (26,815) | $ | (26,255) | $ | (62,760) | |||||||||||||||||||||||||||||
| GAAP net income (loss) | $ | 165,444 | $ | (943,398) | $ | 49,143 | $ | 34,310 | $ | 31,266 | $ | (777,954) | |||||||||||||||||||||||||||||
| Average total assets | $ | 10,410,067 | $ | 17,838,481 | $ | 17,551,586 | $ | 14,017,627 | $ | 13,596,337 | $ | 14,124,274 | |||||||||||||||||||||||||||||
| Average total equity | $ | 808,896 | $ | 1,613,920 | $ | 1,800,390 | $ | 1,591,792 | $ | 1,556,850 | $ | 1,211,408 | |||||||||||||||||||||||||||||
| Corporate general and administrative expenses / average total equity | 6.83 | % | 2.71 | % | 3.43 | % | 3.20 | % | 3.20 | % | 4.08 | % | |||||||||||||||||||||||||||||
| Total general and administrative expenses / average total equity | 14.88 | % | 8.10 | % | 9.43 | % | 6.74 | % | 6.75 | % | 10.36 | % | |||||||||||||||||||||||||||||
| GAAP net income / average equity (GAAP ROE) | 81.81 | % | N/A | 10.92 | % | 8.62 | % | 8.03 | % | N/A | |||||||||||||||||||||||||||||||
| Leverage ratios and book value per share | |||||||||||||||||||||||||||||||||||||||||
| Short-term debt | $ | 418,370 | $ | 2,082,717 | $ | 2,176,591 | $ | 1,789,827 | $ | 2,227,183 | |||||||||||||||||||||||||||||||
| Long-term debt | 1,402,688 | 2,470,928 | 2,970,415 | 2,971,552 | 2,584,499 | ||||||||||||||||||||||||||||||||||||
Total debt at Redwood | $ | 1,821,058 | $ | 4,553,645 | $ | 5,147,006 | $ | 4,761,379 | $ | 4,811,682 | |||||||||||||||||||||||||||||||
| At consolidated securitization and non-recourse entities | |||||||||||||||||||||||||||||||||||||||||
| ABS issued | 6,856,086 | 6,461,864 | 10,515,475 | 8,346,051 | 6,913,129 | ||||||||||||||||||||||||||||||||||||
| Non-recourse debt | 600,356 | 259,876 | 153,696 | 191,556 | 237,363 | ||||||||||||||||||||||||||||||||||||
| Total ABS issued and non-recourse debt | $ | 7,456,442 | $ | 6,721,740 | $ | 10,669,171 | $ | 8,537,607 | $ | 7,150,492 | |||||||||||||||||||||||||||||||
Consolidated debt (1) | $ | 9,277,500 | $ | 11,275,385 | $ | 15,816,177 | $ | 13,298,986 | $ | 11,962,174 | |||||||||||||||||||||||||||||||
Tangible stockholders' equity - non-GAAP (2) | $ | 871,966 | $ | 656,719 | $ | 1,665,767 | $ | 1,735,938 | $ | 1,513,033 | |||||||||||||||||||||||||||||||
| Total stockholders' equity | $ | 936,576 | $ | 725,202 | $ | 1,827,231 | $ | 1,785,059 | $ | 1,564,032 | |||||||||||||||||||||||||||||||
Total capital (3) | $ | 1,585,096 | $ | 1,495,700 | $ | 2,596,984 | $ | 2,554,118 | $ | 2,337,442 | |||||||||||||||||||||||||||||||
Recourse leverage ratio (recourse debt at Redwood to tangible stockholders' equity)(4) | 2.1x | 6.9x | 3.1x | 2.7x | 3.2x | ||||||||||||||||||||||||||||||||||||
| Consolidated debt to tangible stockholders' equity | 10.6x | 17.2x | 9.5x | 7.7x | 7.9x | ||||||||||||||||||||||||||||||||||||
| Shares outstanding at period end (in thousands) | 114,940 | 114,838 | 114,353 | 112,102 | 97,715 | ||||||||||||||||||||||||||||||||||||
| Book value per share | $ | 8.15 | $ | 6.32 | $ | 15.98 | $ | 15.92 | $ | 16.01 | |||||||||||||||||||||||||||||||
(1)Amounts presented in Consolidated debt above do not include deferred issuance costs or debt discounts.
(2)At June 30, 2020, March 31, 2020, December 31, 2019, September 30, 2019, and June 30, 2019, tangible stockholders' equity excluded $65 million, $68 million, $161 million, $49 million, and $51 million, respectively, of goodwill and intangible assets.
(3)Our total capital of $1.6 billion at June 30, 2020 included $0.9 billion of equity capital and $0.6 billion of unsecured corporate debt.
(4)Excludes ABS issued and non-recourse debt at consolidated entities. See Table 6 for additional detail on our ABS issued and short-term debt at consolidated entities.
| THE REDWOOD REVIEW I 2ND QUARTER 2020 | Table 5: Financial Ratios and Book Value 29 | |||||||
| Table 6: Consolidating Balance Sheet ($ in thousands) | ||||||||||||||||||||||||||||||||||||||||||||||||||||||||||||||||||||||||||||||||||||||||
| June 30, 2020 | March 31, 2020 | ||||||||||||||||||||||||||||||||||||||||||||||||||||||||||||||||||||||||||||||||||||||||
Consolidated VIEs (1) | Consolidated VIEs (1) | ||||||||||||||||||||||||||||||||||||||||||||||||||||||||||||||||||||||||||||||||||||||||
At Redwood (1) | Sequoia Choice | Freddie Mac SLST | Freddie Mac K-Series | CAFL | Other (2) | Redwood Consolidated | At Redwood (1) | Sequoia Choice | Freddie Mac SLST | Freddie Mac K-Series | CAFL | Other (2) | Redwood Consolidated | ||||||||||||||||||||||||||||||||||||||||||||||||||||||||||||||||||||||||||||
| Residential loans | $ | 20,199 | $ | 2,064,388 | $ | 2,145,111 | $ | — | $ | — | $ | 304,632 | $ | 4,534,330 | $ | 2,330,669 | $ | 1,932,658 | $ | 2,131,125 | $ | — | $ | — | $ | 316,677 | $ | 6,711,129 | |||||||||||||||||||||||||||||||||||||||||||||||||||||||||||||
| Business purpose residential loans | 1,167,162 | — | — | — | 2,615,038 | — | 3,782,200 | 1,215,077 | — | — | — | 2,248,665 | — | 3,463,742 | |||||||||||||||||||||||||||||||||||||||||||||||||||||||||||||||||||||||||||
| Multifamily loans | — | — | — | 489,075 | — | — | 489,075 | — | — | — | 470,484 | — | — | 470,484 | |||||||||||||||||||||||||||||||||||||||||||||||||||||||||||||||||||||||||||
| Real estate securities | 316,436 | — | — | — | — | — | 316,436 | 293,462 | — | — | — | — | — | 293,462 | |||||||||||||||||||||||||||||||||||||||||||||||||||||||||||||||||||||||||||
| Other investments | 139,035 | — | — | — | 290,805 | 429,840 | 131,826 | — | — | — | 314,394 | 446,220 | |||||||||||||||||||||||||||||||||||||||||||||||||||||||||||||||||||||||||||||
| Cash and cash equivalents | 525,839 | — | — | — | — | 2,773 | 528,612 | 375,347 | — | — | — | — | 2,886 | 378,233 | |||||||||||||||||||||||||||||||||||||||||||||||||||||||||||||||||||||||||||
Other assets (3) | 208,253 | 8,245 | 7,567 | 1,342 | 16,911 | 38,731 | 281,049 | 483,703 | 8,589 | 8,234 | 1,390 | 16,552 | 19,052 | 537,520 | |||||||||||||||||||||||||||||||||||||||||||||||||||||||||||||||||||||||||||
| Total assets | $ | 2,376,924 | $ | 2,072,633 | $ | 2,152,678 | $ | 490,417 | $ | 2,631,949 | $ | 636,941 | $ | 10,361,542 | $ | 4,830,084 | $ | 1,941,247 | $ | 2,139,359 | $ | 471,874 | $ | 2,265,217 | $ | 653,009 | $ | 12,300,790 | |||||||||||||||||||||||||||||||||||||||||||||||||||||||||||||
| Short-term debt | $ | 418,370 | $ | — | $ | — | $ | — | $ | — | $ | 244,437 | $ | 662,807 | $ | 2,082,717 | $ | — | $ | — | $ | — | $ | — | $ | 258,931 | $ | 2,341,648 | |||||||||||||||||||||||||||||||||||||||||||||||||||||||||||||
| Other liabilities | 128,247 | 6,483 | 5,149 | 1,182 | 8,458 | 18,426 | 167,945 | 279,850 | 6,935 | 5,251 | 1,230 | 8,188 | 16,861 | 318,315 | |||||||||||||||||||||||||||||||||||||||||||||||||||||||||||||||||||||||||||
| ABS issued | — | 1,861,777 | 1,812,008 | 464,691 | 2,417,253 | 300,357 | 6,856,086 | — | 1,790,094 | 1,825,000 | 447,699 | 2,086,870 | 312,201 | 6,461,864 | |||||||||||||||||||||||||||||||||||||||||||||||||||||||||||||||||||||||||||
| Long-term debt, net | 1,738,128 | — | — | — | — | — | 1,738,128 | 2,453,761 | — | — | — | — | — | 2,453,761 | |||||||||||||||||||||||||||||||||||||||||||||||||||||||||||||||||||||||||||
| Total liabilities | 2,284,745 | 1,868,260 | 1,817,157 | 465,873 | 2,425,711 | 563,220 | 9,424,966 | 4,816,328 | 1,797,029 | 1,830,251 | 448,929 | 2,095,058 | 587,993 | 11,575,588 | |||||||||||||||||||||||||||||||||||||||||||||||||||||||||||||||||||||||||||
| Equity | 92,179 | 204,373 | 335,521 | 24,544 | 206,238 | 73,721 | 936,576 | 13,756 | 144,218 | 309,108 | 22,945 | 170,159 | 65,016 | 725,202 | |||||||||||||||||||||||||||||||||||||||||||||||||||||||||||||||||||||||||||
| Total liabilities and equity | $ | 2,376,924 | $ | 2,072,633 | $ | 2,152,678 | $ | 490,417 | $ | 2,631,949 | $ | 636,941 | $ | 10,361,542 | $ | 4,830,084 | $ | 1,941,247 | $ | 2,139,359 | $ | 471,874 | $ | 2,265,217 | $ | 653,009 | $ | 12,300,790 | |||||||||||||||||||||||||||||||||||||||||||||||||||||||||||||
(1)The format of this consolidating balance sheet is provided to more clearly delineate between the assets and liabilities belonging to securitization entities (Consolidated VIEs) that we are required to consolidate on our balance sheet in accordance with GAAP, and the assets that are legally ours and the liabilities of ours for which there is recourse to us. Each of these entities is independent of Redwood and of each other and the assets and liabilities of these entities are not owned by and are not legal obligations of ours. Our exposure to these entities is primarily through the financial interests we have retained or acquired in these entities (generally subordinate securities), the fair value of which is represented by our equity in each entity, as presented in this table.
(2)Includes our consolidated Legacy Sequoia and Servicing Investment entities. At June 30, 2020, our equity in the Legacy Sequoia and Servicing Investment entities was $6 million and $68 million, respectively. At March 31, 2020, our equity in the Legacy Sequoia and Servicing Investment entities was $6 million and $59 million, respectively.
(3)At both June 30, 2020 and March 31, 2020, other assets at Redwood included a total of $33 million of assets held by third-party custodians and pledged as collateral to the GSEs in connection with credit risk-sharing arrangements. These pledged assets can only be used to settle obligations to the GSEs under these risk-sharing arrangements.
| THE REDWOOD REVIEW I 2ND QUARTER 2020 | Table 6: Consolidating Balance Sheet 30 | |||||||

| S E G M E N T O V E R V I E W | ||
Segment Overview
In the fourth quarter of 2019, we reorganized our operations into four business segments, representing the areas of the housing market in which we operate. Given changes in the composition of our portfolio over the last several months resulting from the impact of the COVID-19 pandemic, in the second quarter of 2020, we combined our Third-Party Residential Investments and Multifamily Investments segments into a new segment called Third-Party Investments. Our two lending segments represent vertically integrated platforms and our third segment now captures all of our third-party investments.
Each segment includes all revenue and direct expense associated with the origination, acquisition and management of its associated financial assets. Additionally, we allocate corporate long-term debt (previously included in our corporate segment) to each segment, allowing us to evaluate each segment's contribution to our overall return on equity. Our three business segments currently include:
Residential Lending – Comprised of our residential mortgage banking operations and investments created from these activities, including primarily investments retained from our residential loan securitization activities.
Business Purpose Lending – Comprised of our business purpose mortgage banking operations and investments created from these activities, including: SFR securities retained from CoreVest-sponsored securitizations and investments in residential and small-balance multifamily bridge loans.
Third-Party Investments – Comprised of other investments not sourced through our residential or business purpose lending operations, including: re-performing loan securities, third-party RMBS (including CRT securities and legacy securities), multifamily securities and loans we have acquired, and other housing-related investments.
| Detailed endnotes are included at the end of this Redwood Review. | ||
| THE REDWOOD REVIEW I 2ND QUARTER 2020 | ||
32 | ||
| D I V I D E N D S A N D T A X A B L E I N C O M E | ||
Dividends and Taxable Income
Summary
As a REIT, Redwood is required to distribute to shareholders at least 90% of its annual REIT taxable income, excluding net capital gains. To the extent Redwood retains REIT taxable income, including net capital gains, it is taxed at corporate tax rates. Redwood also earns taxable income at its taxable REIT subsidiaries (TRS), which it is not required to distribute.
Dividends Overview
In recent years, our Board of Directors has maintained a practice of paying regular quarterly dividends, including when in excess of the amount required to comply with the provisions of the Internal Revenue Code applicable to REITs. In June 2020, the Board of Directors declared a regular dividend of $0.125 per share for the second quarter of 2020, which was paid on June 29, 2020 to shareholders of record on June 22, 2020.
REIT Taxable Income and Dividend Distribution Requirement
Our estimated REIT taxable income/(loss) was $(58) million, or $(0.50) per share, for the second quarter of 2020 and $38 million, or $0.33 per share, for the first quarter of 2020. Under normal circumstances, our minimum REIT dividend requirement would be 90% of our annual REIT taxable income. However, we currently maintain a $28 million federal net operating loss carry forward (NOL) at the REIT that affords us the option of retaining REIT taxable income up to the NOL amount, tax free, rather than distributing it as dividends. Federal income tax rules require the dividends paid deduction to be applied to reduce REIT taxable income before the applicability of NOLs is considered; therefore, REIT taxable income must exceed our dividend distribution for us to utilize a portion of our NOL and any remaining amount will carry forward into future years. If annual REIT taxable income, exclusive of the dividends paid deduction, is a taxable loss, the NOL will be increased by the taxable loss.
The REIT taxable loss generated for the three months ended June 30, 2020 was due to a one-time deduction for closed hedges related to our FHLB debt. We currently expect REIT taxable income to be positive in future quarters. See Table 4 in the Financial Tables section of this Redwood Review for additional detail on our REIT and total taxable income.
Income Tax Characterization of Dividend for Shareholders
Our dividend characterization for 2020 will be determined based on our full-year taxable income and dividend distributions. We currently expect only a small portion of the distributions to shareholders in 2020 will be taxable as dividend income and the remainder will be a return of capital, which is generally nontaxable. Under the federal income tax rules applicable to REITs, none of our 2020 dividend distributions are currently expected to be characterized as long-term capital gains.
| Detailed endnotes are included at the end of this Redwood Review. | ||
| THE REDWOOD REVIEW I 2ND QUARTER 2020 | ||
33 | ||
| D I V I D E N D S A N D T A X A B L E I N C O M E | ||
Beginning in 2018, the Tax Cuts and Jobs Act provides that individual taxpayers may generally deduct 20% of their ordinary REIT dividends from taxable income. This results in a maximum federal effective tax rate of 29.6% on an individual taxpayer's ordinary REIT dividends, compared to the highest marginal rate of 37%. This deduction does not apply to REIT dividends classified as qualified dividend income or long-term capital gain dividends, as those dividends are taxed at a maximum rate of 20% for individuals.
| Detailed endnotes are included at the end of this Redwood Review. | ||
| THE REDWOOD REVIEW I 2ND QUARTER 2020 | ||
34 | ||
| F O R W A R D - L O O K I N G S T A T E M E N T S | ||
Forward-Looking Statements
As noted above under the heading “Forward-Looking Statements,” this Redwood Review contains forward-looking statements within the meaning of the safe harbor provisions of the Private Securities Litigation Reform Act of 1995. Forward-looking statements involve numerous risks and uncertainties. Our actual results may differ from our expectations, estimates, and projections and, consequently, you should not rely on these forward-looking statements as predictions of future events. Forward-looking statements are not historical in nature and can be identified by words such as “anticipate,” “estimate,” “will,” “should,” “expect,” “believe,” “intend,” “seek,” “plan,” and similar expressions or their negative forms, or by references to strategy, plans, goals, or intentions. These forward-looking statements are subject to risks and uncertainties, including, among other things, those described in our Annual Report on Form 10-K under the caption “Risk Factors” and in our Current Report on Form 8-K filed on April 2, 2020. Other risks, uncertainties, and factors that could cause actual results to differ materially from those projected are described below and may be described from time to time in reports we file with the Securities and Exchange Commission, including reports on Forms 10-K, 10-Q, and 8-K. We undertake no obligation to update or revise forward-looking statements, whether as a result of new information, future events, or otherwise.
Statements regarding the following subjects, among others, are forward-looking by their nature: (i) statements we make regarding Redwood's business strategy and strategic focus, including statements relating to our overall market position, strategy and long-term prospects (including trends driving the flow of capital in the housing finance market, our strategic initiatives designed to capitalize on those trends, our ability to attract capital to finance those initiatives, our approach to raising capital, our ability to pay dividends in the future, and the prospects for federal housing finance reform); (ii) statements related to our financial outlook and expectations for 2020 and future years, including our positioning to take advantage of a significant recovery in our business lines, expectations with respect to activity in our Residential Lending segment and strategic priorities for this segment, expectations with respect to activity in our Business Purpose Lending segment, including with respect to investment demand for our SFR and bridge loans, and our belief that asset valuations in our investment portfolio possess significant upside to recover value from unrealized losses incurred during the first quarter 2020, (iii) statements related to repurchases of long-term debt or common equity; (iv) statements regarding our expectations with respect to forbearance rates, loan performance for borrowers exiting forbearance periods, and Redwood's servicing advance obligations, including our estimate that for every 5 percentage point increase in the principal balance of Sequoia securitized mortgage loans in a delinquent status (whether or not subject to forbearance), our average monthly principal and interest servicing advance funding obligation would increase by approximately $3 million; (v) statements regarding estimated and pro forma financial information, including our presentation of recourse debt, marginable debt, and recourse leverage ratio, each on a pro forma basis; (vi) statements we make regarding future dividends, including with respect to our regular quarterly dividends in 2020; and (vii)
| Detailed endnotes are included at the end of this Redwood Review. | ||
| THE REDWOOD REVIEW I 2ND QUARTER 2020 | ||
35 | ||
| F O R W A R D - L O O K I N G S T A T E M E N T S | ||
statements regarding our expectations and estimates relating to the characterization for income tax purposes of our dividend distributions, our expectations and estimates relating to tax accounting, tax liabilities and tax savings, and GAAP tax provisions, and our estimates of REIT taxable income and TRS taxable income.
Important factors, among others, that may affect our actual results include:
•the pace at which we redeploy our available capital into new investments and initiatives;
•our ability to scale our platform and systems, particularly with respect to our new initiatives;
•interest rate volatility, changes in credit spreads, and changes in liquidity in the market for real estate securities and loans;
•changes in the demand from investors for residential mortgages and investments, and our ability to distribute residential mortgages through our whole-loan distribution channel;
•our ability to finance our investments in securities and our acquisition of residential mortgages with short-term debt;
•changes in the values of assets we own;
•general economic trends, the performance of the housing, real estate, mortgage, credit, and broader financial markets, and their effects on the prices of earning assets and the credit status of borrowers;
•federal and state legislative and regulatory developments, and the actions of governmental authorities, including the new U.S. presidential administration, and in particular those affecting the mortgage industry or our business (including, but not limited to, the Federal Housing Finance Agency’s rules relating to FHLB membership requirements and the implications for our captive insurance subsidiary’s membership in the FHLB);
•strategic business and capital deployment decisions we make;
•developments related to the fixed income and mortgage finance markets and the Federal Reserve’s statements regarding its future open market activity and monetary policy;
•our exposure to credit risk and the timing of credit losses within our portfolio;
•the concentration of the credit risks we are exposed to, including due to the structure of assets we hold and the geographical concentration of real estate underlying assets we own;
•our exposure to adjustable-rate mortgage loans;
•the efficacy and expense of our efforts to manage or hedge credit risk, interest rate risk, and other financial and operational risks;
•changes in credit ratings on assets we own and changes in the rating agencies’ credit rating methodologies;
•changes in interest rates;
•changes in mortgage prepayment rates;
| Detailed endnotes are included at the end of this Redwood Review. | ||
| THE REDWOOD REVIEW I 2ND QUARTER 2020 | ||
36 | ||
| F O R W A R D - L O O K I N G S T A T E M E N T S | ||
•changes in liquidity in the market for real estate securities and loans;
•our ability to finance the acquisition of real estate-related assets with short-term debt;
•the ability of counterparties to satisfy their obligations to us;
•our involvement in securitization transactions, the profitability of those transactions, and the risks we are exposed to in engaging in securitization transactions;
•exposure to claims and litigation, including litigation arising from our involvement in securitization transactions;
•ongoing litigation against various trustees of RMBS transactions;
•whether we have sufficient liquid assets to meet short-term needs;
•our ability to successfully compete and retain or attract key personnel;
•our ability to adapt our business model and strategies to changing circumstances;
•changes in our investment, financing, and hedging strategies and new risks we may be exposed to if we expand our business activities;
•our exposure to a disruption or breach of the security of our technology infrastructure and systems;
•exposure to environmental liabilities;
•our failure to comply with applicable laws and regulations;
•our failure to maintain appropriate internal controls over financial reporting and disclosure controls and procedures;
•the impact on our reputation that could result from our actions or omissions or from those of others; changes in accounting principles and tax rules;
•our ability to maintain our status as a REIT for tax purposes;
•limitations imposed on our business due to our REIT status and our status as exempt from registration under the Investment Company Act of 1940;
•decisions about raising, managing, and distributing capital; and
•other factors not presently identified.
| Detailed endnotes are included at the end of this Redwood Review. | ||
| THE REDWOOD REVIEW I 2ND QUARTER 2020 | ||
37 | ||
| E N D N O T E S | ||
Pro Forma Note
This Redwood Review contains selected pro forma financial information, giving effect to a new financing arrangement entered into during July 2020, as if the transaction had occurred on June 30, 2020. This financing arrangement is a non-recourse, non-marginable facility to finance business purpose bridge loans with a two-year term. Additionally, refer to the Introduction section of this Redwood Review for further information regarding our pro forma financial information.
Recourse Debt Note
Redwood's recourse debt excludes $7.5 billion and $6.7 billion of consolidated securitization debt (ABS issued and servicer advance financing) and other debt that is non-recourse to Redwood at June 30, 2020 and March 31, 2020, respectively.
Non-GAAP Tangible Book Value Note
Non-GAAP tangible shareholders' equity (or book value) is a measurement of stockholders’ equity excluding the value of acquisition-related intangible assets recorded on our consolidated balance sheet in connection with the acquisitions in 2019 of 5 Arches, LLC and CoreVest American Finance Lender LLC. Management believes tangible shareholders’ equity provides useful information to investors and management because it eliminates the impact of these acquisition-related items that may not be reflective of the underlying performance of Redwood’s ongoing operations, and which may not be reflective of their impact over the longer term. At June 30, 2020 and March 31, 2020, tangible stockholders' equity excluded $65 million and $68 million of intangible assets, respectively.
Page 4 (Shareholder Letter)
(1)Refer to Pro Forma Note above.
Page 8 (Quarterly Overview)
(1)Economic return on book value is based on the periodic change in GAAP book value per common share plus dividends declared per common share during the period.
(2)Recourse leverage ratio is defined as recourse debt (see recourse debt note above) at Redwood divided by tangible stockholders' equity. Tangible stockholders' equity excludes $65 million and $68 million of intangible assets at June 30, 2020 and March 31, 2020, respectively.
(3)Cash to marginable recourse debt ratio is defined as unrestricted cash divided by marginable recourse debt (which includes $375 million of debt that is subject to market-value based margin calls)
Page 11 (Analysis of Changes in Fair Values...)
(1)"Q1 2020 Unrealized Loss" presented within this table represents fair value changes recorded in the first quarter of 2020 for assets we held at March 31, 2020. These changes in fair value were recorded both through our "Investment fair value changes" line item on our income statement and our "Accumulated other comprehensive income" line item on our balance sheet. These losses represent the decline in price of the related assets from December 31, 2019 (or their purchase date, if purchased after December 31, 2019) to March 31, 2020.
(2)"Q2 2020 Change in Value" presented within this table represents fair value changes recorded in the second quarter of 2020 for the associated assets, including both unrealized and gains and losses on a net basis. These changes in fair value were recorded both through our "Investment fair value changes" line item on our income statement and our "Accumulated other comprehensive income" line item on our balance sheet.
Page 12 (Book Value)
(1)"Fair value changes on investments held on or after March 31, 2020" presented within this table represent fair value changes recorded in the first and second quarters of 2020 for assets we held on or after March 31, 2020. These changes in fair value were recorded both through our "Investment fair value changes" line item on our income statement and our "Accumulated other comprehensive income" line item on our balance sheet. For the first quarter of 2020, these losses represent the decline in price of the related assets from December 31, 2019 (or their purchase date, if purchased after December 31, 2019) to March 31, 2020.
(2)"Other Q1 2020 investment fair value changes" represents investment fair value changes on assets we sold and hedges we settled during the first quarter of 2020, and assets that we had either entered into agreements to sell or that we have the intent to sell in the near-term.
(3)Refer to Non-GAAP Tangible Book Value note above.
Page 18 (Capital Allocations)
(1)Refer to Pro Forma Note above.
(2)Other assets and liabilities are presented on a net basis within this column.
(3)Net investment in bridge loans represents our effective economic investment in bridge loans financed with non-recourse debt.
(4)Cash and cash equivalents for the June 30, 2020 pro forma column within this table has been adjusted for the net impact from changes in recourse and non-recourse debt balances.
| THE REDWOOD REVIEW I 2ND QUARTER 2020 | ||
38 | ||
| E N D N O T E S | ||
Page 19 (Financing Overview)
(1)Debt balances presented in the Pro Forma columns of the following tables are adjusted on a pro forma basis for certain items as described in the Pro Forma Note above.
(2)Securities repurchase debt scheduled maturities presented in this table have been adjusted to reflect maturity dates as of July 31, 2020, based on rolls/extensions that were executed in July 2020.
Page 20 (Financing Overview, Ctd.)
(1)Cash to marginable recourse debt ratio is defined as unrestricted cash divided by marginable recourse debt (which includes $375 million of debt that is subject to market-value based margin calls)
(2)See Pro forma Note above.
(3)Securities portfolio line item within table includes MSRs with a fair value of $41 million and $20 million of associated marginable debt
(4)Weighted average cost of debt represents the weighted average contractual interest rate of the associated debt. The interest expense that we record for these borrowings in our GAAP income statement also includes deferred financing costs and other fees, which increase the effective cost of these borrowings.
Page 21 (Credit Overview)
(1)Underlying loan performance information provided in this table is generally reported on a one-month lag. As such, the data reported in this table is from June reports, which reflect a loan performance date of May 31.
(2)HPI updated LTV is calculated based on the current loan balance and an updated property value amount that is formulaically adjusted from value at origination based on the FHFA home price index (HPI).
Page 22 (Credit Overview, Ctd.)
(1)Average current debt service coverage ratio (or DSCR) is the ratio by which net operating income of a property exceeds it fixed debt costs.
(2)Average loan to value (or LTV) (at origination) is calculated based on the original loan amount and the property value at the time the loan was originated.
| THE REDWOOD REVIEW I 2ND QUARTER 2020 | ||
39 | ||