Attached files
| file | filename |
|---|---|
| EX-99.2 - EX-99.2 - Noble Corp | d85677dex992.htm |
| EX-10.1 - EX-10.1 - Noble Corp | d85677dex101.htm |
| 8-K - 8-K - Noble Corp | d85677d8k.htm |
Exhibit 99.1
Preliminary Draft Privileged & Confidential Business Plan Review (Last Updated 5.13.20) July 1, 2020
Preliminary Draft Privileged & Confidential Forward Looking Statement The following presentation is for discussion purposes only and the information in the presentation is not complete and may be changed. The following presentation does not purport to contain all of the information that may be required to evaluate a possible transaction. The following presentation is not intended to form the basis of any investment decision by the recipient and does not constitute investment, tax or legal advice. The following presentation contains, and certain oral and written statements made by representatives of Noble Corporations plc and its subsidiaries (collectively, the “Company”) from time to time may contain, “forward-looking statements” about the Company’s business, financial performance and position, contracts and prospects. Statements regarding contract backlog, costs, benefits, opportunities, financial performance, capital structure, debt, financial position, fleet strategy, bidding activity, rig demand, contract commencements, dayrates, impact of future regulations, contract duration, fleet condition, capabilities or performance, industry fundamentals, stakeholder value, as well as any other statements that are not historical facts in this release, are forward-looking statements that involve certain risks, uncertainties and assumptions. These include but are not limited to operating hazards and delays, risks associated with operations outside of the U.S., actions or claims by regulatory authorities or other third parties, market conditions, financial results and performance, ability to repay debt and timing thereof, actions by customers and other third parties, legislation and regulations affecting drilling operations, compliance with regulatory requirements, factors affecting the level of activity in the oil and gas industry, supply and demand of drilling rigs, factors affecting the duration of contracts, the actual amount of downtime, factors that reduce applicable dayrates, violations of anti-corruption laws, hurricanes and other weather conditions, public health threats including the COVID-19 (Coronavirus Disease 2019) pandemic, the future price of oil and gas and other factors detailed in the Noble Corp plc’s most recent Form 10-K, Form 10-Q’s and other filings with the Securities and Exchange Commission. Should one or more of these risks or uncertainties materialize, or should underlying assumptions prove incorrect, actual results may vary materially from those indicated. Specifically, the Company and the industry in which it operates are currently experiencing significant challenges and volatility. As a result, the information in the following presentation is subject to material revisions, including as a result of the impact of macro-economic factors, including the COVID-19 (Coronavirus Disease 2019) pandemic. The Company is unable to predict or provide any estimate of the overall impact of any of these factors on its business, operations, financial condition or prospects. The Company expressly disclaims any duty to update the information presented in the following presentation for changes in these factors or any other risks, uncertainties or assumptions, even if actual results vary materially from what is contained in the following presentation. In addition, all projections, estimates, goals, targets, plans, trends or other statements with respect to the Company’s future results or future events are based on current management estimates and assumptions, some of which may not materialize or may change, and are subject to risks and uncertainties over which the Company has no control or ability to predict. Unanticipated events may occur that could affect the outcome of such projections, estimates, goals, targets, plans, trends and other statements. You must make your own determinations as to the reasonableness of these projections, estimates, goals, targets, plans, trends and other statements and should also note that if one or more estimates change, or one or more assumptions are not met, or one or more unexpected events occur, the performance and results set forth in such projections, estimates, goals, targets, plans, trends and other statements may not be achieved. The Company can give no assurance as to its future operations, performance, results or events. The Company undertakes no obligation to update or revise any such projections, estimates, goals, targets, plans, trends or other statements with respect to its future results or future events, whether as a result of new information, future events or otherwise. As of July 1, 2020, to the knowledge of the Company, the Company’s currently outstanding “Senior Notes” are structurally junior in right of payment to the Company’s 7.875% “Senior Guaranteed Notes” due 2026 with respect to all direct and indirect subsidiaries of Noble Corporation, a Cayman Islands exempted company, other than Noble Holding International Limited (the issuer of the Senior Notes and the Senior Guaranteed Notes), Noble Finance Luxembourg S.a.r.l, Noble Rig Holding I Limited, and Noble Rig Holding II Limited. As of July 1, 2020, none of Noble Corporation, a Cayman Islands exempted company, Noble Holding International Limited, Noble Finance Luxembourg S.a.r.l, Noble Rig Holding I Limited, or Noble Rig Holding II Limited held any cash.
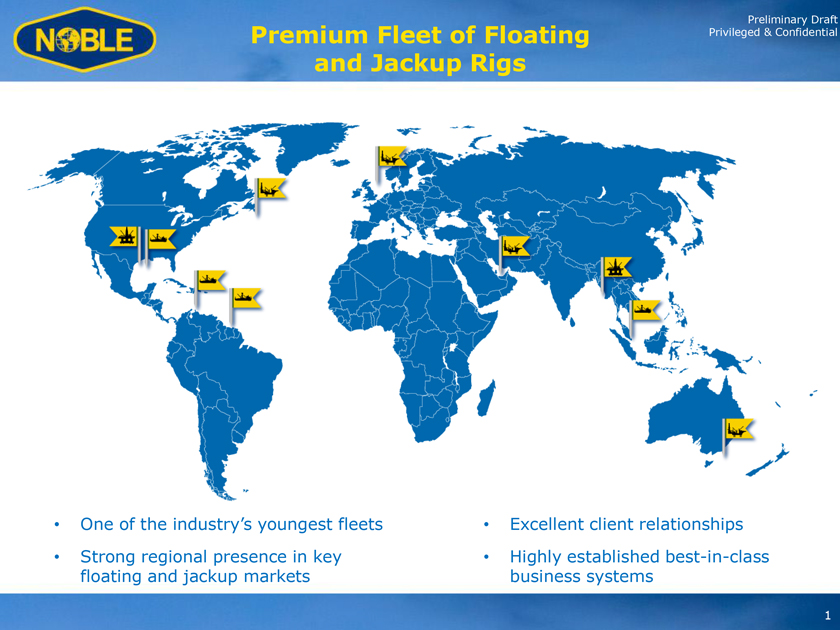
Preliminary Draft Premium Fleet of Floating Privileged & Confidential and Jackup Rigs • One of the industry’s youngest fleets • Excellent client relationships • Strong regional presence in key • Highly established best-in-class floating and jackup markets business systems 1
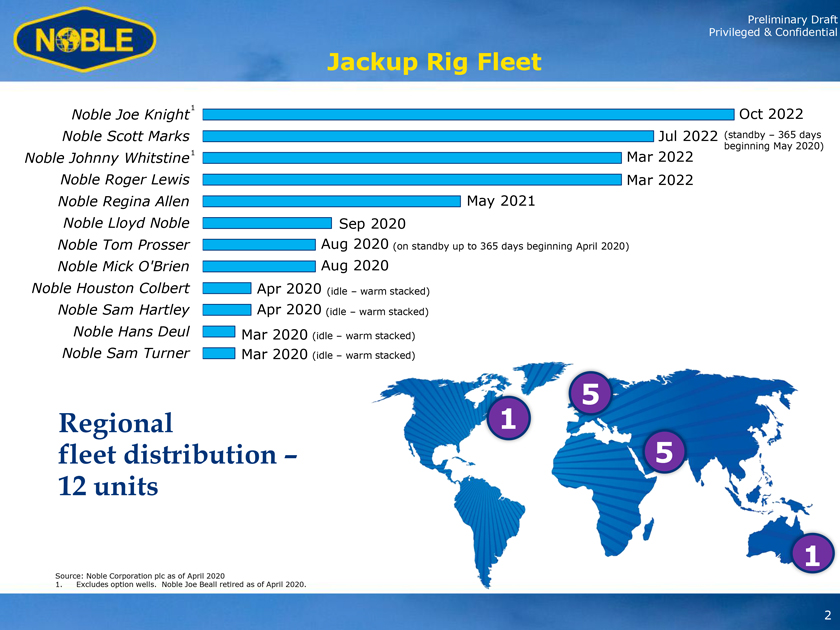
Preliminary Draft Privileged & Confidential Jackup Rig Fleet Noble Joe Knight1 Oct 2022 Noble Scott Marks Jul 2022 (standby – 365 days beginning May 2020) Noble Johnny Whitstine1 Mar 2022 Noble Roger Lewis Mar 2022 Noble Regina Allen May 2021 Noble Lloyd Noble Sep 2020 Noble Tom Prosser Aug 2020 (on standby up to 365 days beginning April 2020) Noble Mick O’Brien Aug 2020 Noble Houston Colbert Apr 2020 (idle – warm stacked) Noble Sam Hartley Apr 2020 (idle – warm stacked) Noble Hans Deul Mar 2020 (idle – warm stacked) Noble Sam Turner Mar 2020 (idle – warm stacked) 5 Regional 1 fleet distribution – 5 12 units 1 Source: Noble Corporation plc as of April 2020 1. Excludes option wells. Noble Joe Beall retired as of April 2020. 2
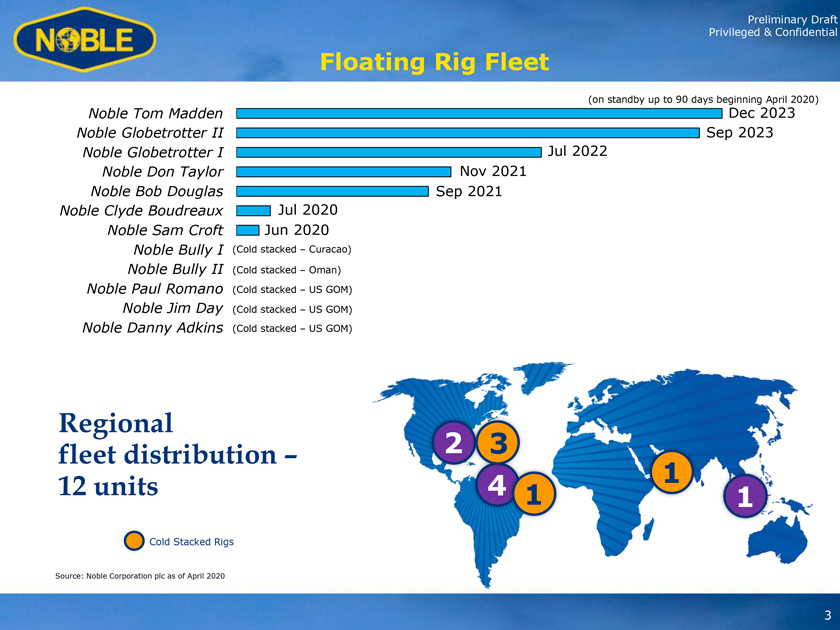
Preliminary Draft Privileged & Confidential Floating Rig Fleet (on standby up to 90 days beginning April 2020) Noble Tom Madden Dec 2023 Noble Globetrotter II Sep 2023 Noble Globetrotter I Jul 2022 Noble Don Taylor Nov 2021 Noble Bob Douglas Sep 2021 Noble Clyde Boudreaux Jul 2020 Noble Sam Croft Jun 2020 Noble Bully I (Cold stacked – Curacao) Noble Bully II (Cold stacked – Oman) Noble Paul Romano (Cold stacked – US GOM) Noble Jim Day (Cold stacked – US GOM) Noble Danny Adkins (Cold stacked – US GOM) Regional fleet distribution – 2 3 12 units 4 1 1 1 Cold Stacked Rigs Source: Noble Corporation plc as of April 2020 3
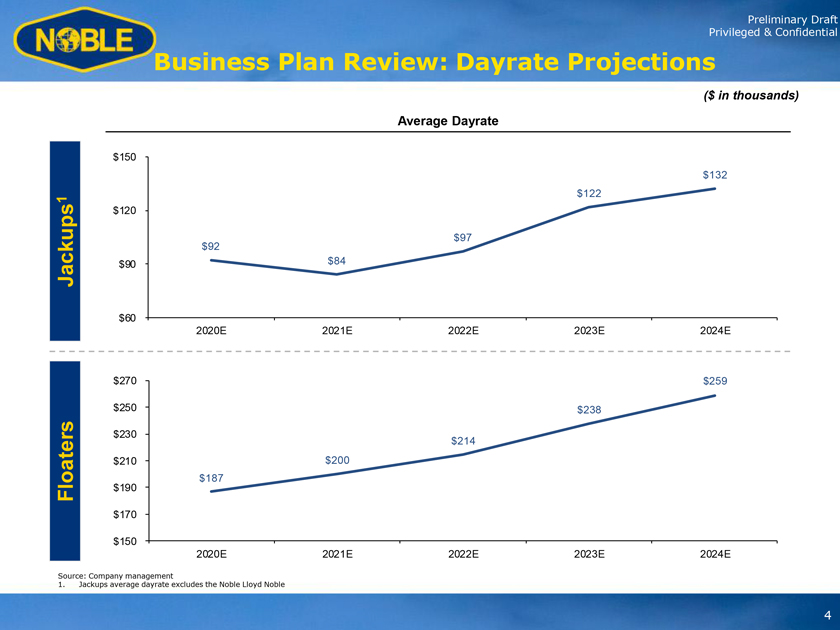
Preliminary Draft Privileged & Confidential Business Plan Review: Dayrate Projections ($ in thousands) Average Dayrate $150 $132 $122 1 $120 $97 $92 Jackups $90 $84 $60 2020E 2021E 2022E 2023E 2024E $270 $259 $250 $238 $230 $214 $210 $200 Floaters $190 $187 $170 $150 2020E 2021E 2022E 2023E 2024E Source: Company management 1. Jackups average dayrate excludes the Noble Lloyd Noble 4
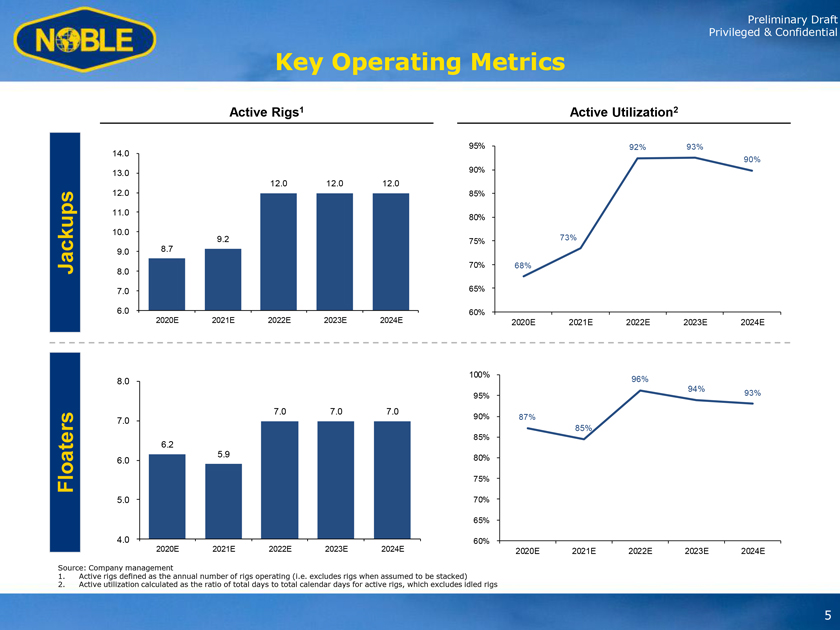
Preliminary Draft Privileged & Confidential Key Operating Metrics Active Rigs1 Active Utilization2 14.0 95% 92% 93% 90% 13.0 90% 12.0 12.0 12.0 12.0 85% 11.0 80% 10.0 9.2 75% 73% 9.0 8.7 Jackups 70% 68% 8.0 7.0 65% 6.0 60% 2020E 2021E 2022E 2023E 2024E 2020E 2021E 2022E 2023E 2024E 100% 8.0 96% 94% 95% 93% 7.0 7.0 7.0 90% 87% 7.0 85% 6.2 85% 5.9 80% 6.0 Floaters 75% 5.0 70% 65% 4.0 60% 2020E 2021E 2022E 2023E 2024E 2020E 2021E 2022E 2023E 2024E Source: Company management 1. Active rigs defined as the annual number of rigs operating (i.e. excludes rigs when assumed to be stacked) 2. Active utilization calculated as the ratio of total days to total calendar days for active rigs, which excludes idled rigs 5
Preliminary Draft Driving Cost Structure Privileged & Confidential and Operational Efficiencies ïƒ~ Overhead savings ïƒ~ Recently executed over $25 million of annualized G&A savings (primarily headcount driven)ïƒ~ Evaluations of further overhead savings are underway, with a focus on both headcount efficiencies and further streamlining of business processesïƒ~ Reduction in capital expendituresïƒ~ Reduction in 2020 capital expenditure budget to $165—$175 million ïƒ~ Majority of capital is either sustaining capital or reimbursable by a customerïƒ~ Reduction in daily operating costsïƒ~ Ongoing customer discussions around further potential efficiency improvements on the rigïƒ~ Evaluation of potential improvements in stacking costs for rigs currently off contract in the North Seaïƒ~ The Noble organization prides itself on our operational efficiencies and execution –we are 100% committed to maintaining and improving our leading operational efficiencies and excellence going forward 6
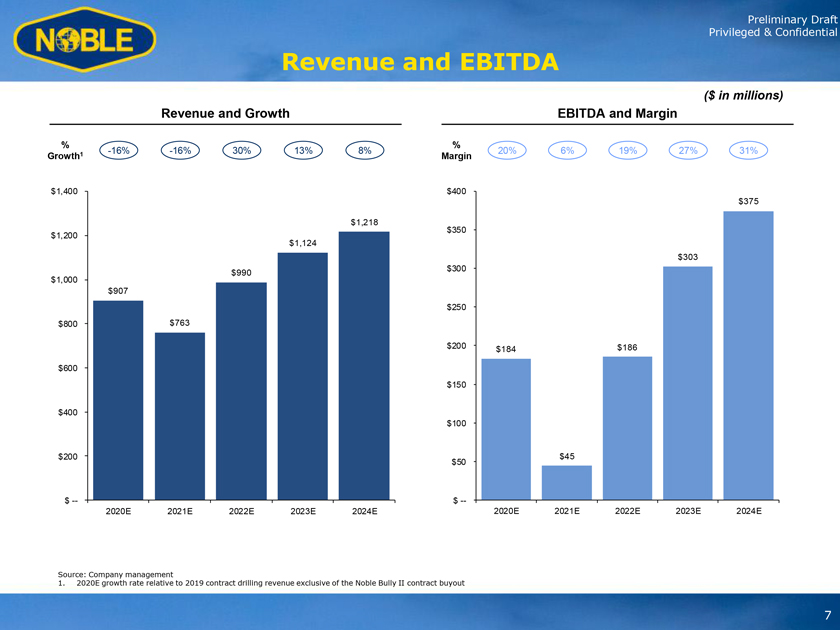
Preliminary Draft Privileged & Confidential Revenue and EBITDA ($ in millions) Revenue and Growth EBITDA and Margin % % 1 -16% -16% 30% 13% 8% 20% 6% 19% 27% 31% Growth Margin $1,400 $400 $375 $1,218 $350 $1,200 $1,124 $303 $300 $1,000 $990 $907 $250 $800 $763 $200 $184 $186 $600 $150 $400 $100 $200 $45 $50 $ — $ — 2020E 2021E 2022E 2023E 2024E 2020E 2021E 2022E 2023E 2024E Source: Company management 1. 2020E growth rate relative to 2019 contract drilling revenue exclusive of the Noble Bully II contract buyout 7
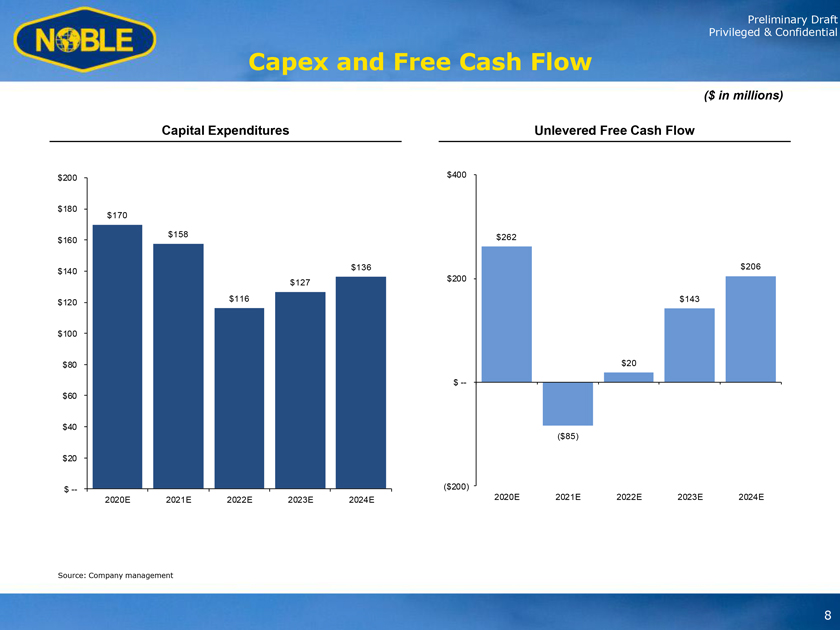
Preliminary Draft Privileged & Confidential Capex and Free Cash Flow ($ in millions) Capital Expenditures Unlevered Free Cash Flow $200 $400 $180 $170 $158 $262 $160 $136 $206 $140 $200 $127 $120 $116 $143 $100 $80 $20 $ —$60 $40 ($85) $20 $ — ($200) 2020E 2021E 2022E 2023E 2024E 2020E 2021E 2022E 2023E 2024E Source: Company management 8
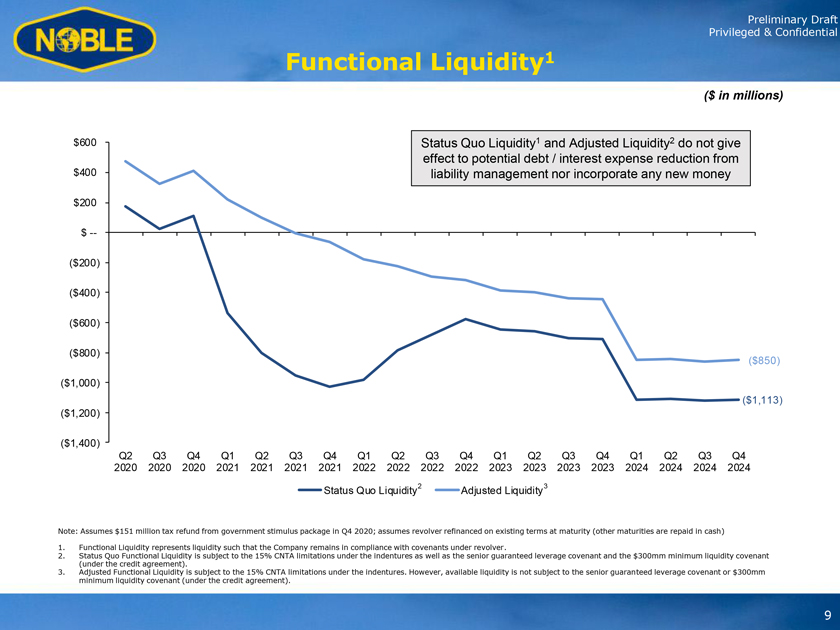
Preliminary Draft Privileged & Confidential Functional Liquidity1 ($ in millions) $600 Status Quo Liquidity1 and Adjusted Liquidity2 do not give effect to potential debt / interest expense reduction from $400 liability management nor incorporate any new money $200 $ — ($200) ($400) ($600) ($800) ($850) ($1,000) ($1,113) ($1,200) ($1,400) Q2 Q3 Q4 Q1 Q2 Q3 Q4 Q1 Q2 Q3 Q4 Q1 Q2 Q3 Q4 Q1 Q2 Q3 Q4 2020 2020 2020 2021 2021 2021 2021 2022 2022 2022 2022 2023 2023 2023 2023 2024 2024 2024 2024 Status Quo Liquidity2 Adjusted Liquidity3 Note: Assumes $151 million tax refund from government stimulus package in Q4 2020; assumes revolver refinanced on existing terms at maturity (other maturities are repaid in cash) 1. Functional Liquidity represents liquidity such that the Company remains in compliance with covenants under revolver. 2. Status Quo Functional Liquidity is subject to the 15% CNTA limitations under the indentures as well as the senior guaranteed leverage covenant and the $300mm minimum liquidity covenant (under the credit agreement). 3. Adjusted Functional Liquidity is subject to the 15% CNTA limitations under the indentures. However, available liquidity is not subject to the senior guaranteed leverage covenant or $300mm minimum liquidity covenant (under the credit agreement). 9
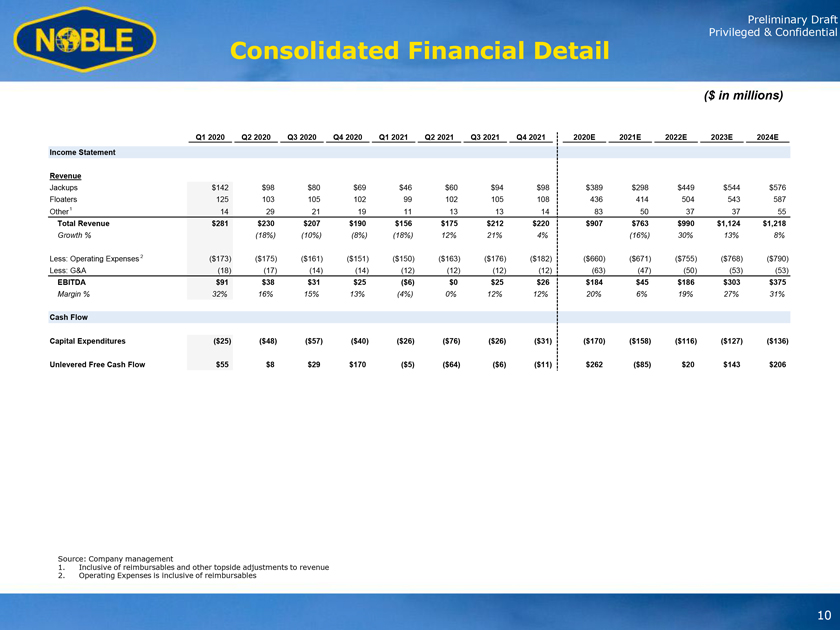
Preliminary Draft Privileged & Confidential Consolidated Financial Detail ($ in millions) Q1 2020 Q2 2020 Q3 2020 Q4 2020 Q1 2021 Q2 2021 Q3 2021 Q4 2021 2020E 2021E 2022E 2023E 2024E Income Statement Revenue Jackups $142 $98 $80 $69 $46 $60 $94 $98 $389 $298 $449 $544 $576 Floaters 125 103 105 102 99 102 105 108 436 414 504 543 587 Other1 14 29 21 19 11 13 13 14 83 50 37 37 55 Total Revenue $281 $230 $207 $190 $156 $175 $212 $220 $907 $763 $990 $1,124 $1,218 Growth % (18%) (10%) (8%) (18%) 12% 21% 4% (16%) 30% 13% 8% Less: Operating Expenses 2 ($173) ($175) ($161) ($151) ($150) ($163) ($176) ($182) ($660) ($671) ($755) ($768) ($790) Less: G&A (18) (17) (14) (14) (12) (12) (12) (12) (63) (47) (50) (53) (53) EBITDA $91 $38 $31 $25 ($6) $0 $25 $26 $184 $45 $186 $303 $375 Margin % 32% 16% 15% 13% (4%) 0% 12% 12% 20% 6% 19% 27% 31% Cash Flow Capital Expenditures ($25) ($48) ($57) ($40) ($26) ($76) ($26) ($31) ($170) ($158) ($116) ($127) ($136) Unlevered Free Cash Flow $55 $8 $29 $170 ($5) ($64) ($6) ($11) $262 ($85) $20 $143 $206 Source: Company management 1. Inclusive of reimbursables and other topside adjustments to revenue 2. Operating Expenses is inclusive of reimbursables 10