Attached files
| file | filename |
|---|---|
| 8-K - 8-K - Hilltop Holdings Inc. | hth-20200730x8k.htm |
Exhibit 99.1
| Hilltop Holdings Inc. Earnings Presentation Q2 2020 July 2020 |

| Preface 2 Additional Information Corporate Headquarters 6565 Hillcrest Ave Dallas, TX 75205 Phone: 214-855-2177 www.hilltop-holdings.com Please Contact: Erik Yohe Phone: 214-525-4634 Email: eyohe@hilltop-holdings.com FORWARD-LOOKING STATEMENTS This presentation and statements made by representatives of Hilltop Holdings Inc. (“Hilltop” or the “Company”) during the course of this presentation include “forward-looking statements” within the meaning of the Private Securities Litigation Reform Act of 1995. These forward-looking statements involve known and unknown risks, uncertainties and other factors that may cause our actual results, performance or achievements to be materially different from any future results, performance or achievements anticipated in such statements. Forward-looking statements speak only as of the date they are made and, except as required by law, we do not assume any duty to update forward-looking statements. Such forward-looking statements include, but are not limited to, statements concerning such things as our outlook, our business strategy, our financial condition, our efforts to make strategic acquisitions, our revenue, our liquidity and sources of funding, market trends, operations and business, taxes, the impact of natural disasters or public health emergencies, such as the current coronavirus (“COVID-19”) global pandemic, information technology expenses, capital levels, mortgage servicing rights (“MSR”) assets, stock repurchases, dividend payments, use of proceeds from offerings, expectations concerning mortgage loan origination volume, loan volume and interest rate compression, servicer advances, expected levels of refinancing as a percentage of total loan origination volume, projected losses on mortgage loans originated, loss estimates related to natural disasters, total expenses, anticipated changes in our revenue, earnings, or taxes, the effects of government regulation applicable to our operations, the appropriateness of, and changes in, our allowance for credit losses and provision for (reversal of) credit losses, including as a result of the “current expected credit losses” (CECL) model, future benchmark rates and economic growth, anticipated investment yields, expected accretion of discount on loans in future periods, the collectability of loans, cybersecurity incidents, construction costs, cost savings expected from initiatives implemented and planned, including core system upgrades and cost reduction efforts, the outcome of litigation, and our other plans, objectives, strategies, expectations and intentions and other statements that are not statements of historical fact, and may be identified by words such as “anticipates,” “believes,” “building”, “could,” “estimates,” “expects,” “forecasts,” “goal,” “guidance”, “intends,” “may,” “might,” “outlook”, “plan,” “probable,” “projects,” “seeks,” “should,” “target,” “view” or “would” or the negative of these words and phrases or similar words or phrases. The following factors, among others, could cause actual results to differ from those set forth in the forward- looking statements: (i) changes in general economic, market and business conditions in areas or markets where we compete, including changes in the price of crude oil; (ii) the COVID-19 pandemic and the response of governmental authorities to the pandemic, which have caused and are causing significant harm to the global economy and our business; (iii) the credit risks of lending activities, including our ability to estimate credit losses and increases to the allowance for credit losses as a result of the implementation of CECL; (iv) the effects of changes in the level of, and trends in, loan delinquencies and write-offs; (v) changes in the interest rate environment; (vi) risks associated with concentration in real estate related loans; (vii) effectiveness of our data security controls in the face of cyber attacks; (viii) the effects of our indebtedness on our ability to manage our business successfully, including the restrictions imposed by the indenture governing our indebtedness; (ix) cost and availability of capital; (x) changes in state and federal laws, regulations or policies affecting one or more of our business segments, including changes in regulatory fees, deposit insurance premiums, capital requirements and the Dodd-Frank Wall Street Reform and Consumer Protection Act; (xi) changes in key management; (xii) competition in our banking, broker-dealer and mortgage origination from other banks and financial institutions, as well as investment banking and financial advisory firms, mortgage bankers, asset-based non-bank lenders and government agencies; (xiii) legal and regulatory proceedings; (xiv) risks associated with merger and acquisition integration; and (xv) our ability to use excess capital in an effective manner. For further discussion of such factors, see the risk factors described in our most recent Annual Report on Form 10-K, and subsequent Quarterly Reports on Form 10-Q and other reports, that we have filed with the Securities and Exchange Commission. All forward-looking statements are qualified in their entirety by this cautionary statement. The information contained herein is preliminary and based on Company data available at the time of the earnings presentation. It speaks only as of the particular date or dates included in the accompanying slides. Hilltop Holdings does not undertake an obligation to, and disclaims any duty to, update any of the information herein. |
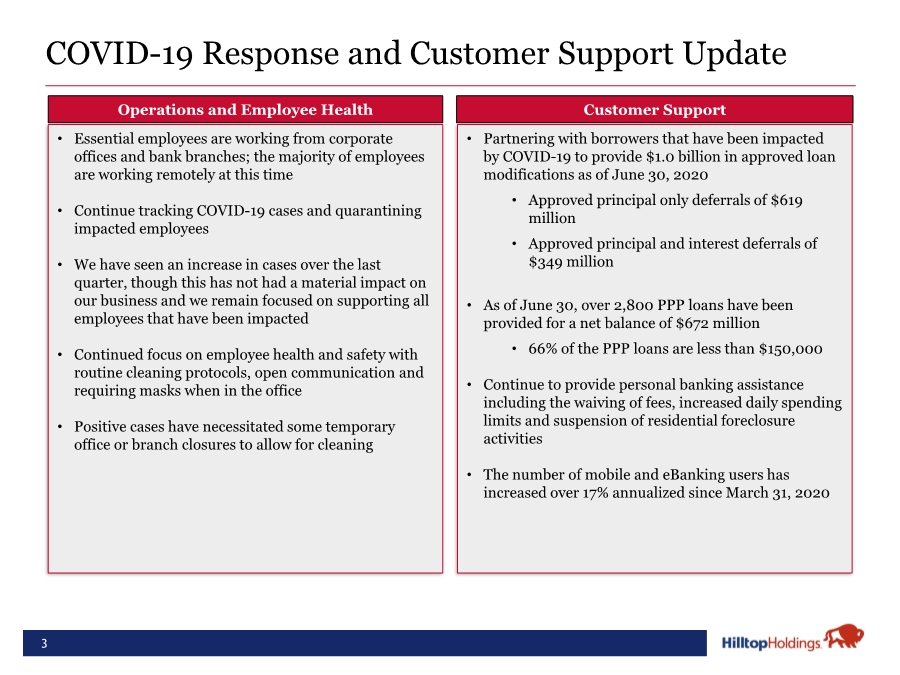
| 3 COVID-19 Response and Customer Support Update Customer Support Operations and Employee Health • Essential employees are working from corporate offices and bank branches; the majority of employees are working remotely at this time • Continue tracking COVID-19 cases and quarantining impacted employees • We have seen an increase in cases over the last quarter, though this has not had a material impact on our business and we remain focused on supporting all employees that have been impacted • Continued focus on employee health and safety with routine cleaning protocols, open communication and requiring masks when in the office • Positive cases have necessitated some temporary office or branch closures to allow for cleaning • Partnering with borrowers that have been impacted by COVID-19 to provide $1.0 billion in approved loan modifications as of June 30, 2020 • Approved principal only deferrals of $619 million • Approved principal and interest deferrals of $349 million • As of June 30, over 2,800 PPP loans have been provided for a net balance of $672 million • 66% of the PPP loans are less than $150,000 • Continue to provide personal banking assistance including the waiving of fees, increased daily spending limits and suspension of residential foreclosure activities • The number of mobile and eBanking users has increased over 17% annualized since March 31, 2020 |
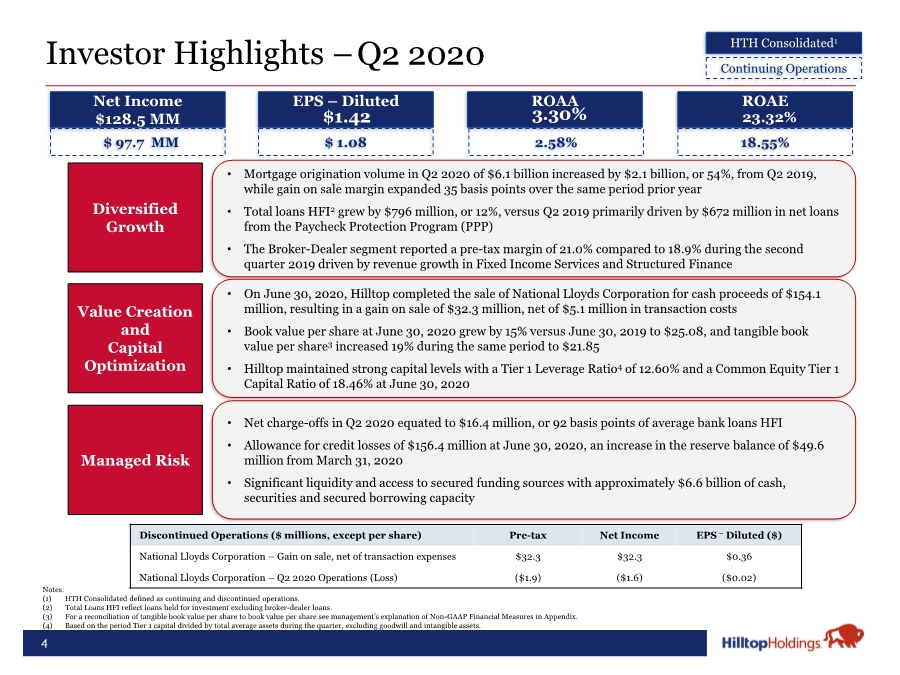
| 4 Investor Highlights – Net Income $128.5 MM ROAA .86% EPS – Diluted $0.30 ROAE 5.76% Notes: (1) HTH Consolidated defined as continuing and discontinued operations. (2) Total Loans HFI reflect loans held for investment excluding broker-dealer loans. (3) For a reconciliation of tangible book value per share to book value per share see management’s explanation of Non-GAAP Financial Measures in Appendix. (4) Based on the period Tier 1 capital divided by total average assets during the quarter, excluding goodwill and intangible assets. Q 2 20 20 HTH Consolidated1 Continuing Operations $ 97.7 MM $ 1.08 2.58% 18.55% Value Creation and Capital Optimization • Net charge-offs in Q2 2020 equated to $16.4 million, or 92 basis points of average bank loans HFI • Allowance for credit losses of $156.4 million at June 30, 2020, an increase in the reserve balance of $49.6 million from March 31, 2020 • Significant liquidity and access to secured funding sources with approximately $6.6 billion of cash, securities and secured borrowing capacity Diversified Growth Managed Risk • Mortgage origination volume in Q2 2020 of $6.1 billion increased by $2.1 billion, or 54%, from Q2 2019, while gain on sale margin expanded 35 basis points over the same period prior year • Total loans HFI2 grew by $796 million, or 12%, versus Q2 2019 primarily driven by $672 million in net loans from the Paycheck Protection Program (PPP) • The Broker-Dealer segment reported a pre-tax margin of 21.0% compared to 18.9% during the second quarter 2019 driven by revenue growth in Fixed Income Services and Structured Finance • On June 30, 2020, Hilltop completed the sale of National Lloyds Corporation for cash proceeds of $154.1 million, resulting in a gain on sale of $32.3 million, net of $5.1 million in transaction costs • Book value per share at June 30, 2020 grew by 15% versus June 30, 2019 to $25.08, and tangible book value per share3 increased 19% during the same period to $21.85 • Hilltop maintained strong capital levels with a Tier 1 Leverage Ratio4 of 12.60% and a Common Equity Tier 1 Capital Ratio of 18.46% at June 30, 2020 Discontinued Operations ($ millions, except per share) Pre-tax Net Income EPS – Diluted ($) National Lloyds Corporation – Gain on sale, net of transaction expenses $32.3 $32.3 $0.36 National Lloyds Corporation – Q2 2020 Operations (Loss) ($1.9) ($1.6) ($0.02) $1.42 3.30% 23.32% |
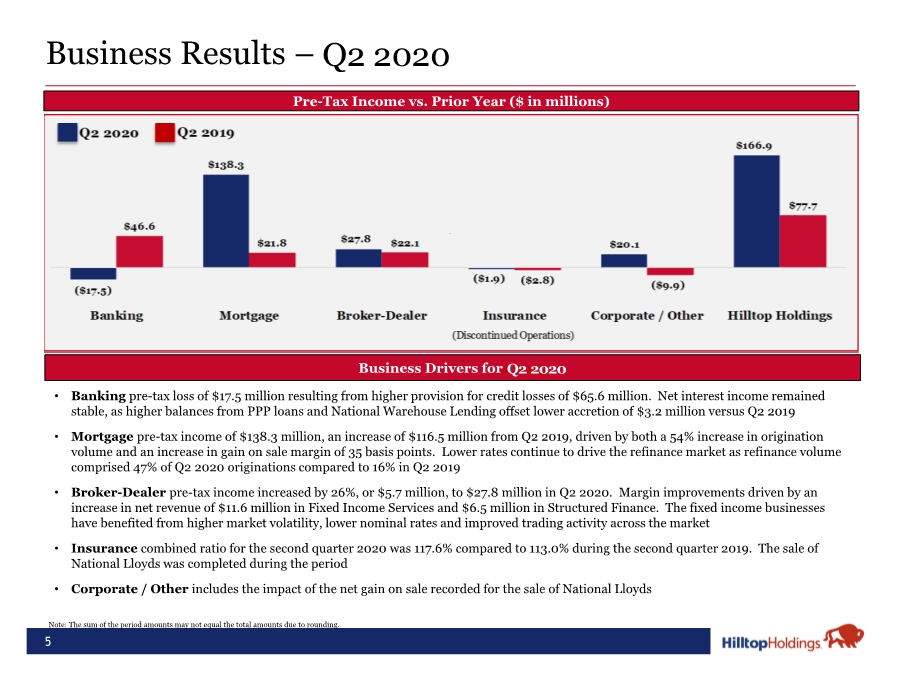
| 5 Business Results – Pre-Tax Income vs. Prior Year ($ in millions) • Banking pre-tax loss of $17.5 million resulting from higher provision for credit losses of $65.6 million. Net interest income remained stable, as higher balances from PPP loans and National Warehouse Lending offset lower accretion of $3.2 million versus Q2 2019 • Mortgage pre-tax income of $138.3 million, an increase of $116.5 million from Q2 2019, driven by both a 54% increase in origination volume and an increase in gain on sale margin of 35 basis points. Lower rates continue to drive the refinance market as refinance volume comprised 47% of Q2 2020 originations compared to 16% in Q2 2019 • Broker-Dealer pre-tax income increased by 26%, or $5.7 million, to $27.8 million in Q2 2020. Margin improvements driven by an increase in net revenue of $11.6 million in Fixed Income Services and $6.5 million in Structured Finance. The fixed income businesses have benefited from higher market volatility, lower nominal rates and improved trading activity across the market • Insurance combined ratio for the second quarter 2020 was 117.6% compared to 113.0% during the second quarter 2019. The sale of National Lloyds was completed during the period • Corporate / Other includes the impact of the net gain on sale recorded for the sale of National Lloyds Business Drivers for1 2019 Note: The sum of the period amounts may not equal the total amounts due to rounding. Q2 2020 Q2 2020 |
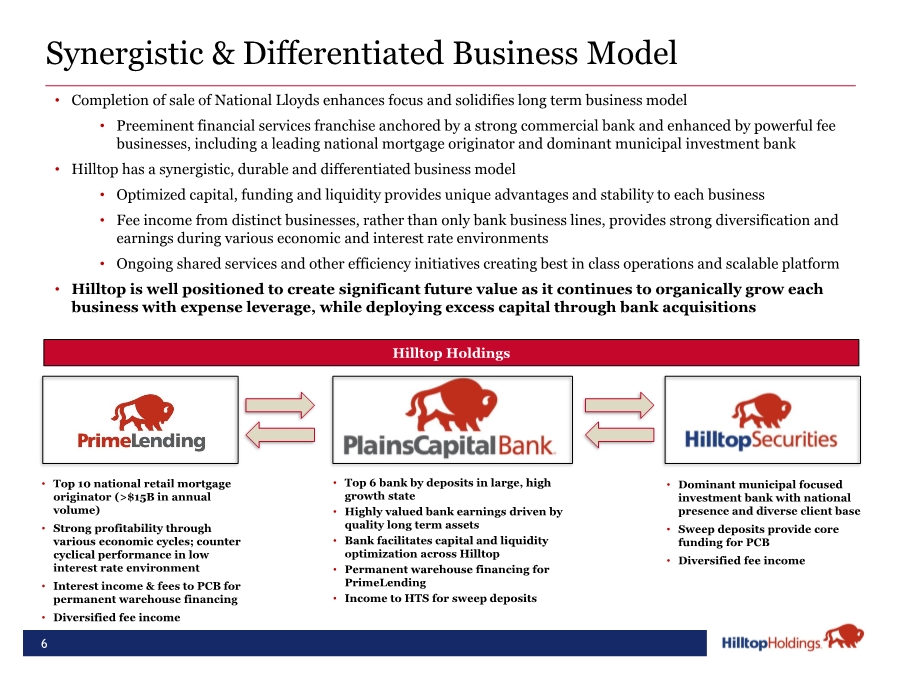
| Synergistic & Differentiated Business Model 6 • Completion of sale of National Lloyds enhances focus and solidifies long term business model • Preeminent financial services franchise anchored by a strong commercial bank and enhanced by powerful fee businesses, including a leading national mortgage originator and dominant municipal investment bank • Hilltop has a synergistic, durable and differentiated business model • Optimized capital, funding and liquidity provides unique advantages and stability to each business • Fee income from distinct businesses, rather than only bank business lines, provides strong diversification and earnings during various economic and interest rate environments • Ongoing shared services and other efficiency initiatives creating best in class operations and scalable platform • Hilltop is well positioned to create significant future value as it continues to organically grow each business with expense leverage, while deploying excess capital through bank acquisitions Hilltop Holdings • Top 10 national retail mortgage originator (>$15B in annual volume) • Strong profitability through various economic cycles; counter cyclical performance in low interest rate environment • Interest income & fees to PCB for permanent warehouse financing • Diversified fee income • Dominant municipal focused investment bank with national presence and diverse client base • Sweep deposits provide core funding for PCB • Diversified fee income • Top 6 bank by deposits in large, high growth state • Highly valued bank earnings driven by quality long term assets • Bank facilitates capital and liquidity optimization across Hilltop • Permanent warehouse financing for PrimeLending • Income to HTS for sweep deposits |
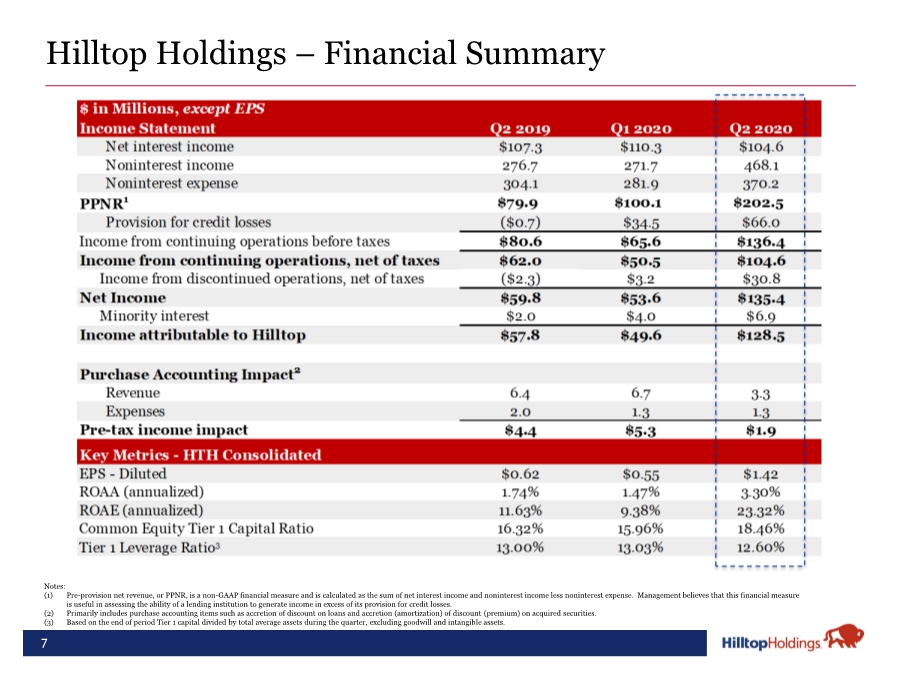
| 7 Notes: (1) Pre-provision net revenue, or PPNR, is a non-GAAP financial measure and is calculated as the sum of net interest income and noninterest income less noninterest expense. Management believes that this financial measure is useful in assessing the ability of a lending institution to generate income in excess of its provision for credit losses. (2) Primarily includes purchase accounting items such as accretion of discount on loans and accretion (amortization) of discount (premium) on acquired securities. (3) Based on the end of period Tier 1 capital divided by total average assets during the quarter, excluding goodwill and intangible assets. Hilltop Holdings – Financial Summary |
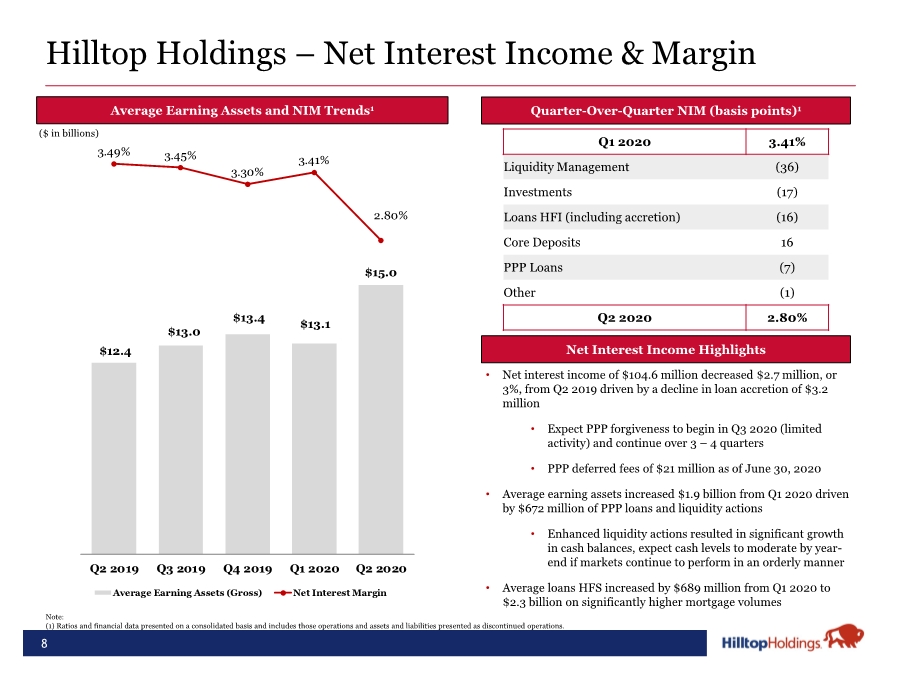
| $12.4 $13.0 $13.4 $13.1 $15.0 3.49% 3.45% 3.30% 3.41% 2.80% Q2 2019 Q3 2019 Q4 2019 Q1 2020 Q2 2020 Average Earning Assets (Gross) Net Interest Margin 8 Hilltop Holdings – Net Interest Income & Margin Average Earning Assets and NIM Trends1 2 Net Interest Income Highlights ($ in billions) • Net interest income of $104.6 million decreased $2.7 million, or 3%, from Q2 2019 driven by a decline in loan accretion of $3.2 million • Expect PPP forgiveness to begin in Q3 2020 (limited activity) and continue over 3 – 4 quarters • PPP deferred fees of $21 million as of June 30, 2020 • Average earning assets increased $1.9 billion from Q1 2020 driven by $672 million of PPP loans and liquidity actions • Enhanced liquidity actions resulted in significant growth in cash balances, expect cash levels to moderate by year- end if markets continue to perform in an orderly manner • Average loans HFS increased by $689 million from Q1 2020 to $2.3 billion on significantly higher mortgage volumes Quarter-Over-Quarter NIM (basis points)1 Q1 2020 3.41% Liquidity Management (36) Investments (17) Loans HFI (including accretion) (16) Core Deposits 16 PPP Loans (7) Other (1) Q2 2020 2.80% Note: (1) Ratios and financial data presented on a consolidated basis and includes those operations and assets and liabilities presented as discontinued operations. |
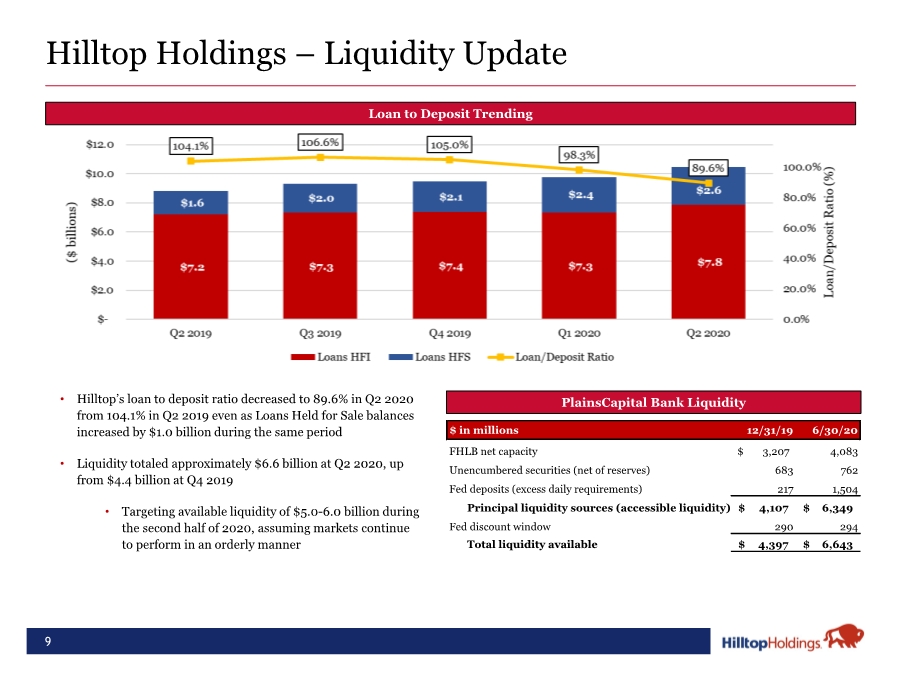
| Hilltop Holdings – Liquidity Update 9 • Hilltop’s loan to deposit ratio decreased to 89.6% in Q2 2020 from 104.1% in Q2 2019 even as Loans Held for Sale balances increased by $1.0 billion during the same period • Liquidity totaled approximately $6.6 billion at Q2 2020, up from $4.4 billion at Q4 2019 • Targeting available liquidity of $5.0-6.0 billion during the second half of 2020, assuming markets continue to perform in an orderly manner Loan to Deposit Trending PlainsCapital Bank Liquidity $ in millions 12/31/19 6/30/20 FHLB net capacity 3,207 $ 4,083 Unencumbered securities (net of reserves) 683 762 Fed deposits (excess daily requirements) 217 1,504 Principal liquidity sources (accessible liquidity) 4,107 $ 6,349 $ Fed discount window 290 294 Total liquidity available 4,397 $ 6,643 $ |
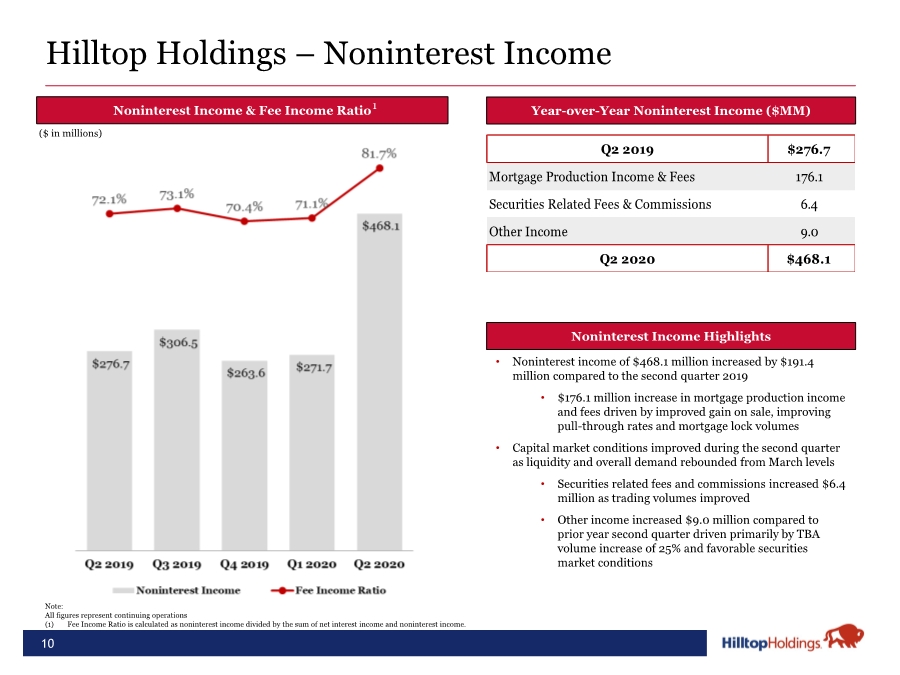
| 10 Hilltop Holdings – Noninterest Income • Noninterest income of $468.1 million increased by $191.4 million compared to the second quarter 2019 • $176.1 million increase in mortgage production income and fees driven by improved gain on sale, improving pull-through rates and mortgage lock volumes • Capital market conditions improved during the second quarter as liquidity and overall demand rebounded from March levels • Securities related fees and commissions increased $6.4 million as trading volumes improved • Other income increased $9.0 million compared to prior year second quarter driven primarily by TBA volume increase of 25% and favorable securities market conditions Year-over-Year Noninterest Income ($MM) Noninterest Income & Fee Income Ratio Noninterest Income Highlights 1 Note: All figures represent continuing operations (1) Fee Income Ratio is calculated as noninterest income divided by the sum of net interest income and noninterest income. ($ in millions) Q2 2019 $276.7 Mortgage Production Income & Fees 176.1 Securities Related Fees & Commissions 6.4 Other Income 9.0 Q2 2020 $468.1 |
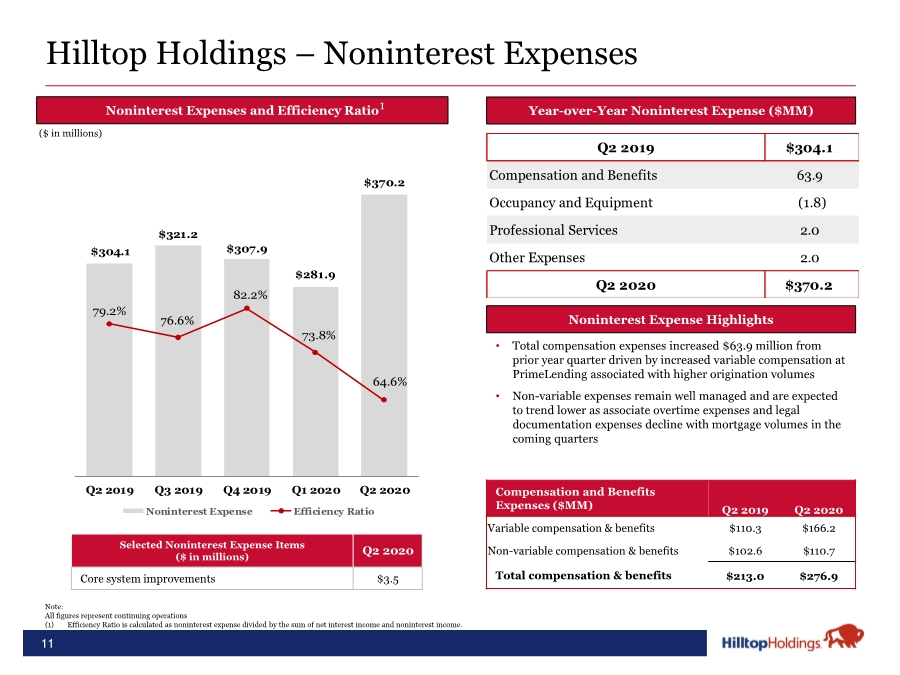
| $304.1 $321.2 $307.9 $281.9 $370.2 79.2% 76.6% 82.2% 73.8% 64.6% Q2 2019 Q3 2019 Q4 2019 Q1 2020 Q2 2020 Noninterest Expense Efficiency Ratio 11 Hilltop Holdings – Noninterest Expenses Year-over-Year Noninterest Expense ($MM) Noninterest Expenses and Efficiency Ratio Noninterest Expense Highlights • Total compensation expenses increased $63.9 million from prior year quarter driven by increased variable compensation at PrimeLending associated with higher origination volumes • Non-variable expenses remain well managed and are expected to trend lower as associate overtime expenses and legal documentation expenses decline with mortgage volumes in the coming quarters Note: All figures represent continuing operations (1) Efficiency Ratio is calculated as noninterest expense divided by the sum of net interest income and noninterest income. 1 ($ in millions) Selected Noninterest Expense Items ($ in millions) Q1 2019 Core system improvements $3.5 Q2 2020 Q2 2019 $304.1 Compensation and Benefits 63.9 Occupancy and Equipment (1.8) Professional Services 2.0 Other Expenses 2.0 Q2 2020 $370.2 Compensation and Benefits Expenses ($MM) Q2 2019 Q2 2020 Variable compensation & benefits $110.3 $166.2 Non-variable compensation & benefits $102.6 $110.7 Total compensation & benefits $213.0 $276.9 |
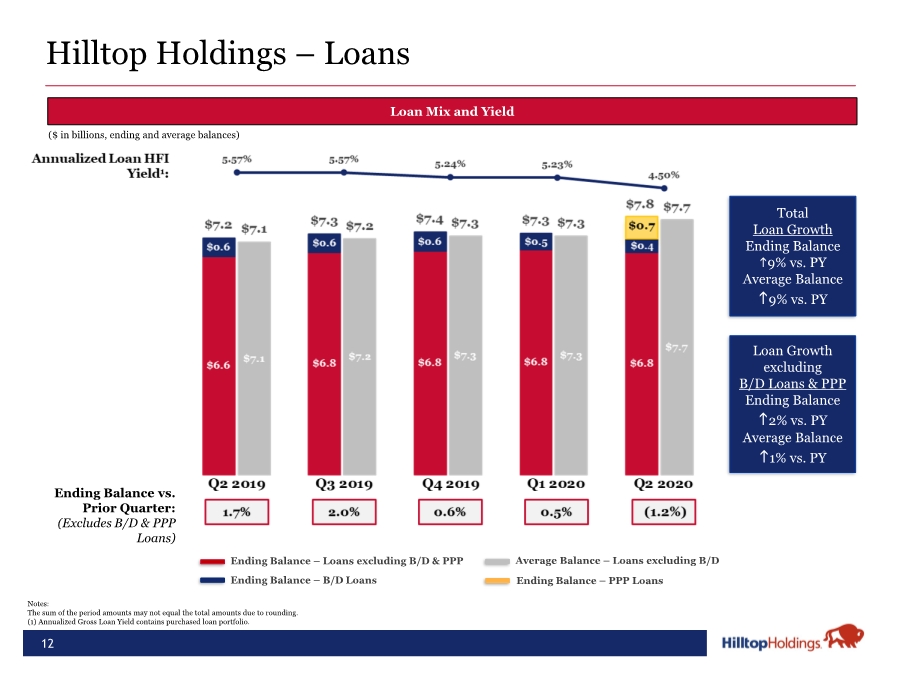
| 12 Notes: The sum of the period amounts may not equal the total amounts due to rounding. (1) Annualized Gross Loan Yield contains purchased loan portfolio. Loan Mix and Yield Total Loan Growth Ending Balance h9% vs. PY Average Balance h9% vs. PY ($ in billions, ending and average balances) Hilltop Holdings – Loans Loan Growth excluding B/D Loans & PPP Ending Balance h2% vs. PY Average Balance h1% vs. PY Ending Balance vs. Prior Quarter: (Excludes B/D & PPP Loans) Ending Balance – Loans excluding B/D & PPP Ending Balance – B/D Loans Average Balance – Loans excluding B/D Ending Balance – PPP Loans |
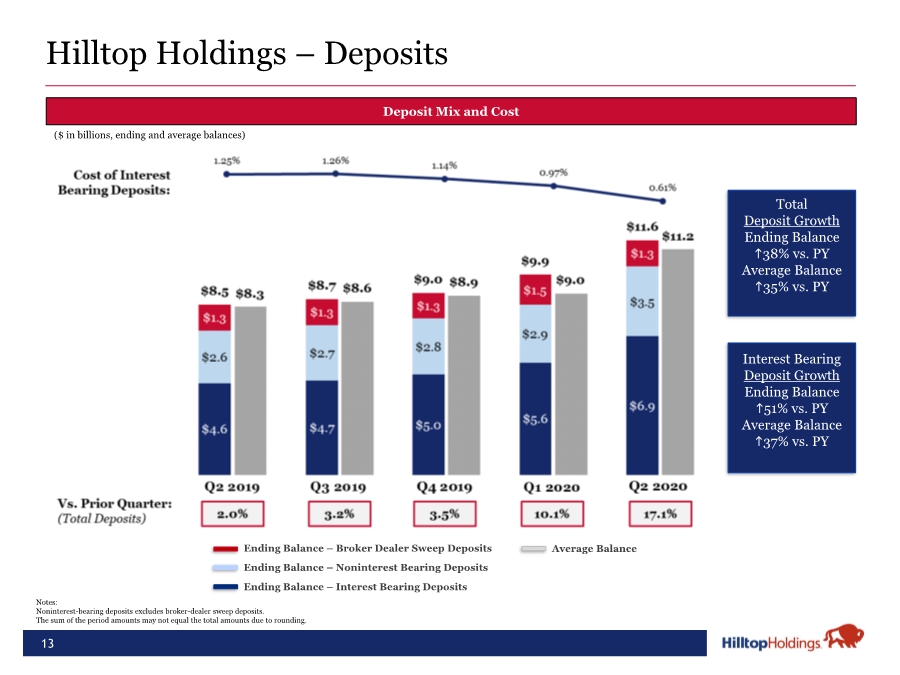
| 13 Deposit Mix and Cost ($ in billions, ending and average balances) Notes: Noninterest-bearing deposits excludes broker-dealer sweep deposits. The sum of the period amounts may not equal the total amounts due to rounding. Total Deposit Growth Ending Balance h38% vs. PY Average Balance h35% vs. PY Interest Bearing Deposit Growth Ending Balance h51% vs. PY Average Balance h37% vs. PY Ending Balance – Broker Dealer Sweep Deposits Ending Balance – Noninterest Bearing Deposits Ending Balance – Interest Bearing Deposits Average Balance Hilltop Holdings – Deposits |
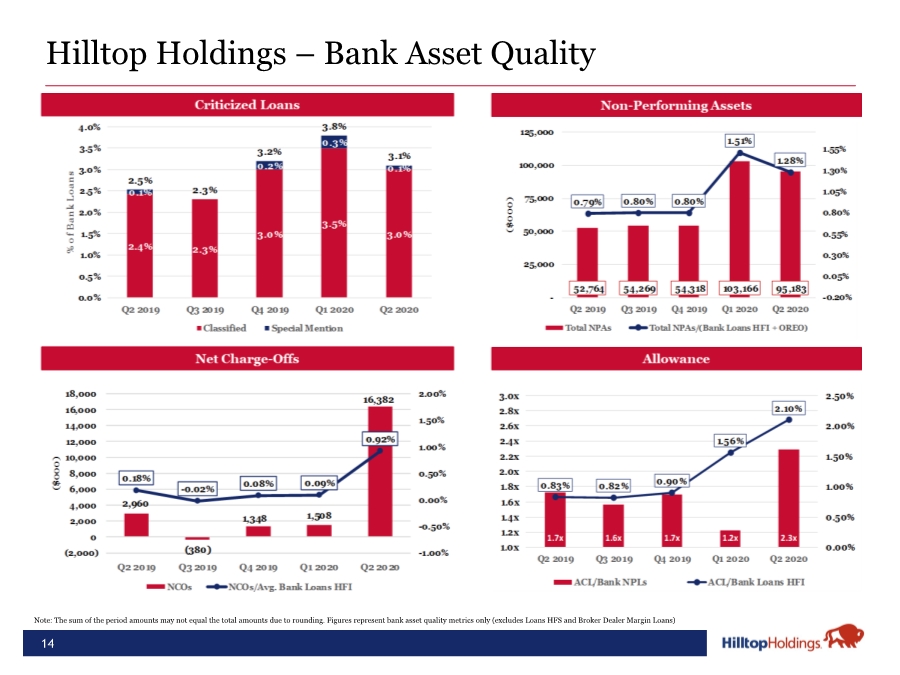
| 14 Hilltop Holdings – Bank Asset Quality Note: The sum of the period amounts may not equal the total amounts due to rounding. Figures represent bank asset quality metrics only (excludes Loans HFS and Broker Dealer Margin Loans) |
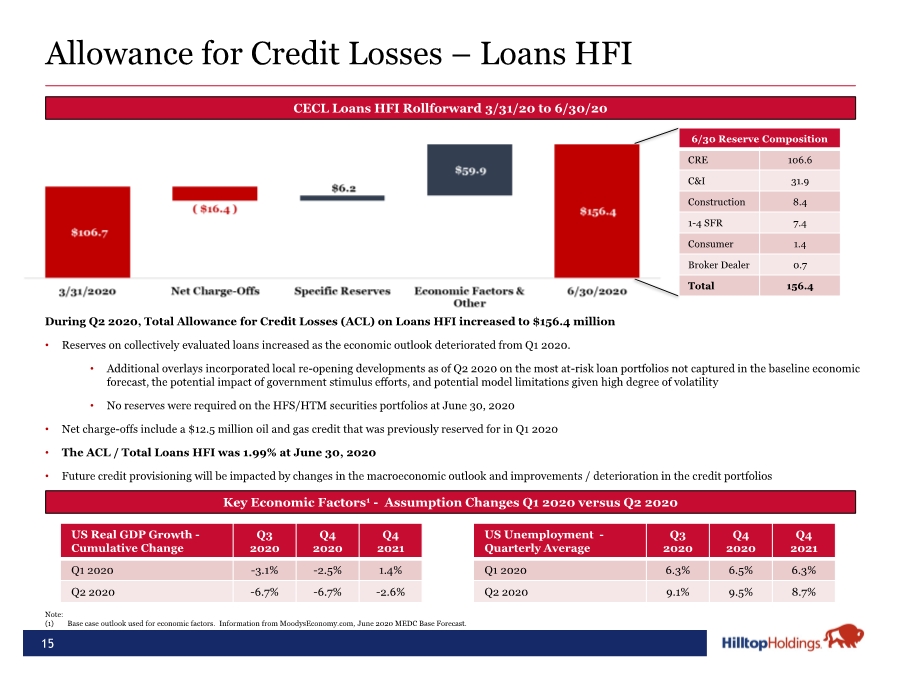
| 15 Allowance for Credit Losses – Loans HFI CECL Loans HFI Rollforward 3/31/20 to 6/30/20 During Q2 2020, Total Allowance for Credit Losses (ACL) on Loans HFI increased to $156.4 million • Reserves on collectively evaluated loans increased as the economic outlook deteriorated from Q1 2020. • Additional overlays incorporated local re-opening developments as of Q2 2020 on the most at-risk loan portfolios not captured in the baseline economic forecast, the potential impact of government stimulus efforts, and potential model limitations given high degree of volatility • No reserves were required on the HFS/HTM securities portfolios at June 30, 2020 • Net charge-offs include a $12.5 million oil and gas credit that was previously reserved for in Q1 2020 • The ACL / Total Loans HFI was 1.99% at June 30, 2020 • Future credit provisioning will be impacted by changes in the macroeconomic outlook and improvements / deterioration in the credit portfolios 6/30 Reserve Composition CRE 106.6 C&I 31.9 Construction 8.4 1-4 SFR 7.4 Consumer 1.4 Broker Dealer 0.7 Total 156.4 Key Economic Factors1 - Assumption Changes Q1 2020 versus Q2 2020 US Real GDP Growth - Cumulative Change Q3 2020 Q4 2020 Q4 2021 Q1 2020 -3.1% -2.5% 1.4% Q2 2020 -6.7% -6.7% -2.6% US Unemployment - Quarterly Average Q3 2020 Q4 2020 Q4 2021 Q1 2020 6.3% 6.5% 6.3% Q2 2020 9.1% 9.5% 8.7% Note: (1) Base case outlook used for economic factors. Information from MoodysEconomy.com, June 2020 MEDC Base Forecast. |
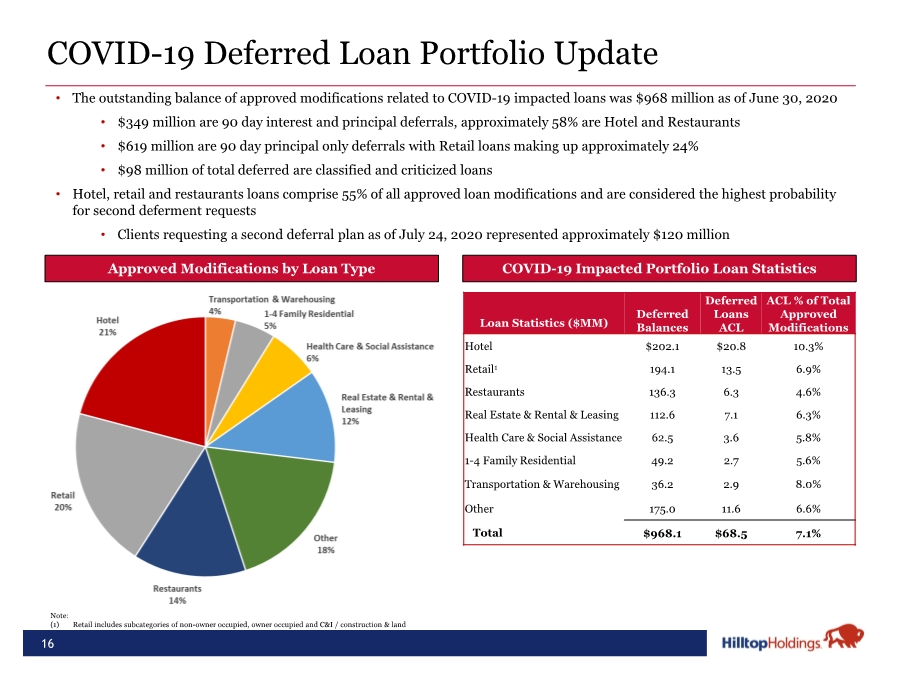
| 16 COVID-19 Deferred Loan Portfolio Update • The outstanding balance of approved modifications related to COVID-19 impacted loans was $968 million as of June 30, 2020 • $349 million are 90 day interest and principal deferrals, approximately 58% are Hotel and Restaurants • $619 million are 90 day principal only deferrals with Retail loans making up approximately 24% • $98 million of total deferred are classified and criticized loans • Hotel, retail and restaurants loans comprise 55% of all approved loan modifications and are considered the highest probability for second deferment requests • Clients requesting a second deferral plan as of July 24, 2020 represented approximately $120 million Approved Modifications by Loan Type COVID-19 Impacted Portfolio Loan Statistics Loan Statistics ($MM) Deferred Balances Deferred Loans ACL ACL % of Total Approved Modifications Hotel $202.1 $20.8 10.3% Retail1 194.1 13.5 6.9% Restaurants 136.3 6.3 4.6% Real Estate & Rental & Leasing 112.6 7.1 6.3% Health Care & Social Assistance 62.5 3.6 5.8% 1-4 Family Residential 49.2 2.7 5.6% Transportation & Warehousing 36.2 2.9 8.0% Other 175.0 11.6 6.6% Total $968.1 $68.5 7.1% Note: (1) Retail includes subcategories of non-owner occupied, owner occupied and C&I / construction & land |
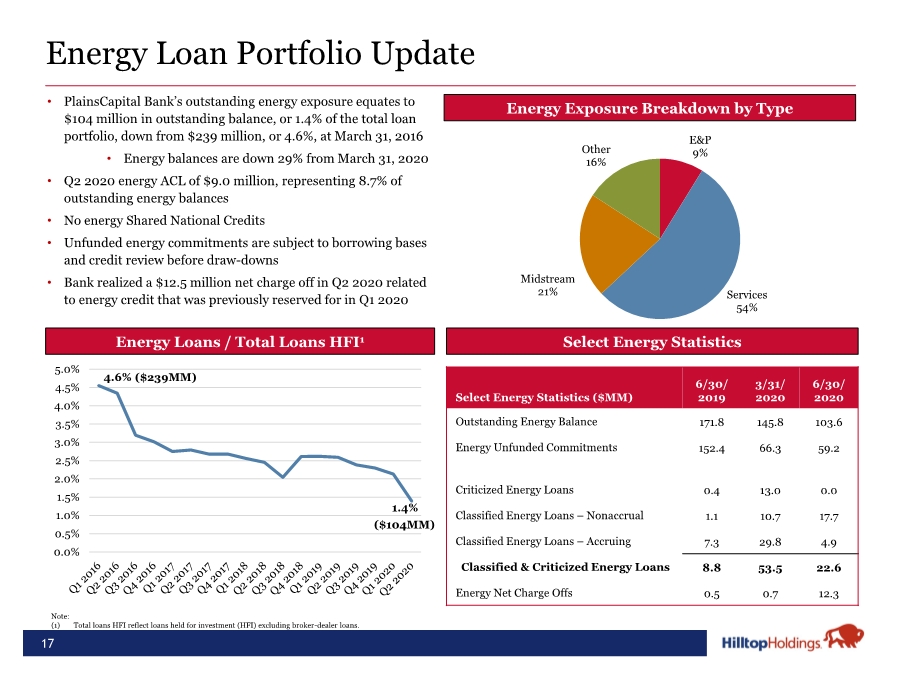
| 4.6% 1.4% 0.0% 0.5% 1.0% 1.5% 2.0% 2.5% 3.0% 3.5% 4.0% 4.5% 5.0% Energy Loan Portfolio Update 17 • PlainsCapital Bank’s outstanding energy exposure equates to $104 million in outstanding balance, or 1.4% of the total loan portfolio, down from $239 million, or 4.6%, at March 31, 2016 • Energy balances are down 29% from March 31, 2020 • Q2 2020 energy ACL of $9.0 million, representing 8.7% of outstanding energy balances • No energy Shared National Credits • Unfunded energy commitments are subject to borrowing bases and credit review before draw-downs • Bank realized a $12.5 million net charge off in Q2 2020 related to energy credit that was previously reserved for in Q1 2020 Energy Exposure Breakdown by Type Select Energy Statistics Select Energy Statistics ($MM) 6/30/ 2019 3/31/ 2020 6/30/ 2020 Outstanding Energy Balance 171.8 145.8 103.6 Energy Unfunded Commitments 152.4 66.3 59.2 Criticized Energy Loans 0.4 13.0 0.0 Classified Energy Loans – Nonaccrual 1.1 10.7 17.7 Classified Energy Loans – Accruing 7.3 29.8 4.9 Classified & Criticized Energy Loans 8.8 53.5 22.6 Energy Net Charge Offs 0.5 0.7 12.3 Energy Loans / Total Loans HFI1 Note: (1) Total loans HFI reflect loans held for investment (HFI) excluding broker-dealer loans. ($239MM) ($104MM) E&P 9% Services 54% Midstream 21% Other 16% |
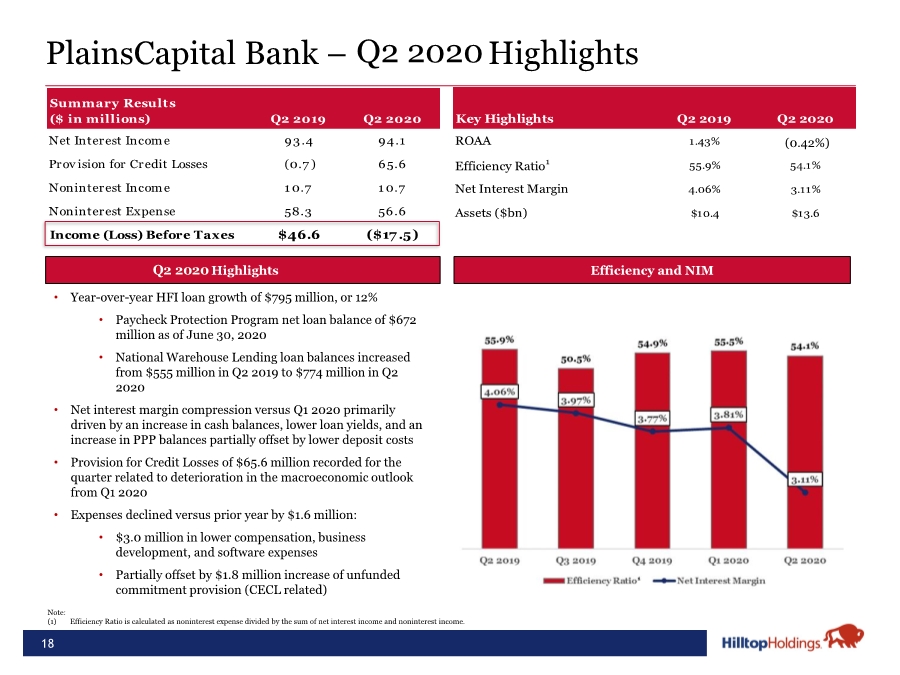
| Summary Results ($ in millions) Q2 2019 Q2 2020 Net Interest Income 93.4 94.1 Prov ision for Credit Losses (0.7 ) 65.6 Noninterest Income 1 0.7 1 0.7 Noninterest Expense 58.3 56.6 Income (Loss) Before Taxes $46.6 ($17 .5) 18 PlainsCapital Bank – Highlights Efficiency and NIM Q2 2020 Highlights Q1 2019 Note: (1) Efficiency Ratio is calculated as noninterest expense divided by the sum of net interest income and noninterest income. • Year-over-year HFI loan growth of $795 million, or 12% • Paycheck Protection Program net loan balance of $672 million as of June 30, 2020 • National Warehouse Lending loan balances increased from $555 million in Q2 2019 to $774 million in Q2 2020 • Net interest margin compression versus Q1 2020 primarily driven by an increase in cash balances, lower loan yields, and an increase in PPP balances partially offset by lower deposit costs • Provision for Credit Losses of $65.6 million recorded for the quarter related to deterioration in the macroeconomic outlook from Q1 2020 • Expenses declined versus prior year by $1.6 million: • $3.0 million in lower compensation, business development, and software expenses • Partially offset by $1.8 million increase of unfunded commitment provision (CECL related) Q 2 2 0 2 0 Q2 2020 Key Highlights Q2 2019 Q2 2020 ROAA 1.43% -0.42% Efficiency Ratio1 55.9% 54.1% Net Interest Margin 4.06% 3.11% Assets ($bn) $10.4 $13.6 (0.42%) |
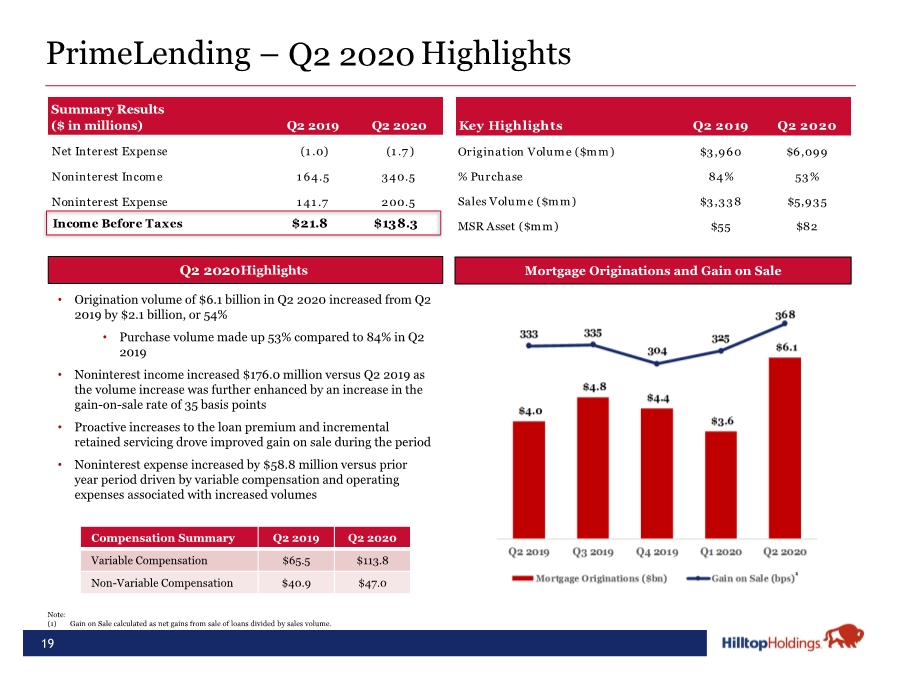
| Net Interest Expense (1 .0) (1 .7 ) Noninterest Income 1 64.5 340.5 Noninterest Expense 1 41 .7 200.5 Income Before Taxes $21.8 $138.3 Key Highlights Q2 2019 Q2 2020 Origination Volume ($mm) $3,960 $6,099 % Purchase 84% 53% Sales Volume ($mm) $3,338 $5,935 MSR Asset ($mm) $55 $82 19 PrimeLending – Highlights Mortgage Originations and Gain on Sale Q2 2020 Highlights • Origination volume of $6.1 billion in Q2 2020 increased from Q2 2019 by $2.1 billion, or 54% • Purchase volume made up 53% compared to 84% in Q2 2019 • Noninterest income increased $176.0 million versus Q2 2019 as the volume increase was further enhanced by an increase in the gain-on-sale rate of 35 basis points • Proactive increases to the loan premium and incremental retained servicing drove improved gain on sale during the period • Noninterest expense increased by $58.8 million versus prior year period driven by variable compensation and operating expenses associated with increased volumes Note: (1) Gain on Sale calculated as net gains from sale of loans divided by sales volume. Q 2 2 0 2 0 Q2 2020 Summary Results ($ in millions) Q2 2019 Q2 2020 Compensation Summary Q2 2019 Q2 2020 Variable Compensation $65.5 $113.8 Non-Variable Compensation $40.9 $47.0 |
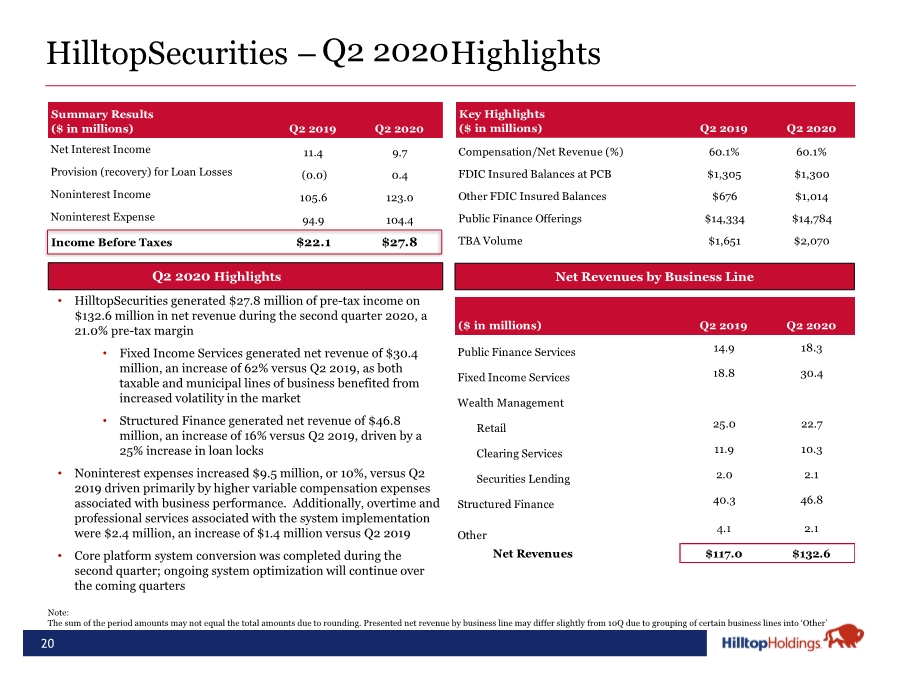
| Summary Results ($ in millions) Q2 2019 Q2 2020 Net Interest Income 11.4 9.7 Provision (recovery) for Loan Losses (0.0) 0.4 Noninterest Income 105.6 123.0 Noninterest Expense 94.9 104.4 Income Before Taxes $22.1 $27.8 Key Highlights ($ in millions) Q2 2019 Q2 2020 Compensation/Net Revenue (%) 60.1% 60.1% FDIC Insured Balances at PCB $1,305 $1,300 Other FDIC Insured Balances $676 $1,014 Public Finance Offerings $14,334 $14,784 TBA Volume $1,651 $2,070 20 HilltopSecurities – Highlights • HilltopSecurities generated $27.8 million of pre-tax income on $132.6 million in net revenue during the second quarter 2020, a 21.0% pre-tax margin • Fixed Income Services generated net revenue of $30.4 million, an increase of 62% versus Q2 2019, as both taxable and municipal lines of business benefited from increased volatility in the market • Structured Finance generated net revenue of $46.8 million, an increase of 16% versus Q2 2019, driven by a 25% increase in loan locks • Noninterest expenses increased $9.5 million, or 10%, versus Q2 2019 driven primarily by higher variable compensation expenses associated with business performance. Additionally, overtime and professional services associated with the system implementation were $2.4 million, an increase of $1.4 million versus Q2 2019 • Core platform system conversion was completed during the second quarter; ongoing system optimization will continue over the coming quarters Note: The sum of the period amounts may not equal the total amounts due to rounding. Presented net revenue by business line may differ slightly from 10Q due to grouping of certain business lines into ‘Other’ Q2 2020 Highlights Q1 2019 Net Revenues by Business Line Q 2 2 0 2 0 Q2 2020 ($ in millions) Q2 2019 Q2 2020 Public Finance Services 14.9 18.3 Fixed Income Services 18.8 30.4 Wealth Management Retail 25.0 22.7 Clearing Services 11.9 10.3 Securities Lending 2.0 2.1 Structured Finance 40.3 46.8 Other 4.1 2.1 Net Revenues $117.0 $132.6 |
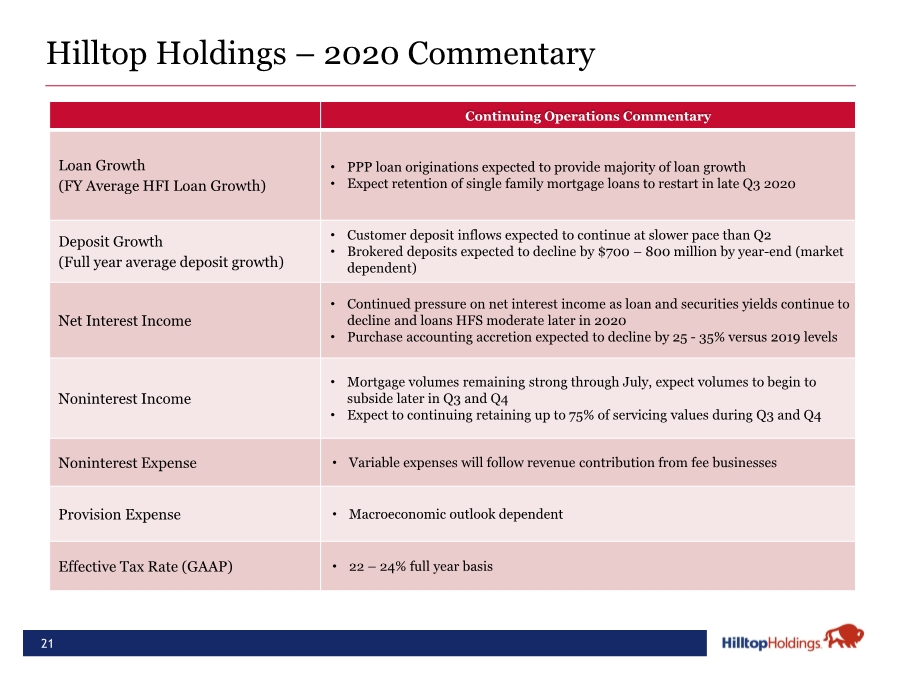
| 21 Hilltop Holdings – 2020 Commentary Continuing Operations Commentary Loan Growth (FY Average HFI Loan Growth) • PPP loan originations expected to provide majority of loan growth • Expect retention of single family mortgage loans to restart in late Q3 2020 Deposit Growth (Full year average deposit growth) • Customer deposit inflows expected to continue at slower pace than Q2 • Brokered deposits expected to decline by $700 – 800 million by year-end (market dependent) Net Interest Income • Continued pressure on net interest income as loan and securities yields continue to decline and loans HFS moderate later in 2020 • Purchase accounting accretion expected to decline by 25 - 35% versus 2019 levels Noninterest Income • Mortgage volumes remaining strong through July, expect volumes to begin to subside later in Q3 and Q4 • Expect to continuing retaining up to 75% of servicing values during Q3 and Q4 Noninterest Expense • Variable expenses will follow revenue contribution from fee businesses Provision Expense • Macroeconomic outlook dependent Effective Tax Rate (GAAP) • 22 – 24% full year basis |
| Appendix 22 |

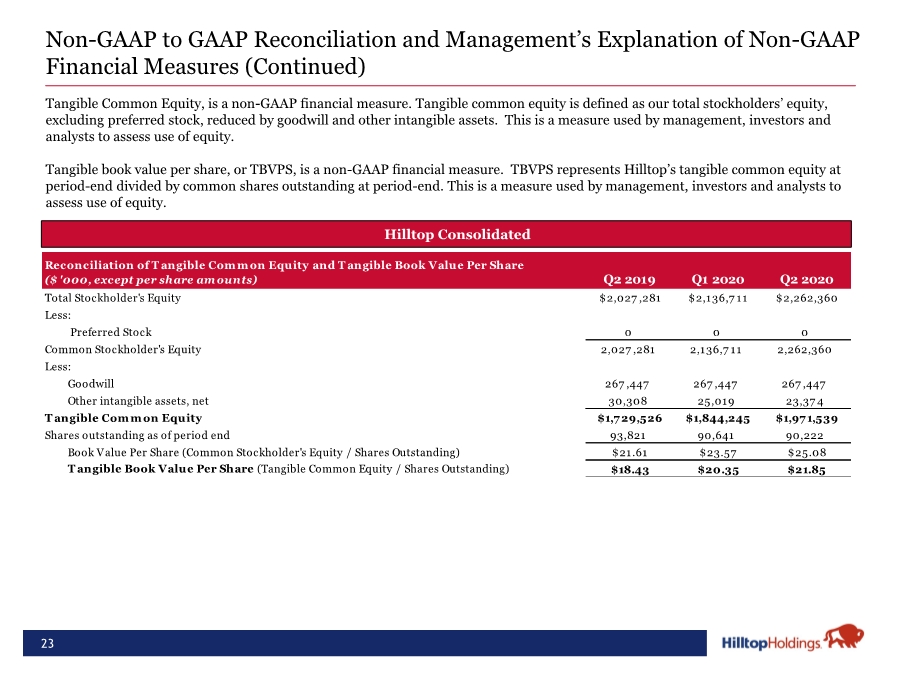
| 23 Non-GAAP to GAAP Reconciliation and Management’s Explanation of Non-GAAP Financial Measures (Continued) • Hilltop Consolidated Tangible Common Equity, is a non-GAAP financial measure. Tangible common equity is defined as our total stockholders’ equity, excluding preferred stock, reduced by goodwill and other intangible assets. This is a measure used by management, investors and analysts to assess use of equity. Tangible book value per share, or TBVPS, is a non-GAAP financial measure. TBVPS represents Hilltop’s tangible common equity at period-end divided by common shares outstanding at period-end. This is a measure used by management, investors and analysts to assess use of equity. Reconciliation of T angible Com m on Equity and T angible Book Value Per Share ($ '000, except per share amounts) Q2 2019 Q1 2020 Q2 2020 Total Stockholder's Equity $2,027 ,281 $2,136,7 11 $2,262,360 Less: Preferred Stock 0 0 0 Common Stockholder's Equity 2,027 ,281 2,136,7 11 2,262,360 Less: Goodwill 267 ,447 267 ,447 267 ,447 Other intangible assets, net 30,308 25,019 23,37 4 Tangible Common Equity $1,7 29,526 $1,844,245 $1,97 1,539 Shares outstanding as of period end 93,821 90,641 90,222 Book Value Per Share (Common Stockholder's Equity / Shares Outstanding) $21.61 $23.57 $25.08 Tangible Book Value Per Share (Tangible Common Equity / Shares Outstanding) $18.43 $20.35 $21.85 |