Attached files
| file | filename |
|---|---|
| EX-99.1 - EX-99.1 - Apollo Commercial Real Estate Finance, Inc. | d918701dex991.htm |
| 8-K - 8-K - Apollo Commercial Real Estate Finance, Inc. | d918701d8k.htm |
Q2 2020 Financial Results July 30, 2020 Exhibit 99.2
Forward Looking Statements and Other Disclosures This presentation may contain forward-looking statements that are within the meaning of Section 27A of the Securities Act of 1933, as amended, and Section 21E of the Securities Exchange Act of 1934, as amended, and such statements are intended to be covered by the safe harbor provided by the same. Forward-looking statements are subject to substantial risks and uncertainties, many of which are difficult to predict and are generally beyond management’s control. These forward-looking statements may include information about possible or assumed future results of Apollo Commercial Real Estate Finance, Inc.’s (the “Company,” “ARI,” “we,” “us” and “our”) business, financial condition, liquidity, results of operations, plans and objectives. When used in this presentation, the words “believe,” “expect,” “anticipate,” “estimate,” “plan,” “continue,” “intend,” “should,” “may” or similar expressions, are intended to identify forward-looking statements. Statements regarding the following subjects, among others, may be forward-looking: the macro- and micro-economic impact of the COVID-19 pandemic; the severity and duration of the COVID-19 pandemic; actions taken by governmental authorities to contain the COVID-19 pandemic or treat its impact; the impact of the COVID-19 pandemic on our financial condition, results operations, liquidity and capital resources; ARI’s business and investment strategy; ARI’s operating results; ARI’s ability to obtain and maintain financing arrangements; the timing and amounts of expected future fundings of unfunded commitments; and the return on equity, the yield on investments and risks associated with investing in real estate assets including changes in business conditions and the general economy. The forward-looking statements are based on management’s beliefs, assumptions and expectations of future performance, taking into account all information currently available to ARI. Forward-looking statements are not predictions of future events. These beliefs, assumptions and expectations can change as a result of many possible events or factors, not all of which are known to ARI. Some of these factors are described under “Risk Factors,” and “Management’s Discussion and Analysis of Financial Condition and Results of Operations” included in ARI’s Annual Report on Form 10-K for the fiscal year ended December 31, 2019, Quarterly Reports on Form 10-Q for the quarterly periods ended March 31, 2020 and June 30, 2020 and other filings with the Securities and Exchange Commission (“SEC”), which are accessible on the SEC’s website at www.sec.gov. If a change occurs, ARI’s business, financial condition, liquidity and results of operations may vary materially from those expressed in ARI’s forward-looking statements. Any forward-looking statement speaks only as of the date on which it is made. New risks and uncertainties arise over time, and it is not possible for management to predict those events or how they may affect ARI. Except as required by law, ARI is not obligated to, and does not intend to, update or revise any forward-looking statements, whether as a result of new information, future events or otherwise. This presentation contains information regarding ARI’s financial results that is calculated and presented on the basis of methodologies other than in accordance with accounting principles generally accepted in the United States (“GAAP”), including Operating Earnings and Operating Earnings per share. Please refer to page 18 for a definition of “Operating Earnings” and the reconciliation of the applicable GAAP financial measures to non-GAAP financial measures set forth on page 17. This presentation may contain statistics and other data that in some cases has been obtained from or compiled from information made available by third-party service providers. ARI makes no representation or warranty, expressed or implied, with respect to the accuracy, reasonableness or completeness of such information. Past performance is not indicative nor a guarantee of future returns. Index performance and yield data are shown for illustrative purposes only and have limitations when used for comparison or for other purposes due to, among other matters, volatility, credit or other factors (such as number and types of securities). Indices are unmanaged, do not charge any fees or expenses, assume reinvestment of income and do not employ special investment techniques such as leveraging or short selling. No such index is indicative of the future results of any investment by ARI. Unless the context requires otherwise, references in this presentation to “Apollo” refer to Apollo Global Management, Inc., together with its subsidiaries, and references in this presentation to the “Manager” refer to ACREFI Management, LLC, an indirect subsidiary of Apollo Global Management, Inc.
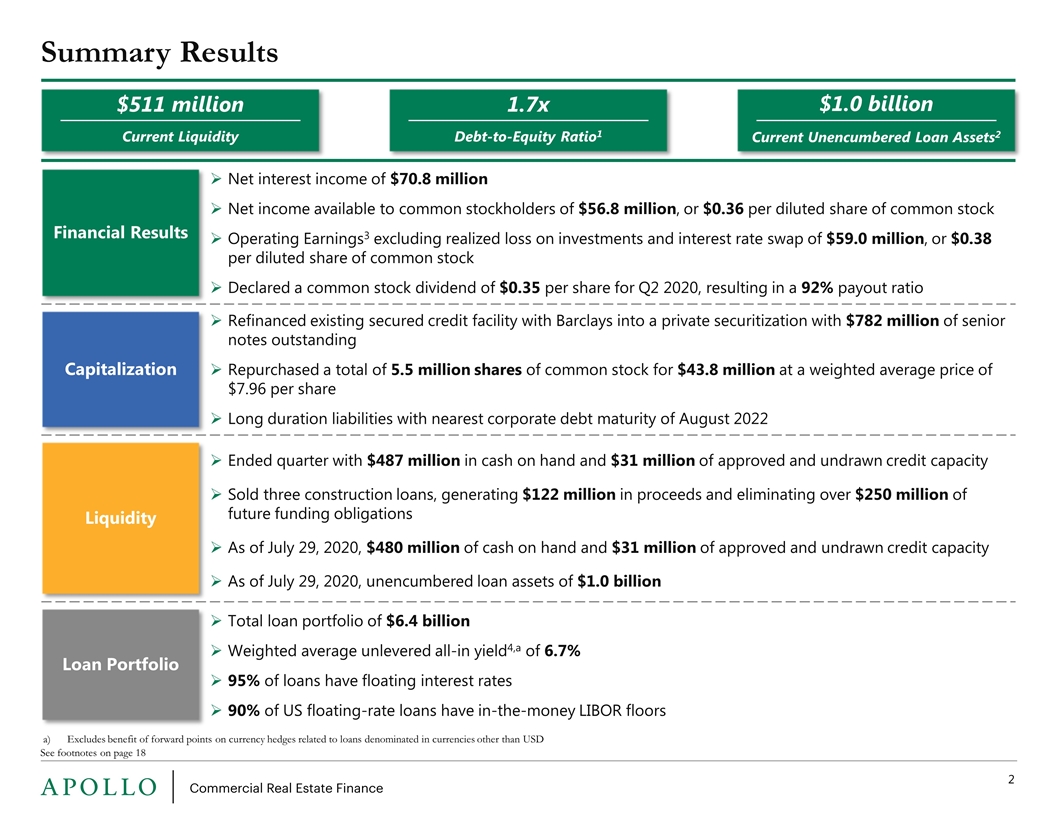
Liquidity Summary Results See footnotes on page 18 Excludes benefit of forward points on currency hedges related to loans denominated in currencies other than USD $511 million Current Liquidity Financial Results Capitalization Loan Portfolio 1.7x Debt-to-Equity Ratio1 $1.0 billion Current Unencumbered Loan Assets2 Net interest income of $70.8 million Net income available to common stockholders of $56.8 million, or $0.36 per diluted share of common stock Operating Earnings3 excluding realized loss on investments and interest rate swap of $59.0 million, or $0.38 per diluted share of common stock Declared a common stock dividend of $0.35 per share for Q2 2020, resulting in a 92% payout ratio Refinanced existing secured credit facility with Barclays into a private securitization with $782 million of senior notes outstanding Repurchased a total of 5.5 million shares of common stock for $43.8 million at a weighted average price of $7.96 per share Long duration liabilities with nearest corporate debt maturity of August 2022 Total loan portfolio of $6.4 billion Weighted average unlevered all-in yield4,a of 6.7% 95% of loans have floating interest rates 90% of US floating-rate loans have in-the-money LIBOR floors Ended quarter with $487 million in cash on hand and $31 million of approved and undrawn credit capacity Sold three construction loans, generating $122 million in proceeds and eliminating over $250 million of future funding obligations As of July 29, 2020, $480 million of cash on hand and $31 million of approved and undrawn credit capacity As of July 29, 2020, unencumbered loan assets of $1.0 billion
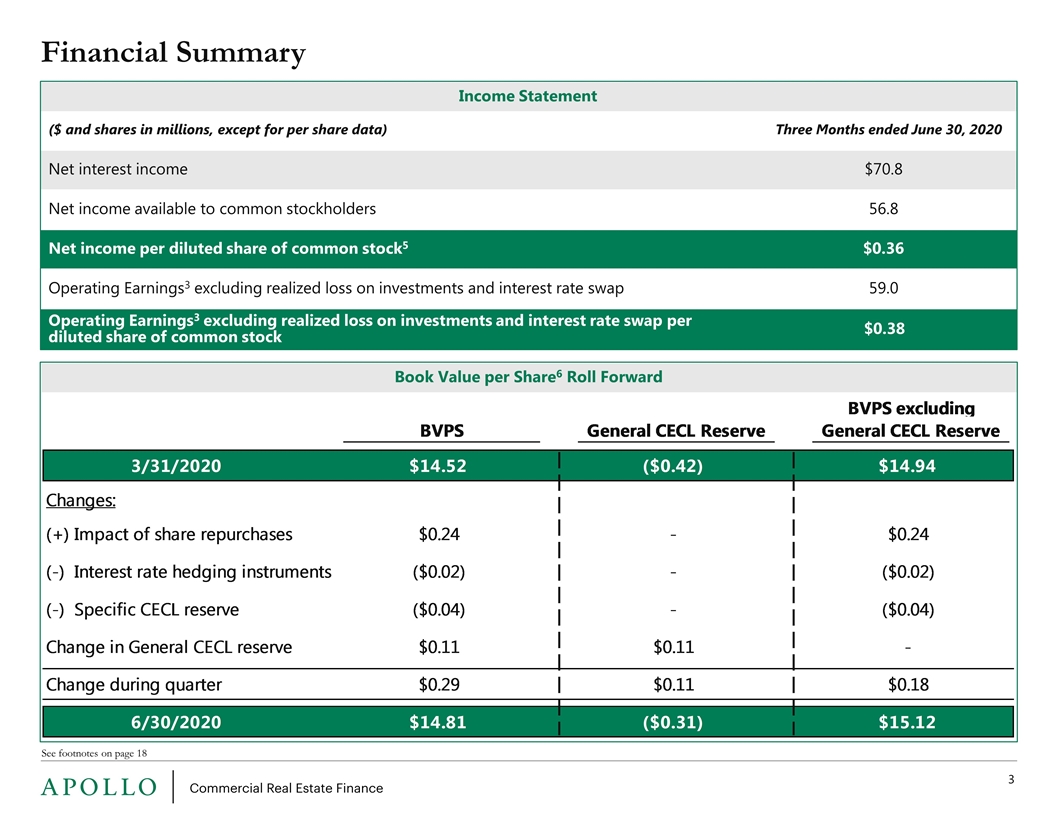
Income Statement ($ and shares in millions, except for per share data) Net interest income Net income available to common stockholders Net income per diluted share of common stock5 Operating Earnings3 excluding realized loss on investments and interest rate swap Operating Earnings3 excluding realized loss on investments and interest rate swap per diluted share of common stock Financial Summary See footnotes on page 18 Book Value per Share6 Roll Forward Three Months ended June 30, 2020 $70.8 56.8 $0.36 59.0 $0.38
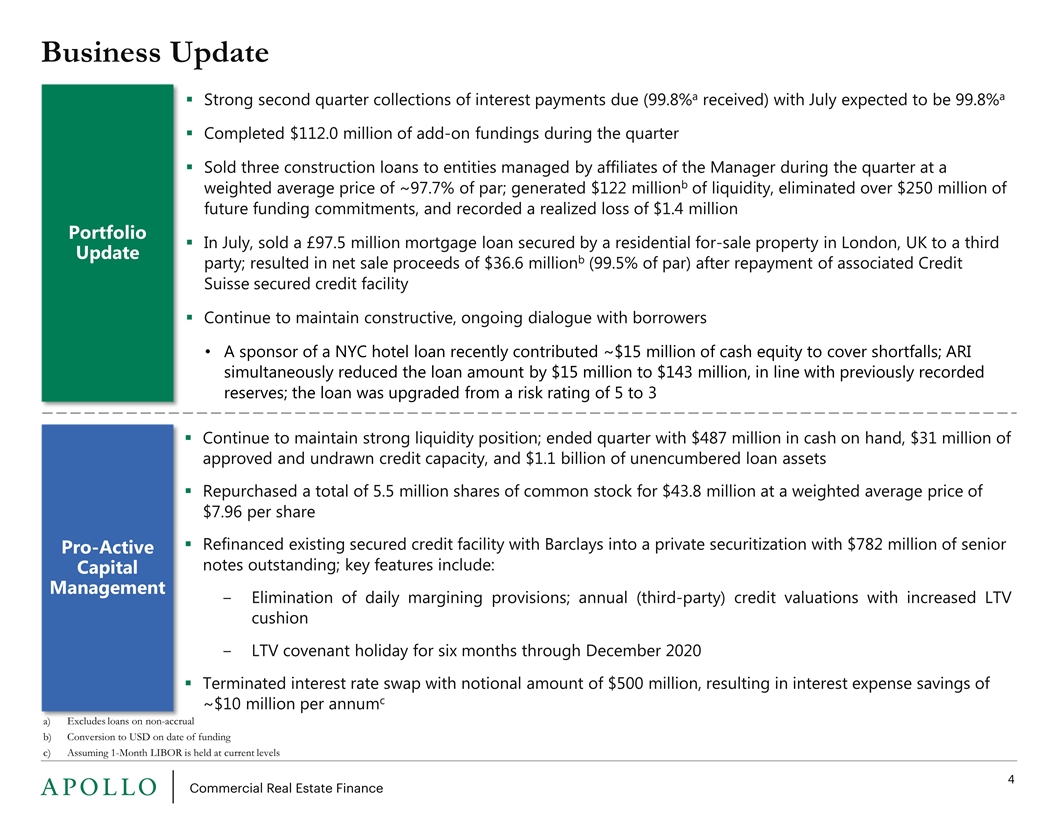
Excludes loans on non-accrual Conversion to USD on date of funding Assuming 1-Month LIBOR is held at current levels Business Update Portfolio Update Strong second quarter collections of interest payments due (99.8%a received) with July expected to be 99.8%a Completed $112.0 million of add-on fundings during the quarter Sold three construction loans to entities managed by affiliates of the Manager during the quarter at a weighted average price of ~97.7% of par; generated $122 millionb of liquidity, eliminated over $250 million of future funding commitments, and recorded a realized loss of $1.4 million In July, sold a £97.5 million mortgage loan secured by a residential for-sale property in London, UK to a third party; resulted in net sale proceeds of $36.6 millionb (99.5% of par) after repayment of associated Credit Suisse secured credit facility Continue to maintain constructive, ongoing dialogue with borrowers A sponsor of a NYC hotel loan recently contributed ~$15 million of cash equity to cover shortfalls; ARI simultaneously reduced the loan amount by $15 million to $143 million, in line with previously recorded reserves; the loan was upgraded from a risk rating of 5 to 3 Pro-Active Capital Management Continue to maintain strong liquidity position; ended quarter with $487 million in cash on hand, $31 million of approved and undrawn credit capacity, and $1.1 billion of unencumbered loan assets Repurchased a total of 5.5 million shares of common stock for $43.8 million at a weighted average price of $7.96 per share Refinanced existing secured credit facility with Barclays into a private securitization with $782 million of senior notes outstanding; key features include: Elimination of daily margining provisions; annual (third-party) credit valuations with increased LTV cushion LTV covenant holiday for six months through December 2020 Terminated interest rate swap with notional amount of $500 million, resulting in interest expense savings of ~$10 million per annumc
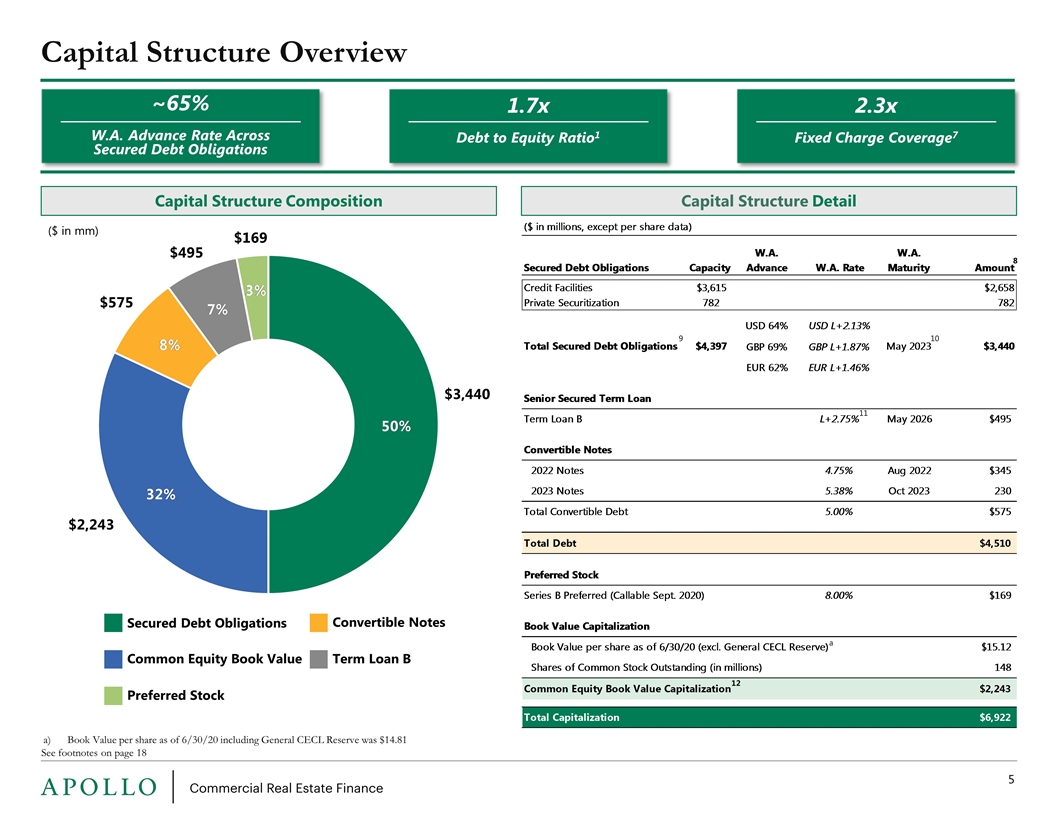
Capital Structure Overview See footnotes on page 18 Capital Structure Detail Capital Structure Composition ($ in mm) $2,243 $3,440 $495 $575 $169 10 11 9 12 ~65% W.A. Advance Rate Across Secured Debt Obligations 1.7x Debt to Equity Ratio1 2.3x Fixed Charge Coverage7 Secured Debt Obligations Common Equity Book Value Convertible Notes Term Loan B Preferred Stock Book Value per share as of 6/30/20 including General CECL Reserve was $14.81 8 a
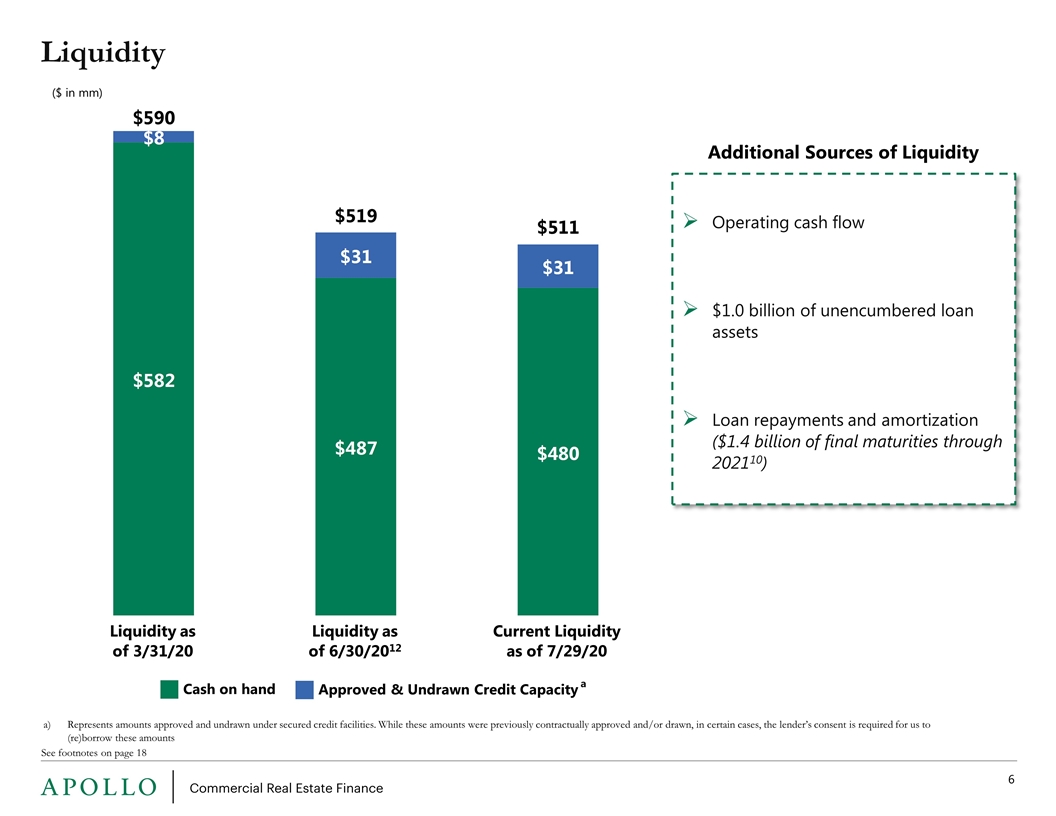
See footnotes on page 18 Liquidity ($ in mm) Cash on hand Approved & Undrawn Credit Capacity Represents amounts approved and undrawn under secured credit facilities. While these amounts were previously contractually approved and/or drawn, in certain cases, the lender’s consent is required for us to (re)borrow these amounts a Additional Sources of Liquidity Operating cash flow $1.0 billion of unencumbered loan assets Loan repayments and amortization ($1.4 billion of final maturities through 202110) Liquidity as of 3/31/20 Current Liquidity as of 7/29/20 Liquidity as of 6/30/2012
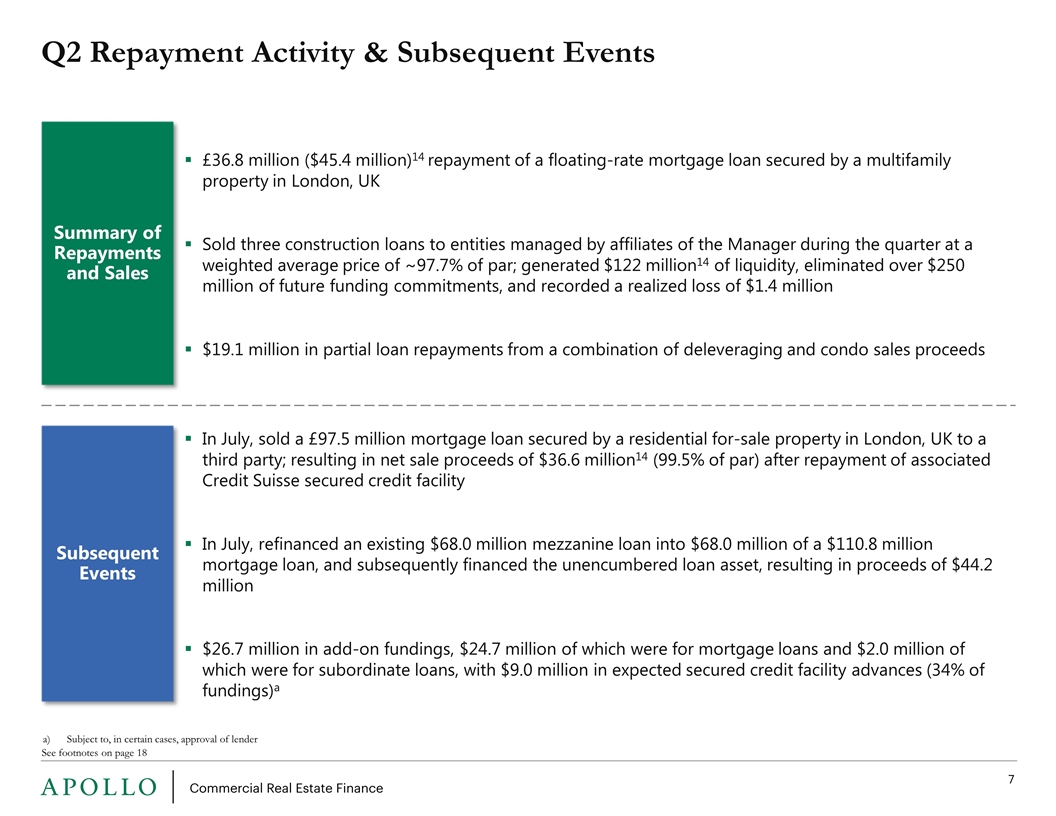
Q2 Repayment Activity & Subsequent Events See footnotes on page 18 Summary of Repayments and Sales Subsequent Events £36.8 million ($45.4 million)14 repayment of a floating-rate mortgage loan secured by a multifamily property in London, UK Sold three construction loans to entities managed by affiliates of the Manager during the quarter at a weighted average price of ~97.7% of par; generated $122 million14 of liquidity, eliminated over $250 million of future funding commitments, and recorded a realized loss of $1.4 million $19.1 million in partial loan repayments from a combination of deleveraging and condo sales proceeds In July, sold a £97.5 million mortgage loan secured by a residential for-sale property in London, UK to a third party; resulting in net sale proceeds of $36.6 million14 (99.5% of par) after repayment of associated Credit Suisse secured credit facility In July, refinanced an existing $68.0 million mezzanine loan into $68.0 million of a $110.8 million mortgage loan, and subsequently financed the unencumbered loan asset, resulting in proceeds of $44.2 million $26.7 million in add-on fundings, $24.7 million of which were for mortgage loans and $2.0 million of which were for subordinate loans, with $9.0 million in expected secured credit facility advances (34% of fundings)a Subject to, in certain cases, approval of lender
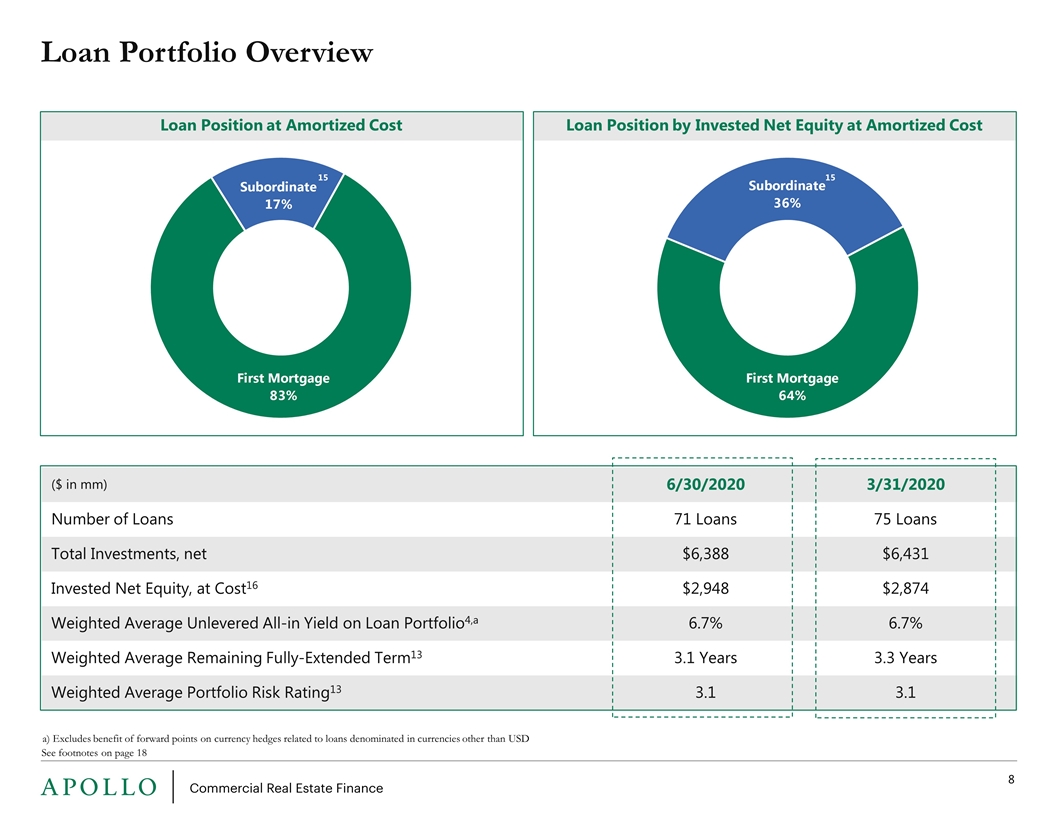
($ in mm) 6/30/2020 3/31/2020 Number of Loans 71 Loans 75 Loans Total Investments, net $6,388 $6,431 Invested Net Equity, at Cost16 $2,948 $2,874 Weighted Average Unlevered All-in Yield on Loan Portfolio4,a 6.7% 6.7% Weighted Average Remaining Fully-Extended Term13 3.1 Years 3.3 Years Weighted Average Portfolio Risk Rating13 3.1 3.1 Loan Position by Invested Net Equity at Amortized Cost Loan Portfolio Overview See footnotes on page 18 Loan Position at Amortized Cost 15 15 a) Excludes benefit of forward points on currency hedges related to loans denominated in currencies other than USD
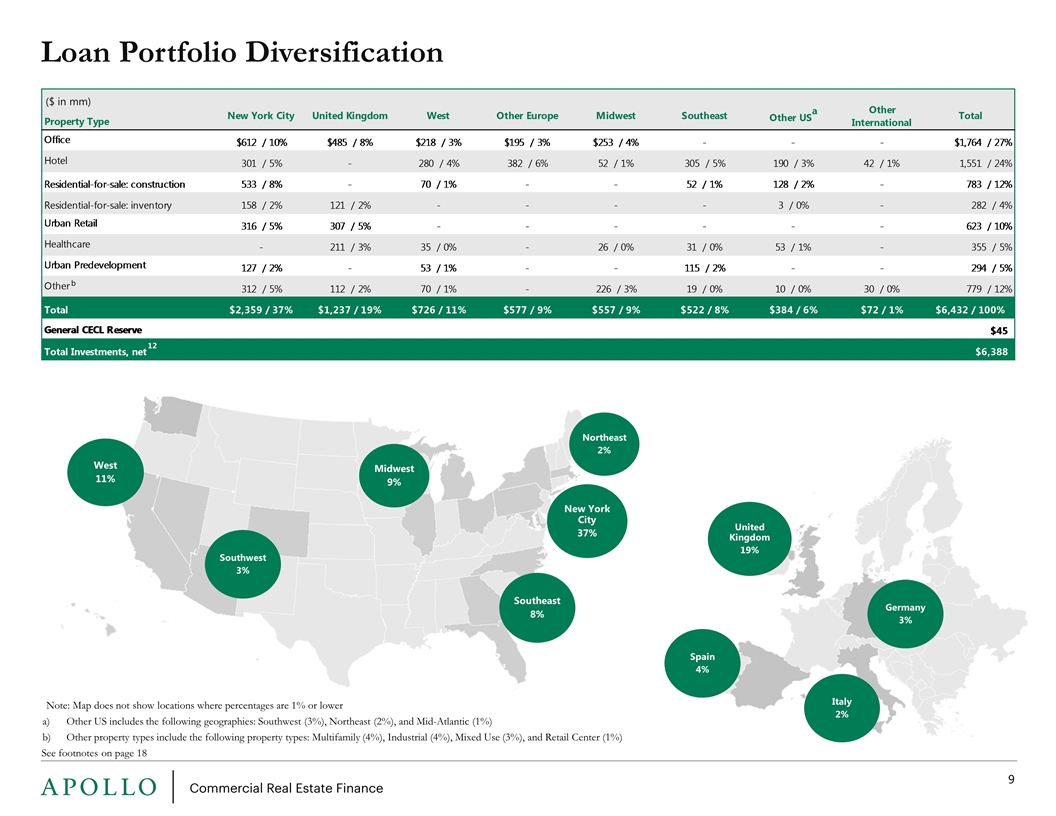
New York City 37% West 11% Midwest 9% Southeast 8% Southwest 3% Northeast 2% Loan Portfolio Diversification See footnotes on page 18 ($ in mm) 12 Other US includes the following geographies: Southwest (3%), Northeast (2%), and Mid-Atlantic (1%) Other property types include the following property types: Multifamily (4%), Industrial (4%), Mixed Use (3%), and Retail Center (1%) Note: Map does not show locations where percentages are 1% or lower Italy 2% United Kingdom 19% Spain 4% Germany 3% b
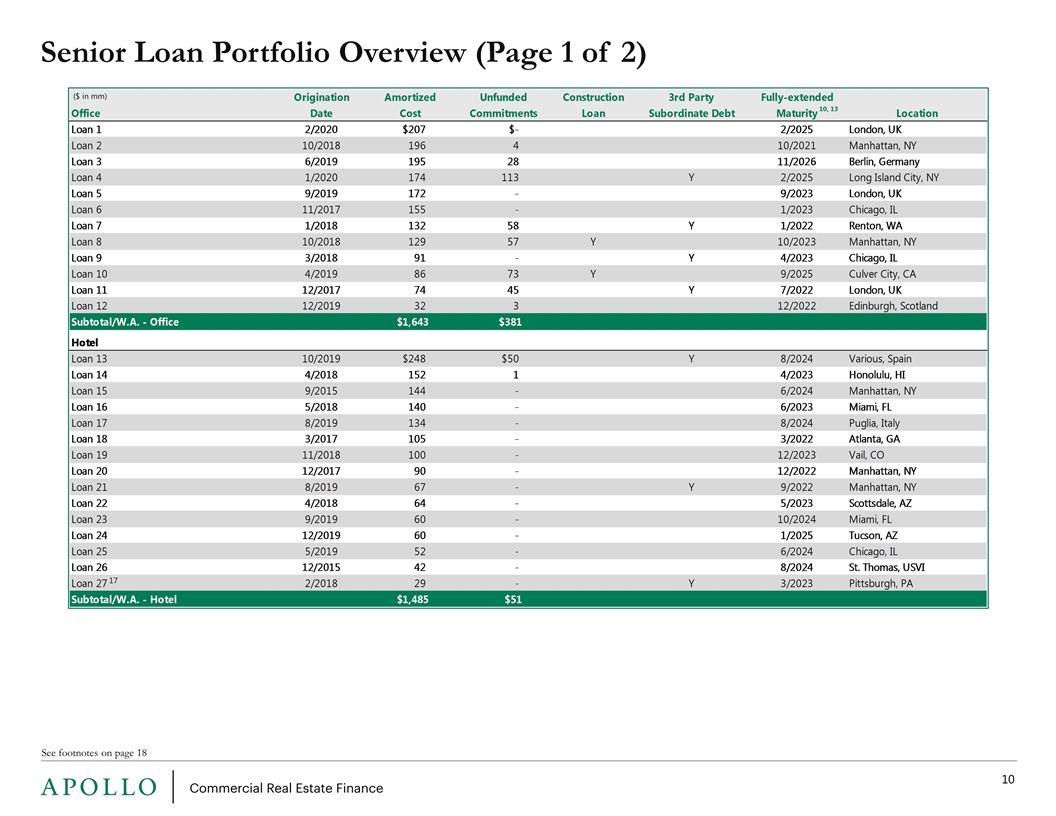
See footnotes on page 18 Senior Loan Portfolio Overview (Page 1 of 2) ($ in mm) 17 10, 13
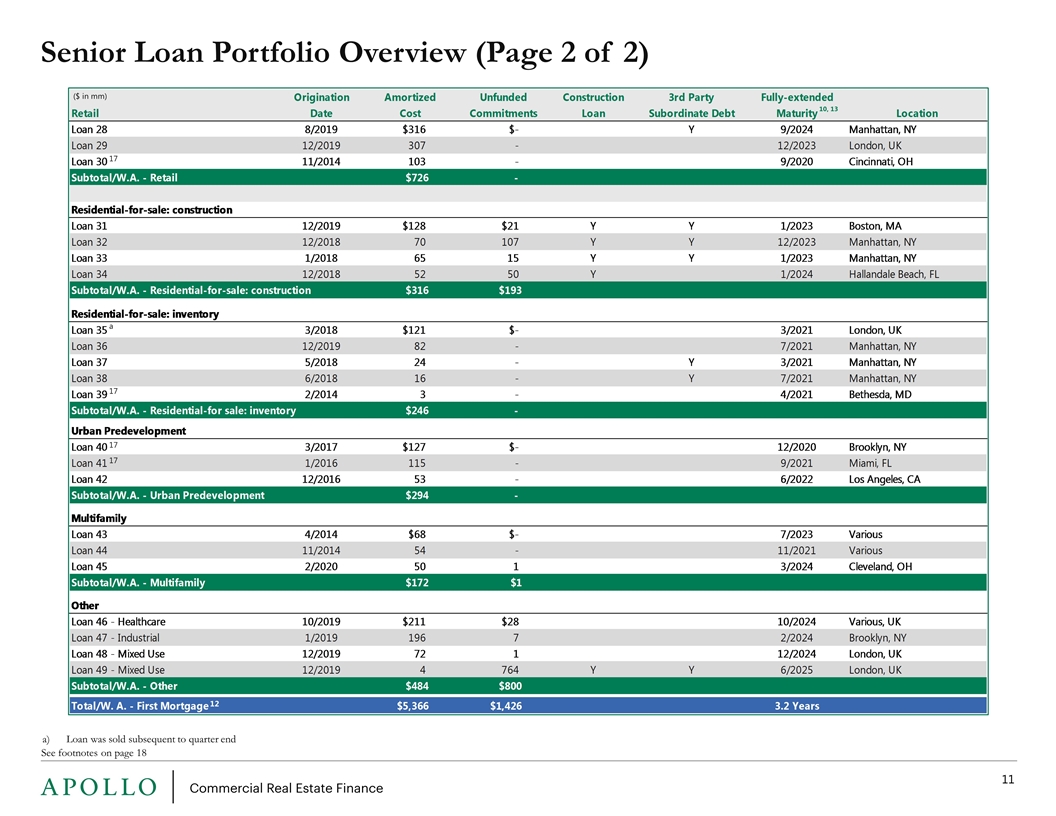
See footnotes on page 18 Senior Loan Portfolio Overview (Page 2 of 2) ($ in mm) 10, 13 17 17 17 12 17 Loan was sold subsequent to quarter end a
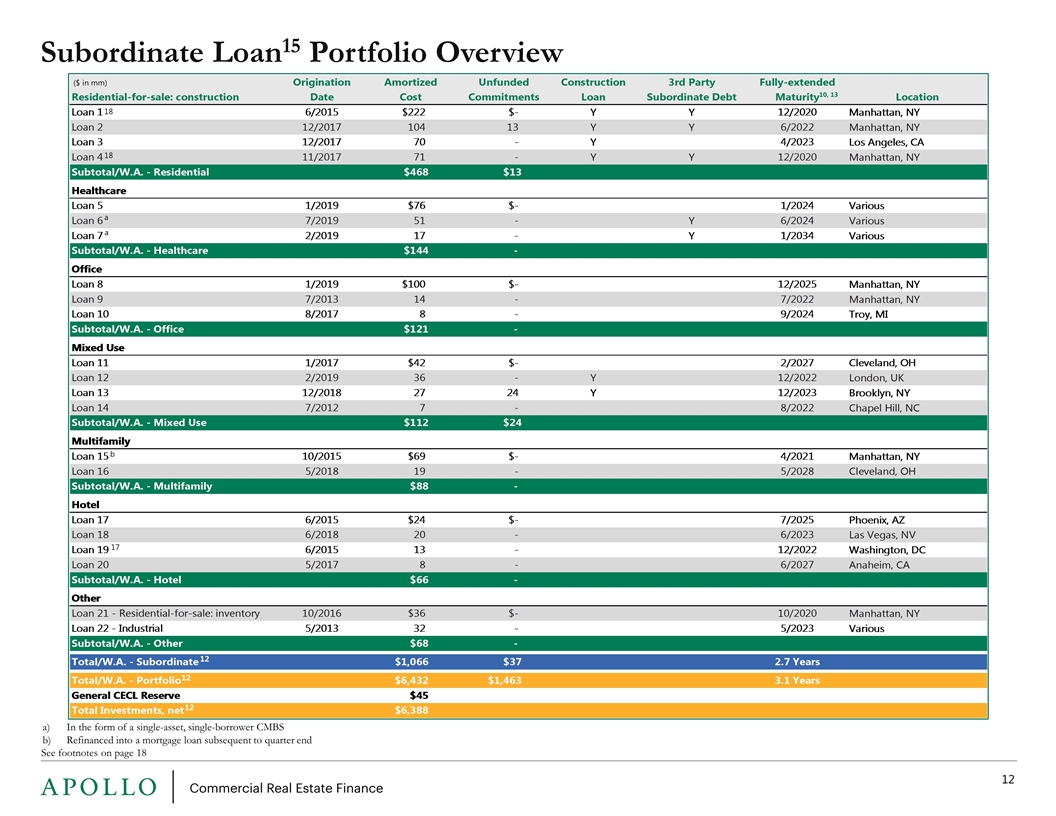
Subordinate Loan15 Portfolio Overview In the form of a single-asset, single-borrower CMBS Refinanced into a mortgage loan subsequent to quarter end ($ in mm) See footnotes on page 18 17 a a 18 18 12 12 10, 13 12 b
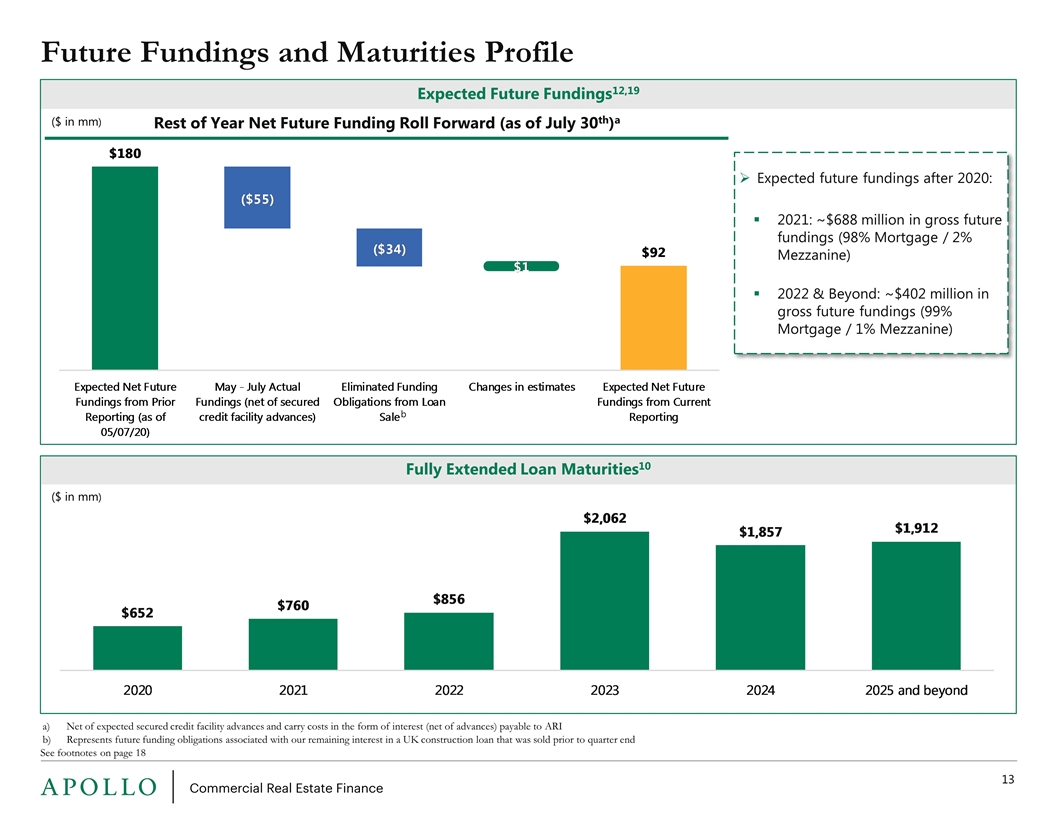
Future Fundings and Maturities Profile See footnotes on page 18 Fully Extended Loan Maturities10 ($ in mm) Expected Future Fundings12,19 Rest of Year Net Future Funding Roll Forward (as of July 30th)a Expected future fundings after 2020: 2021: ~$688 million in gross future fundings (98% Mortgage / 2% Mezzanine) 2022 & Beyond: ~$402 million in gross future fundings (99% Mortgage / 1% Mezzanine) Net of expected secured credit facility advances and carry costs in the form of interest (net of advances) payable to ARI Represents future funding obligations associated with our remaining interest in a UK construction loan that was sold prior to quarter end b ($ in mm)
Appendix
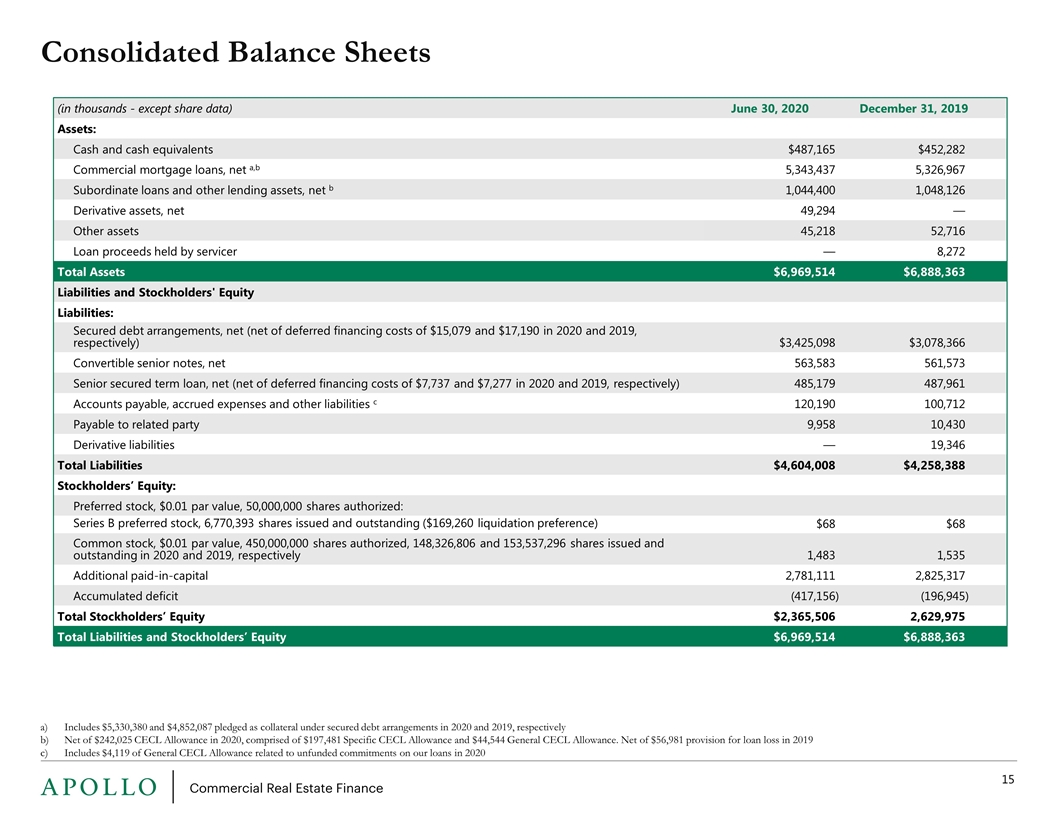
(in thousands - except share data) June 30, 2020 December 31, 2019 f Assets: Cash and cash equivalents $487,165 $452,282 Commercial mortgage loans, net a,b 5,343,437 5,326,967 Subordinate loans and other lending assets, net b 1,044,400 1,048,126 Derivative assets, net 49,294 — Other assets 45,218 52,716 Loan proceeds held by servicer — 8,272 Total Assets $6,969,514 $6,888,363 Liabilities and Stockholders' Equity Liabilities: Secured debt arrangements, net (net of deferred financing costs of $15,079 and $17,190 in 2020 and 2019, respectively) $3,425,098 $3,078,366 Convertible senior notes, net 563,583 561,573 Senior secured term loan, net (net of deferred financing costs of $7,737 and $7,277 in 2020 and 2019, respectively) 485,179 487,961 Accounts payable, accrued expenses and other liabilities c 120,190 100,712 Payable to related party 9,958 10,430 Derivative liabilities — 19,346 Total Liabilities $4,604,008 $4,258,388 Stockholders’ Equity: Preferred stock, $0.01 par value, 50,000,000 shares authorized: Series B preferred stock, 6,770,393 shares issued and outstanding ($169,260 liquidation preference) $68 $68 Common stock, $0.01 par value, 450,000,000 shares authorized, 148,326,806 and 153,537,296 shares issued and outstanding in 2020 and 2019, respectively 1,483 1,535 Additional paid-in-capital 2,781,111 2,825,317 Accumulated deficit (417,156 ) (196,945 ) Total Stockholders’ Equity $2,365,506 2,629,975 Total Liabilities and Stockholders’ Equity $6,969,514 $6,888,363 Consolidated Balance Sheets Includes $5,330,380 and $4,852,087 pledged as collateral under secured debt arrangements in 2020 and 2019, respectively Net of $242,025 CECL Allowance in 2020, comprised of $197,481 Specific CECL Allowance and $44,544 General CECL Allowance. Net of $56,981 provision for loan loss in 2019 Includes $4,119 of General CECL Allowance related to unfunded commitments on our loans in 2020
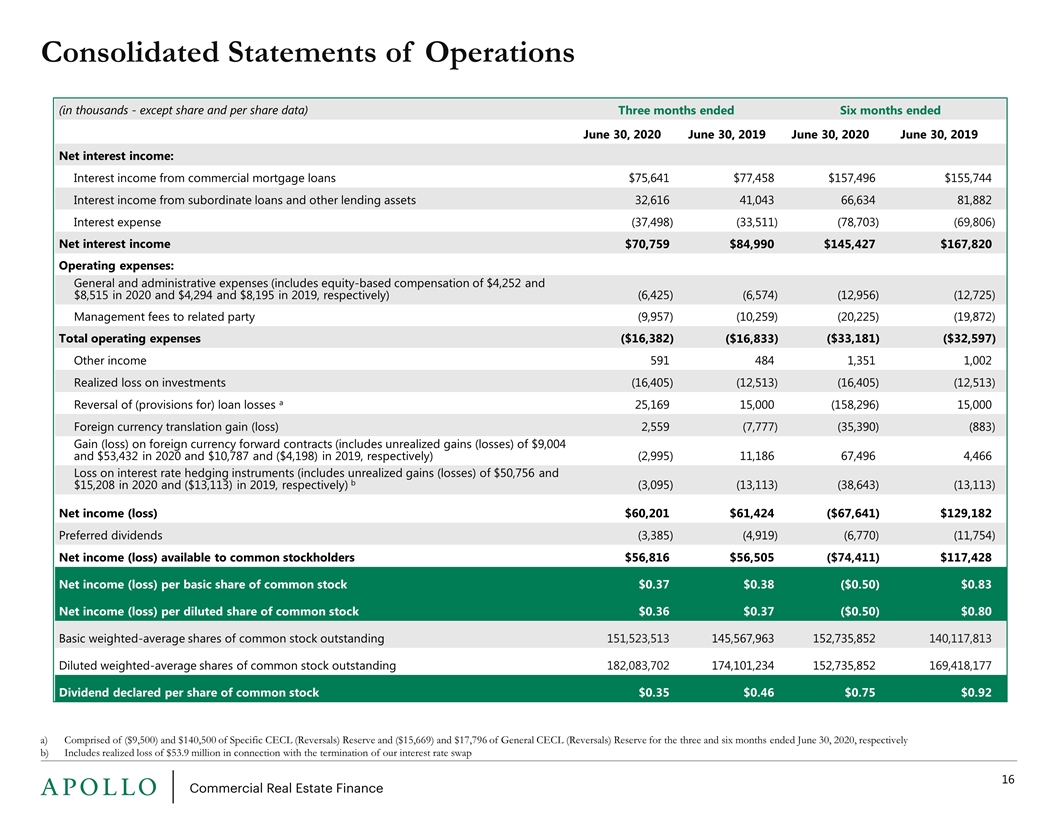
(in thousands - except share and per share data) Three months ended Six months ended June 30, 2020 June 30, 2019 June 30, 2020 June 30, 2019 Net interest income: Interest income from commercial mortgage loans $75,641 $77,458 $157,496 $155,744 Interest income from subordinate loans and other lending assets 32,616 41,043 66,634 81,882 Interest expense (37,498 ) (33,511 ) (78,703 ) (69,806 ) Net interest income $70,759 $84,990 $145,427 $167,820 Operating expenses: General and administrative expenses (includes equity-based compensation of $4,252 and $8,515 in 2020 and $4,294 and $8,195 in 2019, respectively) (6,425 ) (6,574 ) (12,956 ) (12,725 ) Management fees to related party (9,957 ) (10,259 ) (20,225 ) (19,872 ) Total operating expenses ($16,382 ) ($16,833 ) ($33,181 ) ($32,597 ) Other income 591 484 1,351 1,002 Realized loss on investments (16,405 ) (12,513 ) (16,405 ) (12,513 ) Reversal of (provisions for) loan losses a 25,169 15,000 (158,296 ) 15,000 Foreign currency translation gain (loss) 2,559 (7,777 ) (35,390 ) (883 ) Gain (loss) on foreign currency forward contracts (includes unrealized gains (losses) of $9,004 and $53,432 in 2020 and $10,787 and ($4,198) in 2019, respectively) (2,995 ) 11,186 67,496 4,466 Loss on interest rate hedging instruments (includes unrealized gains (losses) of $50,756 and $15,208 in 2020 and ($13,113) in 2019, respectively) b (3,095 ) (13,113 ) (38,643 ) (13,113 ) Net income (loss) $60,201 $61,424 ($67,641 ) $129,182 Preferred dividends (3,385 ) (4,919 ) (6,770 ) (11,754 ) Net income (loss) available to common stockholders $56,816 $56,505 ($74,411 ) $117,428 Net income (loss) per basic share of common stock $0.37 $0.38 ($0.50 ) $0.83 Net income (loss) per diluted share of common stock $0.36 $0.37 ($0.50 ) $0.80 Basic weighted-average shares of common stock outstanding 151,523,513 145,567,963 152,735,852 140,117,813 Diluted weighted-average shares of common stock outstanding 182,083,702 174,101,234 152,735,852 169,418,177 Dividend declared per share of common stock $0.35 $0.46 $0.75 $0.92 Consolidated Statements of Operations Comprised of ($9,500) and $140,500 of Specific CECL (Reversals) Reserve and ($15,669) and $17,796 of General CECL (Reversals) Reserve for the three and six months ended June 30, 2020, respectively Includes realized loss of $53.9 million in connection with the termination of our interest rate swap
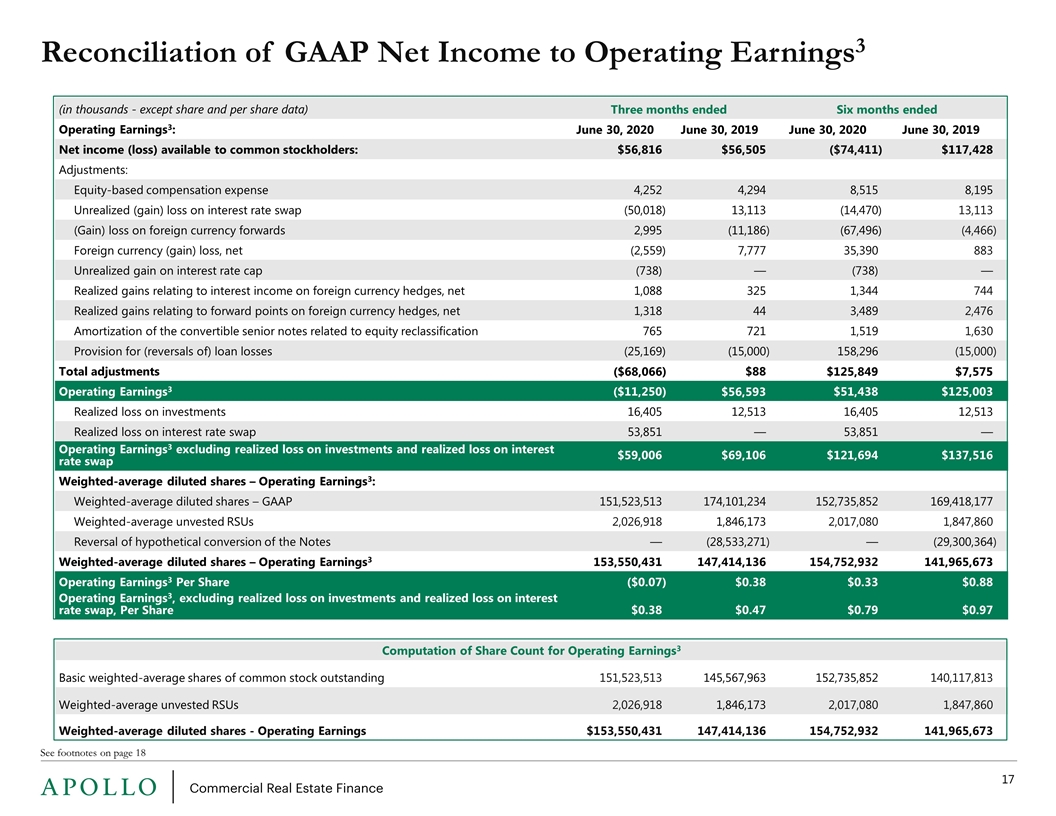
(in thousands - except share and per share data) Three months ended Six months ended Operating Earnings3: June 30, 2020 June 30, 2019 June 30, 2020 June 30, 2019 Net income (loss) available to common stockholders: $56,816 $56,505 ($74,411 ) $117,428 Adjustments: Equity-based compensation expense 4,252 4,294 8,515 8,195 Unrealized (gain) loss on interest rate swap (50,018 ) 13,113 (14,470 ) 13,113 (Gain) loss on foreign currency forwards 2,995 (11,186 ) (67,496 ) (4,466 ) Foreign currency (gain) loss, net (2,559 ) 7,777 35,390 883 Unrealized gain on interest rate cap (738) — (738) — Realized gains relating to interest income on foreign currency hedges, net 1,088 325 1,344 744 Realized gains relating to forward points on foreign currency hedges, net 1,318 44 3,489 2,476 Amortization of the convertible senior notes related to equity reclassification 765 721 1,519 1,630 Provision for (reversals of) loan losses (25,169 ) (15,000 ) 158,296 (15,000 ) Total adjustments ($68,066 ) $88 $125,849 $7,575 Operating Earnings3 ($11,250 ) $56,593 $51,438 $125,003 Realized loss on investments 16,405 12,513 16,405 12,513 Realized loss on interest rate swap 53,851 — 53,851 — Operating Earnings3 excluding realized loss on investments and realized loss on interest rate swap $59,006 $69,106 $121,694 $137,516 Weighted-average diluted shares – Operating Earnings3: Weighted-average diluted shares – GAAP 151,523,513 174,101,234 152,735,852 169,418,177 Weighted-average unvested RSUs 2,026,918 1,846,173 2,017,080 1,847,860 Reversal of hypothetical conversion of the Notes — (28,533,271 ) — (29,300,364 ) Weighted-average diluted shares – Operating Earnings3 153,550,431 147,414,136 154,752,932 141,965,673 Operating Earnings3 Per Share ($0.07 ) $0.38 $0.33 $0.88 Operating Earnings3, excluding realized loss on investments and realized loss on interest rate swap, Per Share $0.38 $0.47 $0.79 $0.97 Computation of Share Count for Operating Earnings3 Basic weighted-average shares of common stock outstanding 151,523,513 145,567,963 152,735,852 140,117,813 Weighted-average unvested RSUs 2,026,918 1,846,173 2,017,080 1,847,860 Weighted-average diluted shares - Operating Earnings $153,550,431 147,414,136 154,752,932 141,965,673 Reconciliation of GAAP Net Income to Operating Earnings3 See footnotes on page 18
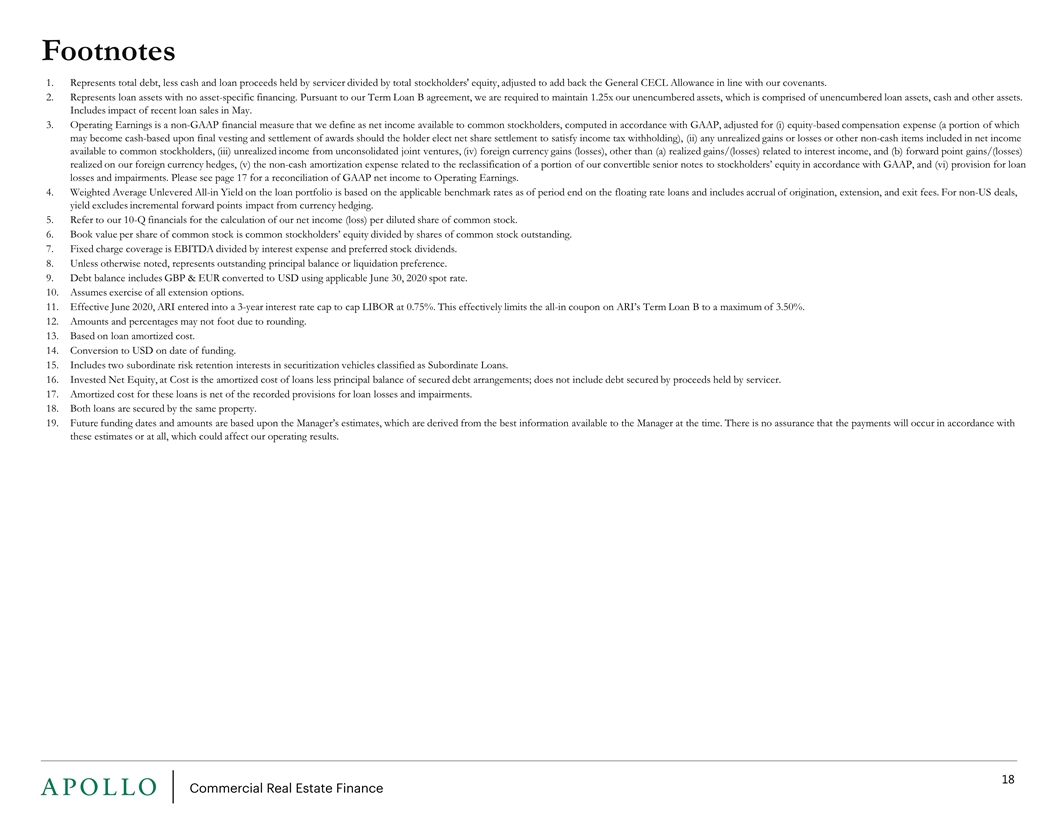
Footnotes Represents total debt, less cash and loan proceeds held by servicer divided by total stockholders' equity, adjusted to add back the General CECL Allowance in line with our covenants. Represents loan assets with no asset-specific financing. Pursuant to our Term Loan B agreement, we are required to maintain 1.25x our unencumbered assets, which is comprised of unencumbered loan assets, cash and other assets. Includes impact of recent loan sales in May. Operating Earnings is a non-GAAP financial measure that we define as net income available to common stockholders, computed in accordance with GAAP, adjusted for (i) equity-based compensation expense (a portion of which may become cash-based upon final vesting and settlement of awards should the holder elect net share settlement to satisfy income tax withholding), (ii) any unrealized gains or losses or other non-cash items included in net income available to common stockholders, (iii) unrealized income from unconsolidated joint ventures, (iv) foreign currency gains (losses), other than (a) realized gains/(losses) related to interest income, and (b) forward point gains/(losses) realized on our foreign currency hedges, (v) the non-cash amortization expense related to the reclassification of a portion of our convertible senior notes to stockholders’ equity in accordance with GAAP, and (vi) provision for loan losses and impairments. Please see page 17 for a reconciliation of GAAP net income to Operating Earnings. Weighted Average Unlevered All-in Yield on the loan portfolio is based on the applicable benchmark rates as of period end on the floating rate loans and includes accrual of origination, extension, and exit fees. For non-US deals, yield excludes incremental forward points impact from currency hedging. Refer to our 10-Q financials for the calculation of our net income (loss) per diluted share of common stock. Book value per share of common stock is common stockholders’ equity divided by shares of common stock outstanding. Fixed charge coverage is EBITDA divided by interest expense and preferred stock dividends. Unless otherwise noted, represents outstanding principal balance or liquidation preference. Debt balance includes GBP & EUR converted to USD using applicable June 30, 2020 spot rate. Assumes exercise of all extension options. Effective June 2020, ARI entered into a 3-year interest rate cap to cap LIBOR at 0.75%. This effectively limits the all-in coupon on ARI’s Term Loan B to a maximum of 3.50%. Amounts and percentages may not foot due to rounding. Based on loan amortized cost. Conversion to USD on date of funding. Includes two subordinate risk retention interests in securitization vehicles classified as Subordinate Loans. Invested Net Equity, at Cost is the amortized cost of loans less principal balance of secured debt arrangements; does not include debt secured by proceeds held by servicer. Amortized cost for these loans is net of the recorded provisions for loan losses and impairments. Both loans are secured by the same property. Future funding dates and amounts are based upon the Manager’s estimates, which are derived from the best information available to the Manager at the time. There is no assurance that the payments will occur in accordance with these estimates or at all, which could affect our operating results.
