Attached files
| file | filename |
|---|---|
| EX-99.2 - PERFICIENT, INC. PRESS RELEASE BOD CHANGE - PERFICIENT INC | prfpressreleasebodchan.htm |
| EX-99.1 - PERFICIENT, INC. PRESS RELEASE - PERFICIENT INC | prfpressreleaseq22020.htm |
| 8-K - 8-K - PERFICIENT INC | prft-20200728.htm |

Q2 2020 Financial Results July 30, 2020

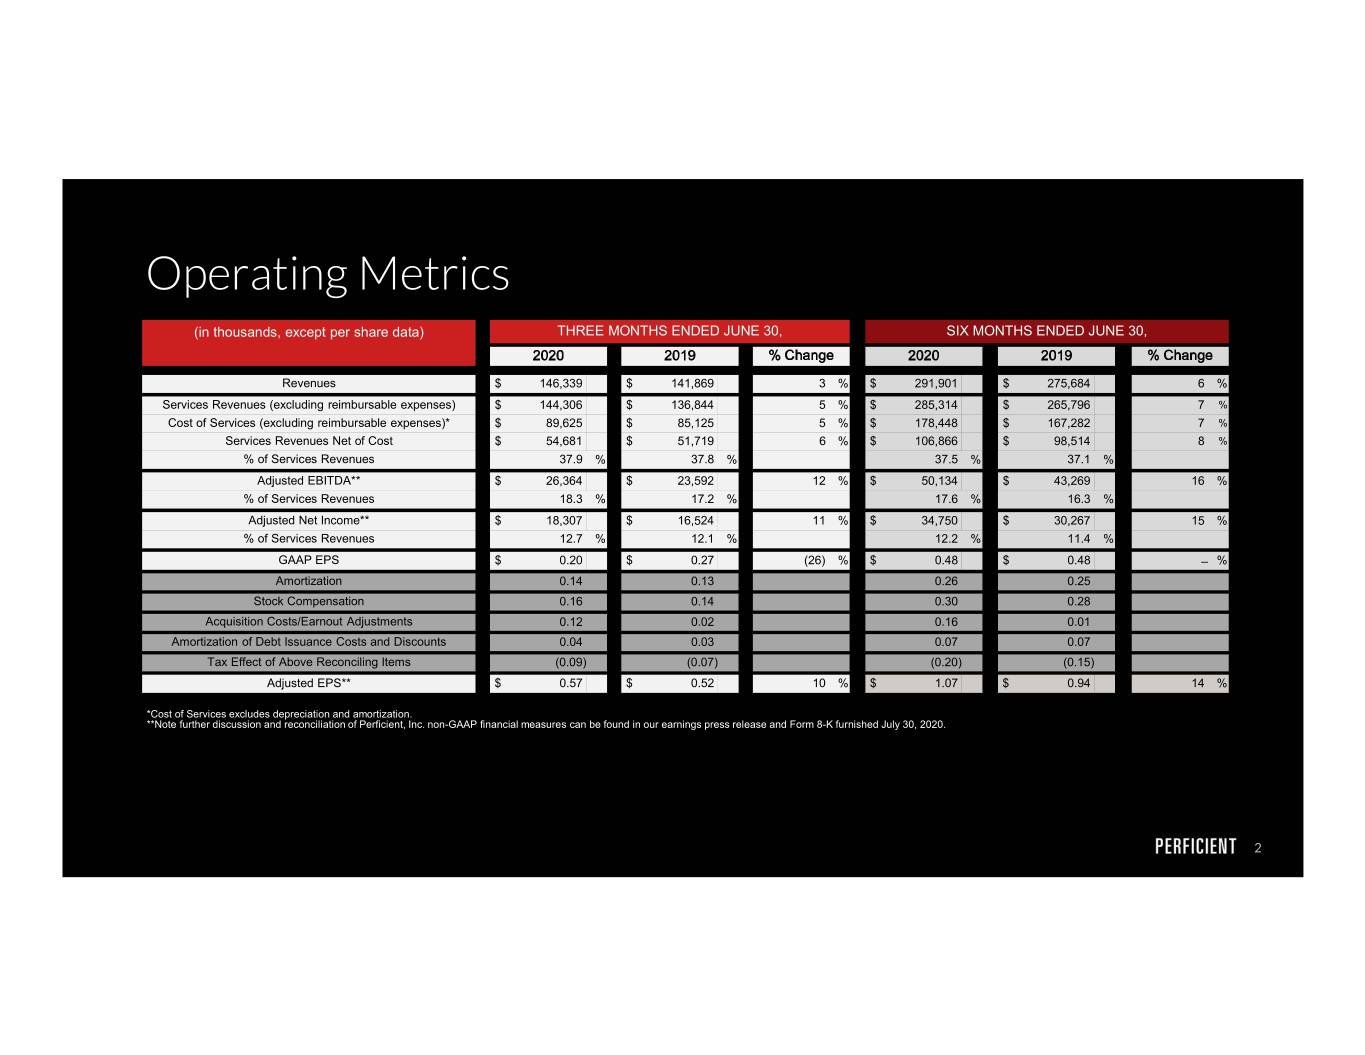
Operating Metrics (in thousands, except per share data) THREE MONTHS ENDED JUNE 30, SIX MONTHS ENDED JUNE 30, 2020 2019 % Change 2020 2019 % Change Revenues $ 146,339 $ 141,869 3 % $ 291,901 $ 275,684 6 % Services Revenues (excluding reimbursable expenses) $ 144,306 $ 136,844 5 % $ 285,314 $ 265,796 7 % Cost of Services (excluding reimbursable expenses)* $ 89,625 $ 85,125 5 % $ 178,448 $ 167,282 7 % Services Revenues Net of Cost $ 54,681 $ 51,719 6 % $ 106,866 $ 98,514 8 % % of Services Revenues 37.9 % 37.8 % 37.5 % 37.1 % Adjusted EBITDA** $ 26,364 $ 23,592 12 % $ 50,134 $ 43,269 16 % % of Services Revenues 18.3 % 17.2 % 17.6 % 16.3 % Adjusted Net Income** $ 18,307 $ 16,524 11 % $ 34,750 $ 30,267 15 % % of Services Revenues 12.7 % 12.1 % 12.2 % 11.4 % GAAP EPS $ 0.20 $ 0.27 (26) % $ 0.48 $ 0.48 ̶ % Amortization 0.14 0.13 0.26 0.25 Stock Compensation 0.16 0.14 0.30 0.28 Acquisition Costs/Earnout Adjustments 0.12 0.02 0.16 0.01 Amortization of Debt Issuance Costs and Discounts 0.04 0.03 0.07 0.07 Tax Effect of Above Reconciling Items (0.09) (0.07) (0.20) (0.15) Adjusted EPS** $ 0.57 $ 0.52 10 % $ 1.07 $ 0.94 14 % *Cost of Services excludes depreciation and amortization. **Note further discussion and reconciliation of Perficient, Inc. non-GAAP financial measures can be found in our earnings press release and Form 8-K furnished July 30, 2020. 2

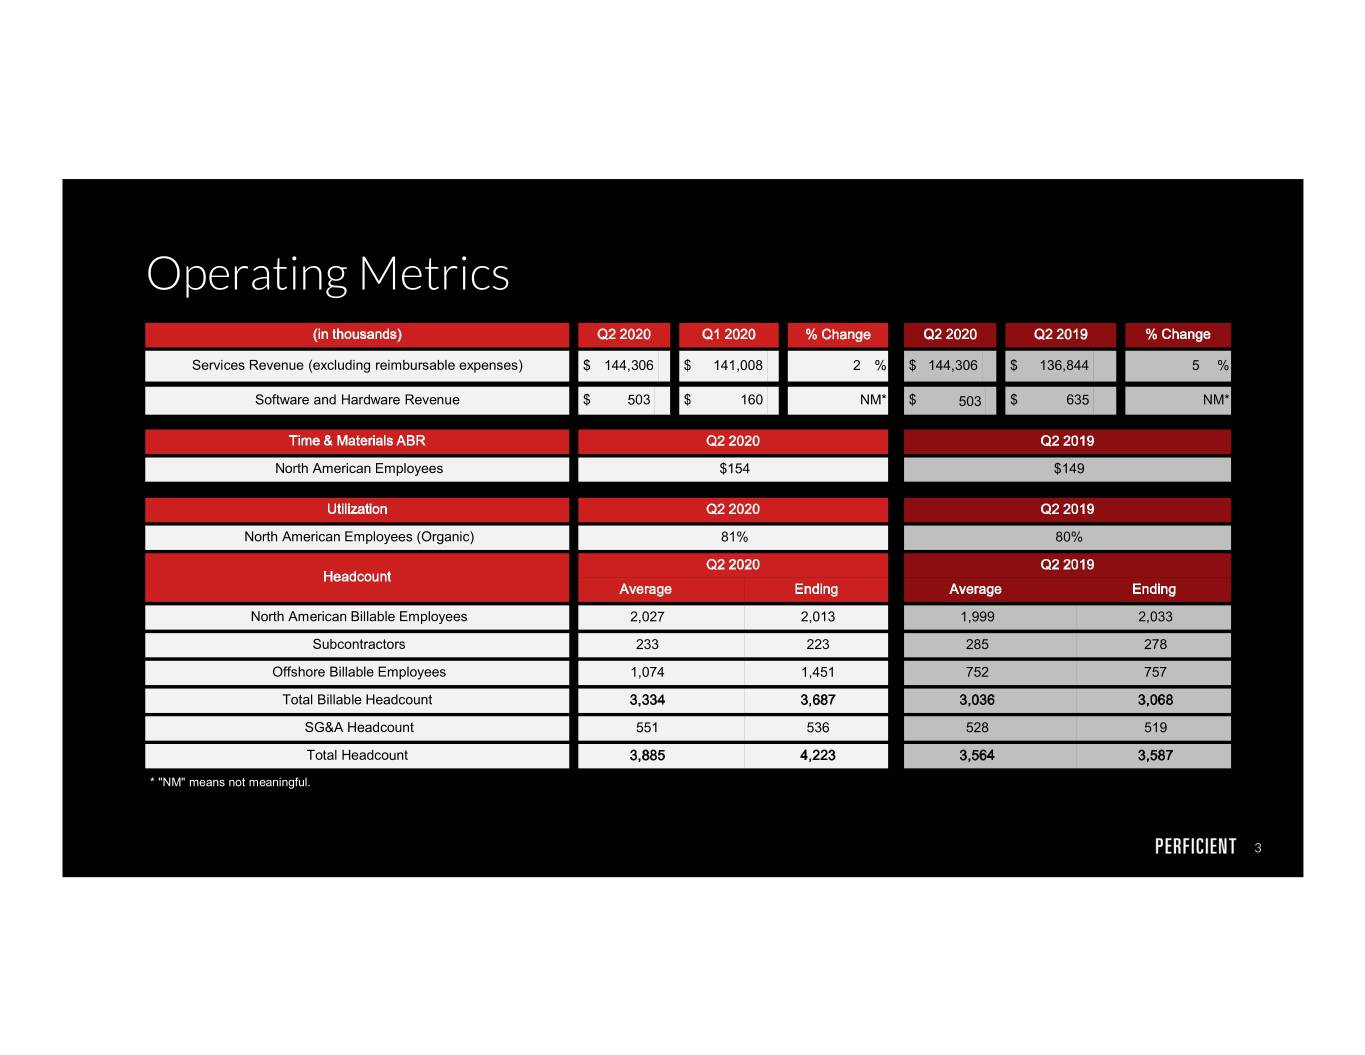
Operating Metrics (in thousands) Q22020 Q12020 % Change Q22020 Q22019 % Change Services Revenue (excluding reimbursable expenses) $ 144,306 $ 141,008 2 % $ 144,306 $ 136,844 5 % Software and Hardware Revenue $ 503 $ 160 NM* $ 503 $ 635 NM* Time & Materials ABR Q22020 Q22019 North American Employees $154 $149 Utilization Q22020 Q22019 North American Employees (Organic) 81% 80% Q22020 Q22019 Headcount Average Ending Average Ending North American Billable Employees 2,027 2,013 1,999 2,033 Subcontractors 233 223 285 278 Offshore Billable Employees 1,074 1,451 752 757 Total Billable Headcount 3,334 3,687 3,036 3,068 SG&A Headcount 551 536 528 519 Total Headcount 3,885 4,223 3,564 3,587 * "NM" means not meaningful. 3

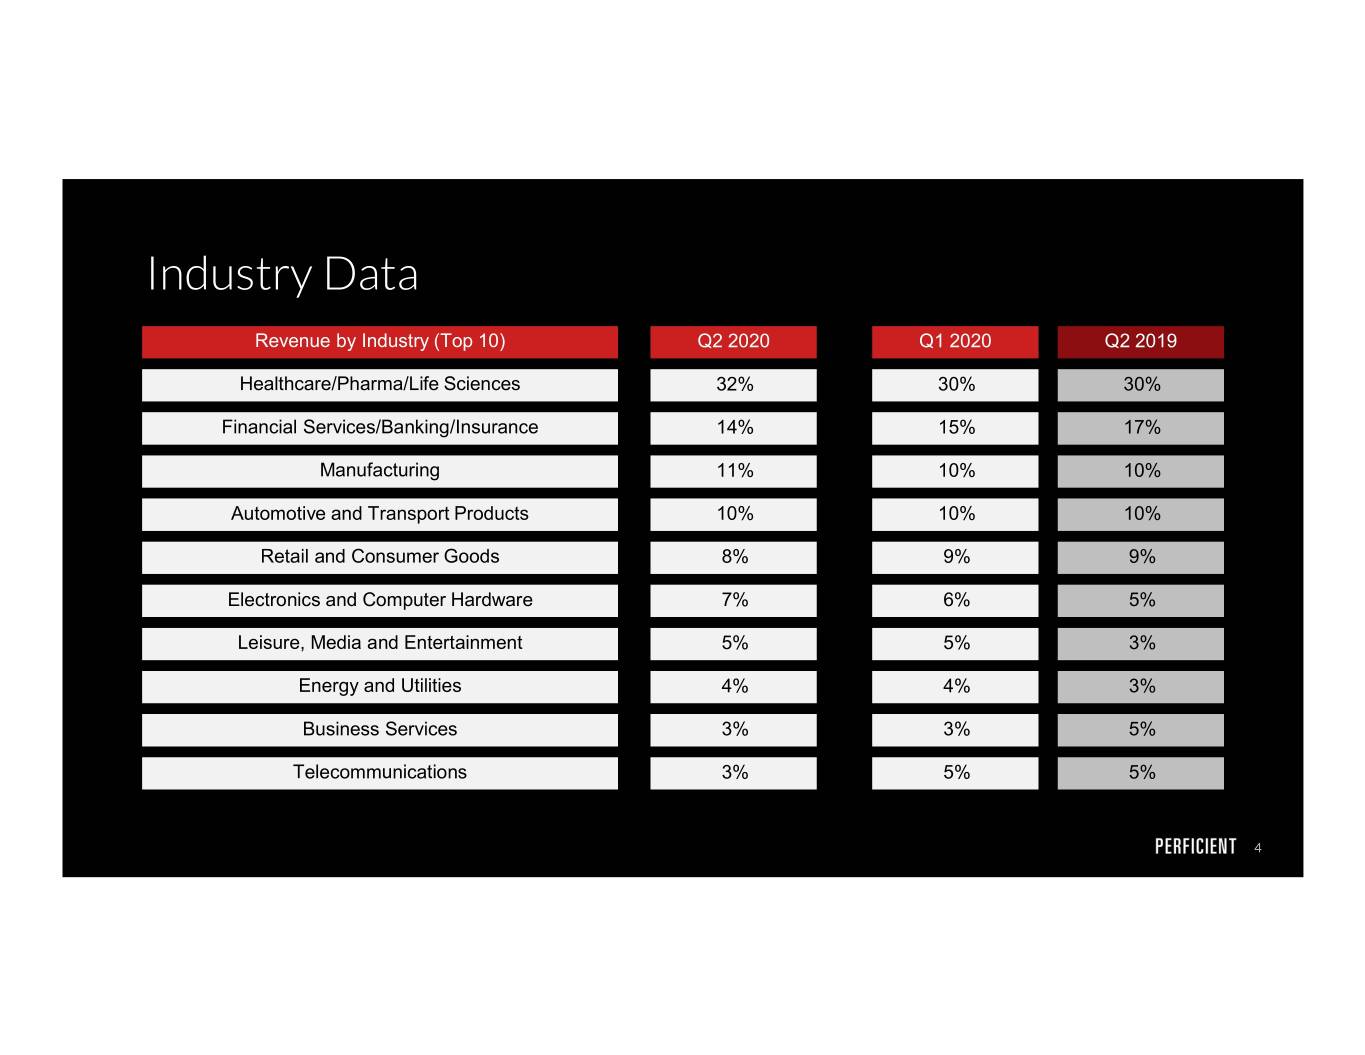
Industry Data Revenue by Industry (Top 10) Q2 2020 Q1 2020 Q2 2019 Healthcare/Pharma/Life Sciences 32% 30% 30% Financial Services/Banking/Insurance 14% 15% 17% Manufacturing 11% 10% 10% Automotive and Transport Products 10% 10% 10% Retail and Consumer Goods 8% 9% 9% Electronics and Computer Hardware 7% 6% 5% Leisure, Media and Entertainment 5% 5% 3% Energy and Utilities 4% 4% 3% Business Services 3% 3% 5% Telecommunications 3% 5% 5% 4
