Attached files
| file | filename |
|---|---|
| 8-K - FORM 8-K - BayCom Corp | tm2025516d1_8k.htm |
Exhibit 99.1

1 Investor Presentation July 2020
2 Disclosure Statement This presentation contains statements that are considered forward looking statements within the meaning of and are intended to be covered by the safe harbor provisions of the Private Securities Litigation Reform Act of 1995 . Forward looking statements typically are identified with use of terms such as “may,” “might,” “will,” “would,” “should,” “expect ,” “ plan,” “anticipate,” “believe,” “estimate,” “predict,” “potential,” “could,” “continue” and the negative of these terms and similar words, although some forward looking statements may be expressed differently . Forward looking statements also include, but are not limited to, statements regarding plans, objectives , expectations or consequences of announced transactions, known trends and statements about future performance, operations, products and services of BayCom Corp (“we,” “us,” “our” or the “Issuer ”) and its subsidiaries, including United Business Bank (“UBB”) . Our ability to predict results or the actual effects of future plans or strategies is inherently uncertain . You should be aware that our actual results could differ materially from those contained in the forward looking statements . The novel coronavirus disease, or COVID 19 , pandemic is adversely affecting us, our customers , counterparties , employees, and third party service providers, and the ultimate extent of the impacts on our business, financial position, results of operations, liquidity, and prospects is uncertain . Continued deterioration in general business and economic conditions, including further increases in unemployment rates, or turbulence in domestic or global financial markets could adversely affect our revenues and the values of our assets and liabilities, reduce the availability of funding, lead to a tightening of credit, and further increase stock price volatility . In addition, changes to statutes, regulations, or regulatory policies or practices as a result of, or in response to COVID 19 , could affect us in substantial and unpredictable ways . Other factors that could cause or contribute to such differences include, but are not limited to : ( i ) expected revenues, cost savings, synergies and other benefits from our recent acquisitions might not be realized within the expected time frames or at all and costs or difficulties relating to integration matters, including but not limited to customer and employee retention, might be greater than expected ; (ii) the credit risks of lending activities, including changes in the level and trend of loan delinquencies and write - offs and changes in our allowance for loan losses and provision for loan losses ; (iii) changes in economic conditions in general and in California, Colorado, Washington, and New Mexico ; (iv) changes in the levels of general interest rates and the relative differences between short and long - term interest rates, loan and deposit interest rates ; (v) uncertainty regarding the future of the London Interbank Offered Rate ("LIBOR"), and the potential transition away from LIBOR toward new interest rate benchmarks ; (vi) our net interest margin and funding sources ; (vii) fluctuations in the demand for loans, the number of unsold homes, land and other properties and fluctuations in real estate values in our market areas ; (viii) secondary market conditions for loans and our ability to originate loans held for sale and to sell loans in the secondary market ; (ix) results of examinations of us by regulatory authorities and the possibility that any such regulatory authority may, among other things, limit our business activities, require us to change our business mix, increase our allowance for loan and lease losses, write - down asset values or increase our capital levels, affect our ability to borrow funds or maintain or increase deposits ; (x) risks related to our acquisition strategy, including our ability to identify future suitable acquisition candidates, exposure to potential asset and credit quality risks and unknown or contingent liabilities, the need for capital to finance such transactions, our ability to obtain required regulatory approvals and possible failures in realizing the anticipated benefits from acquisitions ; (xi) challenges arising from attempts to expand into new geographic markets, products, or services ; (xii) future goodwill impairment due to changes in our business, market conditions, or other factors ; (xiii) legislative or regulatory changes that adversely affect our business including changes in banking, securities and tax law, and regulatory policies and principles, or the interpretation of regulatory capital or other rules, including changes related to Basel III ; (xiv) the impact of the Dodd - Frank Wall Street Reform and Consumer Protection Act of 2010 and the implementing regulations ; (xv) our ability to attract and retain deposits ; (xvi) our ability to control operating costs and expenses ; (xvii) the use of estimates in determining fair value of certain of our assets and liabilities, which estimates may prove to be incorrect and result in significant changes in valuation ; (xviii) difficulties in reducing risk associated with the loans and securities on our balance sheet ; (xix) staffing fluctuations in response to product demand or the implementation of corporate strategies that affect our work force and potential associated charges ; (xx) the effectiveness of our risk management framework ; (xxi) disruptions, security breaches, or other adverse events, failures or interruptions in, or attacks on, our information technology systems or on the third - party vendors who perform several of our critical processing functions, which could expose us to litigation or reputational harm ; (xxii) an inability to keep pace with the rate of technological advances ; (xxiii) our ability to retain key members of our senior management team and our ability to attract, motivate and retain qualified personnel ; (xxiv) costs and effects of litigation, including settlements and judgments ; (xxv) our ability to implement our business strategies and manage our growth ; (xxvi) liquidity issues, including our ability to borrow funds or raise additional capital, if necessary ; (xxvii) the loss of our large loan and deposit relationships ; (xxviii) increased competitive pressures among financial services companies ; (xxix) changes in consumer spending, borrowing and savings habits ; (xxx) the availability of resources to address changes in laws, rules, or regulations or to respond to regulatory actions ; (xxxi) adverse changes in the securities markets ; (xxxii) inability of key third - party providers to perform their obligations to us ; (xxxii) statements with respect to our intentions regarding disclosure and other changes resulting from the Jumpstart Our Business Startups Act of 2012 ("JOBS Act") ; (xxxiii) changes in accounting principles, policies or guidelines and practices, as may be adopted by the financial institution regulatory agencies, the Public Company Accounting Oversight Board or the Financial Accounting Standards Board ; (xxxiv) other economic, competitive, governmental, regulatory, and technological factors affecting our operations, pricing, products and services ; (xxxv) other economic, competitive, governmental, regulatory, and technological factors affecting our operations, pricing, products and services including the Coronavirus Aid, Relief, and Economic Security Act of 2020 ("CARES Act") ; and (xxxvi ) other risks discussed under the heading “ Risk Factors” in the preliminary prospectus supplement, as well as the risk factors included in the documents incorporated therein by reference , including under Item 1 A of our Annual Report on Form 10 K for the year ended December 31 , 2019 and Part II, Item 1 A of our Quarterly Report on Form 10 Q for the quarter ended March 31 , 2020 , all of which could cause actual results to differ from those set forth in the forward looking statements .
3 Disclosure Statement There can be no assurance that other factors not currently anticipated by us will not materially and adversely affect our business , financial condition and results of operations . Readers are cautioned not to place undue reliance on our forward looking statements, which reflect management’s analysis and expectations only as of the date of such statements . Forward looking statements speak only as of the date they are made, and we do not intend, and undertake no obligation , to publicly revise or update forward looking statements , whether as a result of new information, future events or otherwise, except as required by federal securities law . Any investor in our securities should consider all risks and uncertainties disclosed in our filings with the Securities and Exchange Commission (the “SEC”) described under the heading “Where You Can Find More Information” in the preliminary prospectus supplement, all of which are accessible on the SE C’s website at www . sec . gov . The Issuer has filed a registration statement (including a prospectus) (File No . 333 - 237791 ) and a preliminary prospectus supplement with the SEC for the offering to which this presentation relates . Before you invest, you should read the prospectus in that registration statement, the preliminary prospectus supplement and other documents the Issuer has filed with the SEC for more complete information about the Issuer and this offering . You may get these documents for free by visiting EDGAR on the SEC’s website at www . sec . gov . Alternatively, the Issuer, any underwriter or any dealer participating in the offering will arrange to send you the prospectus and the related preliminary prospectus supplement if you request it by calling Janney Montgomery Scott toll free at ( 800 ) 477 - 9251 or emailing prospectus@janney . com or by contacting D . A . Davidson & Co . at ( 800 ) 332 - 5915 or by emailing prospectusrequest@dadco . com . This presentation may not be used in connection with any offer to sell, or solicitation of an offer to buy, any securities in a state or jurisdiction in which such offer or solicitation is not permitted by law or in which the person making the offer or solicitation is not qualified to do so or to any person to whom it is unlawful to make such offer or solicitation .

4 Company Overview

5 Experienced Leadership Team George Guarini – Founder, President and Chief Executive Officer • Founded UBB on July 20, 2004 • Mr. Guarini has held executive and senior level management positions with national and regional financial institutions • 31 years of banking experience • Previously the acting President for Summit Bank; Prior to Summit Bank, Mr. Guarini was the Chief Lending Officer for Imperial Capital Bank • Mr. Guarini earned his Bachelor of Arts degree in Economics from Rutgers University David Funkhouser – Executive Vice President and Chief Credit Officer • Joined UBB in June 2015 as Executive Vice President and Chief Credit Officer • 32 years of banking experience • Previously the President and Chief Executive Officer for Trans Pacific Bank • Mr. Funkhouser earned his Bachelor of Arts degree from California State University, San Jose and completed the Pacific Coast Ban king School’s graduate level management program Keary Colwell – Sr. Executive Vice President and Chief Financial Officer • Served as the Sr. Executive Vice President and Chief Financial Officer of UBB since inception in July 2004 • Nearly 30 years of banking experience • Previously the Chief Financial Officer for Bank of San Francisco • Prior to joining Bank of San Francisco, Ms. Colwell was the Vice President and Senior Financial Manager of First Nationwide B ank • Ms. Colwell earned her Bachelor of Science degree from California State University, Chico Rick Pak – Executive Vice President and Chief Lending Officer • Joined UBB in September 2016 and became the Executive Vice President and Chief Lending Officer in January 2019 • Mr. Pak has been in the banking industry for over 30 years and has worked in many aspects of banking • Mr. Pak earned his Bachelor of Arts degree from Bethany University and completed the Pacific Coast Banking School’s graduate lev el management program Janet King – Sr. Executive Vice President and Chief Operating Officer • Served as the Sr. Executive Vice President and Chief Operating Officer of UBB since inception in July 2004 • 30 years of banking experience • Formerly Chief Branch Administrative Officer at Circle Bank from 1999 - 2004 where she was responsible for all aspects of operations • Served as Vice President of Operations for Valencia Bank & Trust from 1987 - 1998 • Ms. King earned her Bachelor of Science degree from the University of Phoenix
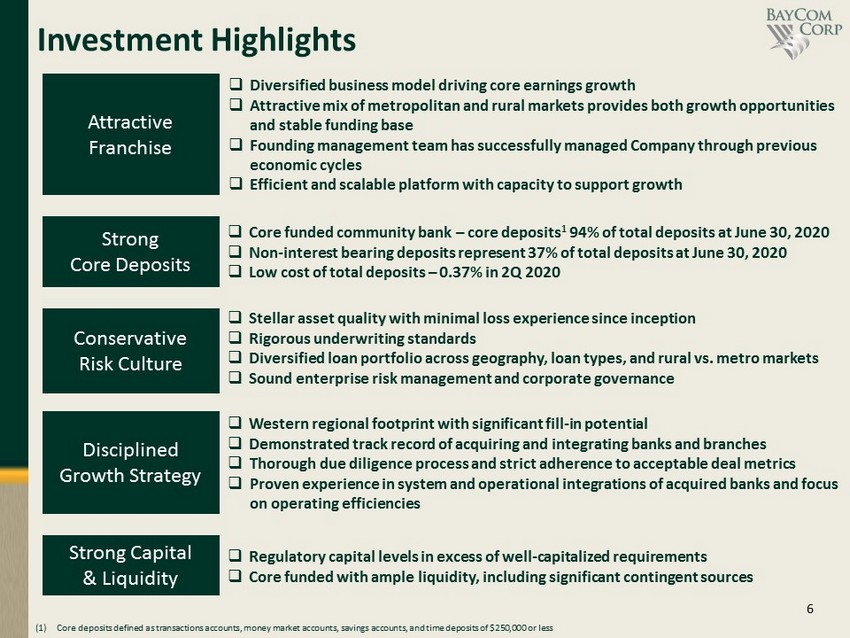
6 Investment Highlights Attractive Franchise Strong Core Deposits Conservative Risk Culture Disciplined Growth Strategy Strong Capital & Liquidity □ Diversified business model driving core earnings growth □ Attractive mix of metropolitan and rural markets provides both growth opportunities and stable funding base □ Founding management team has successfully managed Company through previous economic cycles □ Efficient and scalable platform with capacity to support growth □ Western regional footprint with significant fill - in potential □ Demonstrated track record of acquiring and integrating banks and branches □ Thorough due diligence process and strict adherence to acceptable deal metrics □ Proven experience in system and operational integrations of acquired banks and focus on operating efficiencies □ Stellar asset quality with minimal loss experience since inception □ Rigorous underwriting standards □ Diversified loan portfolio across geography, loan types, and rural vs. metro markets □ Sound enterprise risk management and corporate governance □ Regulatory capital levels in excess of well - capitalized requirements □ Core funded with ample liquidity, including significant contingent sources □ Core funded community bank – core deposits 1 94% of total deposits at June 30, 2020 □ Non - interest bearing deposits represent 37% of total deposits at June 30, 2020 □ Low cost of total deposits – 0.37% in 2Q 2020 (1) Core deposits defined as transactions accounts, money market accounts, savings accounts, and time deposits of $250,000 or les s
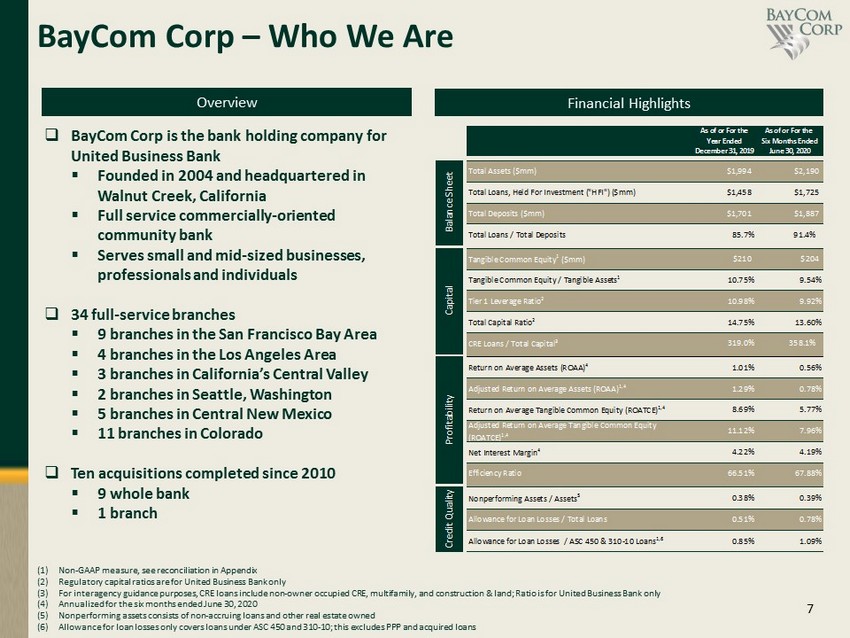
7 BayCom Corp – Who We Are Overview Financial Highlights (1) Non - GAAP measure, see reconciliation in Appendix (2) Regulatory capital ratios are for United Business Bank only (3) For interagency guidance purposes, CRE loans include non - owner occupied CRE, multifamily, and construction & land; Ratio is for United Business Bank only (4) Annualized for the six months ended June 30, 2020 (5) Nonperforming assets consists of non - accruing loans and other real estate owned (6) Allowance for loan losses only covers loans under ASC 450 and 310 - 10; this excludes PPP and acquired loans □ BayCom Corp is the bank holding company for United Business Bank ▪ Founded in 2004 and headquartered in Walnut Creek, California ▪ Full service commercially - oriented community bank ▪ Serves small and mid - sized businesses, professionals and individuals □ 34 full - service branches ▪ 9 branches in the San Francisco Bay Area ▪ 4 branches in the Los Angeles Area ▪ 3 branches in California’s Central Valley ▪ 2 branches in Seattle, Washington ▪ 5 branches in Central New Mexico ▪ 11 branches in Colorado □ Ten acquisitions completed since 2010 ▪ 9 whole bank ▪ 1 branch As of or For the As of or For the Year Ended Six Months Ended December 31, 2019 June 30, 2020 Total Assets ($mm) $1,994 $2,190 Total Loans, Held For Investment ("HFI") ($mm) $1,458 $1,725 Total Deposits ($mm) $1,701 $1,887 Total Loans / Total Deposits 85.7% 91.4% Tangible Common Equity 1 ($mm) $210 $204 Tangible Common Equity / Tangible Assets 1 10.75% 9.54% Tier 1 Leverage Ratio 2 10.98% 9.92% Total Capital Ratio 2 14.75% 13.60% CRE Loans / Total Capital 3 319.0% 358.1% Return on Average Assets (ROAA) 4 1.01% 0.56% Adjusted Return on Average Assets (ROAA) 1,4 1.29% 0.78% Return on Average Tangible Common Equity (ROATCE) 1,4 8.69% 5.77% Adjusted Return on Average Tangible Common Equity (ROATCE) 1,4 11.12% 7.96% Net Interest Margin 4 4.22% 4.19% Efficiency Ratio 66.51% 67.88% Nonperforming Assets / Assets 5 0.38% 0.39% Allowance for Loan Losses / Total Loans 0.51% 0.78% Allowance for Loan Losses / ASC 450 & 310-10 Loans 1,6 0.85% 1.09% Balance Sheet Capital Profitability Credit Quality
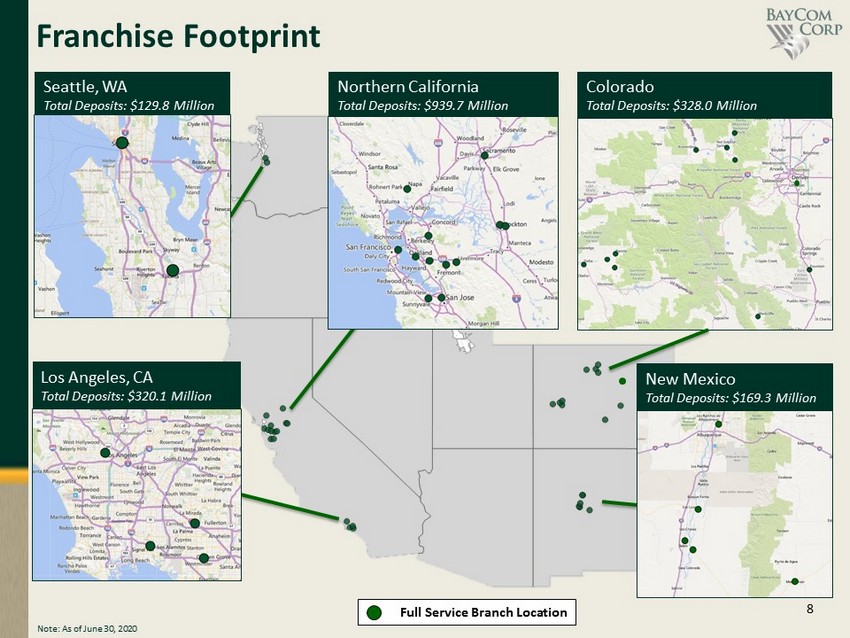
8 Franchise Footprint Full Service Branch Location Seattle, WA Total Deposits: $129.8 Million Los Angeles, CA Total Deposits: $320.1 Million Northern California Total Deposits: $939.7 Million New Mexico Total Deposits: $169.3 Million Colorado Total Deposits: $328.0 Million Note: As of June 30, 2020
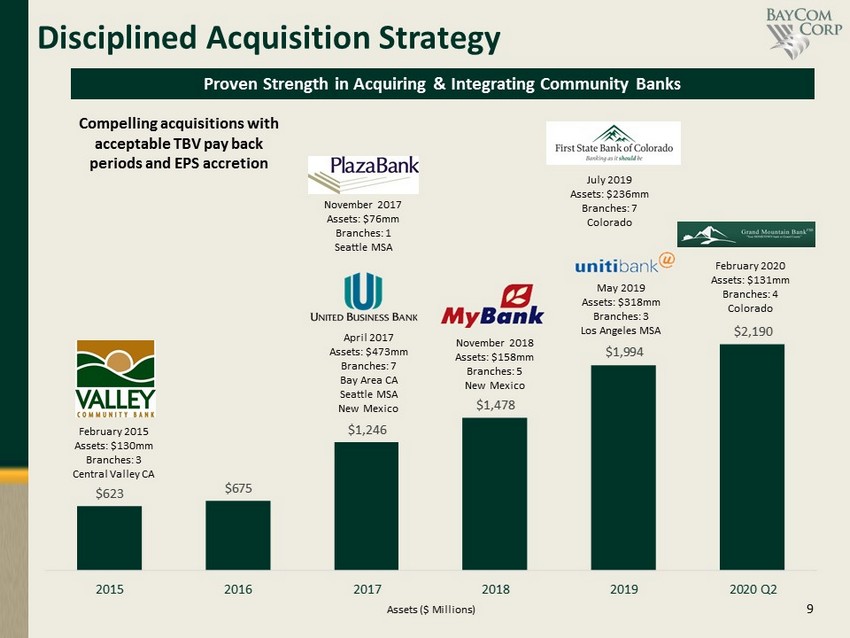
9 $623 $675 $1,246 $1,478 $1,994 $2,190 2015 2016 2017 2018 2019 2020 Q2 Assets ($ Millions) Disciplined Acquisition Strategy Proven Strength in Acquiring & Integrating Community Banks February 2015 Assets: $130mm Branches: 3 Central Valley CA April 2017 Assets: $473mm Branches: 7 Bay Area CA Seattle MSA New Mexico November 2017 Assets: $76mm Branches: 1 Seattle MSA November 2018 Assets: $158mm Branches: 5 New Mexico May 2019 Assets: $318mm Branches: 3 Los Angeles MSA July 2019 Assets: $236mm Branches: 7 Colorado February 2020 Assets: $131mm Branches: 4 Colorado Compelling acquisitions with acceptable TBV pay back periods and EPS accretion
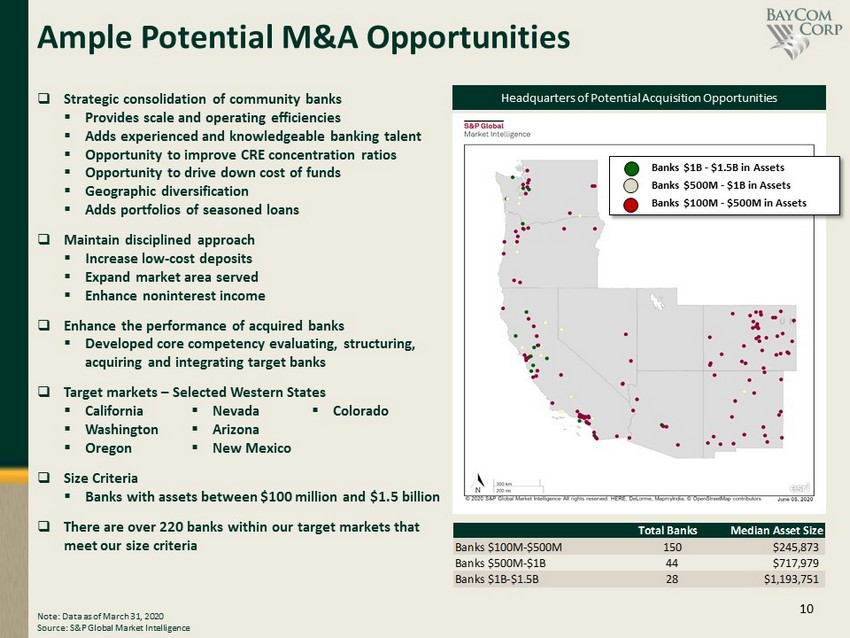
10 Ample Potential M&A Opportunities Headquarters of Potential Acquisition Opportunities □ Strategic consolidation of community banks ▪ Provides scale and operating efficiencies ▪ Adds experienced and knowledgeable banking talent ▪ Opportunity to improve CRE concentration ratios ▪ Opportunity to drive down cost of funds ▪ Geographic diversification ▪ Adds portfolios of seasoned loans □ Maintain disciplined approach ▪ Increase low - cost deposits ▪ Expand market area served ▪ Enhance noninterest income □ Enhance the performance of acquired banks ▪ Developed core competency evaluating, structuring, acquiring and integrating target banks □ Target markets – Selected Western States ▪ California ▪ Washington ▪ Oregon □ Size Criteria ▪ Banks with assets between $100 million and $1.5 billion □ There are over 220 banks within our target markets that meet our size criteria ▪ Nevada ▪ Arizona ▪ New Mexico Note: Data as of March 31, 2020 Source: S&P Global Market Intelligence Total Banks Median Asset Size Banks $100M-$500M 150 $245,873 Banks $500M-$1B 44 $717,979 Banks $1B-$1.5B 28 $1,193,751 Banks $1B - $1.5B in Assets Banks $500M - $1B in Assets Banks $100M - $500M in Assets ▪ Colorado

11 Financial Highlights
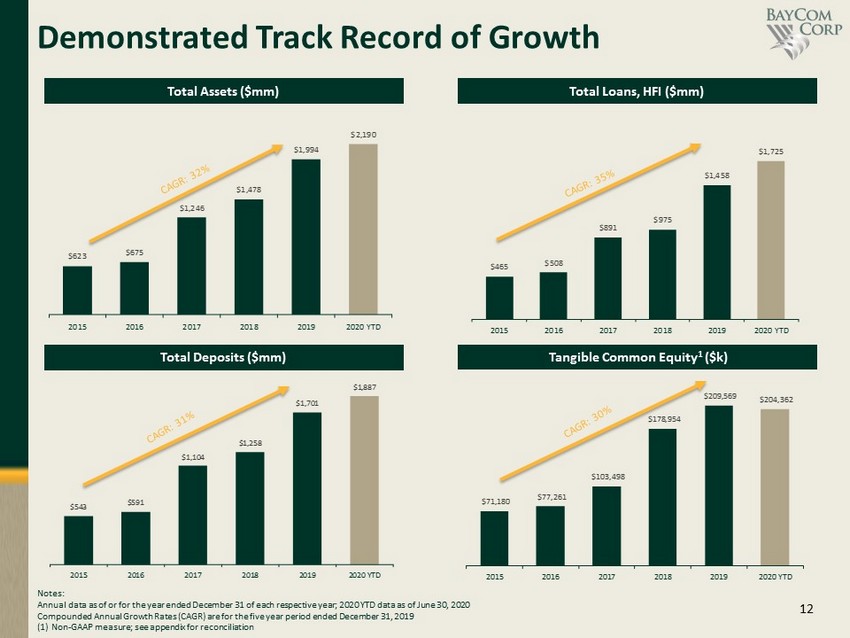
12 $543 $591 $1,104 $1,258 $1,701 $1,887 2015 2016 2017 2018 2019 2020 YTD $465 $508 $891 $975 $1,458 $1,725 2015 2016 2017 2018 2019 2020 YTD Demonstrated Track Record of Growth Total Assets ($mm) Total Loans, HFI ($mm) Total Deposits ($mm) Tangible Common Equity 1 ($k) Notes: Annual data as of or for the year ended December 31 of each respective year; 2020 YTD data as of June 30, 2020 Compounded Annual Growth Rates (CAGR) are for the five year period ended December 31, 2019 (1) Non - GAAP measure; see appendix for reconciliation $623 $675 $1,246 $1,478 $1,994 $2,190 2015 2016 2017 2018 2019 2020 YTD $71,180 $77,261 $103,498 $178,954 $209,569 $204,362 2015 2016 2017 2018 2019 2020 YTD

13 Strong Core Earnings Power Net Income 1 ($000) Pre - Provision Pre - Tax Net Revenue 1 ($000) Note: Annual data for the year ended December 31 of each respective year; 2020 YTD data for the six months ended June 30, 2020 (1) Non - GAAP measures; see appendix for reconciliation (2) Calculated by dividing noninterest expense by the sum of net interest income before provision for loan losses plus noninterest income $7,452 $5,912 $5,260 $14,493 $17,318 $5,937 $5,310 $5,912 $10,166 $15,466 $22,151 $8,192 2015 2016 2017 2018 2019 2020 YTD Net Income Adjusted Net Income Efficiency Ratio 2 64.66% 60.78% 67.34% 62.15% 66.51% 67.88% 2015 2016 2017 2018 2019 2020 YTD Net Interest Margin 4.00% 4.25% 4.14% 4.15% 4.22% 4.19% 2015 2016 2017 2018 2019 2020 YTD $6,866 $10,946 $18,087 $24,476 $32,530 $17,431 2015 2016 2017 2018 2019 2020 YTD
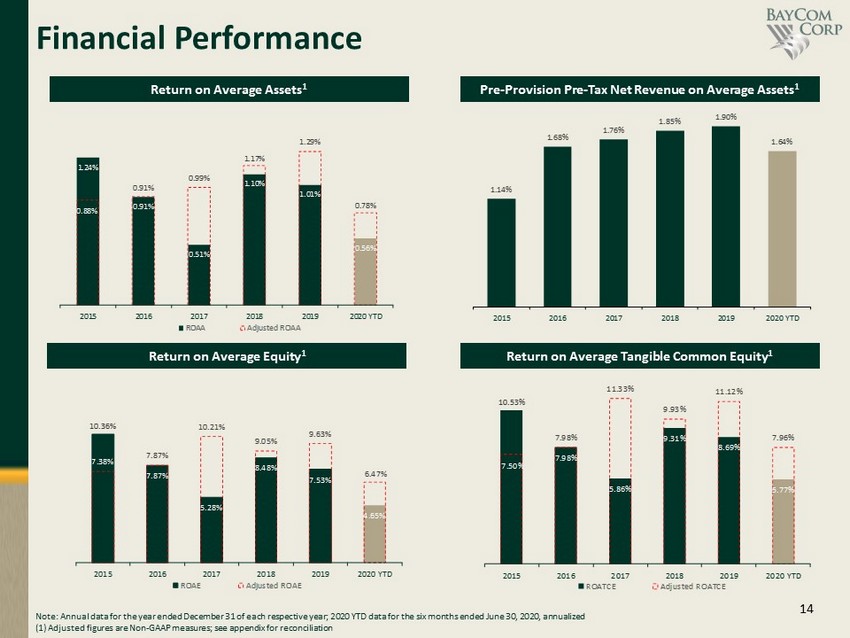
14 Financial Performance Return on Average Assets 1 Pre - Provision Pre - Tax Net Revenue on Average Assets 1 Return on Average Tangible Common Equity 1 Note: Annual data for the year ended December 31 of each respective year; 2020 YTD data for the six months ended June 30, 2020, annualized (1) Adjusted figures are Non - GAAP measures; see appendix for reconciliation 1.24% 0.91% 0.51% 1.10% 1.01% 0.56% 0.88% 0.91% 0.99% 1.17% 1.29% 0.78% 2015 2016 2017 2018 2019 2020 YTD ROAA Adjusted ROAA 10.36% 7.87% 5.28% 8.48% 7.53% 4.65% 7.38% 7.87% 10.21% 9.05% 9.63% 6.47% 2015 2016 2017 2018 2019 2020 YTD ROAE Adjusted ROAE Return on Average Equity 1 10.53% 7.98% 5.86% 9.31% 8.69% 5.77% 7.50% 7.98% 11.33% 9.93% 11.12% 7.96% 2015 2016 2017 2018 2019 2020 YTD ROATCE Adjusted ROATCE 1.14% 1.68% 1.76% 1.85% 1.90% 1.64% 2015 2016 2017 2018 2019 2020 YTD

15 Capital Ratios Common Equity Tier 1 Ratio 2 Tangible Common Equity / Tangible Assets 1 Leverage Ratio 2 Total Capital Ratio 2 (1) Non - GAAP measure; see appendix for reconciliation (2) Regulatory capital ratios are for United Business Bank only 11.44% 11.45% 8.41% 12.29% 10.75% 9.54% 2015 2016 2017 2018 2019 2020 YTD 10.59% 10.59% 8.92% 10.04% 10.98% 9.92% 2015 2016 2017 2018 2019 2020 YTD 13.30% 13.43% 12.43% 14.63% 14.23% 12.76% 2015 2016 2017 2018 2019 2020 YTD 14.13% 14.18% 12.94% 15.17% 14.75% 13.60% 2015 2016 2017 2018 2019 2020 YTD
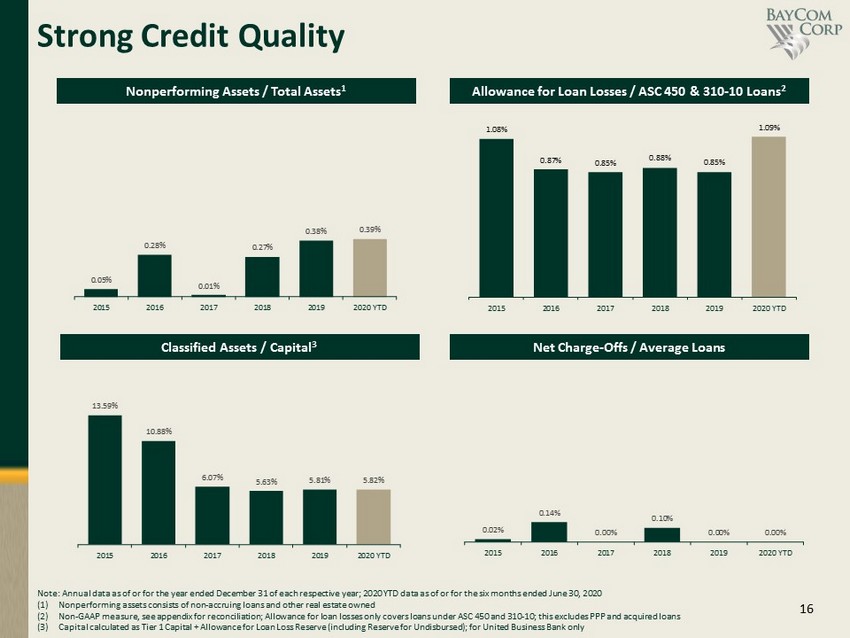
16 13.59% 10.88% 6.07% 5.63% 5.81% 5.82% 2015 2016 2017 2018 2019 2020 YTD Strong Credit Quality Classified Assets / Capital 3 Nonperforming Assets / Total Assets 1 Allowance for Loan Losses / ASC 450 & 310 - 10 Loans 2 Net Charge - Offs / Average Loans Note: Annual data as of or for the year ended December 31 of each respective year; 2020 YTD data as of or for the six months ended June 30, 2020 (1) Nonperforming assets consists of non - accruing loans and other real estate owned (2) Non - GAAP measure, see appendix for reconciliation; Allowance for loan losses only covers loans under ASC 450 and 310 - 10; this excludes PPP and acquired loans (3) Capital calculated as Tier 1 Capital + Allowance for Loan Loss Reserve (including Reserve for Undisbursed); for United Busine ss Bank only 0.05% 0.28% 0.01% 0.27% 0.38% 0.39% 2015 2016 2017 2018 2019 2020 YTD 0.02% 0.14% 0.00% 0.10% 0.00% 0.00% 2015 2016 2017 2018 2019 2020 YTD 1.08% 0.87% 0.85% 0.88% 0.85% 1.09% 2015 2016 2017 2018 2019 2020 YTD

17 COVID - 19 Pandemic Response
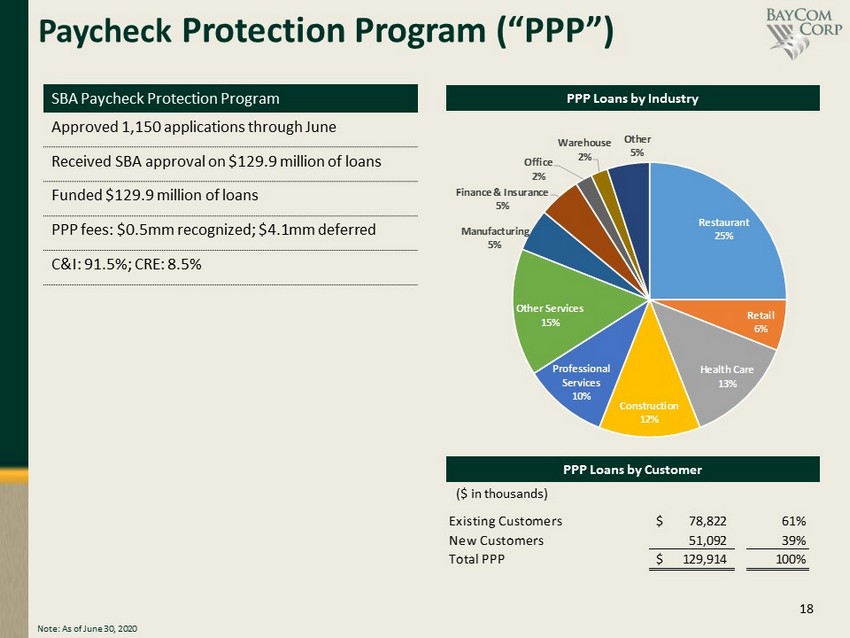
18 Paycheck Protection Program (“PPP”) Note: As of June 30, 2020 PPP Loans by Industry SBA Paycheck Protection Program Approved 1,150 applications through June Received SBA approval on $129.9 million of loans Funded $129.9 million of loans PPP fees: $0.5 mm recognized; $4.1mm deferred C&I: 91.5%; CRE: 8.5% Restaurant 25% Retail 6% Health Care 13% Construction 12% Professional Services 10% Other Services 15% Manufacturing 5% Finance & Insurance 5% Office 2% Warehouse 2% Other 5% PPP Loans by Customer Existing Customers 78,822$ 61% New Customers 51,092 39% Total PPP 129,914$ 100% ($ in thousands)
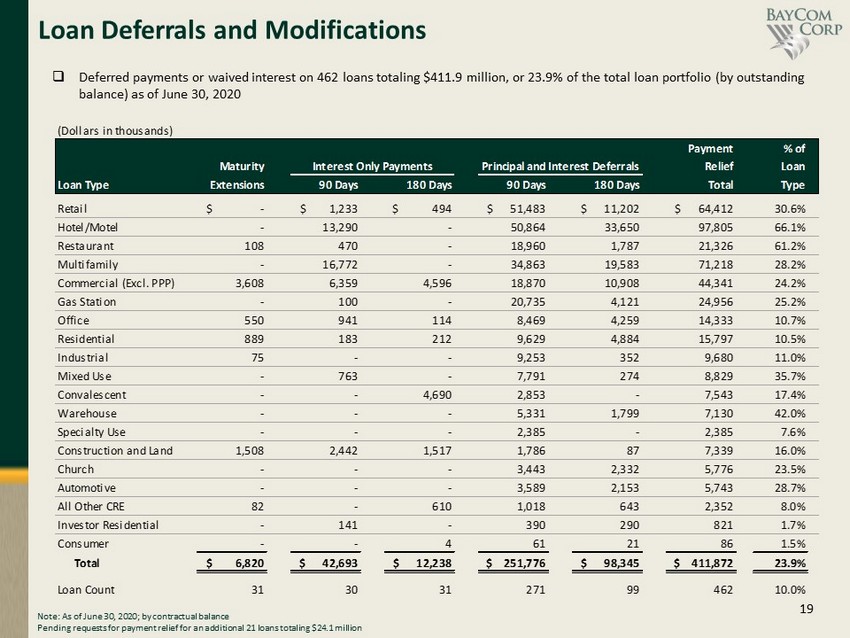
19 Loan Deferrals and Modifications □ Deferred payments or waived interest on 462 loans totaling $ 411.9 million, or 23.9% of the total loan portfolio (by outstanding balance) as of June 30, 2020 (Dollars in thousands) Payment % of Maturity Relief Loan Loan Type Extensions 90 Days 180 Days 90 Days 180 Days Total Type Retail $ - $ 1,233 $ 494 $ 51,483 $ 11,202 $ 64,412 30.6% Hotel/Motel - 13,290 - 50,864 33,650 97,805 66.1% Restaurant 108 470 - 18,960 1,787 21,326 61.2% Multifamily - 16,772 - 34,863 19,583 71,218 28.2% Commercial (Excl. PPP) 3,608 6,359 4,596 18,870 10,908 44,341 24.2% Gas Station - 100 - 20,735 4,121 24,956 25.2% Office 550 941 114 8,469 4,259 14,333 10.7% Residential 889 183 212 9,629 4,884 15,797 10.5% Industrial 75 - - 9,253 352 9,680 11.0% Mixed Use - 763 - 7,791 274 8,829 35.7% Convalescent - - 4,690 2,853 - 7,543 17.4% Warehouse - - - 5,331 1,799 7,130 42.0% Specialty Use - - - 2,385 - 2,385 7.6% Construction and Land 1,508 2,442 1,517 1,786 87 7,339 16.0% Church - - - 3,443 2,332 5,776 23.5% Automotive - - - 3,589 2,153 5,743 28.7% All Other CRE 82 - 610 1,018 643 2,352 8.0% Investor Residential - 141 - 390 290 821 1.7% Consumer - - 4 61 21 86 1.5% Total $ 6,820 $ 42,693 $ 12,238 $ 251,776 $ 98,345 $ 411,872 23.9% Loan Count 31 30 31 271 99 462 10.0% Interest Only Payments Principal and Interest Deferrals Note: As of June 30, 2020; by contractual balance Pending requests for payment relief for an additional 21 loans totaling $24.1 million
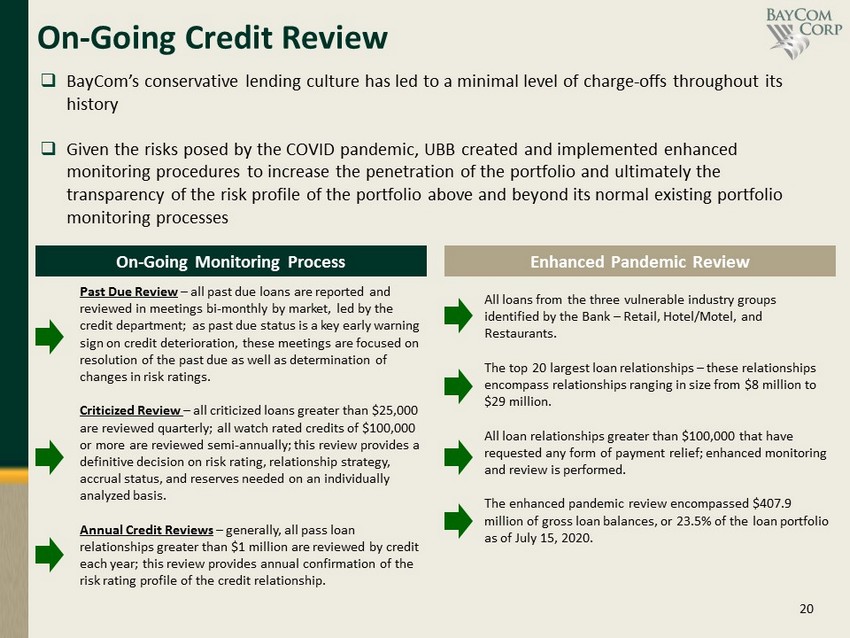
20 On - Going Credit Review Past Due Review – all past due loans are reported and reviewed in meetings bi - monthly by market, led by the credit department; as past due status is a key early warning sign on credit deterioration, these meetings are focused on resolution of the past due as well as determination of changes in risk ratings. Criticized Review – all criticized loans greater than $25,000 are reviewed quarterly; all watch rated credits of $100,000 or more are reviewed semi - annually; this review provides a definitive decision on risk rating, relationship strategy, accrual status, and reserves needed on an individually analyzed basis. Annual Credit Reviews – generally, all pass loan relationships greater than $1 million are reviewed by credit each year; this review provides annual confirmation of the risk rating profile of the credit relationship. On - Going Monitoring Process Enhanced Pandemic Review All loans from the three vulnerable industry groups identified by the Bank – Retail, Hotel/Motel, and Restaurants. The top 20 largest loan relationships – these relationships encompass relationships ranging in size from $8 million to $29 million. All loan relationships greater than $100,000 that have requested any form of payment relief; enhanced monitoring and review is performed. The enhanced pandemic review encompassed $407.9 million of gross loan balances, or 23.5% of the loan portfolio as of July 15, 2020. □ BayCom’s conservative lending culture has led to a minimal level of charge - offs throughout its history □ Given the risks posed by the COVID pandemic, UBB created and implemented enhanced monitoring procedures to increase the penetration of the portfolio and ultimately the transparency of the risk profile of the portfolio above and beyond its normal existing portfolio monitoring processes

21 Loan Portfolio
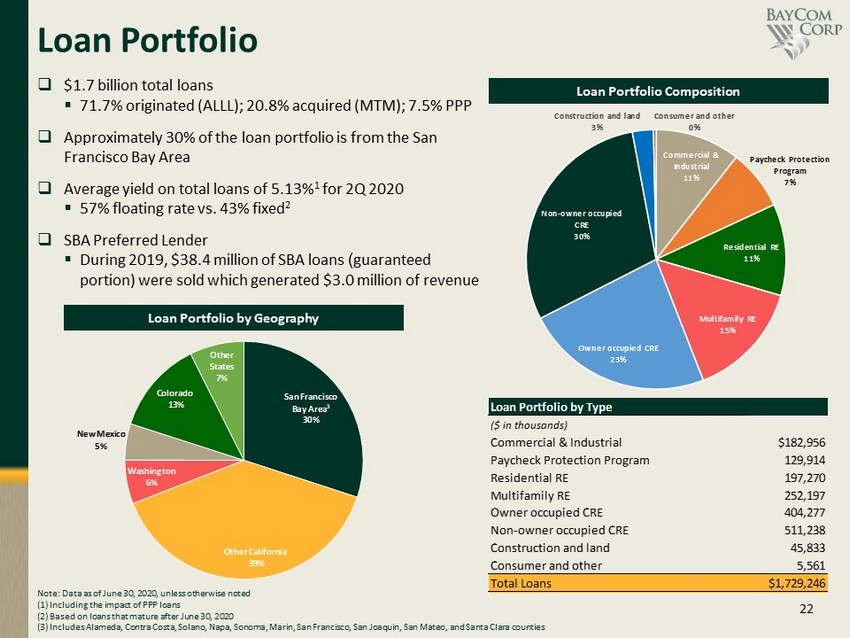
22 San Francisco Bay Area 3 30% Other California 39% Washington 6% New Mexico 5% Colorado 13% Other States 7% □ $1.7 billion total loans ▪ 71.7% originated (ALLL); 20.8% acquired (MTM); 7.5% PPP □ Approximately 30% of the loan portfolio is from the San Francisco Bay Area □ Average yield on total loans of 5.13% 1 for 2Q 2020 ▪ 57% floating rate vs. 43% fixed 2 □ SBA Preferred Lender ▪ During 2019, $38.4 million of SBA loans ( guaranteed portion) were sold which generated $3.0 million of revenue Loan Portfolio Loan Portfolio by Geography Loan Portfolio Composition Note: Data as of June 30, 2020, unless otherwise noted (1 ) Including the impact of PPP loans (2) Based on loans that mature after June 30, 2020 (3) Includes Alameda, Contra Costa, Solano, Napa, Sonoma, Marin, San Francisco, San Joaquin, San Mateo, and Santa Clara counties Commercial & Industrial 11% Paycheck Protection Program 7% Residential RE 11% Multifamily RE 15% Owner occupied CRE 23% Non - owner occupied CRE 30% Construction and land 3% Consumer and other 0% Loan Portfolio by Type ($ in thousands) Commercial & Industrial $182,956 Paycheck Protection Program 129,914 Residential RE 197,270 Multifamily RE 252,197 Owner occupied CRE 404,277 Non-owner occupied CRE 511,238 Construction and land 45,833 Consumer and other 5,561 Total Loans $1,729,246
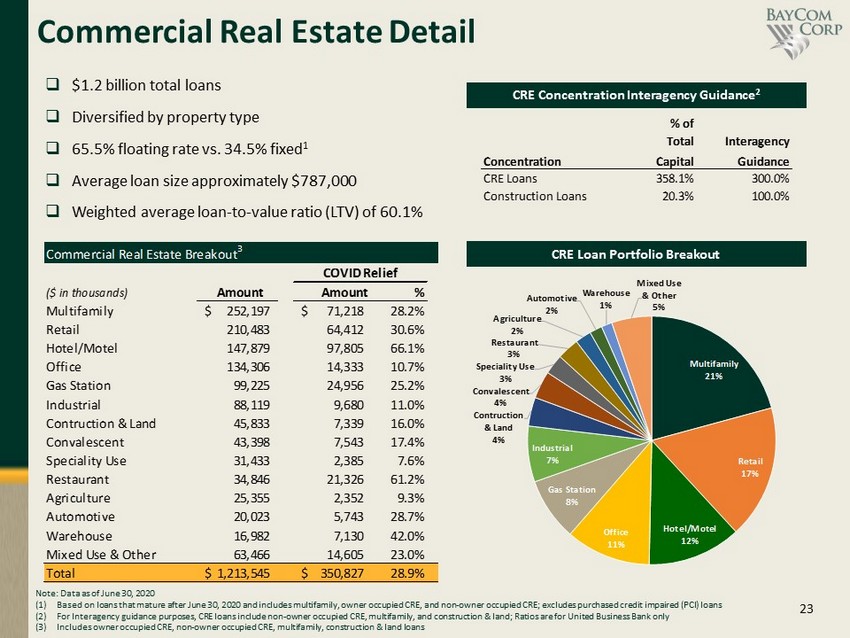
23 Commercial Real Estate Detail CRE Loan Portfolio Breakout □ $1.2 billion total loans □ Diversified by property type □ 65.5% floating rate vs. 34.5% fixed 1 □ Average loan size approximately $787,000 □ Weighted average loan - to - value ratio (LTV) of 60.1% CRE Concentration Interagency Guidance 2 Note: Data as of June 30, 2020 (1) Based on loans that mature after June 30, 2020 and includes multifamily, owner occupied CRE, and non - owner occupied CRE; excludes purchased credit impaired (PCI) loans (2) For Interagency guidance purposes, CRE loans include non - owner occupied CRE, multifamily, and construction & land; Ratios are for United Business Bank only (3) Includes owner occupied CRE, non - owner occupied CRE, multifamily, construction & land loans Multifamily 21% Retail 17% Hotel/Motel 12% Office 11% Gas Station 8% Industrial 7% Contruction & Land 4% Convalescent 4% Speciality Use 3% Restaurant 3% Agriculture 2% Automotive 2% Warehouse 1% Mixed Use & Other 5% Commercial Real Estate Breakout 3 ($ in thousands) Amount Amount % Multifamily 252,197$ 71,218$ 28.2% Retail 210,483 64,412 30.6% Hotel/Motel 147,879 97,805 66.1% Office 134,306 14,333 10.7% Gas Station 99,225 24,956 25.2% Industrial 88,119 9,680 11.0% Contruction & Land 45,833 7,339 16.0% Convalescent 43,398 7,543 17.4% Speciality Use 31,433 2,385 7.6% Restaurant 34,846 21,326 61.2% Agriculture 25,355 2,352 9.3% Automotive 20,023 5,743 28.7% Warehouse 16,982 7,130 42.0% Mixed Use & Other 63,466 14,605 23.0% Total 1,213,545$ 350,827$ 28.9% COVID Relief % of Total Interagency Concentration Capital Guidance CRE Loans 358.1% 300.0% Construction Loans 20.3% 100.0%
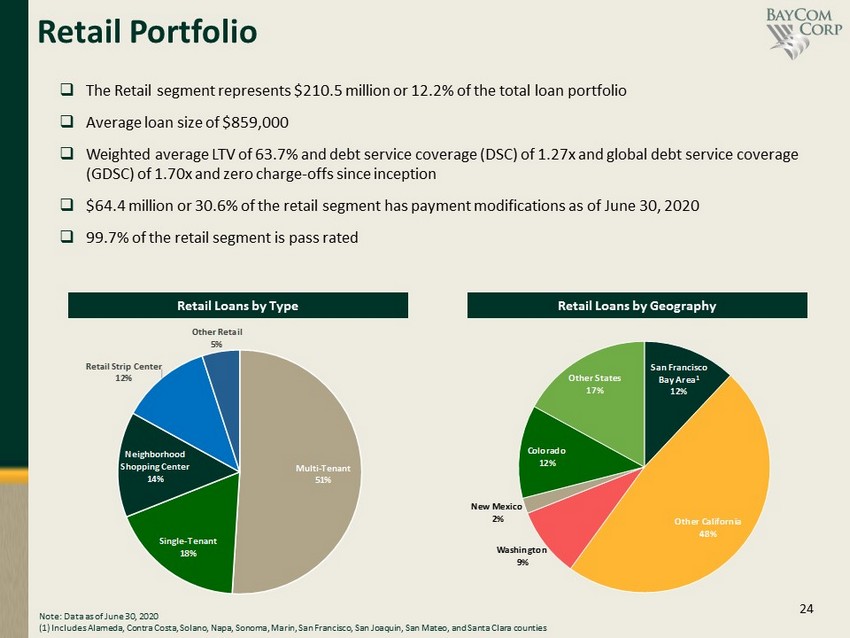
24 Multi - Tenant 51% Single - Tenant 18% Neighborhood Shopping Center 14% Retail Strip Center 12% Other Retail 5% Retail Portfolio □ The R etail segment represents $210.5 million or 12.2% of the total loan portfolio □ Average loan size of $859,000 □ Weighted average LTV of 63.7% and debt service coverage (DSC) of 1.27x and global debt service coverage (GDSC) of 1.70x and zero charge - offs since inception □ $64.4 million or 30.6% of the retail segment has payment modifications as of June 30, 2020 □ 99.7% of the retail segment is pass rated Retail Loans by Geography Retail Loans by Type San Francisco Bay Area 1 12% Other California 48% Washington 9% New Mexico 2% Colorado 12% Other States 17% Note: Data as of June 30, 2020 (1) Includes Alameda, Contra Costa, Solano, Napa, Sonoma, Marin, San Francisco, San Joaquin, San Mateo, and Santa Clara counties
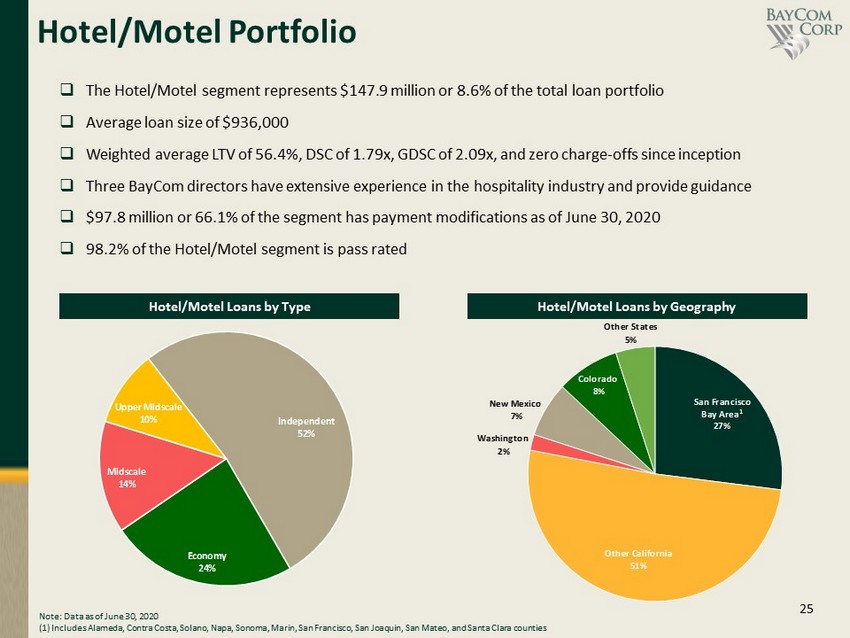
25 □ The Hotel/Motel segment represents $147.9 million or 8.6% of the total loan portfolio □ Average loan size of $936,000 □ Weighted average LTV of 56.4%, DSC of 1.79x, GDSC of 2.09x, and zero charge - offs since inception □ Three BayCom directors have extensive experience in the hospitality industry and provide guidance □ $97.8 million or 66.1% of the segment has payment modifications as of June 30, 2020 □ 98.2% of the Hotel/Motel segment is pass rated Hotel/Motel Portfolio Hotel/Motel Loans by Type Hotel/Motel Loans by Geography Independent 52% Economy 24% Midscale 14% Upper Midscale 10% San Francisco Bay Area 1 27% Other California 51% Washington 2% New Mexico 7% Colorado 8% Other States 5% Note: Data as of June 30, 2020 (1) Includes Alameda, Contra Costa, Solano, Napa, Sonoma, Marin, San Francisco, San Joaquin, San Mateo, and Santa Clara counties
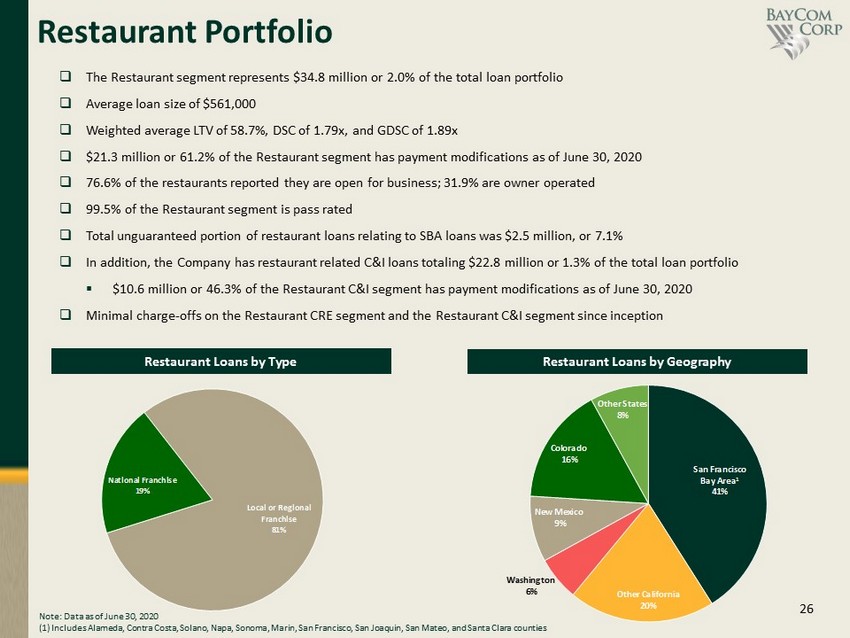
26 Local or Regional Franchise 81% National Franchise 19% San Francisco Bay Area 1 41% Other California 20% Washington 6% New Mexico 9% Colorado 16% Other States 8% □ The Restaurant segment represents $34.8 million or 2.0% of the total loan portfolio □ Average loan size of $561,000 □ Weighted average LTV of 58.7%, DSC of 1.79x, and GDSC of 1.89x □ $21.3 million or 61.2% of the Restaurant segment has payment modifications as of June 30, 2020 □ 76.6% of the restaurants reported they are open for business; 31.9% are owner operated □ 99.5% of the Restaurant segment is pass rated □ Total unguaranteed portion of restaurant loans relating to SBA loans was $2.5 million, or 7.1% □ In addition, the Company has restaurant related C&I loans totaling $22.8 million or 1.3% of the total loan portfolio ▪ $10.6 million or 46.3% of the Restaurant C&I segment has payment modifications as of June 30, 2020 □ Minimal charge - offs on the Restaurant CRE segment and the Restaurant C&I segment since inception Restaurant Portfolio Restaurant Loans by Type Restaurant Loans by Geography Note: Data as of June 30, 2020 (1) Includes Alameda, Contra Costa, Solano, Napa, Sonoma, Marin, San Francisco, San Joaquin, San Mateo, and Santa Clara counties
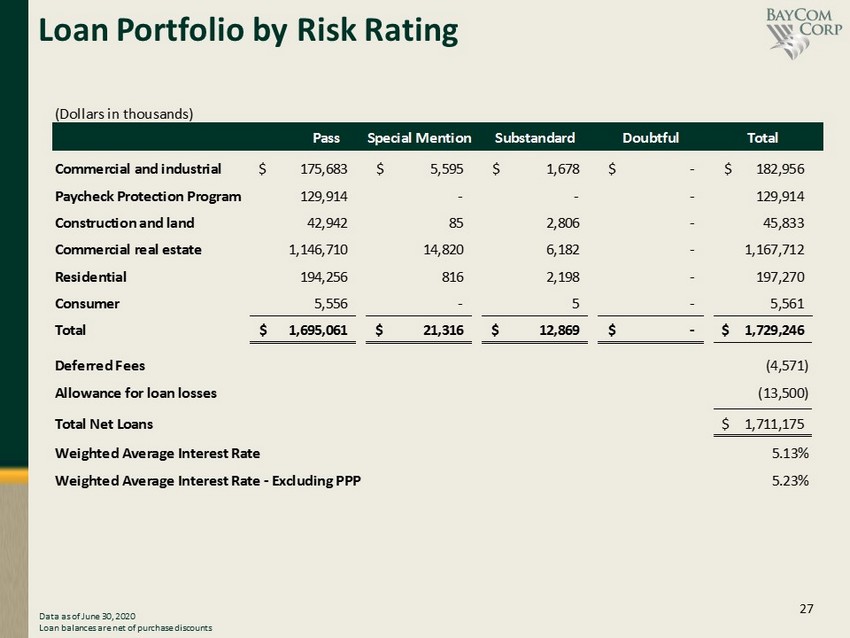
27 Loan Portfolio by Risk Rating Data as of June 30, 2020 Loan balances are net of purchase discounts (Dollars in thousands) Pass Special Mention Substandard Doubtful Total Commercial and industrial 175,683$ 5,595$ 1,678$ -$ 182,956$ Paycheck Protection Program 129,914 - - - 129,914 Construction and land 42,942 85 2,806 - 45,833 Commercial real estate 1,146,710 14,820 6,182 - 1,167,712 Residential 194,256 816 2,198 - 197,270 Consumer 5,556 - 5 - 5,561 Total 1,695,061$ 21,316$ 12,869$ -$ 1,729,246$ Deferred Fees (4,571) Allowance for loan losses (13,500) Total Net Loans 1,711,175$ Weighted Average Interest Rate 5.13% Weighted Average Interest Rate - Excluding PPP 5.23%

28 Funding & Liquidity
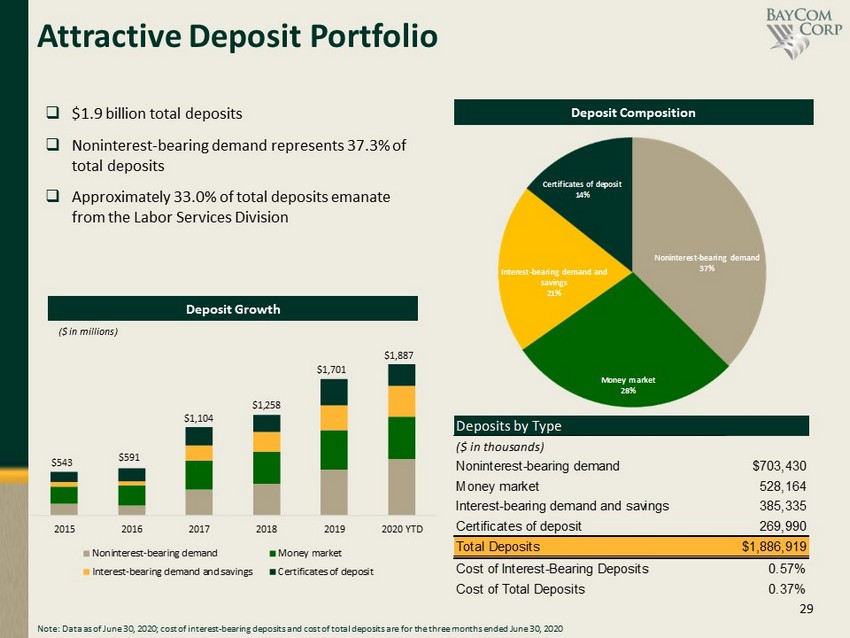
29 2015 2016 2017 2018 2019 2020 YTD Noninterest-bearing demand Money market Interest-bearing demand and savings Certificates of deposit $1,701 $1,258 $1,104 $591 $543 Noninterest - bearing demand 37% Money market 28% Interest - bearing demand and savings 21% Certificates of deposit 14% Attractive Deposit Portfolio Deposit Composition □ $1.9 billion total deposits □ Noninterest - bearing demand represents 37.3% of total deposits □ Approximately 33.0% of total deposits emanate from the Labor Services Division Note: Data as of June 30, 2020; cost of interest - bearing deposits and cost of total deposits are for the three months ended June 30, 2020 Deposit Growth ($ in millions) $ 1,887 Deposits by Type ($ in thousands) Noninterest-bearing demand $703,430 Money market 528,164 Interest-bearing demand and savings 385,335 Certificates of deposit 269,990 Total Deposits $1,886,919 Cost of Interest-Bearing Deposits 0.57% Cost of Total Deposits 0.37%
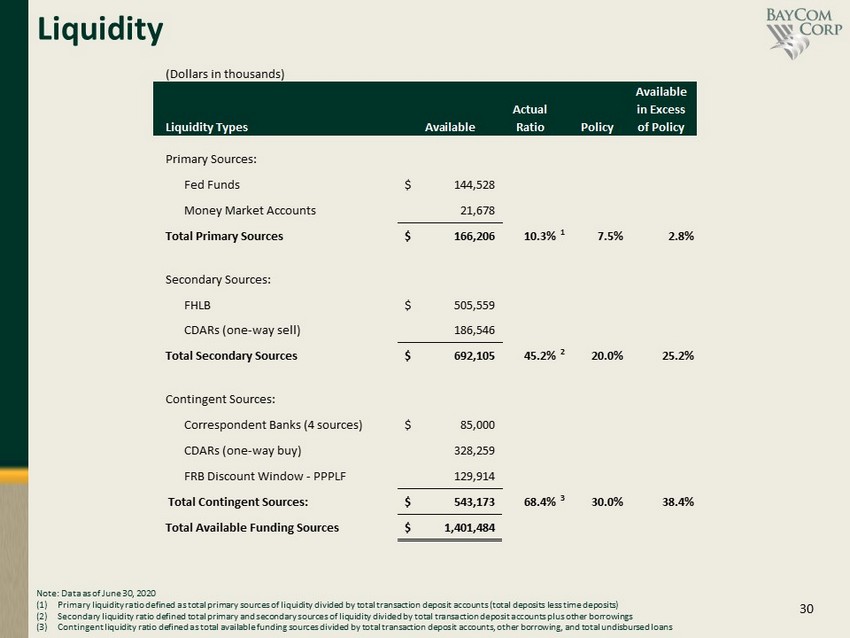
30 Liquidity (Dollars in thousands) Available Actual in Excess Liquidity Types Available Ratio Policy of Policy Primary Sources: Fed Funds 144,528$ Money Market Accounts 21,678 Total Primary Sources 166,206$ 10.3% 1 7.5% 2.8% Secondary Sources: FHLB 505,559$ CDARs (one-way sell) 186,546 Total Secondary Sources 692,105$ 45.2% 2 20.0% 25.2% Contingent Sources: Correspondent Banks (4 sources) 85,000$ CDARs (one-way buy) 328,259 FRB Discount Window - PPPLF 129,914 Total Contingent Sources: 543,173$ 68.4% 3 30.0% 38.4% Total Available Funding Sources 1,401,484$ Note: Data as of June 30, 2020 (1) Primary liquidity ratio defined as total primary sources of liquidity divided by total transaction deposit accounts (total de pos its less time deposits) (2) Secondary liquidity ratio defined total primary and secondary sources of liquidity divided by total transaction deposit accou nts plus other borrowings (3) Contingent liquidity ratio defined as total available funding sources divided by total transaction deposit accounts, other bo rro wing, and total undisbursed loans
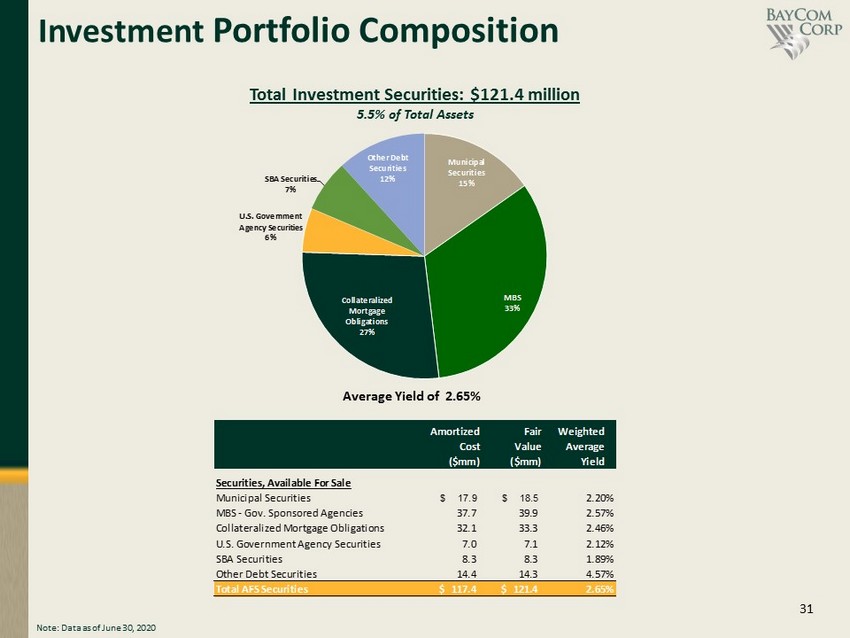
31 Investment Portfolio Composition Average Yield of 2.65 % Total Investment Securities: $121.4 million 5.5% of Total Assets Note: Data as of June 30, 2020 Municipal Securities 15% MBS 33% Collateralized Mortgage Obligations 27% U.S. Government Agency Securities 6% SBA Securities 7% Other Debt Securities 12% Amortized Fair Weighted Cost Value Average ($mm) ($mm) Yield Securities, Available For Sale Municipal Securities 17.9$ 18.5$ 2.20% MBS - Gov. Sponsored Agencies 37.7 39.9 2.57% Collateralized Mortgage Obligations 32.1 33.3 2.46% U.S. Government Agency Securities 7.0 7.1 2.12% SBA Securities 8.3 8.3 1.89% Other Debt Securities 14.4 14.3 4.57% Total AFS Securities 117.4$ 121.4$ 2.65%
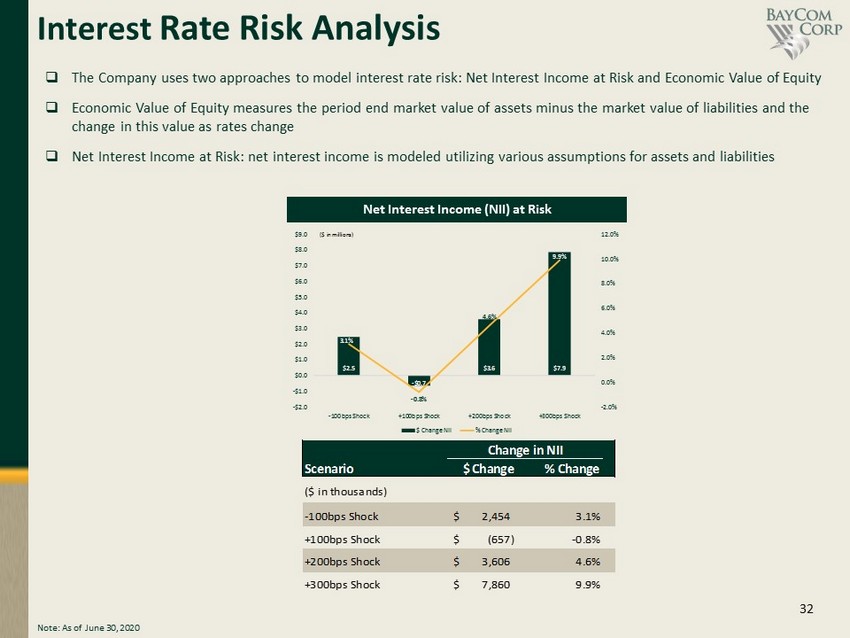
32 Interest Rate Risk Analysis Net Interest Income (NII) at Risk Note: As of June 30, 2020 □ The Company uses two approaches to model interest rate risk: Net Interest Income at Risk and Economic Value of Equity □ Economic Value of Equity measures the period end market value of assets minus the market value of liabilities and the change in this value as rates change □ Net Interest Income at Risk: net interest income is modeled utilizing various assumptions for assets and liabilities $2.5 - $0.7 $3.6 $7.9 3.1% - 0.8% 4.6% 9.9% -2.0% 0.0% 2.0% 4.0% 6.0% 8.0% 10.0% 12.0% -$2.0 -$1.0 $0.0 $1.0 $2.0 $3.0 $4.0 $5.0 $6.0 $7.0 $8.0 $9.0 -100bps Shock +100bps Shock +200bps Shock +300bps Shock $ Change NII % Change NII ($ in millions) Scenario $ Change % Change ($ in thousands) -100bps Shock 2,454$ 3.1% +100bps Shock (657)$ -0.8% +200bps Shock 3,606$ 4.6% +300bps Shock 7,860$ 9.9% Change in NII

33 Appendix: Non - GAAP Reconciliations
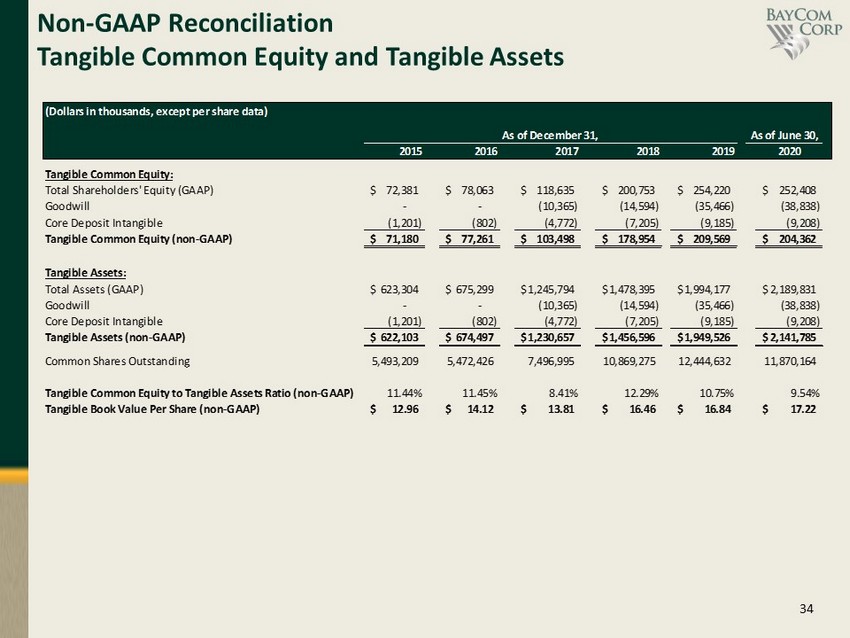
34 Non - GAAP Reconciliation Tangible Common Equity and Tangible Assets (Dollars in thousands, except per share data) 2015 2016 2017 2018 2019 2020 Tangible Common Equity: Total Shareholders' Equity (GAAP) 72,381$ 78,063$ 118,635$ 200,753$ 254,220$ 252,408$ Goodwill - - (10,365) (14,594) (35,466) (38,838) Core Deposit Intangible (1,201) (802) (4,772) (7,205) (9,185) (9,208) Tangible Common Equity (non-GAAP) 71,180$ 77,261$ 103,498$ 178,954$ 209,569$ 204,362$ Tangible Assets: Total Assets (GAAP) 623,304$ 675,299$ 1,245,794$ 1,478,395$ 1,994,177$ 2,189,831$ Goodwill - - (10,365) (14,594) (35,466) (38,838) Core Deposit Intangible (1,201) (802) (4,772) (7,205) (9,185) (9,208) Tangible Assets (non-GAAP) 622,103$ 674,497$ 1,230,657$ 1,456,596$ 1,949,526$ 2,141,785$ Common Shares Outstanding 5,493,209 5,472,426 7,496,995 10,869,275 12,444,632 11,870,164 Tangible Common Equity to Tangible Assets Ratio (non-GAAP) 11.44% 11.45% 8.41% 12.29% 10.75% 9.54% Tangible Book Value Per Share (non-GAAP) 12.96$ 14.12$ 13.81$ 16.46$ 16.84$ 17.22$ As of December 31, As of June 30,

35 Non - GAAP Reconciliation Adjusted Earnings Return on average tangible common equity is defined as net income (GAAP) divided by average tangible shareholders' equity (non - GAAP). Adjusted return on average tangible common equity is defined as total adjusted net income (non - GAAP) divided by average tangible shareholders' equity (non - GAAP) (Dollars in thousands, except per share data) 2015 2016 2017 2018 2019 2020 Net Income: Net Income (GAAP) 7,452$ 5,912$ 5,260$ 14,493$ 17,318$ 5,937$ Exclude bargain purchase gain (5,410) - - - - - Exclude death benefit payments - - - (777) - - Exclude net loss (gain) on sale of securities - - - (3) (4) - Exclude acqusition related costs 1,700 - 3,476 2,325 6,619 3,018 Exclude tax adjustments related to tax reform - - 2,681 - - - Exclude impairment of assets - - - 600 - - Related tax benefit 1,568 - (1,251) (1,172) (1,781) (763) Adjusted Net Income (non-GAAP) 5,310$ 5,912$ 10,166$ 15,466$ 22,151$ 8,192$ Return on Average Assets: Average Assets (GAAP) 603,025$ 649,743$ 1,026,701$ 1,321,088$ 1,714,854$ 2,124,740$ Return on Average Assets (GAAP) 1.24% 0.91% 0.51% 1.10% 1.01% 0.56% Adjusted Return on Average Assets (non-GAAP) 0.88% 0.91% 0.99% 1.17% 1.29% 0.78% Return on Average Equity: Average Equity (GAAP) 71,986$ 75,077$ 99,568$ 170,934$ 230,118$ 255,170$ Return on Average Equity (GAAP) 10.36% 7.87% 5.28% 8.48% 7.53% 4.69% Adjusted Return on Average Equity (non-GAAP) 7.38% 7.87% 10.21% 9.05% 9.63% 6.47% Return on Average Tangible Common Equity: Average Common Equity (GAAP) 71,986$ 75,077$ 99,568$ 170,934$ 230,118$ 255,170$ Average Intangibles 1,216 985 9,837 15,229 30,883 47,754 Average Tangible Common Equity (non-GAAP) 70,770 74,092 89,731 155,705 199,235 207,416 Return on Average Tangible Common Equity (non-GAAP) 10.53% 7.98% 5.86% 9.31% 8.69% 5.77% Adjusted Return on Average Tangible Common Equity (non-GAAP) 7.50% 7.98% 11.33% 9.93% 11.12% 7.96% Six Months For the Year Ended December 31, Ended June 30,
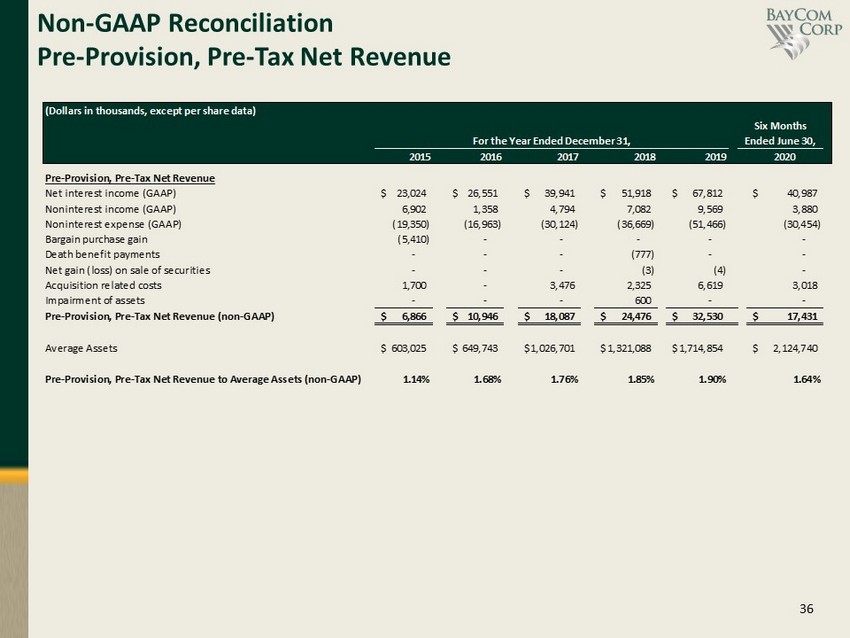
36 Non - GAAP Reconciliation Pre - Provision, Pre - Tax Net Revenue (Dollars in thousands, except per share data) 2015 2016 2017 2018 2019 2020 Pre-Provision, Pre-Tax Net Revenue Net interest income (GAAP) 23,024$ 26,551$ 39,941$ 51,918$ 67,812$ 40,987$ Noninterest income (GAAP) 6,902 1,358 4,794 7,082 9,569 3,880 Noninterest expense (GAAP) (19,350) (16,963) (30,124) (36,669) (51,466) (30,454) Bargain purchase gain (5,410) - - - - - Death benefit payments - - - (777) - - Net gain (loss) on sale of securities - - - (3) (4) - Acquisition related costs 1,700 - 3,476 2,325 6,619 3,018 Impairment of assets - - - 600 - - Pre-Provision, Pre-Tax Net Revenue (non-GAAP) 6,866$ 10,946$ 18,087$ 24,476$ 32,530$ 17,431$ Average Assets 603,025$ 649,743$ 1,026,701$ 1,321,088$ 1,714,854$ 2,124,740$ Pre-Provision, Pre-Tax Net Revenue to Average Assets (non-GAAP) 1.14% 1.68% 1.76% 1.85% 1.90% 1.64% Six Months For the Year Ended December 31, Ended June 30,
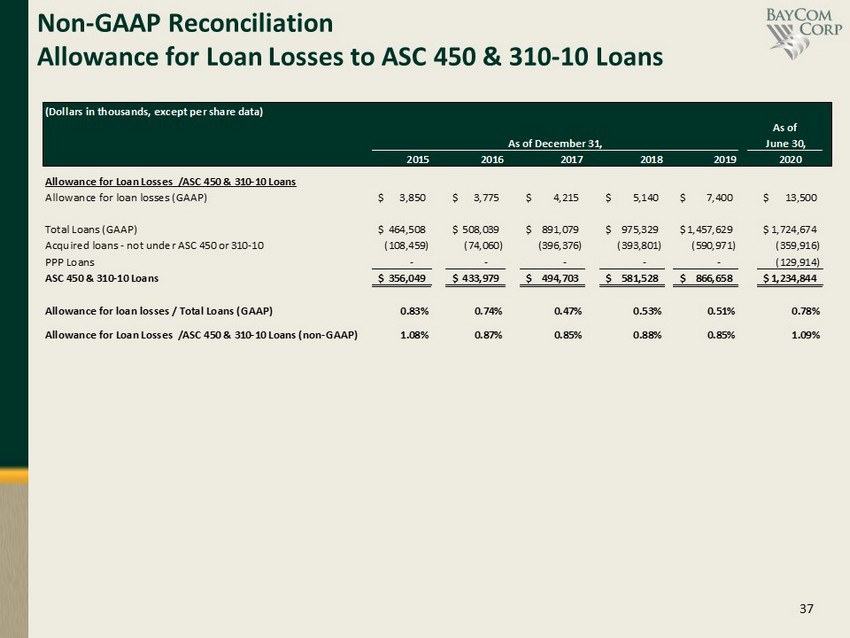
37 Non - GAAP Reconciliation Allowance for Loan Losses to ASC 450 & 310 - 10 Loans (Dollars in thousands, except per share data) 2015 2016 2017 2018 2019 2020 Allowance for Loan Losses /ASC 450 & 310-10 Loans Allowance for loan losses (GAAP) 3,850$ 3,775$ 4,215$ 5,140$ 7,400$ 13,500$ Total Loans (GAAP) 464,508$ 508,039$ 891,079$ 975,329$ 1,457,629$ 1,724,674$ Acquired loans - not under ASC 450 or 310-10 (108,459) (74,060) (396,376) (393,801) (590,971) (359,916) PPP Loans - - - - - (129,914) ASC 450 & 310-10 Loans 356,049$ 433,979$ 494,703$ 581,528$ 866,658$ 1,234,844$ Allowance for loan losses / Total Loans (GAAP) 0.83% 0.74% 0.47% 0.53% 0.51% 0.78% Allowance for Loan Losses /ASC 450 & 310-10 Loans (non-GAAP) 1.08% 0.87% 0.85% 0.88% 0.85% 1.09% As of As of December 31, June 30,