Attached files
| file | filename |
|---|---|
| EX-99.2 - EX-99.2 FINANCIAL SUPPLEMENT THIRD QUARTER FISCAL YEAR 2020 OF RJF - RAYMOND JAMES FINANCIAL INC | rjf20200630q320supplem.htm |
| EX-99.1 - EX-99.1 PRESS RELEASE DATED JULY 29, 2020 - RAYMOND JAMES FINANCIAL INC | rjf20200630q320earnings.htm |
| 8-K - 8-K - RAYMOND JAMES FINANCIAL INC | rjf-20200729.htm |

FISCAL 3Q20 RESULTS July 29, 2020
FISCAL 3Q20 OVERVIEW Paul Reilly Chairman & CEO, Raymond James Financial 2
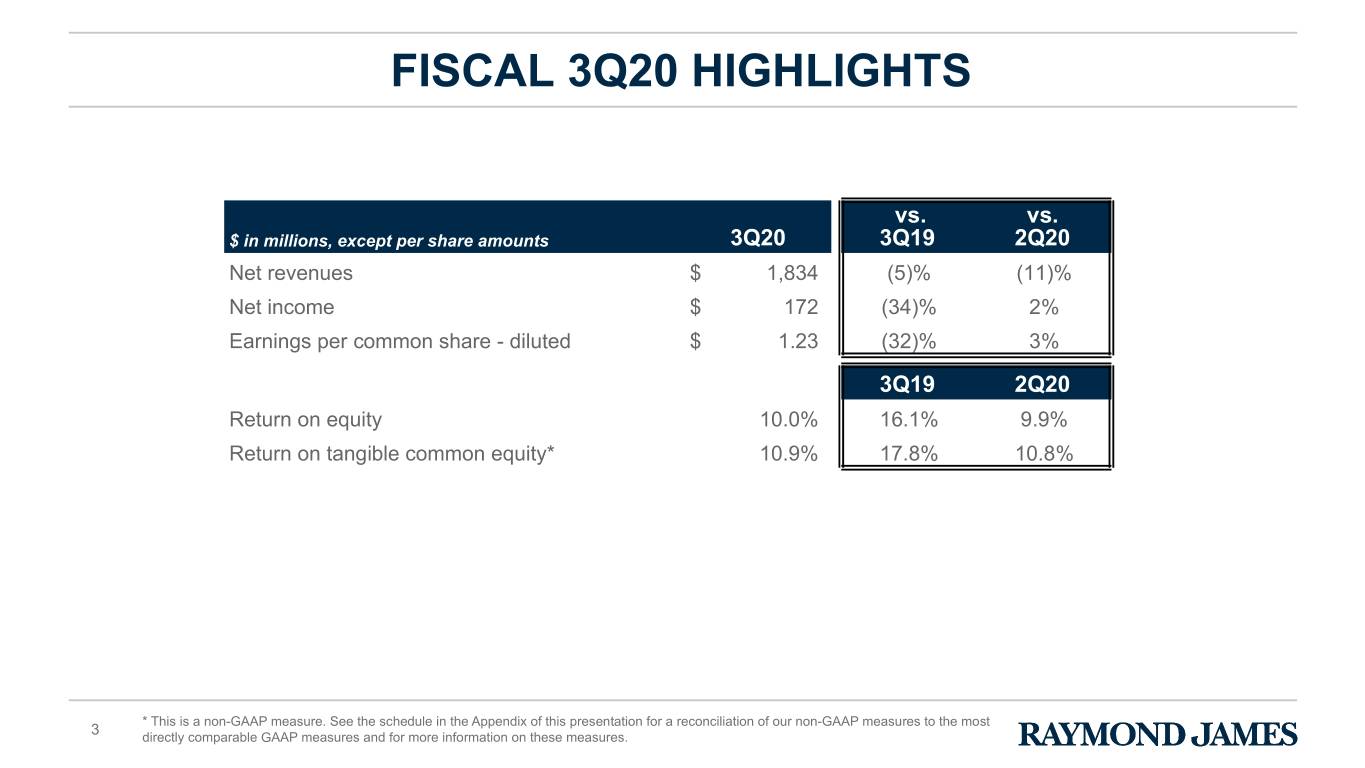
FISCAL 3Q20 HIGHLIGHTS vs. vs. $ in millions, except per share amounts 3Q20 3Q19 2Q20 Net revenues $ 1,834 (5)% (11)% Net income $ 172 (34)% 2% Earnings per common share - diluted $ 1.23 (32)% 3% 3Q19 2Q20 Return on equity 10.0 % 16.1% 9.9% Return on tangible common equity* 10.9 % 17.8% 10.8% * This is a non-GAAP measure. See the schedule in the Appendix of this presentation for a reconciliation of our non-GAAP measures to the most 3 directly comparable GAAP measures and for more information on these measures.
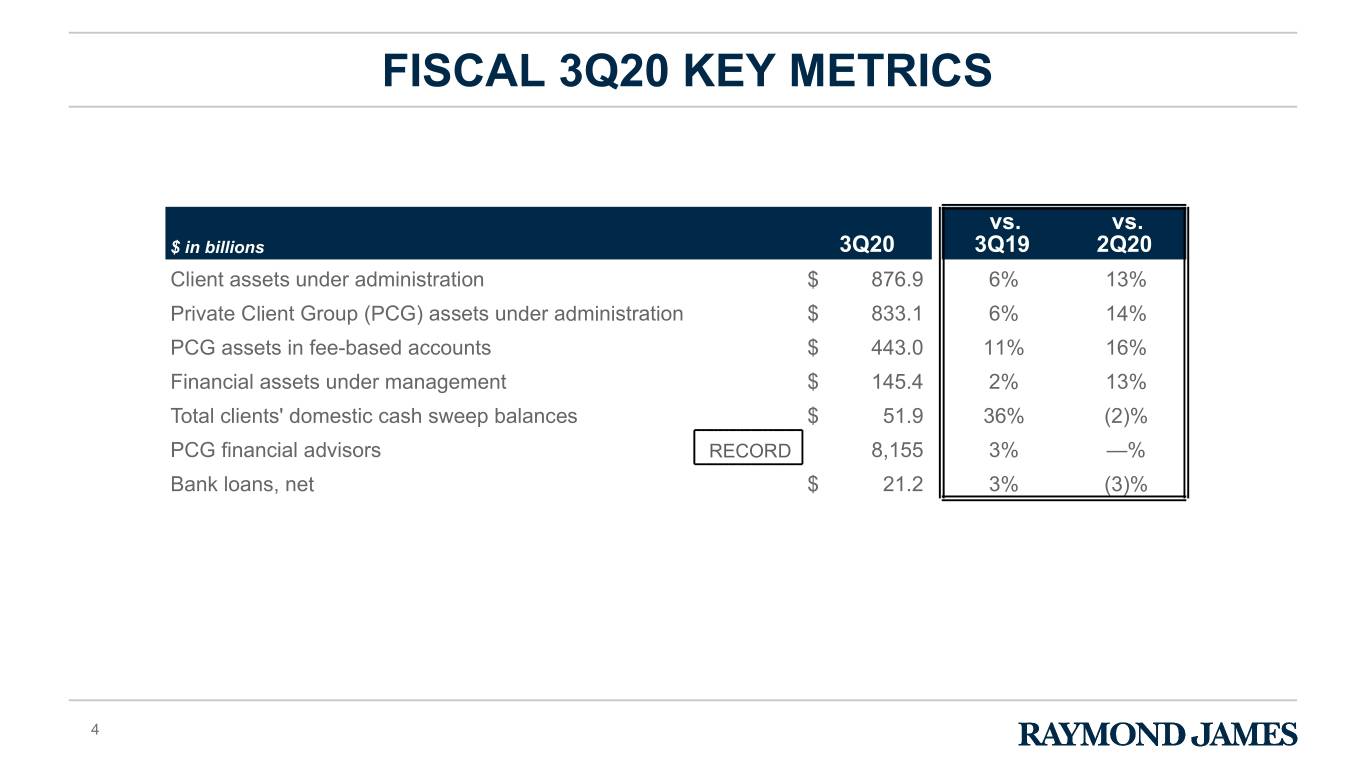
FISCAL 3Q20 KEY METRICS vs. vs. $ in billions 3Q20 3Q19 2Q20 Client assets under administration $ 876.9 6% 13% Private Client Group (PCG) assets under administration $ 833.1 6% 14% PCG assets in fee-based accounts $ 443.0 11% 16% Financial assets under management $ 145.4 2% 13% Total clients' domestic cash sweep balances $ 51.9 36% (2)% PCG financial advisors RECORD 8,155 3% —% Bank loans, net $ 21.2 3% (3)% 4
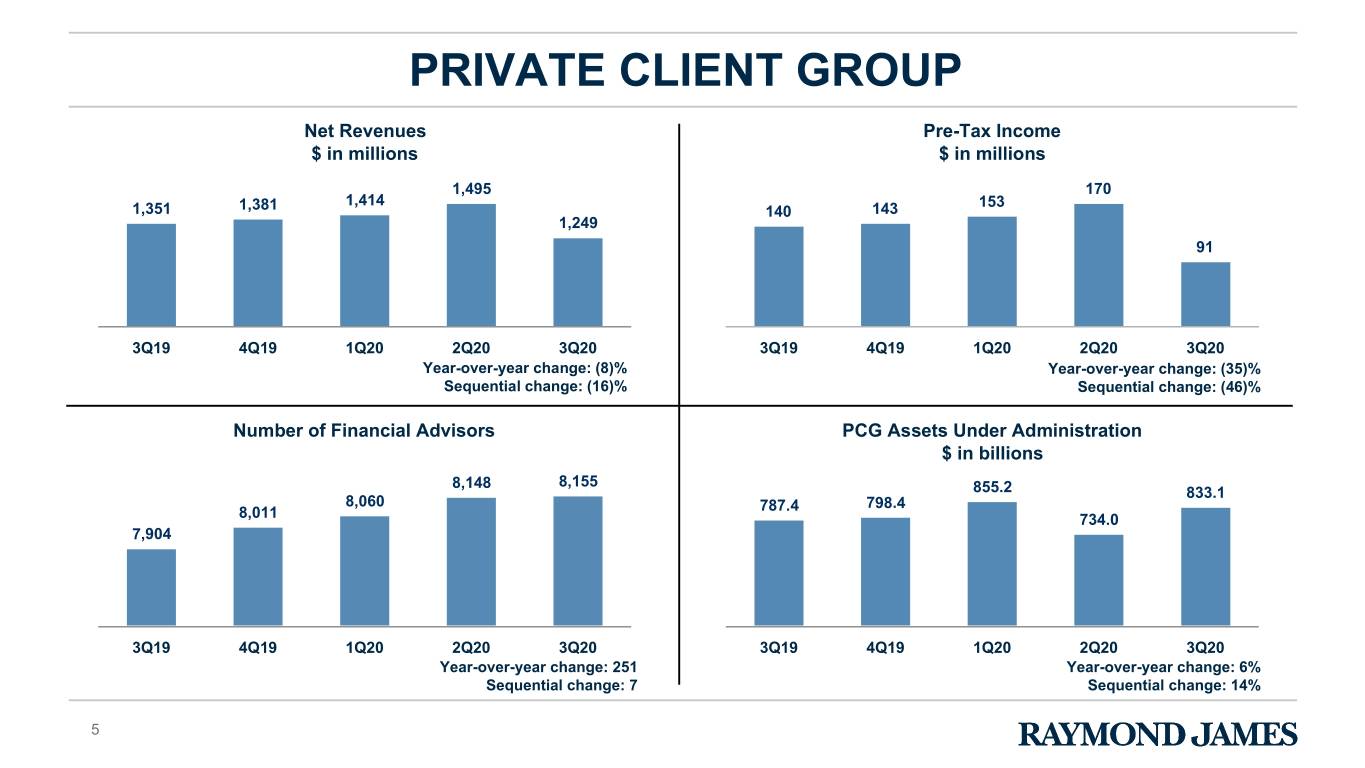
PRIVATE CLIENT GROUP Net Revenues Pre-Tax Income $ in millions $ in millions 1,495 170 1,414 153 1,351 1,381 140 143 1,249 91 3Q19 4Q19 1Q20 2Q20 3Q20 3Q19 4Q19 1Q20 2Q20 3Q20 Year-over-year change: (8)% Year-over-year change: (35)% Sequential change: (16)% Sequential change: (46)% Number of Financial Advisors PCG Assets Under Administration $ in billions 8,148 8,155 855.2 833.1 8,060 787.4 798.4 8,011 734.0 7,904 3Q19 4Q19 1Q20 2Q20 3Q20 3Q19 4Q19 1Q20 2Q20 3Q20 Year-over-year change: 251 Year-over-year change: 6% Sequential change: 7 Sequential change: 14% 5
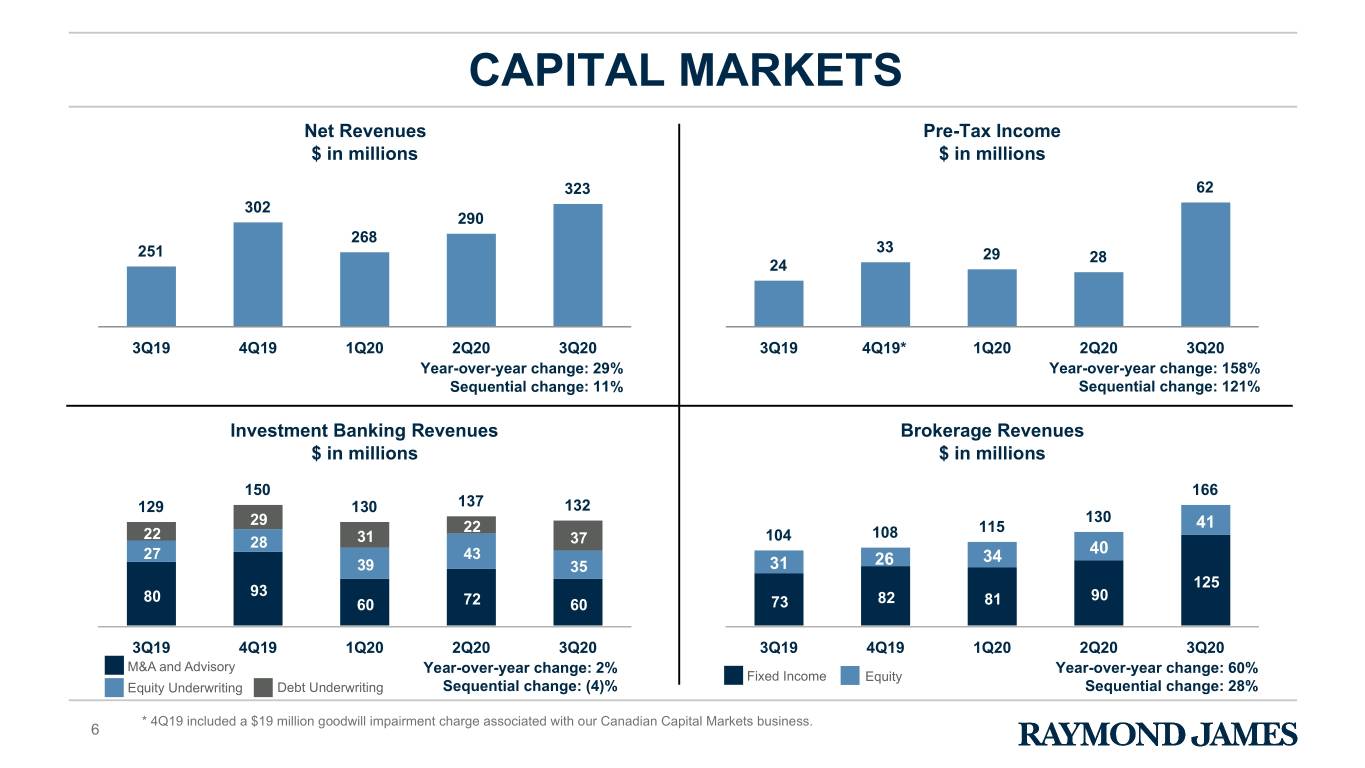
CAPITAL MARKETS Net Revenues Pre-Tax Income $ in millions $ in millions 323 62 302 290 268 33 251 29 28 24 3Q19 4Q19 1Q20 2Q20 3Q20 3Q19 4Q19* 1Q20 2Q20 3Q20 Year-over-year change: 29% Year-over-year change: 158% Sequential change: 11% Sequential change: 121% Investment Banking Revenues Brokerage Revenues $ in millions $ in millions 150 166 129 130 137 132 130 29 41 22 115 108 22 31 37 104 28 40 27 43 26 34 39 35 31 125 93 90 80 82 72 81 60 60 73 3Q19 4Q19 1Q20 2Q20 3Q20 3Q19 4Q19 1Q20 2Q20 3Q20 M&A and Advisory Year-over-year change: 2% Year-over-year change: 60% Fixed Income Equity Equity Underwriting Debt Underwriting Sequential change: (4)% Sequential change: 28% * 4Q19 included a $19 million goodwill impairment charge associated with our Canadian Capital Markets business. 6
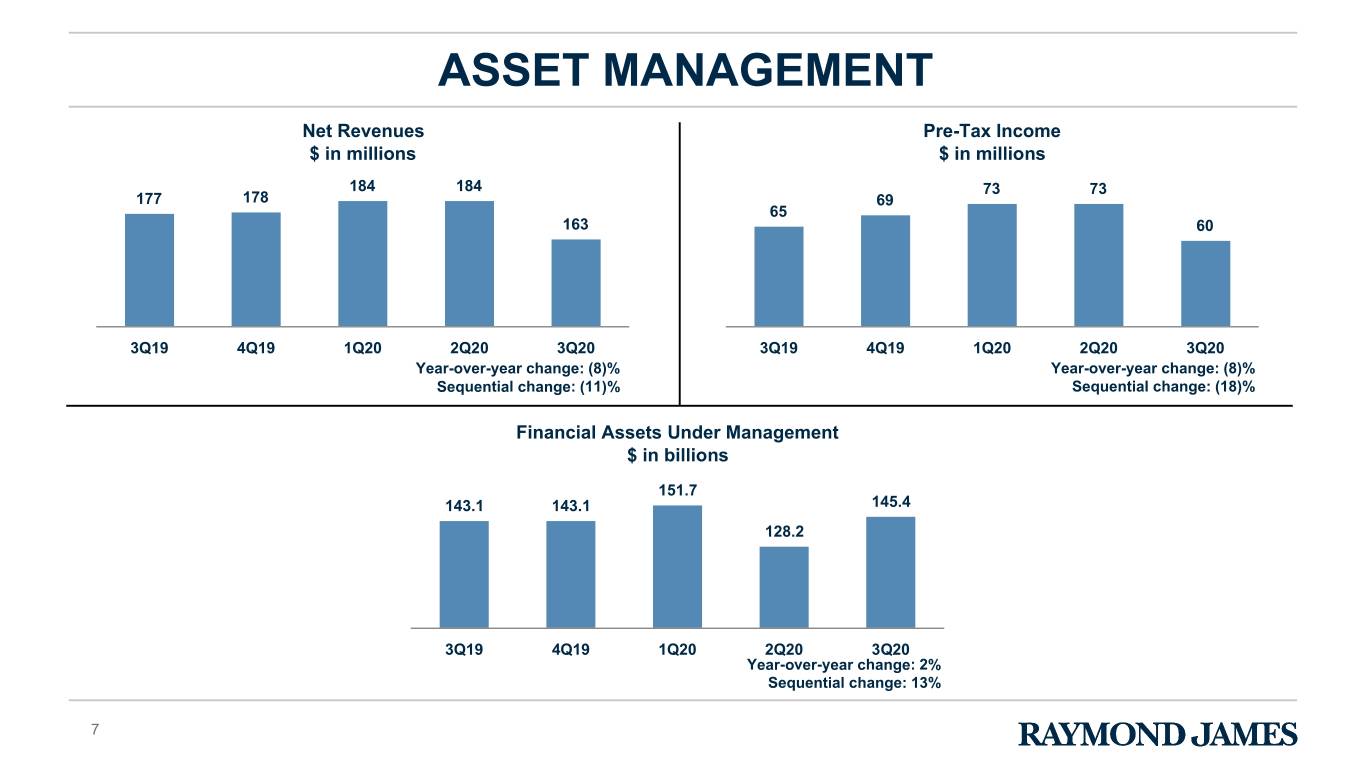
ASSET MANAGEMENT Net Revenues Pre-Tax Income $ in millions $ in millions 184 184 73 73 177 178 69 65 163 60 3Q19 4Q19 1Q20 2Q20 3Q20 3Q19 4Q19 1Q20 2Q20 3Q20 Year-over-year change: (8)% Year-over-year change: (8)% Sequential change: (11)% Sequential change: (18)% Financial Assets Under Management $ in billions 151.7 143.1 143.1 145.4 128.2 3Q19 4Q19 1Q20 2Q20 3Q20 Year-over-year change: 2% Sequential change: 13% 7
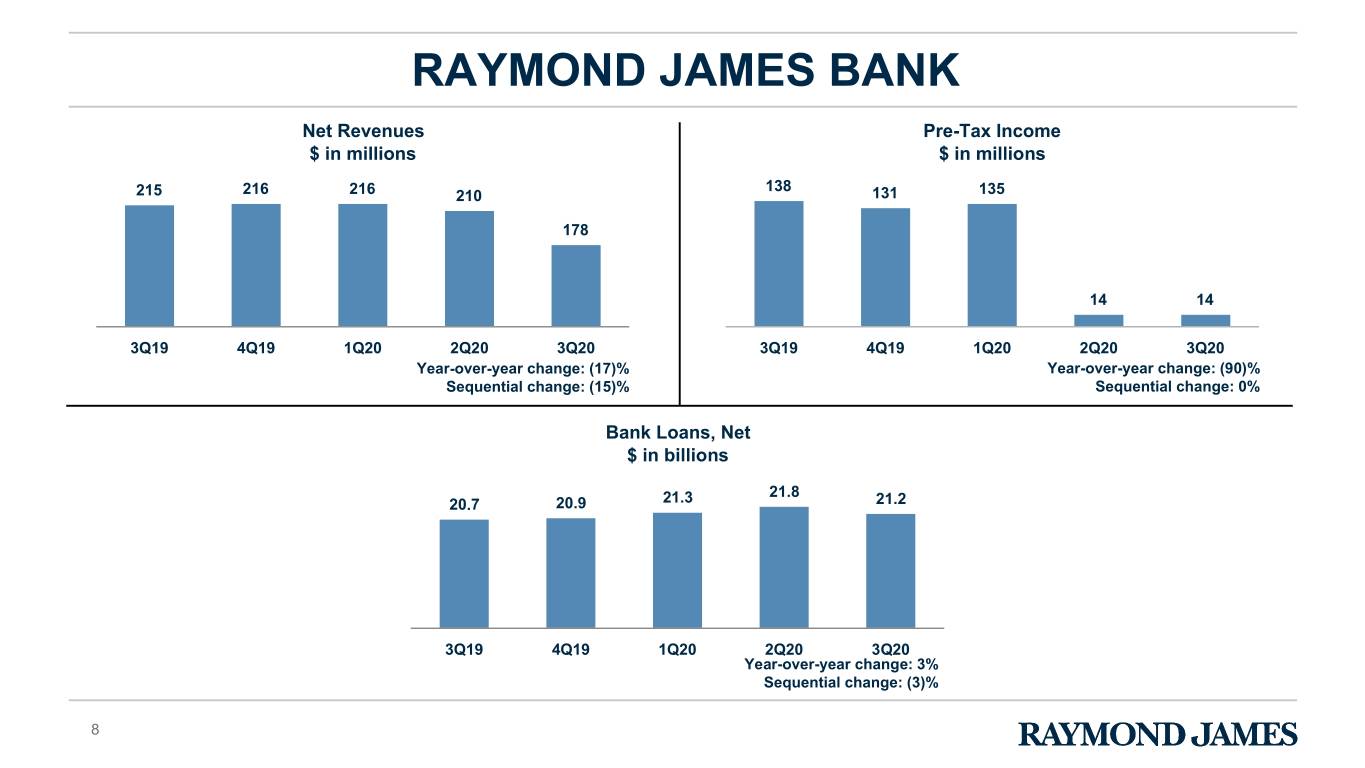
RAYMOND JAMES BANK Net Revenues Pre-Tax Income $ in millions $ in millions 138 215 216 216 210 131 135 178 14 14 3Q19 4Q19 1Q20 2Q20 3Q20 3Q19 4Q19 1Q20 2Q20 3Q20 Year-over-year change: (17)% Year-over-year change: (90)% Sequential change: (15)% Sequential change: 0% Bank Loans, Net $ in billions 21.8 20.7 20.9 21.3 21.2 3Q19 4Q19 1Q20 2Q20 3Q20 Year-over-year change: 3% Sequential change: (3)% 8
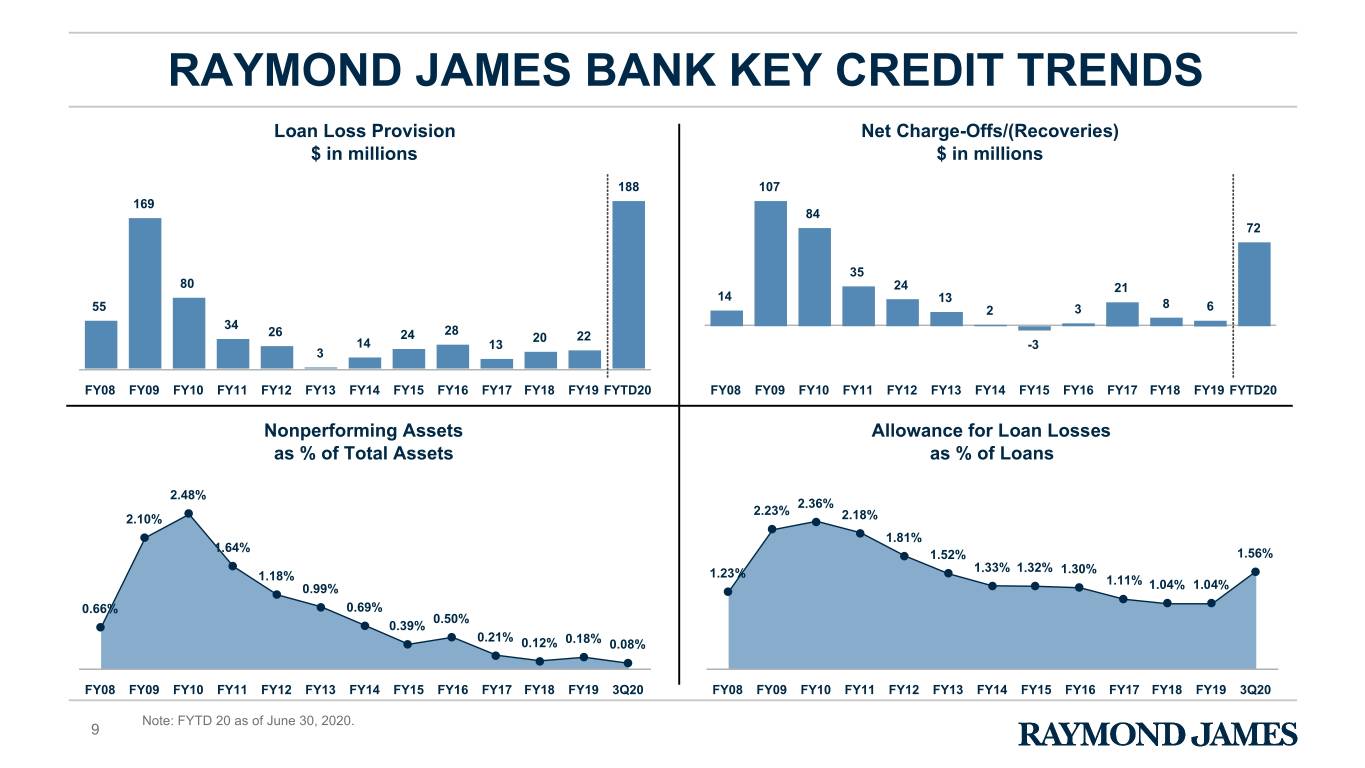
RAYMOND JAMES BANK KEY CREDIT TRENDS Loan Loss Provision Net Charge-Offs/(Recoveries) $ in millions $ in millions 188 107 169 84 72 35 80 24 21 14 13 8 55 2 3 6 34 26 28 24 20 22 14 13 -3 3 FY08 FY09 FY10 FY11 FY12 FY13 FY14 FY15 FY16 FY17 FY18 FY19 FYTD20 FY08 FY09 FY10 FY11 FY12 FY13 FY14 FY15 FY16 FY17 FY18 FY19 FYTD20 Nonperforming Assets Allowance for Loan Losses as % of Total Assets as % of Loans 2.48% 2.36% 2.23% 2.10% 2.18% 1.81% 1.64% 1.52% 1.56% 1.23% 1.33% 1.32% 1.30% 1.18% 1.11% 0.99% 1.04% 1.04% 0.66% 0.69% 0.50% 0.39% 0.21% 0.12% 0.18% 0.08% FY08 FY09 FY10 FY11 FY12 FY13 FY14 FY15 FY16 FY17 FY18 FY19 3Q20 FY08 FY09 FY10 FY11 FY12 FY13 FY14 FY15 FY16 FY17 FY18 FY19 3Q20 Note: FYTD 20 as of June 30, 2020. 9
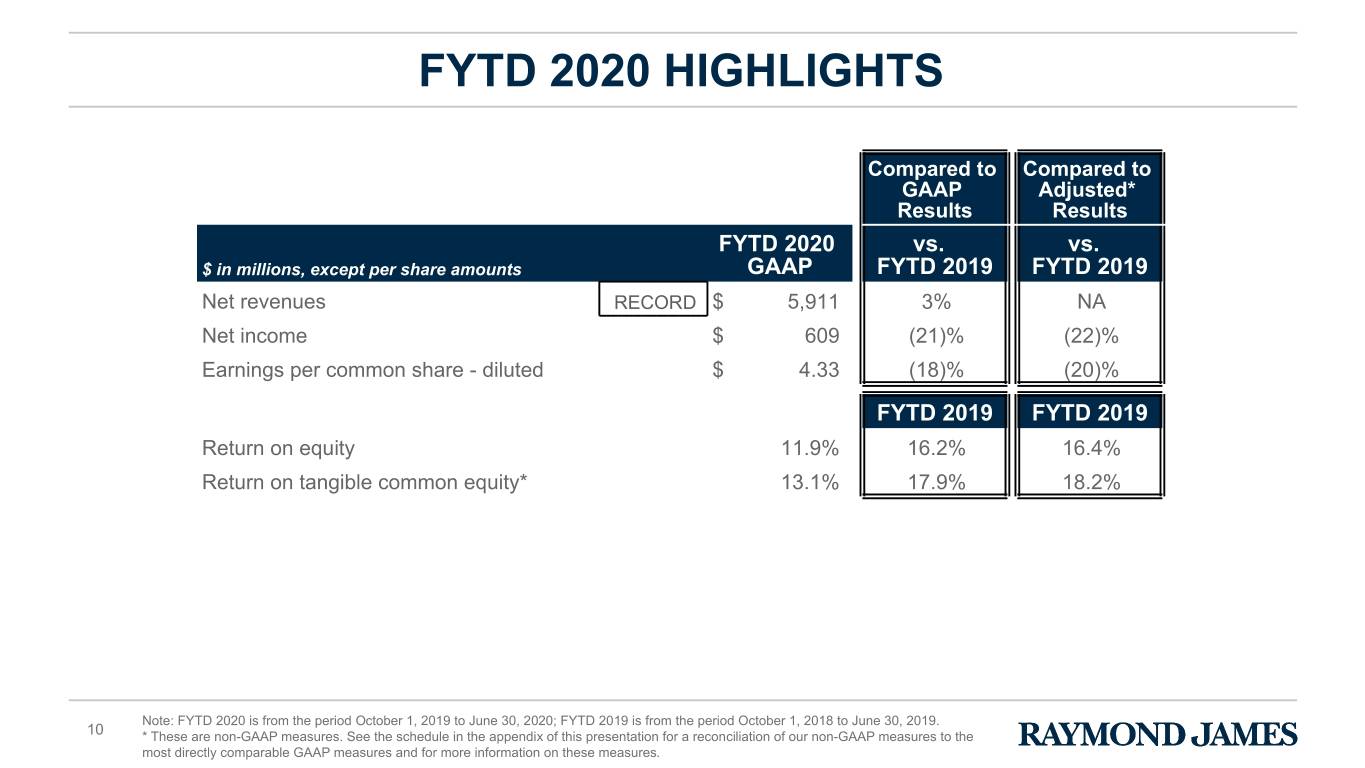
FYTD 2020 HIGHLIGHTS Compared to Compared to GAAP Adjusted* Results Results FYTD 2020 vs. vs. $ in millions, except per share amounts GAAP FYTD 2019 FYTD 2019 Net revenues RECORD $ 5,911 3% NA Net income $ 609 (21)% (22)% Earnings per common share - diluted $ 4.33 (18)% (20)% FYTD 2019 FYTD 2019 Return on equity 11.9 % 16.2% 16.4% Return on tangible common equity* 13.1 % 17.9% 18.2% Note: FYTD 2020 is from the period October 1, 2019 to June 30, 2020; FYTD 2019 is from the period October 1, 2018 to June 30, 2019. 10 * These are non-GAAP measures. See the schedule in the appendix of this presentation for a reconciliation of our non-GAAP measures to the most directly comparable GAAP measures and for more information on these measures.
FINANCIAL REVIEW Paul Shoukry Chief Financial Officer, Raymond James Financial 11
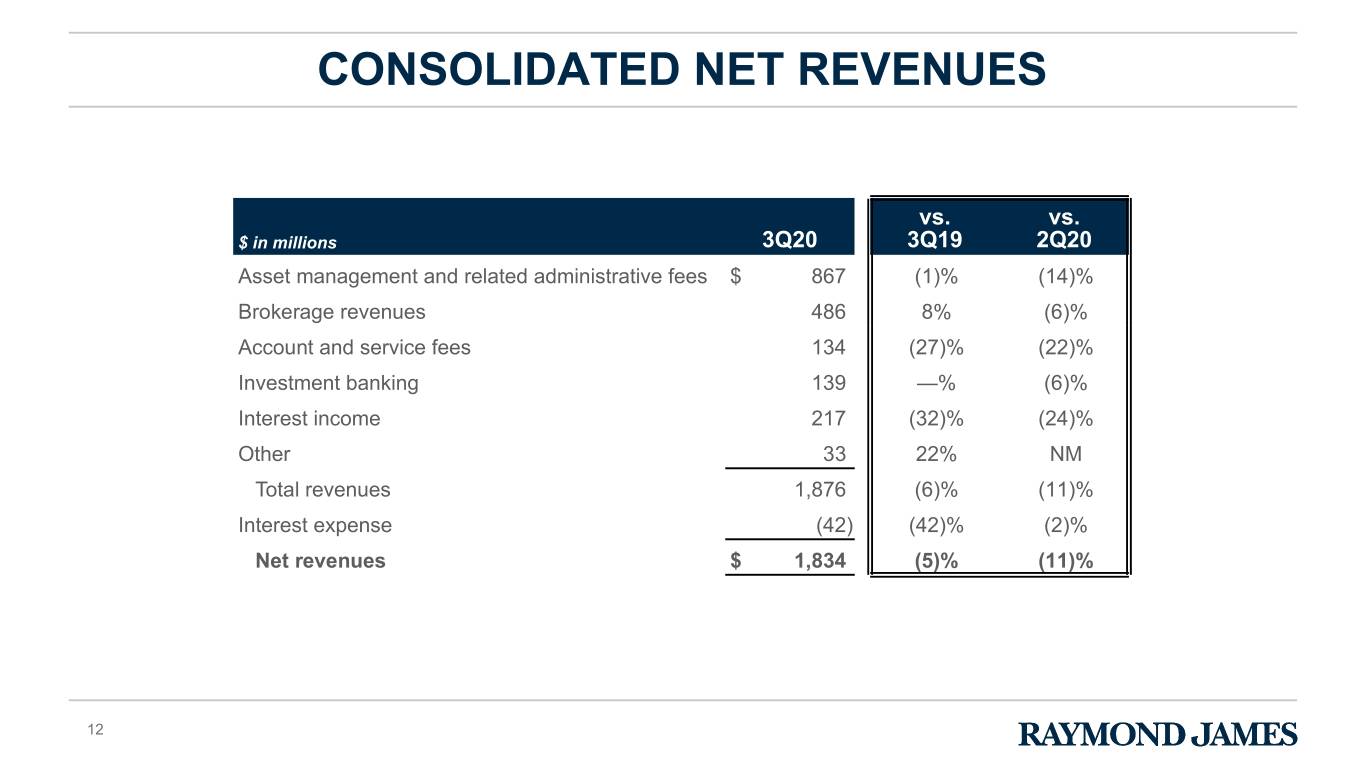
CONSOLIDATED NET REVENUES vs. vs. $ in millions 3Q20 3Q19 2Q20 Asset management and related administrative fees $ 867 (1)% (14)% Brokerage revenues 486 8% (6)% Account and service fees 134 (27)% (22)% Investment banking 139 —% (6)% Interest income 217 (32)% (24)% Other 33 22% NM Total revenues 1,876 (6)% (11)% Interest expense (42) (42)% (2)% Net revenues $ 1,834 (5)% (11)% 12
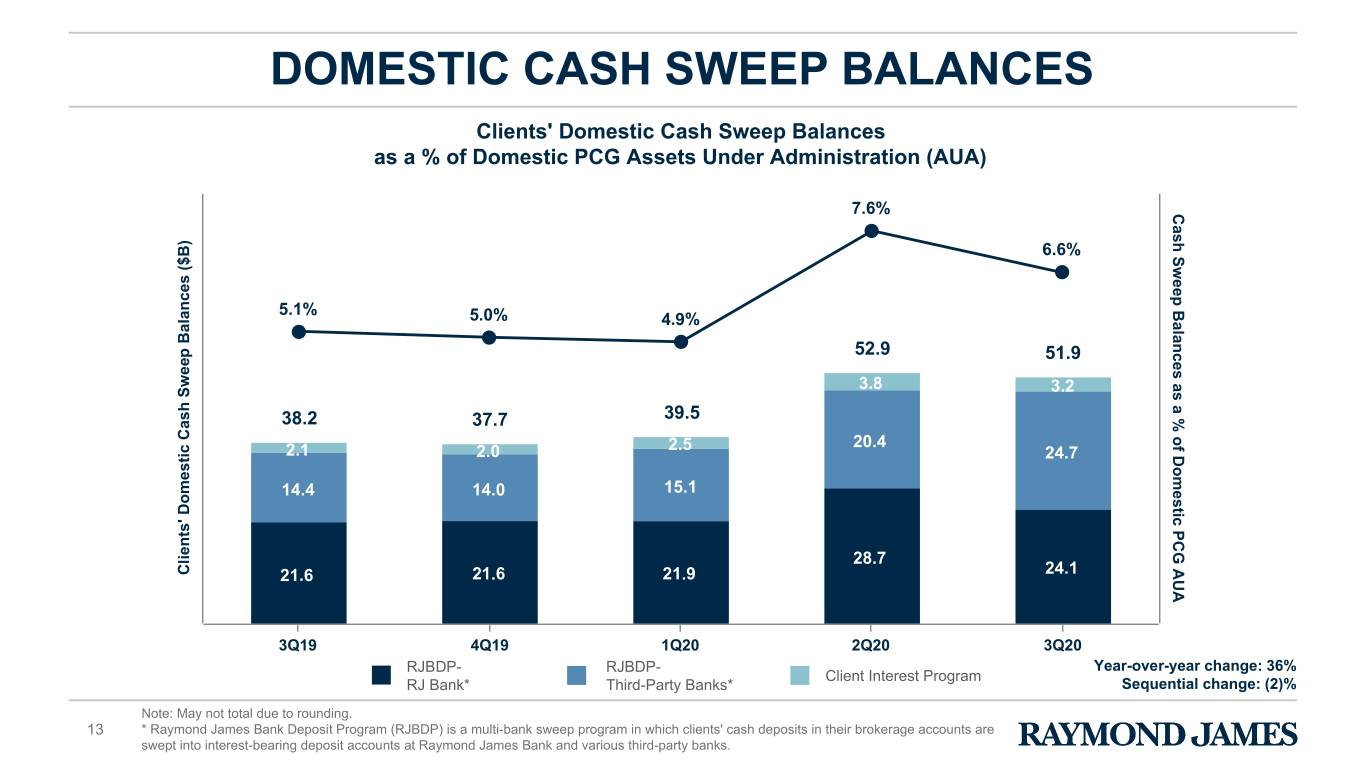
DOMESTIC CASH SWEEP BALANCES Clients' Domestic Cash Sweep Balances as a % of Domestic PCG Assets Under Administration (AUA) 7.6% Ca sh Sweep Balances as a % of Domestic PCG AUA 6.6% 5.1% 5.0% 4.9% 52.9 51.9 3.8 3.2 38.2 37.7 39.5 20.4 2.1 2.0 2.5 24.7 14.4 14.0 15.1 28.7 Cl ients' Domestic Cash Sweep Balances ($B) 21.6 21.6 21.9 24.1 3Q19 4Q19 1Q20 2Q20 3Q20 RJBDP- RJBDP- Year-over-year change: 36% Client Interest Program RJ Bank* Third-Party Banks* Sequential change: (2)% Note: May not total due to rounding. 13 * Raymond James Bank Deposit Program (RJBDP) is a multi-bank sweep program in which clients' cash deposits in their brokerage accounts are swept into interest-bearing deposit accounts at Raymond James Bank and various third-party banks.
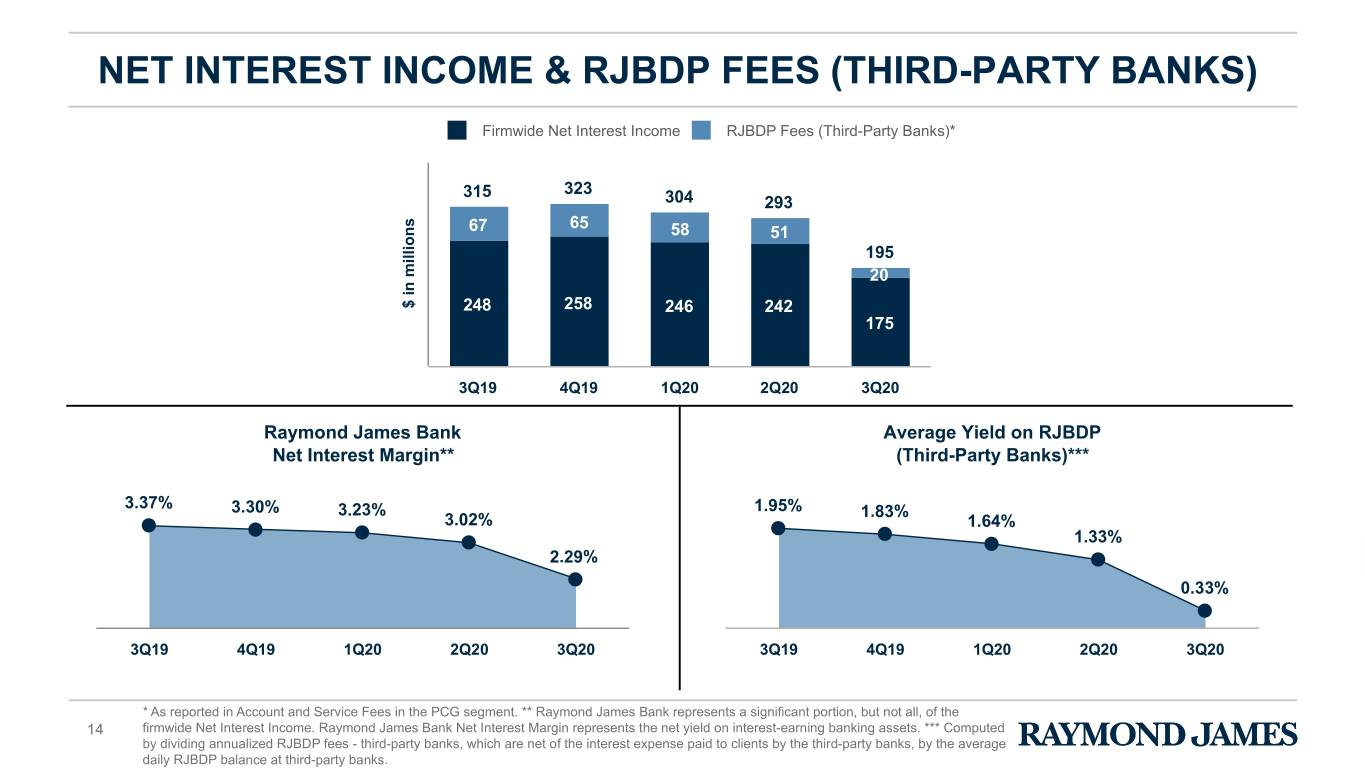
NET INTEREST INCOME & RJBDP FEES (THIRD-PARTY BANKS) Firmwide Net Interest Income RJBDP Fees (Third-Party Banks)* 315 323 304 293 67 65 58 51 195 20 $ in millions 248 258 246 242 175 3Q19 4Q19 1Q20 2Q20 3Q20 Raymond James Bank Average Yield on RJBDP Net Interest Margin** (Third-Party Banks)*** 3.37% 3.30% 3.23% 1.95% 1.83% 3.02% 1.64% 1.33% 2.29% 0.33% 3Q19 4Q19 1Q20 2Q20 3Q20 3Q19 4Q19 1Q20 2Q20 3Q20 * As reported in Account and Service Fees in the PCG segment. ** Raymond James Bank represents a significant portion, but not all, of the 14 firmwide Net Interest Income. Raymond James Bank Net Interest Margin represents the net yield on interest-earning banking assets. *** Computed by dividing annualized RJBDP fees - third-party banks, which are net of the interest expense paid to clients by the third-party banks, by the average daily RJBDP balance at third-party banks.
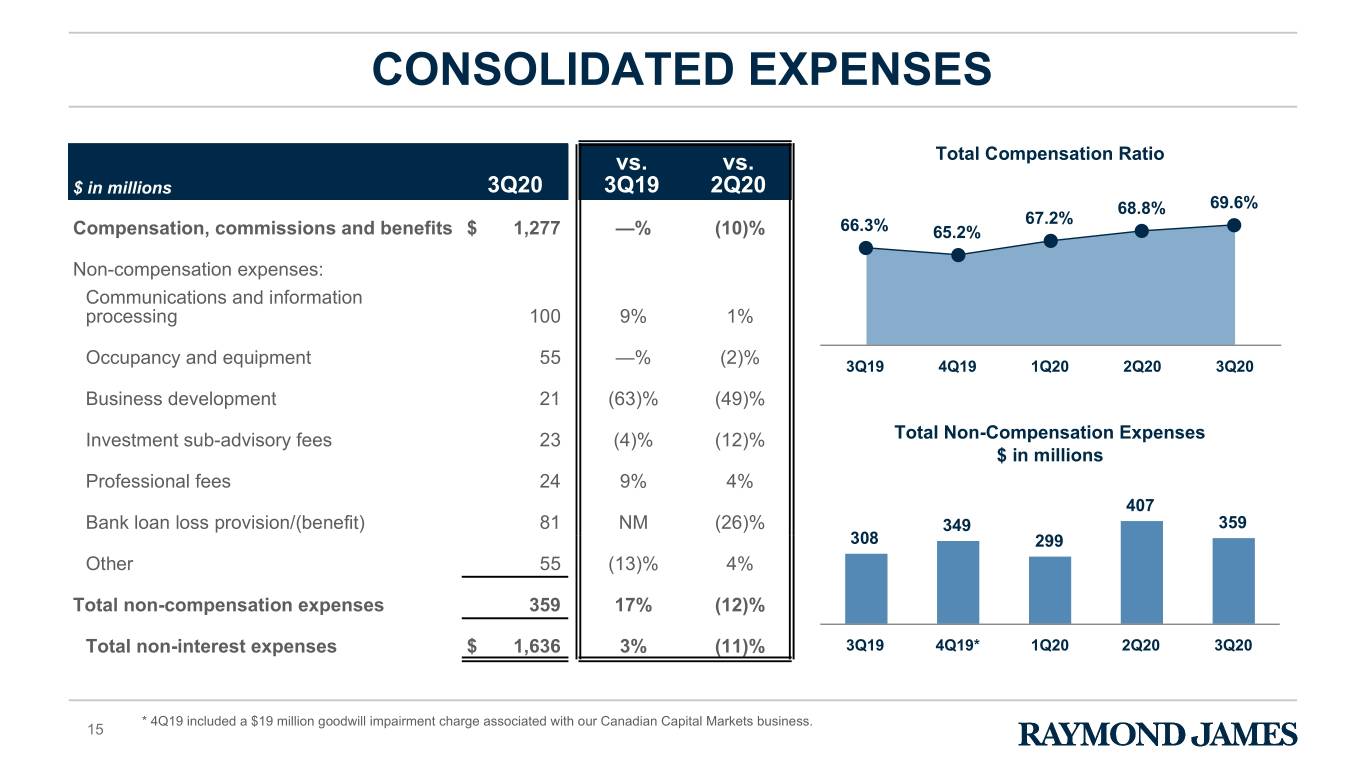
CONSOLIDATED EXPENSES vs. vs. Total Compensation Ratio $ in millions 3Q20 3Q19 2Q20 68.8% 69.6% 67.2% Compensation, commissions and benefits $ 1,277 —% (10)% 66.3% 65.2% Non-compensation expenses: Communications and information processing 100 9% 1% Occupancy and equipment 55 —% (2)% 3Q19 4Q19 1Q20 2Q20 3Q20 Business development 21 (63)% (49)% Investment sub-advisory fees 23 (4)% (12)% Total Non-Compensation Expenses $ in millions Professional fees 24 9% 4% 407 Bank loan loss provision/(benefit) 81 NM (26)% 349 359 308 299 Other 55 (13)% 4% Total non-compensation expenses 359 17% (12)% Total non-interest expenses $ 1,636 3% (11)% 3Q19 4Q19* 1Q20 2Q20 3Q20 * 4Q19 included a $19 million goodwill impairment charge associated with our Canadian Capital Markets business. 15
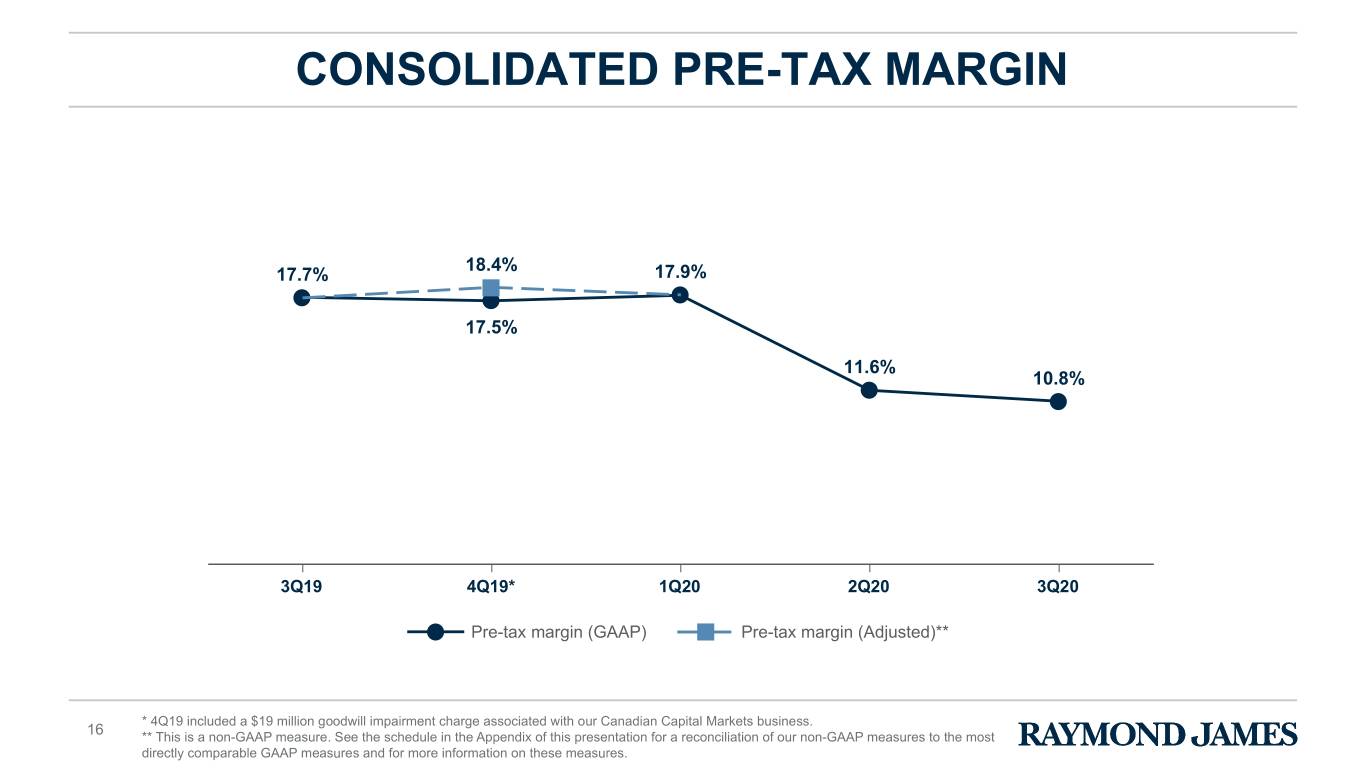
CONSOLIDATED PRE-TAX MARGIN 18.4% 17.7% 17.9% 17.5% 11.6% 10.8% 3Q19 4Q19* 1Q20 2Q20 3Q20 Pre-tax margin (GAAP) Pre-tax margin (Adjusted)** * 4Q19 included a $19 million goodwill impairment charge associated with our Canadian Capital Markets business. 16 ** This is a non-GAAP measure. See the schedule in the Appendix of this presentation for a reconciliation of our non-GAAP measures to the most directly comparable GAAP measures and for more information on these measures.
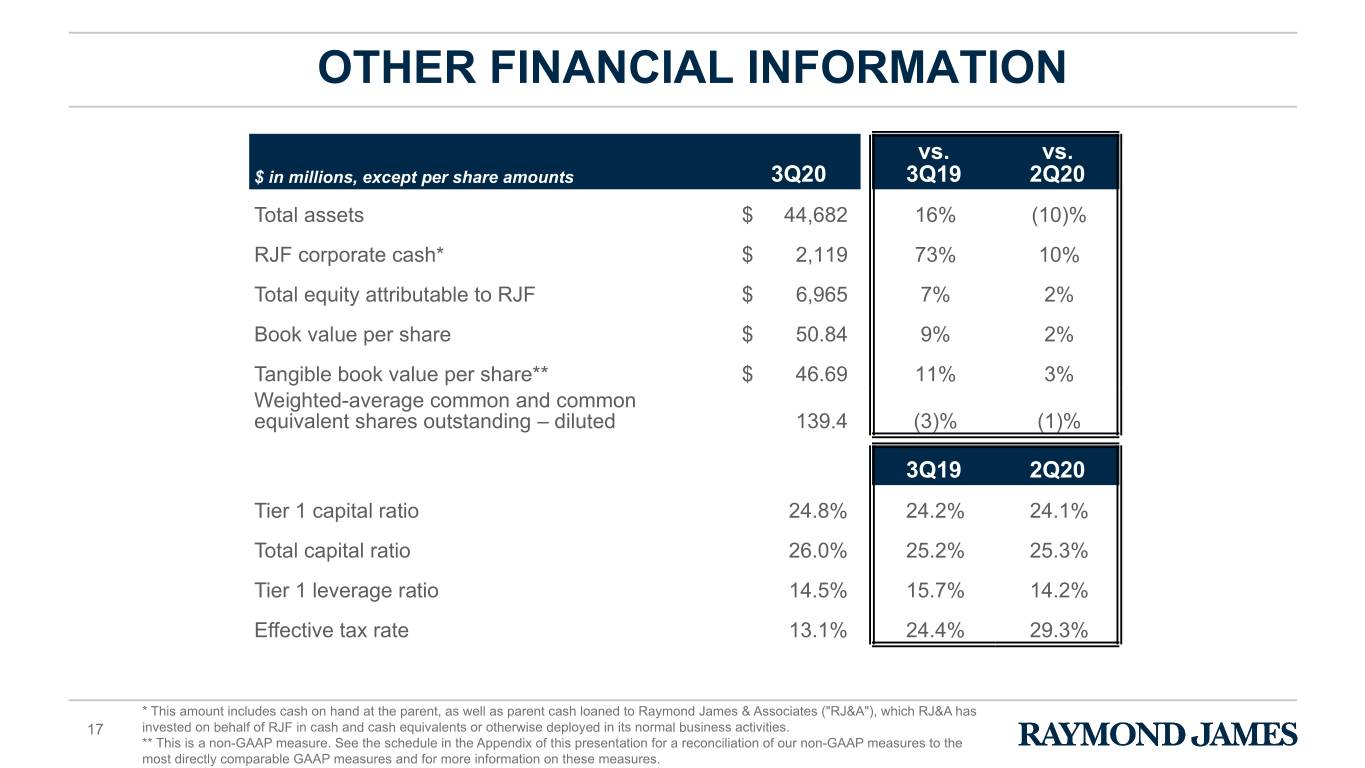
OTHER FINANCIAL INFORMATION vs. vs. $ in millions, except per share amounts 3Q20 3Q19 2Q20 Total assets $ 44,682 16% (10)% RJF corporate cash* $ 2,119 73% 10% Total equity attributable to RJF $ 6,965 7% 2% Book value per share $ 50.84 9% 2% Tangible book value per share** $ 46.69 11% 3% Weighted-average common and common equivalent shares outstanding – diluted 139.4 (3)% (1)% 3Q19 2Q20 Tier 1 capital ratio 24.8 % 24.2% 24.1% Total capital ratio 26.0 % 25.2% 25.3% Tier 1 leverage ratio 14.5 % 15.7% 14.2% Effective tax rate 13.1 % 24.4% 29.3% * This amount includes cash on hand at the parent, as well as parent cash loaned to Raymond James & Associates ("RJ&A"), which RJ&A has 17 invested on behalf of RJF in cash and cash equivalents or otherwise deployed in its normal business activities. ** This is a non-GAAP measure. See the schedule in the Appendix of this presentation for a reconciliation of our non-GAAP measures to the most directly comparable GAAP measures and for more information on these measures.
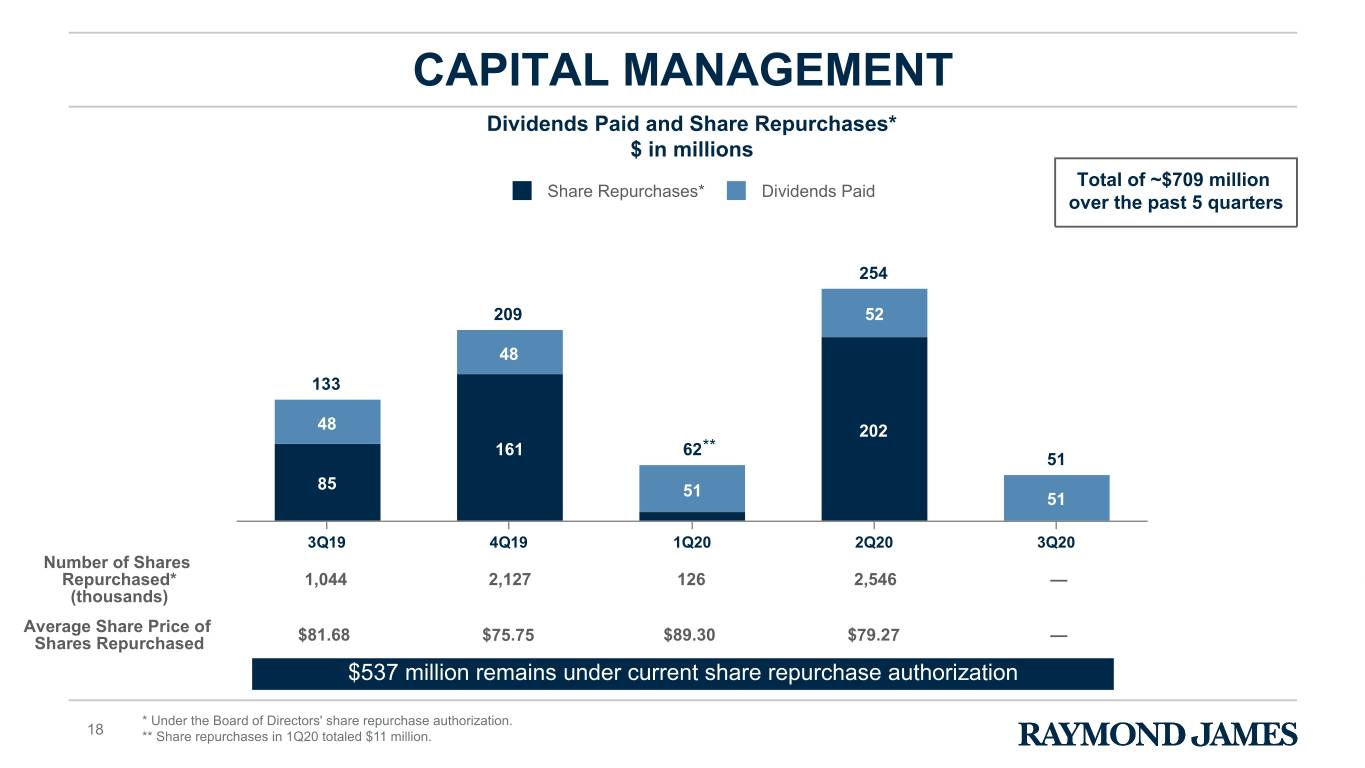
CAPITAL MANAGEMENT Dividends Paid and Share Repurchases* $ in millions Total of ~$709 million Share Repurchases* Dividends Paid over the past 5 quarters 254 209 52 48 133 48 202 ** 161 62 51 85 51 51 3Q19 4Q19 1Q20 2Q20 3Q20 Number of Shares Repurchased* 1,044 2,127 126 2,546 — (thousands) Average Share Price of $81.68 $75.75 $89.30 $79.27 — Shares Repurchased $537 million remains under current share repurchase authorization * Under the Board of Directors' share repurchase authorization. 18 ** Share repurchases in 1Q20 totaled $11 million.
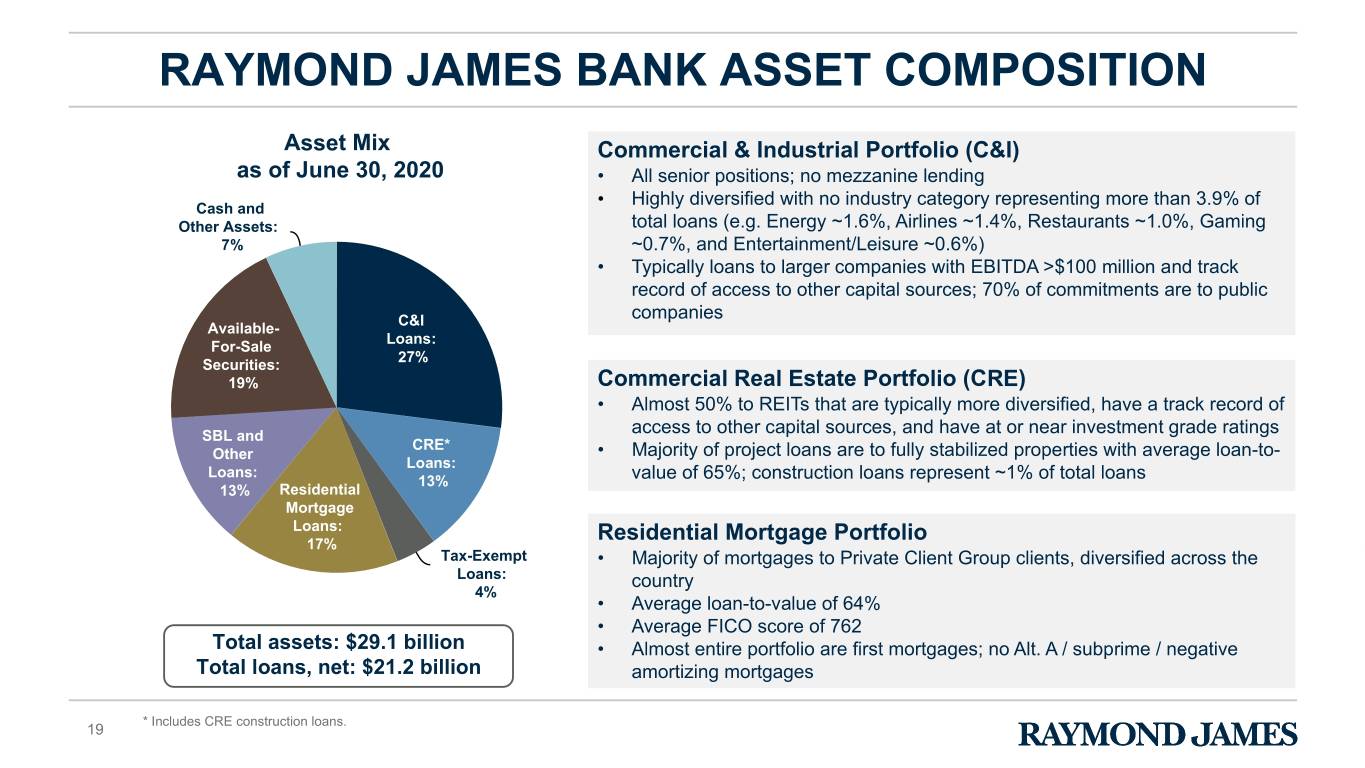
RAYMOND JAMES BANK ASSET COMPOSITION Asset Mix Commercial & Industrial Portfolio (C&I) as of June 30, 2020 • All senior positions; no mezzanine lending • Highly diversified with no industry category representing more than 3.9% of Cash and Other Assets: total loans (e.g. Energy ~1.6%, Airlines ~1.4%, Restaurants ~1.0%, Gaming Cash and Other 7% ~0.7%, and Entertainment/Leisure ~0.6%) Assets: 7% • Typically loans to larger companies with EBITDA >$100 million and track record of access to other capital sources; 70% of commitments are to public C&I companies Available- Loans: For-Sale 27% Securities: 19% Commercial Real Estate Portfolio (CRE) • Almost 50% to REITs that are typically more diversified, have a track record of SBL and access to other capital sources, and have at or near investment grade ratings CRE* Other • Majority of project loans are to fully stabilized properties with average loan-to- Loans: Loans: 13% value of 65%; construction loans represent ~1% of total loans 13% Residential Mortgage Loans: Residential Mortgage Portfolio 17% Tax-Exempt • Majority of mortgages to Private Client Group clients, diversified across the Tax-Exempt Loans: country Loans:4% 4% • Average loan-to-value of 64% • Average FICO score of 762 Total assets: $29.1 billion • Almost entire portfolio are first mortgages; no Alt. A / subprime / negative Total loans, net: $21.2 billion amortizing mortgages * Includes CRE construction loans. 19

RAYMOND JAMES BANK LOAN SALES Loan Sales by Industry for Quarter Ended June 30, 2020 Restaurants: Other: 5% 16% Restaurants, 5% Entertainment/ Leisure: 32% Retail Trade: 6% Energy: 13% Transportation: Hospitality: 14% 14% Total Loan Sales: $355.0 million 20

OUTLOOK 21
APPENDIX 22
RECONCILIATION OF GAAP MEASURES TO NON-GAAP FINANCIAL MEASURES (UNAUDITED) We utilize certain non-GAAP financial measures as additional measures to aid in, and enhance, the understanding of our financial results and related measures. These non-GAAP financial measures have been separately identified in this document. We believe certain of these non-GAAP financial measures provides useful information to management and investors by excluding certain material items that may not be indicative of our core operating results. We utilize these non-GAAP financial measures in assessing the financial performance of the business, as they facilitate a comparison of current- and prior-period results. We believe that return on tangible common equity and tangible book value per share are meaningful to investors as they facilitate comparisons of our results to the results of other companies. In the following table, the tax effect of non-GAAP adjustments reflects the statutory rate associated with each non-GAAP item. These non-GAAP financial measures should be considered in addition to, and not as a substitute for, measures of financial performance prepared in accordance with GAAP. In addition, our non-GAAP financial measures may not be comparable to similarly titled non-GAAP financial measures of other companies. The following table provides a reconciliation of GAAP measures to non-GAAP financial measures for those periods which include non-GAAP adjustments. continued on next slide Note: Please refer to the footnotes on slide 27 for additional information. 23
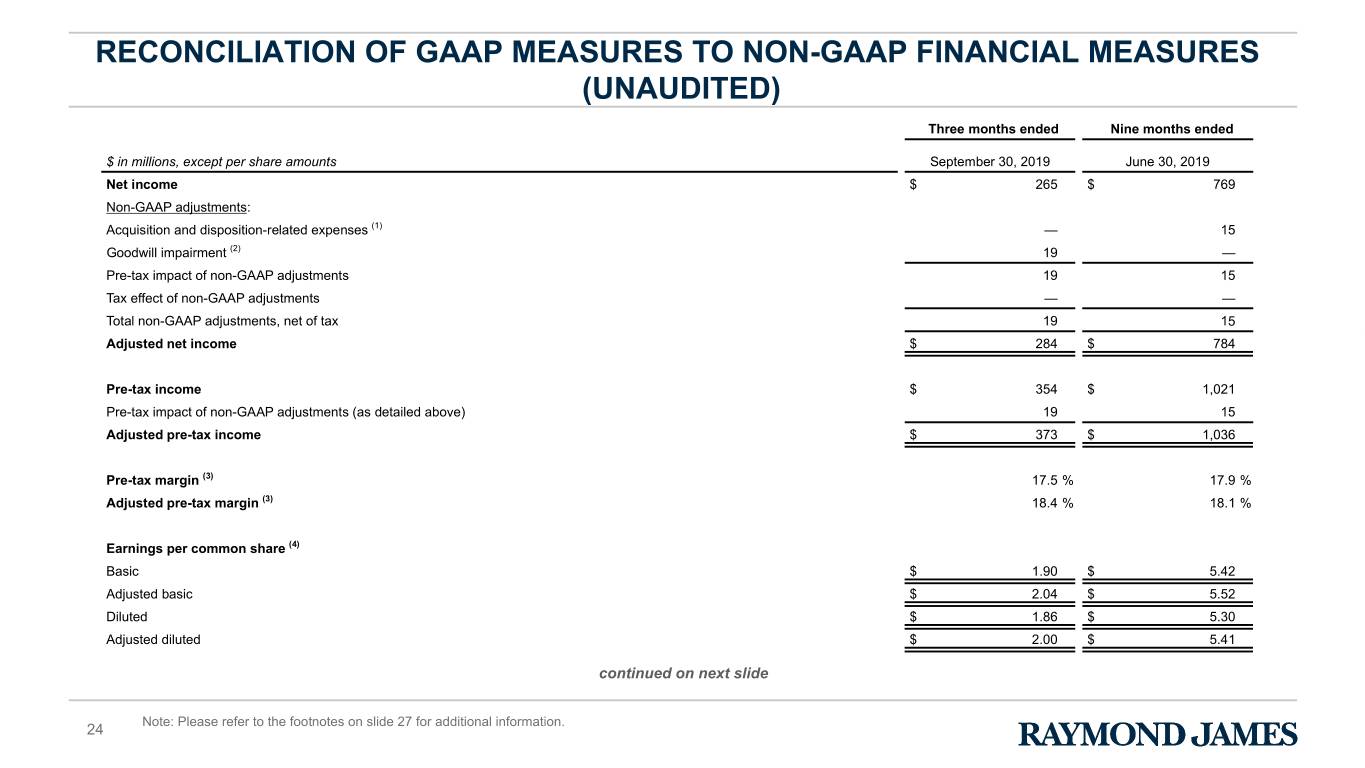
RECONCILIATION OF GAAP MEASURES TO NON-GAAP FINANCIAL MEASURES (UNAUDITED) Three months ended Nine months ended $ in millions, except per share amounts September 30, 2019 June 30, 2019 Net income $ 265 $ 769 Non-GAAP adjustments: Acquisition and disposition-related expenses (1) — 15 Goodwill impairment (2) 19 — Pre-tax impact of non-GAAP adjustments 19 15 Tax effect of non-GAAP adjustments — — Total non-GAAP adjustments, net of tax 19 15 Adjusted net income $ 284 $ 784 Pre-tax income $ 354 $ 1,021 Pre-tax impact of non-GAAP adjustments (as detailed above) 19 15 Adjusted pre-tax income $ 373 $ 1,036 Pre-tax margin (3) 17.5 % 17.9 % Adjusted pre-tax margin (3) 18.4 % 18.1 % Earnings per common share (4) Basic $ 1.90 $ 5.42 Adjusted basic $ 2.04 $ 5.52 Diluted $ 1.86 $ 5.30 Adjusted diluted $ 2.00 $ 5.41 continued on next slide Note: Please refer to the footnotes on slide 27 for additional information. 24

RECONCILIATION OF GAAP MEASURES TO NON-GAAP FINANCIAL MEASURES (UNAUDITED) Book value per share As of $ in millions, except per share amounts June 30, 2019 March 31, 2020 June 30, 2020 Total equity attributable to Raymond James Financial, Inc. $ 6,502 $ 6,798 $ 6,965 Less non-GAAP adjustments: Goodwill and identifiable intangible assets, net 635 603 602 Deferred tax liabilities, net (26) (30) (33) Tangible common equity attributable to Raymond James Financial, Inc. 5,893 6,225 6,396 Common shares outstanding 139.7 136.8 137.0 Book value per share (5) $ 46.54 $ 49.69 $ 50.84 Tangible book value per share (5) $ 42.18 $ 45.50 $ 46.69 continued on next slide Note: Please refer to the footnotes on slide 27 for additional information. 25
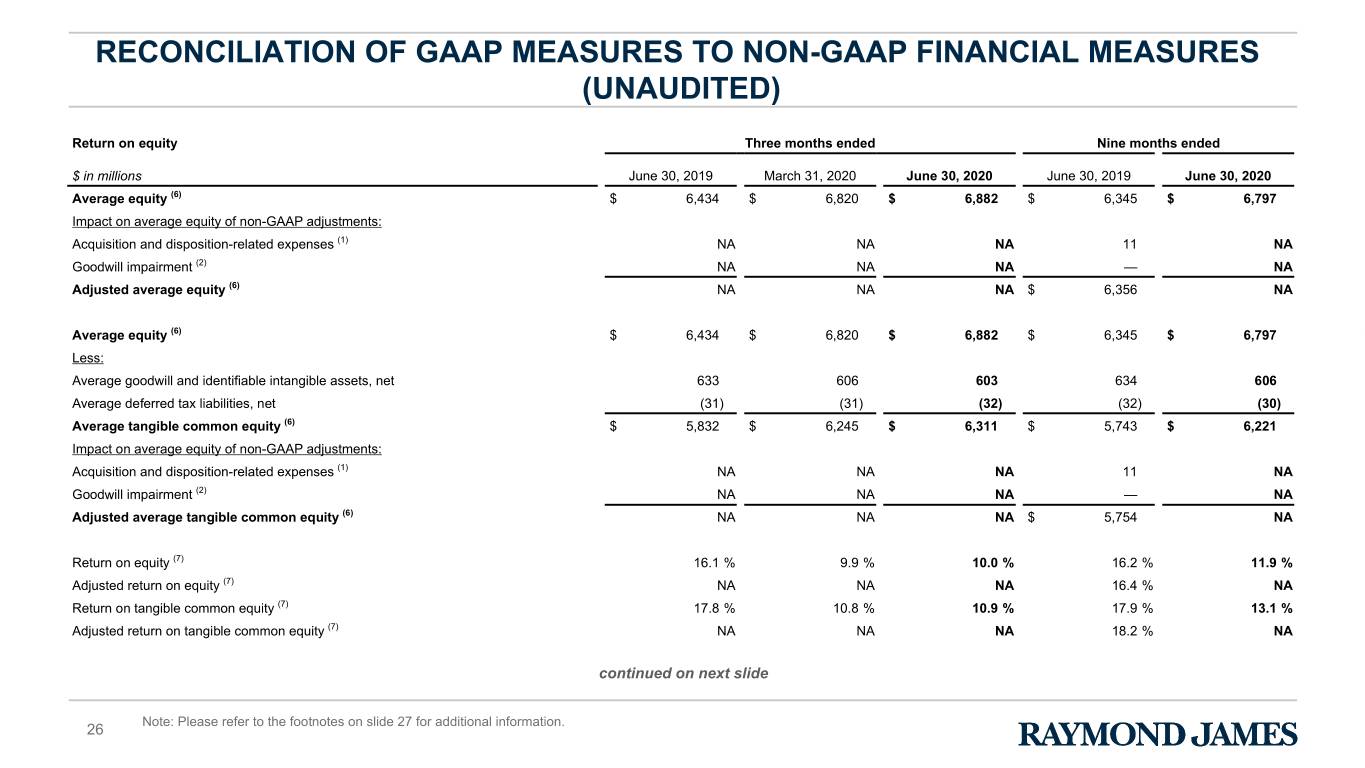
RECONCILIATION OF GAAP MEASURES TO NON-GAAP FINANCIAL MEASURES (UNAUDITED) Return on equity Three months ended Nine months ended $ in millions June 30, 2019 March 31, 2020 June 30, 2020 June 30, 2019 June 30, 2020 Average equity (6) $ 6,434 $ 6,820 $ 6,882 $ 6,345 $ 6,797 Impact on average equity of non-GAAP adjustments: Acquisition and disposition-related expenses (1) NA NA NA 11 NA Goodwill impairment (2) NA NA NA — NA Adjusted average equity (6) NA NA NA $ 6,356 NA Average equity (6) $ 6,434 $ 6,820 $ 6,882 $ 6,345 $ 6,797 Less: Average goodwill and identifiable intangible assets, net 633 606 603 634 606 Average deferred tax liabilities, net (31) (31) (32) (32) (30) Average tangible common equity (6) $ 5,832 $ 6,245 $ 6,311 $ 5,743 $ 6,221 Impact on average equity of non-GAAP adjustments: Acquisition and disposition-related expenses (1) NA NA NA 11 NA Goodwill impairment (2) NA NA NA — NA Adjusted average tangible common equity (6) NA NA NA $ 5,754 NA Return on equity (7) 16.1 % 9.9 % 10.0 % 16.2 % 11.9 % Adjusted return on equity (7) NA NA NA 16.4 % NA Return on tangible common equity (7) 17.8 % 10.8 % 10.9 % 17.9 % 13.1 % Adjusted return on tangible common equity (7) NA NA NA 18.2 % NA continued on next slide Note: Please refer to the footnotes on slide 27 for additional information. 26
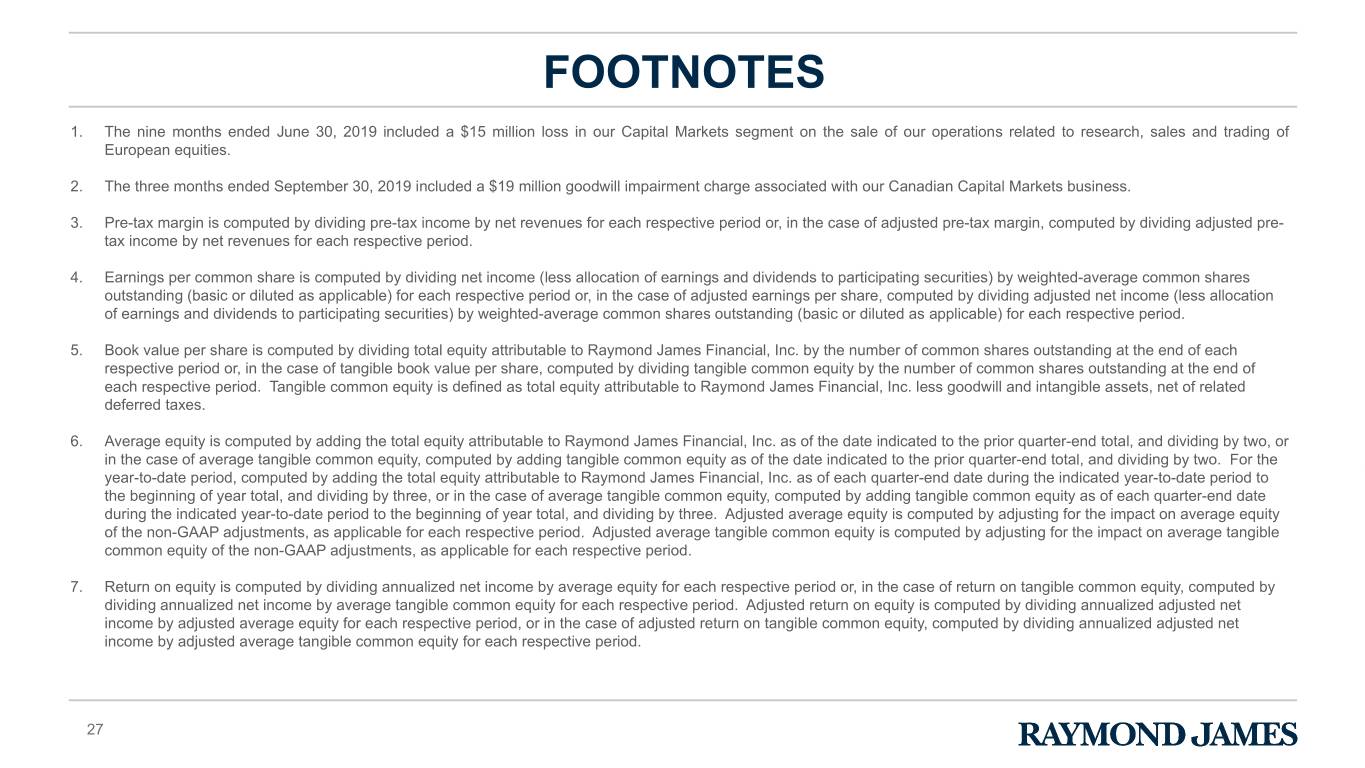
FOOTNOTES 1. The nine months ended June 30, 2019 included a $15 million loss in our Capital Markets segment on the sale of our operations related to research, sales and trading of European equities. 2. The three months ended September 30, 2019 included a $19 million goodwill impairment charge associated with our Canadian Capital Markets business. 3. Pre-tax margin is computed by dividing pre-tax income by net revenues for each respective period or, in the case of adjusted pre-tax margin, computed by dividing adjusted pre- tax income by net revenues for each respective period. 4. Earnings per common share is computed by dividing net income (less allocation of earnings and dividends to participating securities) by weighted-average common shares outstanding (basic or diluted as applicable) for each respective period or, in the case of adjusted earnings per share, computed by dividing adjusted net income (less allocation of earnings and dividends to participating securities) by weighted-average common shares outstanding (basic or diluted as applicable) for each respective period. 5. Book value per share is computed by dividing total equity attributable to Raymond James Financial, Inc. by the number of common shares outstanding at the end of each respective period or, in the case of tangible book value per share, computed by dividing tangible common equity by the number of common shares outstanding at the end of each respective period. Tangible common equity is defined as total equity attributable to Raymond James Financial, Inc. less goodwill and intangible assets, net of related deferred taxes. 6. Average equity is computed by adding the total equity attributable to Raymond James Financial, Inc. as of the date indicated to the prior quarter-end total, and dividing by two, or in the case of average tangible common equity, computed by adding tangible common equity as of the date indicated to the prior quarter-end total, and dividing by two. For the year-to-date period, computed by adding the total equity attributable to Raymond James Financial, Inc. as of each quarter-end date during the indicated year-to-date period to the beginning of year total, and dividing by three, or in the case of average tangible common equity, computed by adding tangible common equity as of each quarter-end date during the indicated year-to-date period to the beginning of year total, and dividing by three. Adjusted average equity is computed by adjusting for the impact on average equity of the non-GAAP adjustments, as applicable for each respective period. Adjusted average tangible common equity is computed by adjusting for the impact on average tangible common equity of the non-GAAP adjustments, as applicable for each respective period. 7. Return on equity is computed by dividing annualized net income by average equity for each respective period or, in the case of return on tangible common equity, computed by dividing annualized net income by average tangible common equity for each respective period. Adjusted return on equity is computed by dividing annualized adjusted net income by adjusted average equity for each respective period, or in the case of adjusted return on tangible common equity, computed by dividing annualized adjusted net income by adjusted average tangible common equity for each respective period. 27
