Attached files
| file | filename |
|---|---|
| EX-99.2 - PRESS RELEASE, DATED JULY 29, 2020 - Netfin Acquisition Corp. | ea124661ex99-2_netfinacq.htm |
| EX-99.1 - TRANSCRIPT OF INVESTOR CALL HELD ON JULY 29, 2020 - Netfin Acquisition Corp. | ea124661ex99-1_netfinacq.htm |
| 8-K - CURRENT REPORT - Netfin Acquisition Corp. | ea124661-8k_netfinacqu.htm |
Exhibit 99.3

NETFIN ACQUISITION The image part with relationship ID rId2 was not found in the file. Triterras Fintech PTE Ltd. Leading Platform For Global Trade and Trade Finance July 2020 Leading Platform for Global Trade and Trade Finance Triterras Fintech Pte Ltd. NETFIN ACQUISITION Investor Presentation July 2020 FILED BY NETFIN ACQUISITION CORP. PURSUANT TO RULE 425 UNDER THE SECURITIES ACT OF 1933 AND DEEMED FILED PURSUANT TO RULE 14a - 12 UNDER THE SECURITIES EXCHANGE ACT OF 1934 SUBJECT COMPANY: NETFIN ACQUISITION CORP. COMMISSION FILE NO. 001 - 39008

This investor presentation (the “presentation”) is for informational purposes only and does not constitute an offer to sell, a s olicitation of an offer to buy, or a recommendation to purchase any equity or debt or other financial instruments of Netfin A cqu isition Corp. (“Netfin”), Triterras Fintech Pte. Ltd (“Triterras”) or their respective affiliates. This presentation has been prepared to assist investors in making their own evaluation with respect to the proposed business combi nat ion (the “Transaction”) of Netfin and Triterras, and for no other purpose. Certain information contained herein has been derived from sources prepared by third parties. While such information is belie ved to be reliable for the purposes used herein, neither Netfin nor Triterras makes any representation or warranty with respect t o the accuracy of such information. Any and all trademarks and trade names referred to in this presentation are the property of their respective owners. This presentation does not purport to contain all of the information that may be required to evaluate the Transaction or advi ser s or any other person as to the accuracy or completeness of the information in this presentation or any other written, oral o r o ther communications transmitted or otherwise made available to any party in the course of its evaluation of the Transaction, and no responsibility or liability whatsoever is accepted for the accuracy or sufficiency ther eof or for any errors, omissions or misstatements, negligent or otherwise, relating thereto. The recipient also acknowledges and ag rees that the information contained in this presentation is preliminary in nature and is subject to change, and any such changes may be material. Netfin and Triterras disclaim any duty to update the information contained in t his presentation. Forward - Looking Statements . This presentation includes “forward - looking statements” within the meaning of the “safe harbor” provisions of the Private Securities Litigation Reform Act of 1995 . Netfin’s and Triterras’ actual results may differ from their expectations, estimates and projections and consequently, you should not rely on these forward - looking statements as predictions of future events . Words such as “expect,” “estimate,” “project,” “budget,” “forecast,” “anticipate,” “intend,” “plan,” “may,” “will,” “could,” “should,” “believes,” “predicts,” “potential,” “continue,” and similar expressions are intended to identify such forward - looking statements . These forward - looking statements include, without limitation, Netfin’s and Triterras’ expectations with respect to future performance and anticipated financial impacts of the Transaction, the satisfaction of closing conditions to the Transaction, the level of redemptions by Netfin’s public stockholders in connection with the Transaction, and the timing of the completion of the Transaction . These forward - looking statements involve significant risks and uncertainties that could cause the actual results to differ materially from the expected results . Most of these factors are outside Netfin’s and Triterras’ control and are difficult to predict . Factors that may cause such differences include, but are not limited to : the impact of COVID - 19 on Triterras’ business and Netfin’s ability to complete the business combination, the occurrence of any event, change or other circumstance that could give rise to the termination of a definitive agreement for the proposed Transaction (the “Transaction Agreement”) or could otherwise cause the Transaction to fail to close ; the outcome of any legal proceedings that may be instituted against Netfin, Triterras or any of their respective directors or officers, following the announcement of the Transaction Agreement and the transactions contemplated therein ; the inability to complete the Transaction, including due to failure to obtain approval of the stockholders of Netfin or other conditions to closing in the Transaction Agreement ; delays in obtaining, adverse conditions contained in, or the inability to obtain necessary regulatory approvals or complete regular reviews required to complete the transactions contemplated by the Transaction Agreement ; the risk that the announcement and consummation of the Transaction disrupts current plans and operations ; the inability to recognize the anticipated benefits of the Transaction, which may be affected by, among other things, competition, the ability of the combined company to grow and manage growth profitably, maintain relationships and retain its key employees ; costs related to the Transaction ; changes in the applicable laws or regulations ; the possibility that Triterras or the combined company may be adversely affected by other economic, business, and/or competitive factors ; demand for Triterras’ products and services ; Triterras’ business strategy ; Triterras’, operating cash flows, liquidity and capital required for Triterras’ business ; Triterras’ future revenue, income and operating performance ; the termination of relationships with major customers ; laws and regulations, including environmental regulations, that may increase Triterras’ costs, limit the demand for its products and services or restrict its operations ; disruptions in the political, regulatory, economic and social conditions domestically or internationally ; a failure of Triterras’ information technology infrastructure or any significant breach of security ; potential uninsured claims and litigation against us ; plans, objectives, expectations and intentions that are not historical ; and other risks and uncertainties identified in this presentation or indicated from time to time in documents filed by Netfin with the U . S . Securities and Exchange Commission . Netfin cautions that the foregoing list of factors is not exclusive . Netfin cautions readers not to place undue reliance upon any forward - looking statements, which speak only as of the date made . Neither Netfin nor Triterras undertakes or accepts any obligation or undertaking to release publicly any updates or revisions to any forward - looking statements to reflect any change in its expectations or any change in events, conditions or circumstances on which any such statement is based . No Offer or Solicitation . This presentation shall not constitute a solicitation of a proxy, consent or authorization with respect to any securities o r i n respect of the Transaction. This presentation shall also not constitute an offer to sell or the solicitation of an offer to bu y any securities, nor shall there be any sale of securities in any states or jurisdictions in which such offer, solicitation or sale would be unlawful prior to registration or qualification under the securities laws of any such jurisdiction. No Representation or Warranty . None of Netfin, Triterras or any of their respective affiliates makes any representation or warranty as to the accuracy or com pleteness of the information contained in this presentation. The sole purpose of the presentation is to assist persons in dec idi ng whether they wish to proceed with a further review of the Transaction and is not intended to be all - inclusive or to contain all the information that a person may desire in considering th e Transaction. It is not intended to form the basis of any investment decision or any other decision in respect of the Transa cti on. Financial Information . The financial information contained in this presentation has been taken from or prepared based on the historical financial sta tements of Triterras for the periods presented. An audit of certain of these financial statements is in process and will be i n t he proxy statement relating to the Transaction, however none of the historical financial information contained herein has been audited, reviewed, compiled or been subject to any procedures by any auditors an d actual historical financial information could differ materially from the information contained herein. Use of Projections . This presentation contains financial forecasts, including with respect to Triterras’ Net Revenue, EBITDA, EBITDA Margin, Ne t I ncome, Transaction Volume, among others. Neither Netfin’s nor Triterras’ independent auditors have studied, reviewed, compile d o r performed any procedures with respect to the projections for the purpose of their inclusion in this presentation, and accordingly, neither of them expressed an opinion or provided any other for m of assurance with respect thereto for the purpose of this presentation. These projections are for illustrative purposes onl y a nd should not be relied upon as being necessarily indicative of future results. In this presentation, certain of the above - mentioned projected information has been provided for purposes of providing comparisons with historical dat a. The assumptions and estimates underlying the prospective financial information are inherently uncertain and are subject to a wide variety of significant business, economic and competitive risks and uncertainties that could cause actual results to differ materially from those contained in the prospective financial information. Projections ar e i nherently uncertain due to a number of factors outside of Triterras’ control. Accordingly, there can be no assurance that the pr ospective results are indicative of future performance of Triterras or the combined company after the Transaction or that actual results will not differ materially from those presented in the prospective financial informati on. Inclusion of the prospective financial information in this presentation should not be regarded as a representation by any per so n that the results contained in the prospective financial information will be achieved. Industry and Market Data . In this presentation, we rely on and refer to information and statistics regarding market participants in the sectors in wh ich Triterras competes and other industry data. We obtained this information and statistics from third - party sources, including rep orts by market research firms and company filings. Being in receipt of the presentation you agree you may be restricted from dealing in (or encouraging others to deal in) price sensitive securities. Use of Non - IFRS Financial Matters . This presentation includes non - IFRS financial measures, including EBITDA, EBITDA CAGR and EBITDA Margin, among others. Netfin and Triterras believe that these non - IFRS measures are useful to investors for two principal reasons. First, they believe these measures may assist investors in comparing performance over various reporting periods on a consistent basis by removing from operating results the impact of items that do not refle ct core operating performance. Second, these measures are used by Triterras’ management to assess its performance and may (subje ct to the limitations described below) enable investors to compare the performance of Triterras and the combined company to its competition. Netfin and Triterras believe that the use of these non - IFRS financial mea sures provides an additional tool for investors to use in evaluating ongoing operating results and trends. These non - IFRS measur es should not be considered in isolation from, or as an alternative to, financial measures determined in accordance with IFRS. Other companies may calculate EBITDA, EBITDA CAGR, EBITDA Margin, and other non - IFRS financi al measures differently, and therefore Triterras’ non - IFRS financial measures may not be directly comparable to similarly titled measures of other companies. For reconciliation of the non - IFRS measures used in this presentation, see “IFRS Reconciliation” in the Appendix at the end of this presentation. Important Information About the Business Combination and Where to Find It . In connection with the proposed Business Combination, the combined company intends to file with the SEC a registration stat eme nt on Form F - 4 (the “Registration Statement”) which will include a proxy statement/prospectus and certain other related document s, which will be both the proxy statement to be distributed to holders of shares of Netfin’s Ordinary Shares in connection with Netfin ’s solicitation of proxies for the vote by Netfin’s stockholders with respect to the Business Combination and other matters as m ay be described in the Registration Statement, as well as the prospectus relating to the offer and sale of the securities of the combined company to be issued in the Business Combination. Netfin’s stockholders and other intereste d p ersons are advised to read, when available, the preliminary proxy statement/prospectus included in the Registration Statement an d the amendments thereto and the definitive proxy statement/prospectus, as these materials will contain important information about the Transaction, Netfin and the Business Combination. After the Registrati on Statement is declared effective, the definitive proxy statement/prospectus will be mailed to Netfin’s stockholders as of a re cor d date to be established for voting on the Business Combination and other matters as may be described in the Registration Statement. Stockholders will also be able to obtain copies of the proxy statement/prospectus an d o ther documents filed with the SEC that will be incorporated by reference in the proxy statement/prospectus, without charge, o nce available, at the SEC’s web site at www.sec.gov, or by directing a request to: Netfin Acquisition Corp., 445 Park Avenue, 9th Floor, New York, NY 10022, Attention: Gerry Pascale, Chief Financial Officer, (972) 9 79 - 5995. Participants in the Solicitation . Netfin and its directors and executive officers may be deemed participants in the solicitation of proxies from Netfin’s sha reh olders with respect to the Transaction. A list of the names of those directors and executive officers and a description of th eir interests will be contained in the Registration Statement, when it becomes available. The Registration Statement will be available free of charge from the sources indicated above. Disclaimers

TRITERRAS HOLDINGS, PTE LTD Final Composition of Business Combination Triterras Fintech Standalone After signing an LOI for both subsidiaries of Triterras, Netfin has agreed to acquire only Triterras Fintech and its Kratos platform, not Triterras Holdings and its Rhodium commodity trader 3 TRITERRAS FINTECH, PTE LTD x Creates a fast growing fintech pure - play x 100% fee - based platform business x Mitigates balance sheet exposure in Rhodium business x Maximizes short - and long - term shareholder value

Transaction Summary • Signed definitive agreement for Business Combination • Expected closing : Q 4 2020 , subject to SEC review of Form F - 4 , Netfin shareholder approval and satisfaction of closing conditions Transaction Rationale • Business Combination creates a leading diversified platform, built to connect and enable commodity traders and lenders to transact online while solving critical problems for its users Transaction Overview • Netfin Acquisition Corp . (Nasdaq : NFIN) (“Netfin”) to combine with Triterras Fintech PTE Ltd . to form a publicly - traded f in t ech business with one of the world’s largest commodity trading and trade finance platforms (the “Business Combination”) • Triterras Fintech management to continue to run the business and retaining 61 . 5 % ownership of the combined company ( 1 ) • Initial board will consist of 7 members including 2 appointed by Netfin Approvals & Timing Management & Board 4 1) Assumes no redemption (100% roll) of NFIN public shares

Management and Presenters Owner managed business with deep expertise in technology, risk management and scaling businesses James H. Groh, Sr. Executive VP BS, Engineering, Cornell MBA, Finance, RIT • C - suite Corporate Management and Board experience • Managed the going public process for 20+ companies • Previously held FINRA Series 7, 63, and 24 licenses • US Citizen Srinivas Koneru Founder , Chairman , & CEO BS, Mechanical Engineering BMS College of Engineering, Bangalore • Over 35 years of professional experience • Co - founded Atlanta - based IT development and services company in 2005; grew to $80 million in revenue, exited in 2010 • Multiple entrepreneurial initiatives spanning many industries • US Citizen Marat Rosenberg President, Netfin Acquisition Corp BA, Economics, University of Pennsylvania • 25 years in capital markets, investment and management of finance and technology • Brought 50+ companies public • 15 years as principal of Halter Financial Group, merchant bank and fund management • Citigroup VP and Andersen Consulting Strategy alum • US Citizen John Galani Chief Operating Officer MS Cass Business School BA, Brunel University • Over 20 years in trade, trade finance and building platforms • Natural resource, financial and transportation management expertise as an MD at Delta Trading, Centurion European Capital and Phoenix Vision Mgmt • Operated and financed internet B2B shipping platform • UK Resident Alvin Tan Chief Financial Officer B. Comm, Curtin University of Technology 5 • Certified Public Accountant • Over 20 years as Group CFO and Financial Controller at leading commodity trading firms – Cargill, Golden Agri Resources, Musim Mas • Singapore Resident

$6.6B (1) Transaction Volume Company Snapshot $ 84M FY21E EBITDA (2)(3) 169% FY19 - FY21E Revenue CAGR (2) 3,500+ (1) Number of Transactions $17B Cumulative Funds Onboarded $ 123M FY21E Revenue (2) Note: FY19 represents February 29, 2020 fiscal year end; FY20E and FY21E represents February 28, 2021 & 2022 fiscal year end, re spectively 1) June ‘19 – June ‘20 2) Representative of pro forma financial projection model for FY20 - FY23 contained on slides 27. Assumes no redemption (100% roll) of NFIN public shares 3) See slide 38 for EBITDA Reconciliation 6 69% FY21E EBITDA Margin (2)(3) Leading commodity trade & trade finance digital marketplace with 3,500+ transactions (1) First mover advantage utilizing disruptive proprietary technology to solve critical industry problems Fintech platform delivers previously unavailable access to l enders and borrowers , cost reduction , risk abatement and speed

Commercial Success • June 2019 - Trading module launch, FY19 (Feb 28 th year end) volume equal to $3.6B ($400M+ per month) and $15M EBITDA (1) • February 2020 - Trade Finance module brought online • 4 months ending June 2020 - Transaction volume equal to $2.9B ($720M+ per month) • FY20E - $7.8B transaction volume and $40M EBITDA Business Overview Triterras Fintech is a leading trade and trade finance fintech company • Disruptive technology transforming industry and rapidly increasing user base • Compelling opportunity to address a $1.5 trillion annual shortfall in trade finance • Growth Catalysts - Exponential organic growth, expanded geographies, supply chain financing and additional platform modules Outsized Growth Opportunity • Potentially transformative digital marketplace for trade and trade finance • One of the world’s largest commodity trade and trade finance platforms • Solves mission critical problems for its clients • Generates fee income on trade and financing transaction volume 7 Note: Triterras has a February fiscal year - end. FY19 is representative of the 12 months ending February 29, 2020 1) See slide 38 for EBITDA Reconciliation

Presentation Overview Kratos – Triterras Fintech Trade and Trade Finance Platform Growth Catalysts Industry Overview COVID - 19 Update Financial Summary 8 Transaction Overview

Trade and Trade Finance OUR INDUSTRY • Non petroleum commodities • Broad client appeal including SME’s 9 Industry Overview

Trade finance is a $4 0 trillion business of providing funding for international trade (1) What is Trade Finance? As goods move across oceans and borders, buyers seek to finance their purchases Financing is short term – less than 180 days, and at attractive rates given the opacity and fragmentation of the markets . Market opportunity for sub $ 50 million trade finance transactions is fragmented and currently supported by hundreds of small players lacking infrastructure and technology . Banks prefer to finance large ($50M+) trade finance transactions The industry is dominated by multi - national corporations and banks which do not need outside financing 1) Source: Allied Market Research, December 2019, www.alliedmarketresearch.com 10

Complexities and Challenges in Trade and Trade Finance Trade finance is a highly complex process involving dozens of parties and documents Correspondent bank Invoicing Platform 3 Invoicing Courier 12 Document Courier 16 Insurer 8 Exporter 2 Freight Forwarder 7 Pre - Shipment Inspector 9 Export Terminal 10 Shipper 13 Invoicing Terminal 14 Importer’s bank 4 17 6 Interbank Messaging Exporter’s bank 5 Importer 1 Import Customs 15 Export Customs 11 Physical shipment of goods Transfer of instructions and docs Risk mitigation & compliance Financing Payment Corporate # Banks # Governing Bodies # Facilitators # Players and processes 11

• Purchasers utilize credible mediators like brokers, private investigators, arbitrators, etc. which increases the transaction cost • Expensive back office headcount & procedures are required to move a product from point A to B Delays in Trade Financing • Demand for commodities Trade Funding is based on immediate and persistent business transactions • Banks and Lenders have become very selective in funding, resulting in unavailability of funds at required times Paper Intensive • Industry requires excessive paper documentation throughout the supply chain process Current Problems in Trade and Trade Finance An archaic business that has not changed in 200 years Significant Overhead Costs Documentation Discrepancies • Documents are manually handled resulting in high risk and operational complexity due to human error Fraud Susceptibility • Manufactured goods have very lenient supervision and paper documents can be altered throughout the supply chain • Physical products require critical quality assurance 12

Traders are under pressure with fewer funding sources Trade finance is available but significant barriers exist • Basel III capital requirements have led banks to focus on the largest trading counterparties as capital allocated to trade finance, even if insured , requires high capital reserve ratio • Traders oftentimes cite that lack of adequate trade finance is their #1 constraint on growth • COVID - 19 has added extra pressure on the segment • Trade finance generates attractive yield s • Compliance costs a key issue • Many funds and investors are seeking ways to enter the sector but have no way to source opportunities or validate and diligence counterparties The World Trade Organization estimates traders face a $1.5 trillion annual shortfall of trade finance availability (1) Market Opportunity in Trade Finance Cost of administering a $100M loan and a $5M loan is the same -- lenders have ignored sub $10M loans 1) Source: WTO.org 7/13/19 13
Kratos Platform Serves: • Traders as operators • Lenders • Traders as borrowers 14 Kratos TM Online Platform

Source Financing Facilitate Trade Key Business Model 1 • 130 bps charged on amount financed • Notably cheaper than offline arrangement fees • 30 bps charged on value of goods traded • Well - priced for the fraud protection, transparency, speed, analytics and efficiency Fee: + 2 130 bps 30 bps Traders (Commodity Buyers & Sellers) Communities Served: Traders Seeking Trade Finance Funders Seeking Borrowers Module: Trade Operations & Risk Management Trade Finance 3 modules driving 2 revenue streams 15 Seller Buyer

Traceability Availability of trade transaction history data as each transaction is timestamped & chronologically stored in blocks, offering transparency Efficiency Faster & efficient trade transactions by using blockchain - based smart contracts, reducing paper & overhead cost Fraud Mitigation No risk of data modification & data tampering; data is stored in a distributed and replicated chain of servers Secured Secured and trusted trade transaction over the network as blocks are cryptographically sealed in a chain System Availability No downtime & 24x7 availability given decentralized network architecture, preventing overall system failure Kratos Runs on Ethereum Blockchain Blockchain solves old industry problems and made Kratos possible for the first time 16
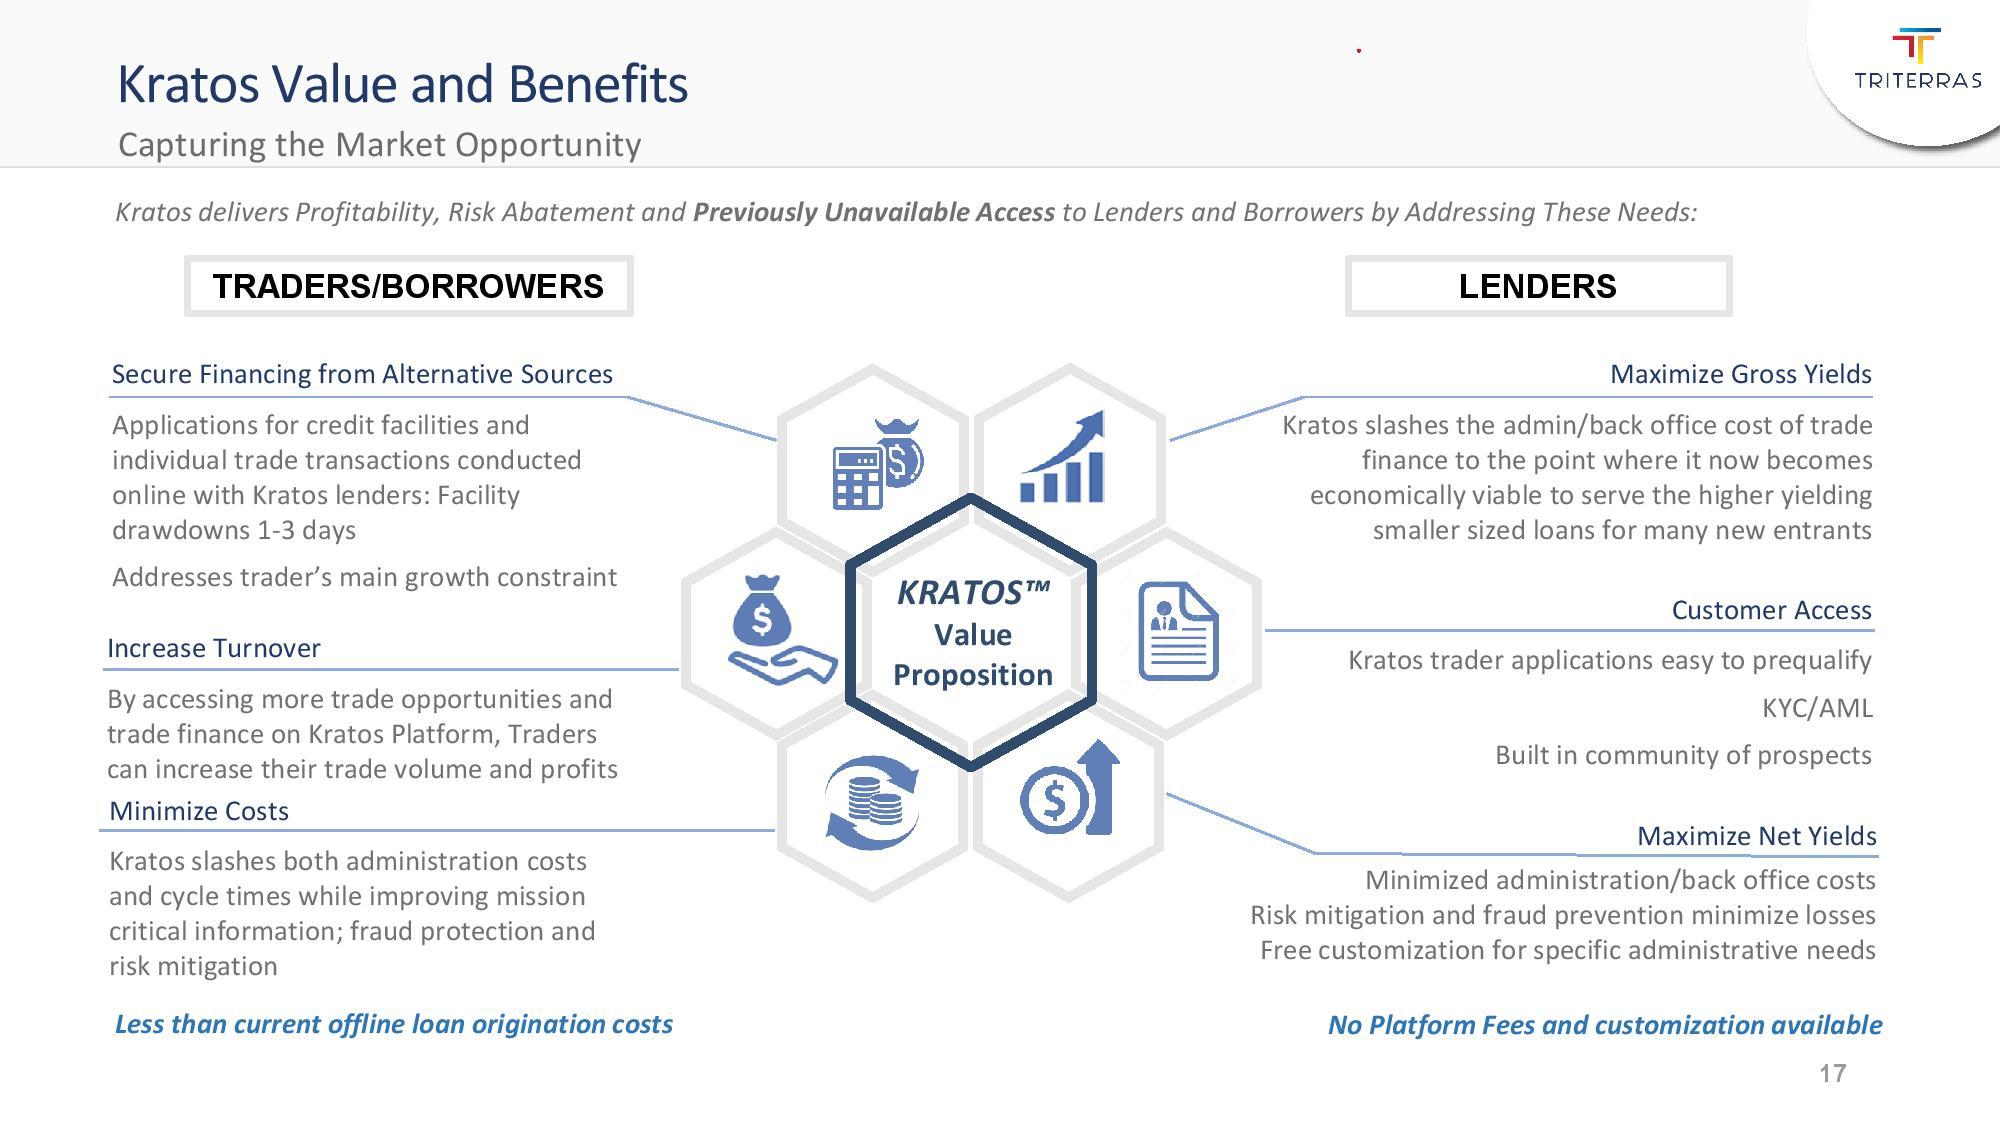
Kratos Value and Benefits Customer Access Kratos trader applications easy to prequalify KYC/AML Built in community of prospects Maximize Gross Yields Kratos slashes the admin/back office cost of trade finance to the point where it now becomes economically viable to serve the higher yielding smaller sized loans for many new entrants Maximize Net Yields Minimized administration/back office costs Risk mitigation and fraud prevention minimize losses Free customization for specific administrative needs KRATOS™ Value Proposition Kratos delivers Profitability, Risk Abatement and Previously Unavailable Access to Lenders and Borrowers by Addressing These Needs: TRADERS/BORROWERS LENDERS Increase Turnover By accessing more trade opportunities and trade finance on Kratos Platform, Traders can increase their trade volume and profits Minimize Costs Kratos slashes both administration costs and cycle times while improving mission critical information; fraud protection and risk mitigation Secure Financing from Alternative Sources Applications for credit facilities and individual trade transactions conducted online with Kratos lenders: Facility drawdowns 1 - 3 days Addresses trader’s main growth constraint Less than current offline loan origination costs No Platform Fees and customization available Capturing the Market Opportunity 17

Competitive Landscape Many platforms target global trade, but few are live, most are consortiums and only two support commodities Use Blockchain Live Trade Finance > $5B in Trade Platform KRATOS TM is the only non - petroleum commodity trade and trade finance blockchain enabled platform of scale 18 Note: Several platforms may do trade finance but are not blockchain - based

Sustainable Competitive Advantage Kratos is a digital marketplace disrupting physical commodities trade and trade finance Years of operating expertise in the trade and trade finance sector led to the design and build out of the platform Few technology companies have the existing customer base or industry expertise to launch a successful platform Entrenched scaled networks are unique and provide significant barriers to entry Kratos has first mover advantage in trade and trade finance industry Kratos serves segments with high barriers to entry (SME’s, nonpetroleum commodities) Insurance, logistics, supply chain and mobile products are in development further expanding our platform Kratos has a disruptive pricing model to capture greater market share 19

20 Growth Catalysts

• Rhodium existing business provided the necessary kickstart to launch the platform by infusing a community of traders • Rhodium brought its network of credit insurance companies to the platform to collaborate with other 3 rd party lenders in the Kratos Trade Finance Module • Kratos benefits its trader clients in critical areas – lower costs, increased trade funding availability, reduced cycle times, fraud prevention, improved discovery, new dimensions in analytics and reporting • Kratos benefits platform lenders by cutting admin costs, abating risk/fraud and providing a marketplace of prequalified and packaged Borrowers with KYC, AML, thus making sub $10 million trade finance loans more economically viable Traders attract lenders, which in turn attract more traders/borrowers, thus creating a virtuous cycle Kratos Launch and Growth Cycle Aided by Rhodium 21 TRADE AND TRADE FINANCE ONLINE PLATFORM TRADERS T RADES I NSURANCE K RATOS T RUST & T RANSPARENCY 3 RD P ARTY L ENDING M ORE P ARTICIPANTS M ORE T RADES

FY23E: Number of clients: ~1,500 Online transactions: ~$37B FY22E: Number of clients: ~1,000 Online transactions: ~$29B FY21E: Number of clients: ~500 Online transactions: ~$17B FY20E: Number of clients: ~200 Online transactions: ~$8B FY19: Number of clients: 52 Online transactions: ~$3.6B 2019 2020 2021 2022 2023 Number of Customers D E A T C B 5 4 D 1 2 3 y n 5 o m x z 22 Note: FY19 represents February 29, 2020 fiscal year end Note: Financial projections are contained on slide 27 Each party added has the potential to add their multiple counterparties; growth can be geometric Kratos Potential Exponential Organic Growth Opportunity

Mobile Application • View transaction status, receive notifications remotely • Mobile review and approval of individual transaction steps to manage transaction progress Logistics Module • For ship owners, freight operators, and charterers to manage functional aspects of chartering, post - fixture, voyage management & voyage financials • Arranged by Kratos, powered by Seven Oceans Insurance Module • For traders and lenders to request credit insurance from available insurers on the platform • Arranged by Marsh, powered by Kratos • Drives further trade finance growth Growth Initiatives Commodity Product Expansion • Outreach to trader communities in other nonpetroleum commodities • Expansion into supply chain raw materials and components • Kratos is currently Asia centric • Expansion of European operations • Special focus on Americas • Financing of smaller raw material and component suppliers to large multinational end buyers • Ultimate lender risk is on the multinationals, which allows the smaller suppliers easier access to funding • High potential volumes and pilot program is underway Supply Chain Finance Expanded Geographies 23

24 COVID - 19 Update

COVID - 19 Impact Kratos platform is outperforming 2020 pre - COVID projections • Trading and trade finance activity is increasingly shifting online as a result of worldwide closures • Existing customers are transacting a higher volume of their business online • 70% increase in average monthly trading volumes during the first 4 months of FY20 (March 2020 – June 2020) vs. platform launch through fiscal year ending 2019 (June 2019 – Feb 2020) • $2.9B transaction volume during the first 4 months of FY20 implies run rate significantly exceeding $7.8B transaction volume projection for FY20 • Less liquidity and fewer lending sources are exacerbating the current $1.5 trillion annual shortage in trade finance, creating an even more compelling need for trade finance solutions 25 Note: Kratos was launched in June 2019 Note: FY20E represents February 28, 2021 fiscal year end, respectively

Strong, Profitable Growth 26 Financial Summary

Financial Highlights 27 Note: Representative of pro forma financial projection model for FY20 - FY23. Note: Triterras has a February fiscal year - end 1) FY19 prepared in accordance with International Financial Reporting Standards ("IFRS") as issued. FY19 is representative of th e 1 2 months ending of February 29, 2020 ($ in millions) FY19 (1) FY20E FY21E FY22E FY23E Revenue Build-Up Transaction Volume $3,614.6 $7,779.1 $16,977.4 $28,994.4 $37,429.1 Transaction Fee 0.40% 0.30% 0.30% 0.25% 0.25% Transaction Fees $14.5 $23.3 $50.9 $72.5 $93.6 Trade Finance Volume $179.1 $2,541.3 $5,664.8 $9,693.7 $12,511.0 Trade Finance Fee 1.32% 1.30% 1.25% 1.25% 1.20% Trade Finance Fees $2.4 $33.0 $70.8 $121.2 $150.1 License Fees & Other $0.1 $0.3 $1.0 $2.0 $3.0 Income Statement Highlights Total Revenue $16.9 $56.6 $122.7 $195.7 $246.7 Operations & Support Cost (0.3) (0.4) (0.6) (1.3) (2.0) Gross Margin $16.6 $56.2 $122.1 $194.3 $244.7 Total Expenses ($1.8) ($16.4) ($37.8) ($54.7) ($67.5) EBITDA $14.8 $39.8 $84.3 $139.6 $177.2 EBITDA Margin 87.7% 70.3% 68.7% 71.4% 71.8% Net Income $13.2 $32.9 $71.4 $113.4 $143.6
Compelling Opportunity 28 Transaction Overview
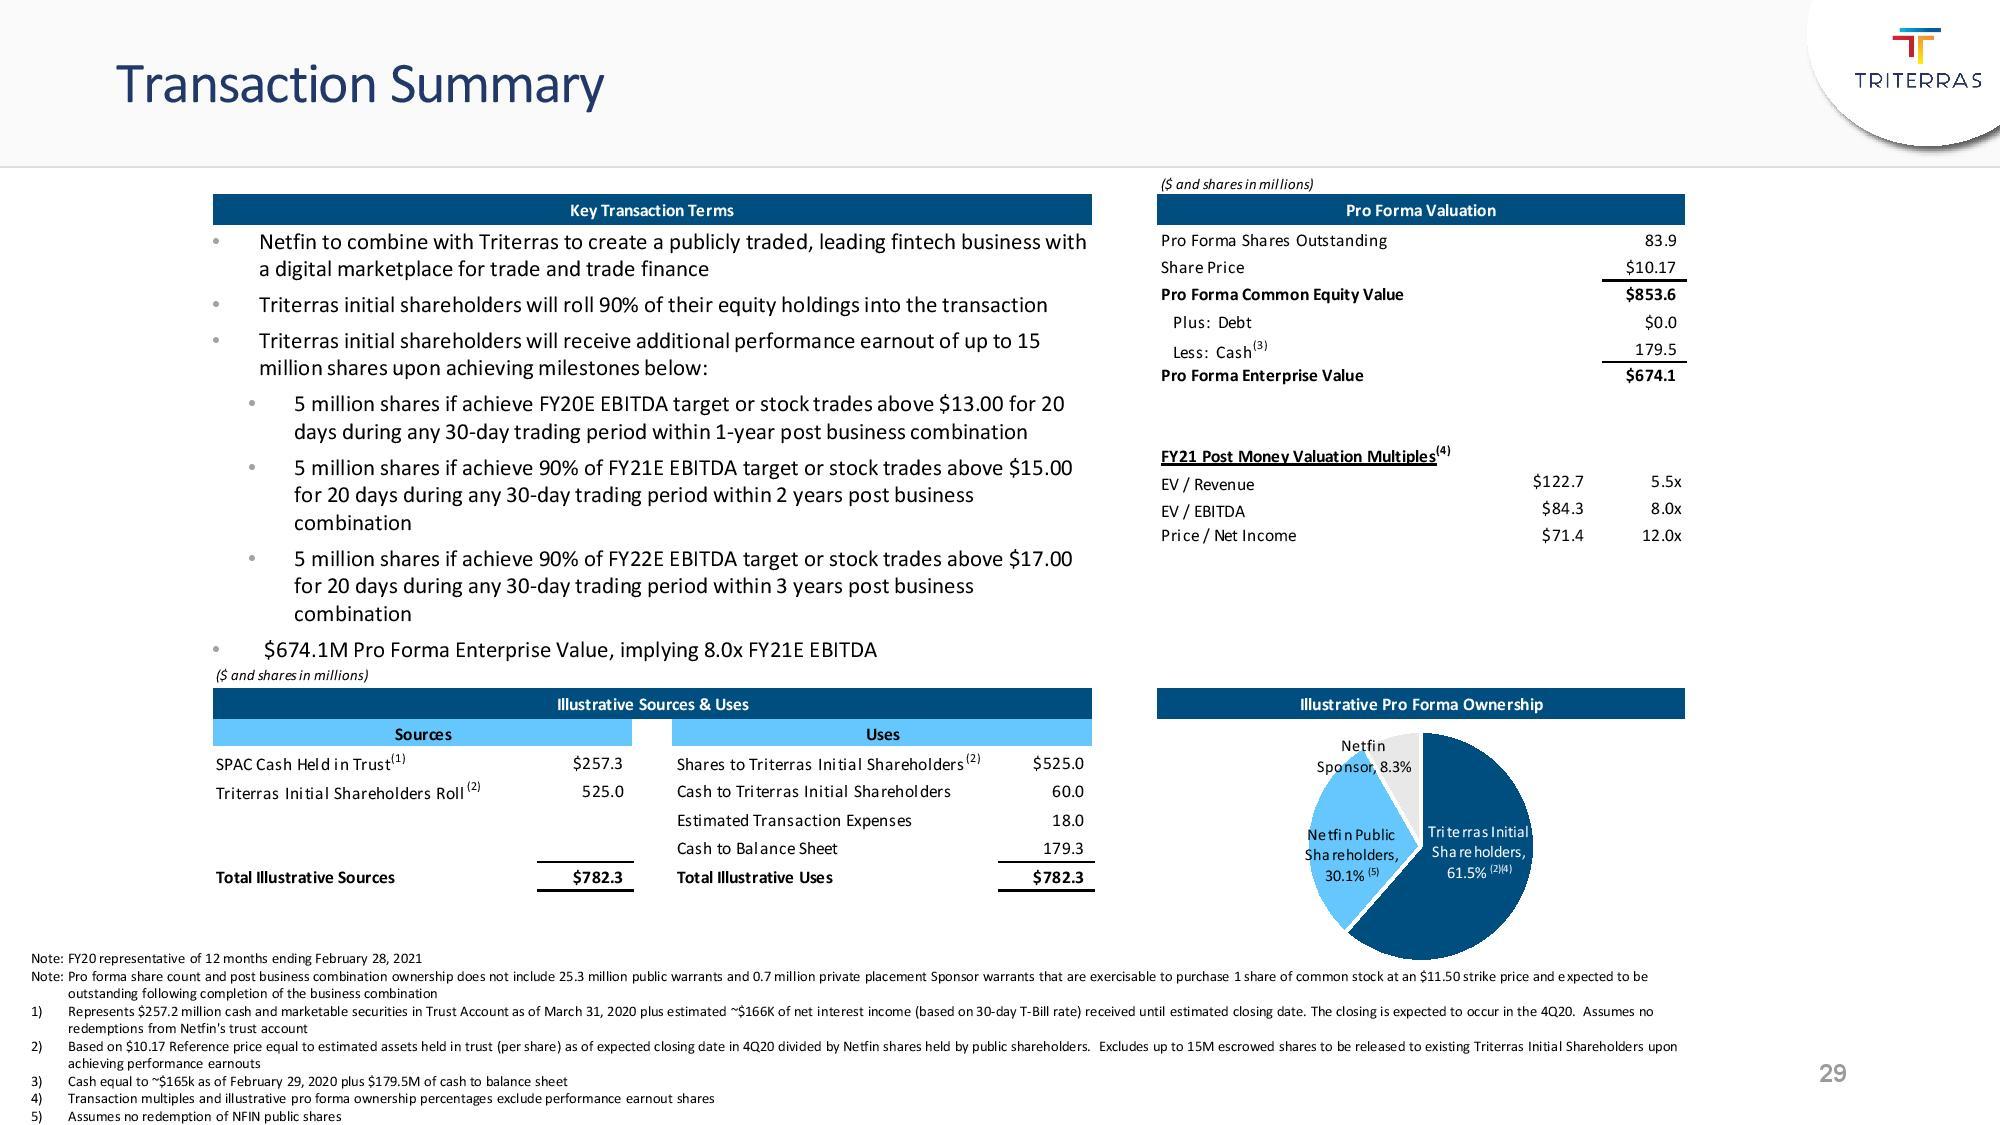
($ and shares in millions) Pro Forma Shares Outstanding 83.9 Share Price $10.17 Pro Forma Common Equity Value $853.6 Plus: Debt $0.0 Less: Cash (3) 179.5 Pro Forma Enterprise Value $674.1 FY21 Post Money Valuation Multiples (4) EV / Revenue $122.7 5.5x EV / EBITDA $84.3 8.0x Price / Net Income $71.4 12.0x ($ and shares in millions) SPAC Cash Held in Trust (1) $257.3 Shares to Triterras Initial Shareholders (2) $525.0 Triterras Initial Shareholders Roll (2) 525.0 Cash to Triterras Initial Shareholders 60.0 Estimated Transaction Expenses 18.0 Cash to Balance Sheet 179.3 Total Illustrative Sources $782.3 Total Illustrative Uses $782.3 Illustrative Pro Forma Ownership Key Transaction Terms Pro Forma Valuation Illustrative Sources & Uses Sources Uses Triterras Initial Shareholders , 61.5% (2)(4) Netfin Public Shareholders , 30.1% (5) Netfin Sponsor , 8.3% Transaction Summary • Netfin to combine with Triterras to create a publicly traded, leading fintech business with a digital marketplace for trade and trade finance • Triterras initial shareholders will roll 90% of their equity holdings into the transaction • Triterras initial shareholders will receive additional performance earnout of up to 15 million shares upon achieving milestones below: • 5 million shares if achieve FY20E EBITDA target or stock trades above $13.00 for 20 days during any 30 - day trading period within 1 - year post business combination • 5 million shares if achieve 90% of FY21E EBITDA target or stock trades above $15.00 for 20 days during any 30 - day trading period within 2 years post business combination • 5 million shares if achieve 90% of FY22E EBITDA target or stock trades above $17.00 for 20 days during any 30 - day trading period within 3 years post business combination • $674.1M Pro Forma Enterprise Value, implying 8.0x FY21E EBITDA 29 Note: FY20 representative of 12 months ending February 28, 2021 Note: Pro forma share count and post business combination ownership does not include 25.3 million public warrants and 0.7 mil lio n private placement Sponsor warrants that are exercisable to purchase 1 share of common stock at an $11.50 strike price and e xpe cted to be outstanding following completion of the business combination 1) Represents $257.2 million cash and marketable securities in Trust Account as of March 31, 2020 plus estimated ~$166K of net i nte rest income (based on 30 - day T - Bill rate) received until estimated closing date. The closing is expected to occur in the 4Q20. Assumes no redemptions from Netfin's trust account 2) Based on $10.17 Reference price equal to estimated assets held in trust (per share) as of expected closing date in 4Q20 divid ed by Netfin shares held by public shareholders. Excludes up to 15M escrowed shares to be released to existing Triterras Initia l S hareholders upon achieving performance earnouts 3) Cash equal to ~$165k as of February 29, 2020 plus $179.5M of cash to balance sheet 4) Transaction multiples and illustrative pro forma ownership percentages exclude performance earnout shares 5) Assumes no redemption of NFIN public shares
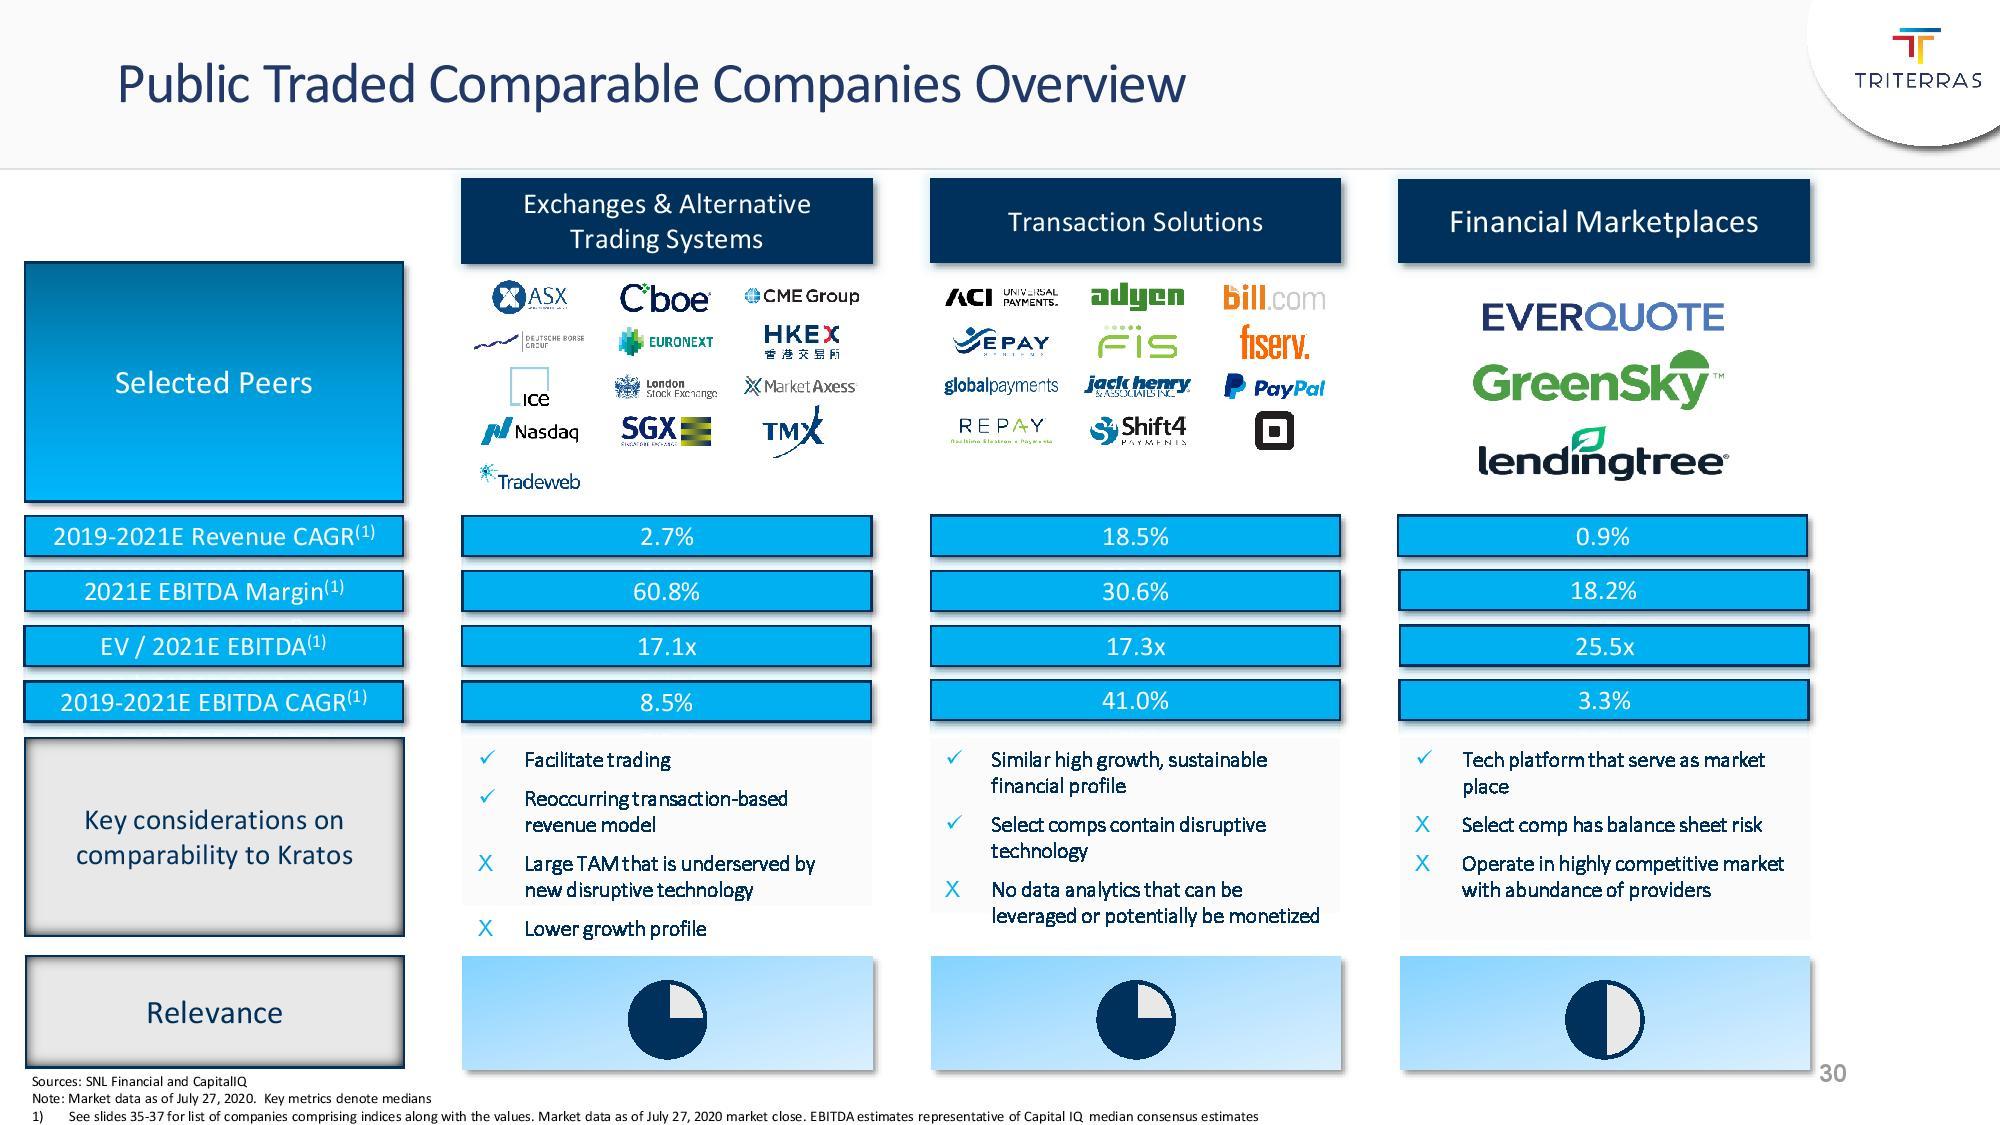
Public Traded Comparable Companies Overview Exchanges & Alternative Trading Systems Selected Peers Transaction Solutions Financial Marketplaces 2019 - 2021E Revenue CAGR (1) 2021E EBITDA Margin (1) EV / 2021E EBITDA (1) 2019 - 2021E EBITDA CAGR (1) Key considerations on comparability to Kratos Relevance 30 x Similar high growth, sustainable financial profile x Select comps contain disruptive technology X No data analytics that can be leveraged or potentially be monetized x Facilitate trading x Reoccurring transaction - based revenue model X Large TAM that is underserved by new disruptive technology X Lower growth profile x Tech platform that serve as market place X Select comp has balance sheet risk X Operate in highly competitive market with abundance of providers Sources: SNL Financial and CapitalIQ Note: Market data as of July 27, 2020. Key metrics denote medians 1) See slides 35 - 37 for list of companies comprising indices along with the values. Market data as of July 27, 2020 market close. E BITDA estimates representative of Capital IQ median consensus estimates 2.7% 60.8% 17.1x 8.5% 18.5% 30.6% 17.3x 41.0% 0.9% 18.2% 25.5x 3.3%
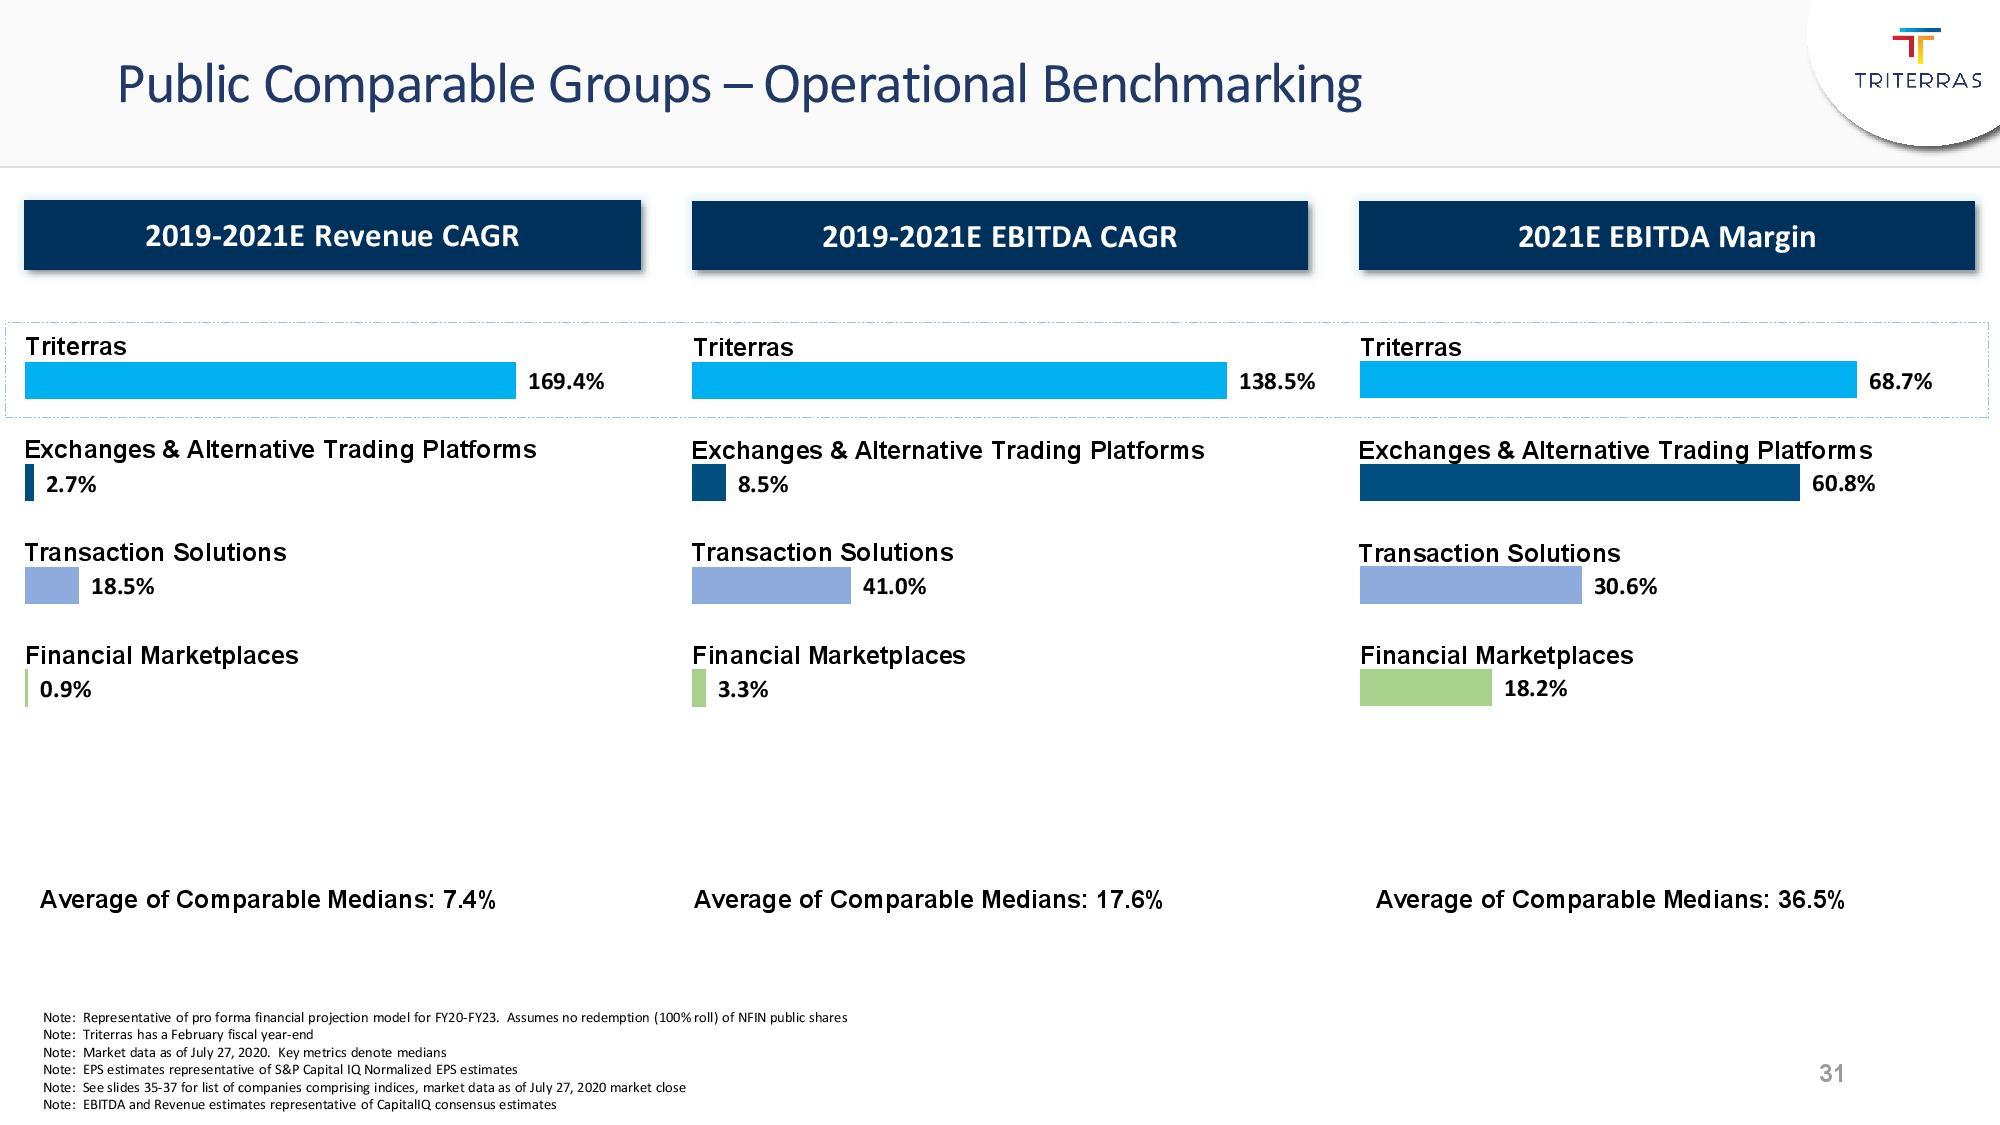
18.2% 30.6% 60.8% 68.7% 0.9% 18.5% 2.7% 169.4% 3.3% 41.0% 8.5% 138.5% Public Comparable Groups – Operational Benchmarking Triterras Transaction Solutions Financial Marketplaces Exchanges & Alternative Trading Platforms Triterras Transaction Solutions Financial Marketplaces Exchanges & Alternative Trading Platforms Triterras Transaction Solutions Financial Marketplaces Exchanges & Alternative Trading Platforms Average of Comparable Medians: 7.4% Average of Comparable Medians: 36.5% Average of Comparable Medians: 17.6% 31 2019 - 2021E Revenue CAGR 2019 - 2021E EBITDA CAGR 2021E EBITDA Margin Note: Representative of pro forma financial projection model for FY20 - FY23. Assumes no redemption (100% roll) of NFIN public shares Note: Triterras has a February fiscal year - end Note: Market data as of July 27, 2020. Key metrics denote medians Note: EPS estimates representative of S&P Capital IQ Normalized EPS estimates Note: See slides 35 - 37 for list of companies comprising indices, market data as of July 27, 2020 market close Note: EBITDA and Revenue estimates representative of CapitalIQ consensus estimates

25.5x 17.3x 17.1x 8.0x 18.7x 27.3x 23.9x 12.0x 3.2x 8.0x 11.2x 5.5x Public Comparable Groups – Valuation Benchmarking Average of Comparable Medians: 7.5x Average of Comparable Medians: 23.3x Average of Comparable Medians: 20.0x Triterras Transaction Solutions Financial Marketplaces Exchanges & Alternative Trading Platforms Triterras Transaction Solutions Financial Marketplaces Exchanges & Alternative Trading Platforms Triterras Transaction Solutions Financial Marketplaces Exchanges & Alternative Trading Platforms 32 EV / 2021E Revenue EV/ 2021E EBITDA Price / 2021E Earnings Note: Representative of pro forma financial projection model for FY20 - FY23. Assumes no redemption (100% roll) of NFIN public shares Note: Triterras has a February fiscal year - end Note: Market data as of July 27, 2020. Key metrics denote medians Note: EPS estimates representative of S&P Capital IQ Normalized EPS estimates Note: See slides 35 - 37 for list of companies comprising indices, market data as of July 27, 2020 market close Note: EBITDA and Revenue estimates representative of CapitalIQ consensus estimates

Summary Proven business with extraordinary prospects • Kratos blockchain enabled platform is a disruptive first mover in the trade and trade finance sector with commercial traction and customer adoption • Kratos squarely addresses the $1.5 trillion annual trade finance shortfall by providing new access to both lenders and traders, solving the largest problem cited by many commodity traders • A variety of catalysts and management initiatives are expected to drive continued growth • Kratos forecasts $40M EBITDA (1)(2) in FY20 and growing at an 6 0 %+ compound annual growth rate (“CAGR”) through 2023 • Fintech, Asia and non - petroleum commodities are predicted to drive the post COVID - 19 recovery • Business combination and public listing will provide greater access to capital, visibility that attracts new customers and currency for acquisitions 33 Note: FY20E and FY21E represents February 28, 2021 & 2022 fiscal year end, respectively 1) Representative of pro forma financial projection model for FY20 - FY23 contained on slides 27 and 29. Assumes no redemption (100% roll) of NFIN public shares 2) See slide 38 for EBITDA Reconciliation

34 Appendix
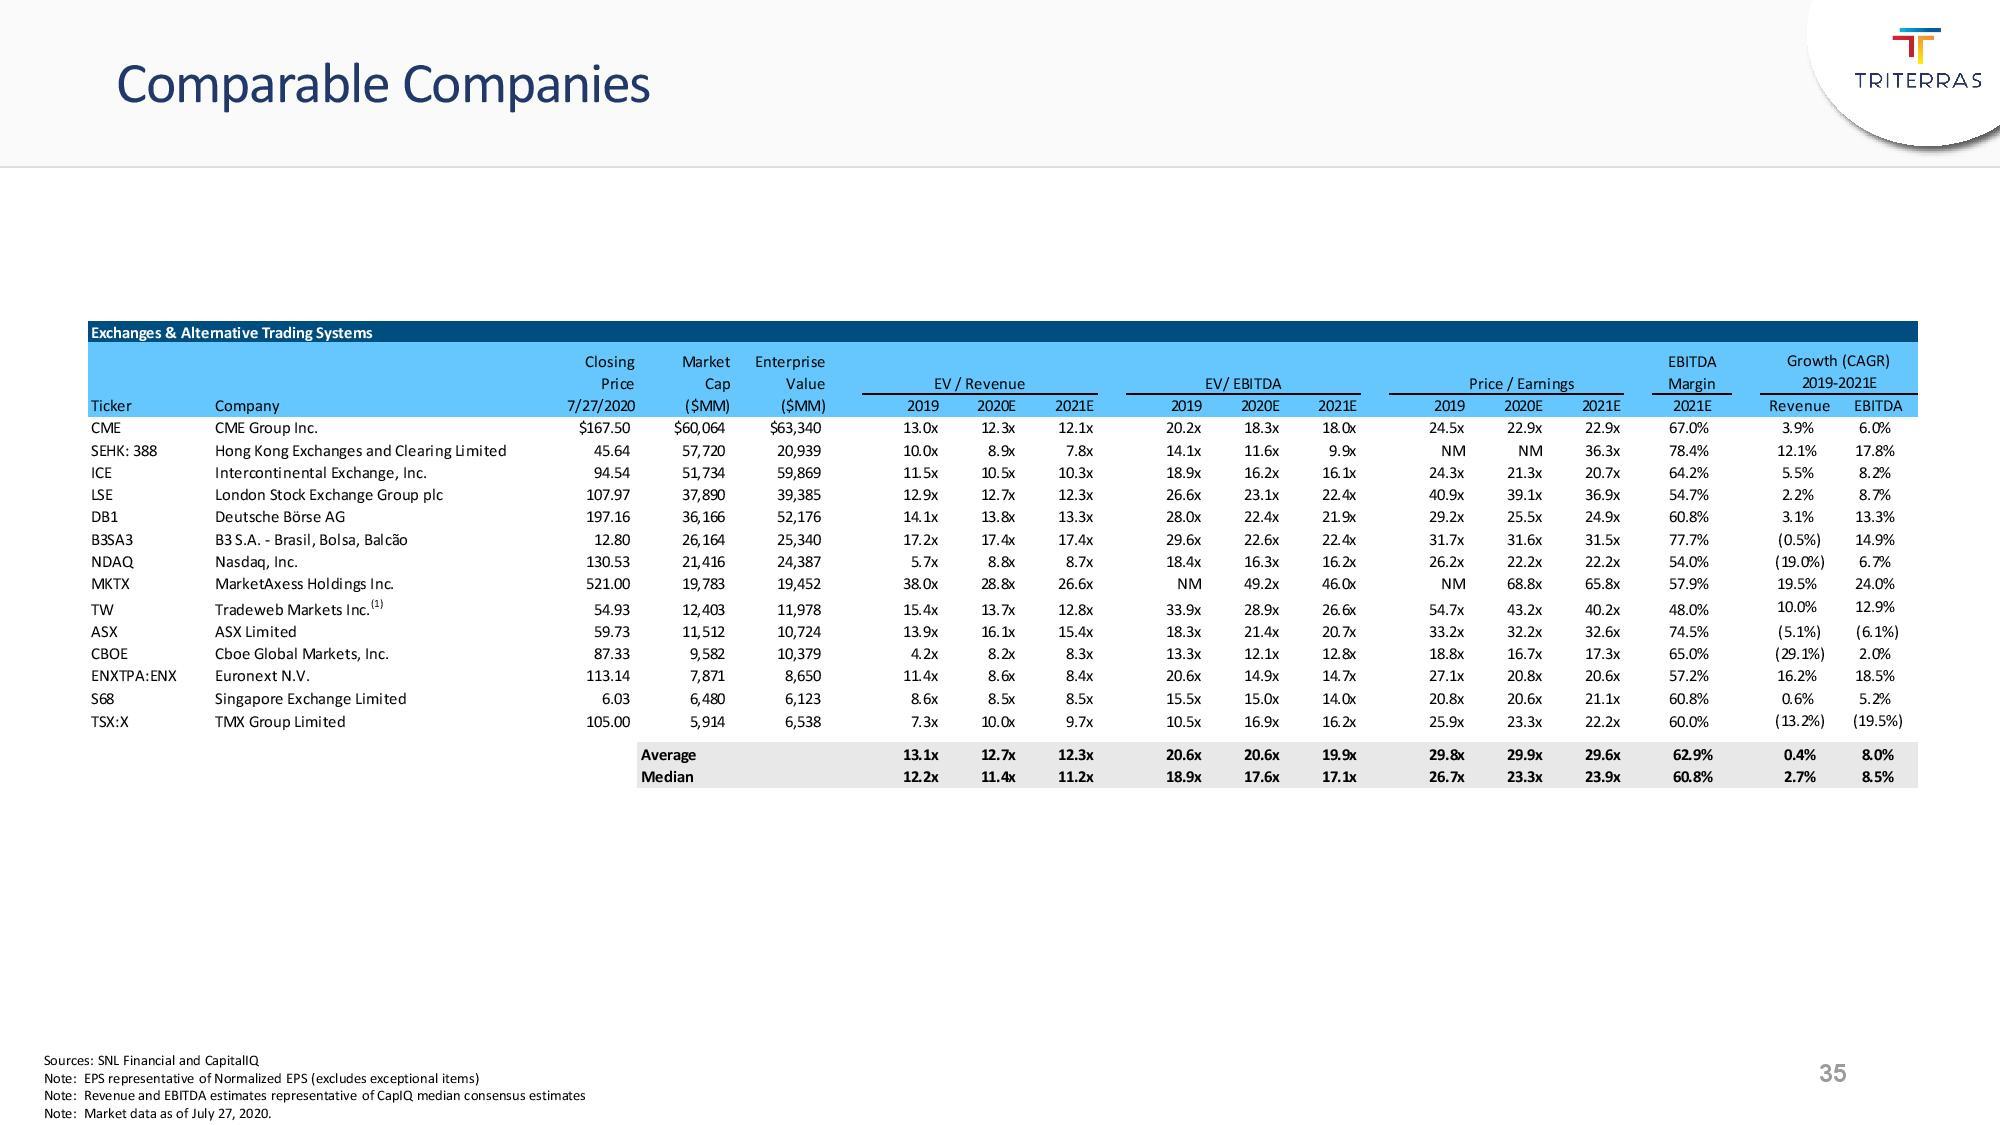
Comparable Companies 35 Sources: SNL Financial and CapitalIQ Note: EPS representative of Normalized EPS (excludes exceptional items) Note: Revenue and EBITDA estimates representative of CapIQ median consensus estimates Note: Market data as of July 27, 2020. Exchanges & Alternative Trading Systems Closing Market Enterprise EBITDA Price Cap Value EV / Revenue Price / Earnings Margin Ticker Company 7/27/2020 ($MM) ($MM) 2019 2020E 2021E 2019 2020E 2021E 2019 2020E 2021E 2021E Revenue EBITDA CME CME Group Inc. $167.50 $60,064 $63,340 13.0x 12.3x 12.1x 20.2x 18.3x 18.0x 24.5x 22.9x 22.9x 67.0% 3.9% 6.0% SEHK: 388 Hong Kong Exchanges and Clearing Limited 45.64 57,720 20,939 10.0x 8.9x 7.8x 14.1x 11.6x 9.9x NM NM 36.3x 78.4% 12.1% 17.8% ICE Intercontinental Exchange, Inc. 94.54 51,734 59,869 11.5x 10.5x 10.3x 18.9x 16.2x 16.1x 24.3x 21.3x 20.7x 64.2% 5.5% 8.2% LSE London Stock Exchange Group plc 107.97 37,890 39,385 12.9x 12.7x 12.3x 26.6x 23.1x 22.4x 40.9x 39.1x 36.9x 54.7% 2.2% 8.7% DB1 Deutsche Börse AG 197.16 36,166 52,176 14.1x 13.8x 13.3x 28.0x 22.4x 21.9x 29.2x 25.5x 24.9x 60.8% 3.1% 13.3% B3SA3 B3 S.A. - Brasil, Bolsa, Balcão 12.80 26,164 25,340 17.2x 17.4x 17.4x 29.6x 22.6x 22.4x 31.7x 31.6x 31.5x 77.7% (0.5%) 14.9% NDAQ Nasdaq, Inc. 130.53 21,416 24,387 5.7x 8.8x 8.7x 18.4x 16.3x 16.2x 26.2x 22.2x 22.2x 54.0% (19.0%) 6.7% MKTX MarketAxess Holdings Inc. 521.00 19,783 19,452 38.0x 28.8x 26.6x NM 49.2x 46.0x NM 68.8x 65.8x 57.9% 19.5% 24.0% TW Tradeweb Markets Inc. (1) 54.93 12,403 11,978 15.4x 13.7x 12.8x 33.9x 28.9x 26.6x 54.7x 43.2x 40.2x 48.0% 10.0% 12.9% ASX ASX Limited 59.73 11,512 10,724 13.9x 16.1x 15.4x 18.3x 21.4x 20.7x 33.2x 32.2x 32.6x 74.5% (5.1%) (6.1%) CBOE Cboe Global Markets, Inc. 87.33 9,582 10,379 4.2x 8.2x 8.3x 13.3x 12.1x 12.8x 18.8x 16.7x 17.3x 65.0% (29.1%) 2.0% ENXTPA:ENX Euronext N.V. 113.14 7,871 8,650 11.4x 8.6x 8.4x 20.6x 14.9x 14.7x 27.1x 20.8x 20.6x 57.2% 16.2% 18.5% S68 Singapore Exchange Limited 6.03 6,480 6,123 8.6x 8.5x 8.5x 15.5x 15.0x 14.0x 20.8x 20.6x 21.1x 60.8% 0.6% 5.2% TSX:X TMX Group Limited 105.00 5,914 6,538 7.3x 10.0x 9.7x 10.5x 16.9x 16.2x 25.9x 23.3x 22.2x 60.0% (13.2%) (19.5%) Average 13.1x 12.7x 12.3x 20.6x 20.6x 19.9x 29.8x 29.9x 29.6x 62.9% 0.4% 8.0% Median 12.2x 11.4x 11.2x 18.9x 17.6x 17.1x 26.7x 23.3x 23.9x 60.8% 2.7% 8.5% Growth (CAGR) 2019-2021E EV/ EBITDA

Comparable Companies (cont.) 36 Transaction Solutions Closing Market Enterprise EBITDA Price Cap Value EV / Revenue Price / Earnings Margin Ticker Company 7/27/2020 ($MM) ($MM) 2019 2020E 2021E 2019 2020E 2021E 2019 2020E 2021E 2021E Revenue EBITDA PYPL PayPal Holdings, Inc. $177.98 $208,977 $200,993 11.3x 9.9x 8.4x NM 36.4x 29.5x 57.8x 52.5x 42.5x 28.5% 16.0% 41.5% FIS Fidelity National Information Services, Inc. 143.44 88,622 107,816 10.4x 8.6x 7.9x 31.7x 20.3x 17.3x 26.0x 26.2x 21.3x 45.4% 15.1% 35.1% FISV Fiserv, Inc. 101.15 67,718 90,493 8.9x 5.9x 5.6x 25.6x 16.4x 14.3x 25.2x 23.0x 19.0x 39.3% 25.8% 34.0% SQ Square, Inc. 125.75 55,248 55,435 11.8x 10.6x 8.4x NM NM NM NM NM NM 8.1% 18.5% 153.3% GPN Global Payments Inc. 174.29 52,131 60,613 12.3x 9.1x 8.1x 31.5x 19.9x 16.8x 28.2x 28.1x 22.2x 48.2% 23.6% 37.0% ADYEN Adyen N.V. 1,647.45 49,809 47,812 NM NM 44.8x NM NM NM NM NM NM 56.5% 40.8% 42.1% JKHY Jack Henry & Associates, Inc. 180.70 13,844 13,858 8.5x 8.0x 7.4x 30.7x 25.4x 24.2x 50.0x 46.4x 42.2x 30.6% 7.0% 12.5% BILL Bill.com Holdings, Inc. 82.89 6,375 5,995 44.7x 37.2x 28.8x NM NM NM NM NM NM NM 24.5% 4.8% ACIW ACI Worldwide, Inc. 27.31 3,166 4,474 3.6x 3.3x 3.0x 22.2x 13.2x 11.0x 20.8x 22.5x 15.8x 27.6% 8.0% 41.7% EPAY Bottomline Technologies (de), Inc. 48.85 2,146 2,175 5.0x 4.8x 4.4x NM 23.0x 19.3x 37.8x 43.3x 32.3x 22.6% 7.2% 72.8% FOUR Shift4 Payments, Inc. 36.53 1,506 2,187 3.0x 3.8x 2.1x 30.8x 37.9x 15.5x NM NM NM 13.8% 18.5% 41.0% RPAY Repay Holdings Corporation 23.10 1,150 1,563 14.9x 10.1x 8.5x NM 23.7x 19.2x 37.8x 43.4x 36.7x 43.9% 32.9% NM Average 12.2x 10.1x 11.4x 28.7x 24.0x 18.6x 35.5x 35.7x 29.0x 33.1% 19.8% 46.9% Median 10.4x 8.6x 8.0x 30.8x 23.0x 17.3x 33.0x 35.7x 27.3x 30.6% 18.5% 41.0% Growth (CAGR) EV/ EBITDA 2019-2021E Sources: SNL Financial and CapitalIQ Note: EPS representative of Normalized EPS (excludes exceptional items) Note: Revenue and EBITDA estimates representative of CapIQ median consensus estimates Note: Market data as of July 27, 2020.

Comparable Companies (cont.) 37 Financial Marketplaces Closing Market Enterprise EBITDA Price Cap Value EV / Revenue Price / Earnings Margin Ticker Company 7/27/2020 ($MM) ($MM) 2019 2020E 2021E 2019 2020E 2021E 2019 2020E 2021E 2021E Revenue EBITDA TREE LendingTree, Inc. $353.26 $4,615 $4,968 4.5x 5.6x 4.6x 36.1x 34.6x 25.5x NM NM NM 18.2% (1.5%) 19.0% EVER EverQuote, Inc. 49.03 1,325 1,275 5.1x 3.9x 3.2x NM NM 53.4x NM NM NM 5.9% 27.2% NM GSKY GreenSky, Inc. 5.28 338 957 1.8x 2.1x 1.8x 6.5x 12.5x 8.5x 9.4x 28.8x 18.7x 20.8% 0.9% (12.5%) Average 3.8x 3.8x 3.2x 21.3x 23.5x 29.1x 9.4x 28.8x 18.7x 15.0% 8.9% 3.3% Median 4.5x 3.9x 3.2x 21.3x 23.5x 25.5x 9.4x 28.8x 18.7x 18.2% 0.9% 3.3% Growth (CAGR) 2019-2021E EV/ EBITDA Sources: SNL Financial and CapitalIQ Note: EPS representative of Normalized EPS (excludes exceptional items) Note: Revenue and EBITDA estimates representative of CapIQ median consensus estimates Note: Market data as of July 27, 2020.

EBITDA Reconciliation 38 Note: FY19 is representative of the 12 months ending February 29 th , 2020 ($ in millions) FY19 (1) FY20E FY21E FY22E FY23E Net Income $13.2 $32.9 $71.4 $113.4 $143.6 (-) Interest Income ($0.0) ($0.8) ($4.5) ($4.5) ($8.3) (+) Interest Expense 0.0 0.0 0.0 0.0 0.0 (+) Tax Expense 1.6 6.7 14.6 23.2 29.4 (+) Depreciation and Amortization 0.0 1.0 2.8 7.5 12.5 EBITDA $14.8 $39.8 $84.3 $139.6 $177.2
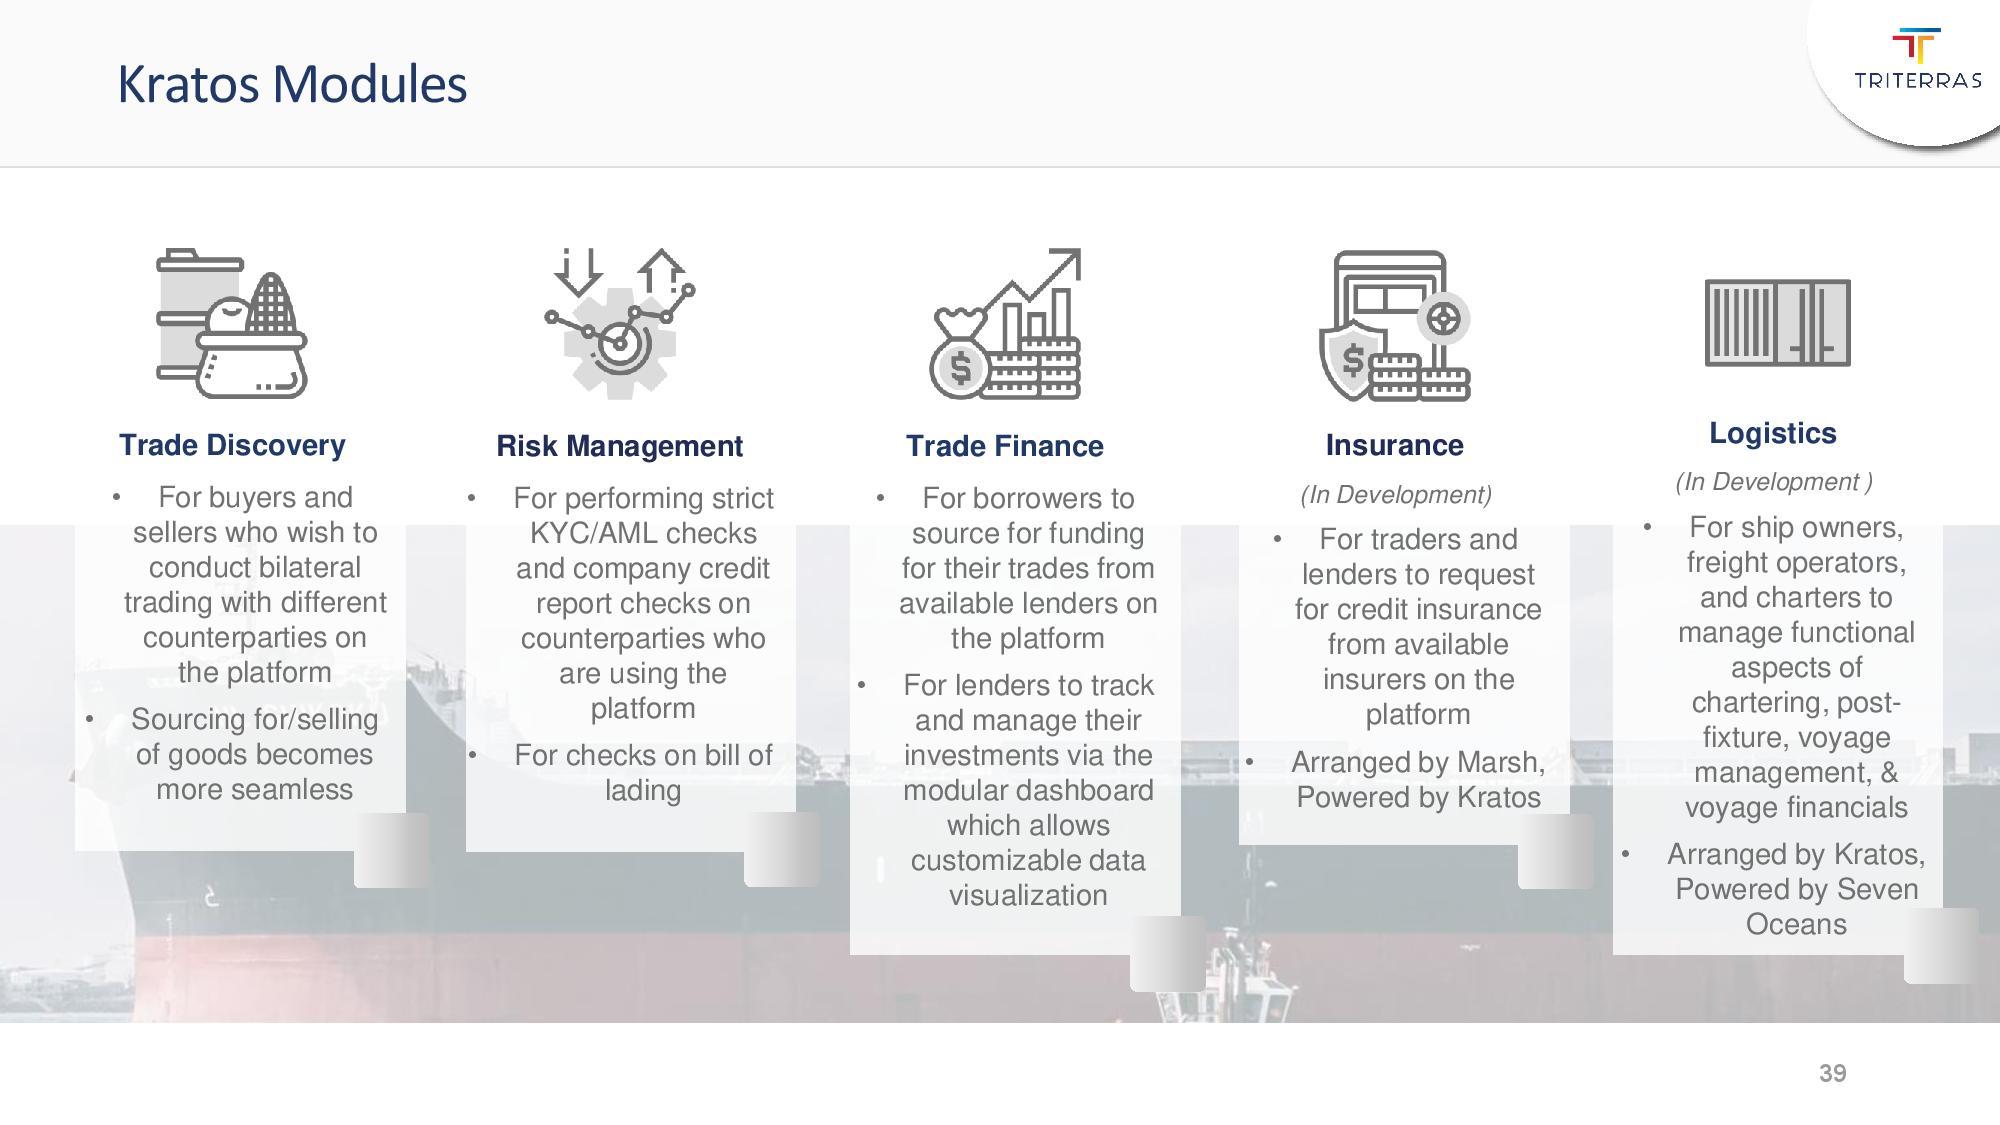
Trade Discovery • For buyers and sellers who wish to conduct bilateral trading with different counterparties on the platform • Sourcing for/selling of goods becomes more seamless Risk Management • For performing strict KYC/AML checks and company credit report checks on counterparties who are using the platform • For checks on bill of lading Trade Finance • For borrowers to source for funding for their trades from available lenders on the platform • For lenders to track and manage their investments via the modular dashboard which allows customizable data visualization Logistics (In Development ) • For ship owners, freight operators, and charters to manage functional aspects of chartering, post - fixture, voyage management, & voyage financials • Arranged by Kratos, Powered by Seven Oceans Insurance (In Development) • For traders and lenders to request for credit insurance from available insurers on the platform • Arranged by Marsh, Powered by Kratos Kratos Modules 39

Bank - Grade KYC/AML Bank - grade background checks to verify client details and enhance security and compliance Dashboards Customizable data visualization via modular dashboard to support strategic decision - making and provide actionable insights Digital Contracts Trade documents are digitized and stored in blockchain to ensure transparency and efficiency and reduce the chances of document alteration User Permissions Control Role - based and/or user - based permissions are assigned to individuals to specify what actions can be performed Notification System System notifications through the platform and email are in place to update users on their transactions Chat Functionality Communicate directly with counterparts and lenders in your network and access chat history for easy reference Platform Features 40

41 Kratos High Level Architecture Email Server n n n n n n Users Web Server EC2 File Server S3 Database Server RDS API Gateway

Building Receivables Docs on the KRATOS TM Blockchain Links to the blockchain make all steps in the process verifiable and immutable • KRATOS TM links 12 steps of a trade finance transaction to the blockchain; 6 times for a trade transaction • It is the immutability and security of blockchain which is critical to adoption of any platform 01 Order creation Order accepted by the Counterparty Order con firmed (accepted order got approved) Payment acknowledgement , Order Closed 02 03 04 05 0 6 0 7 08 10 11 09 12 Trade Document Acknowledgement Payment c onfirmation d ocument u pload Borrower’s request for funding Borrower acknowledges the approval and uploads LPA Lender disburses the approved funds Order accepted by counterparty Lender approves the fund request and uploads the RPA Deal is closed (Borrower pays back to Lender) Trading Module Lending Module 42
