Attached files
| file | filename |
|---|---|
| 8-K - FORM 8-K - Blue Apron Holdings, Inc. | tm2025909d1_8k.htm |
Exhibit 99.1

Q2 2020 Earnings Call ond Quarter 2020 E A R N I N G S C A L L Sec
Q2 2020 Earnings Call2 Disclaimer: Forward Looking Statements and Use of Non-GAAP Information This presentation includes statements concerning Blue Apron Holdings, Inc. and its future expectations, plans and prospects that constitute "forward-looking statements" within the meaning of the Private Securities Litigation Reform Act of 1995. For this purpose, any statements contained herein that are not statements of historical fact may be deemed to be forward-looking statements. In some cases, you can identify forward-looking statements by terms such as "may," "should," "expects," "plans," "anticipates," "could," "intends," "target," "projects," "contemplates," "believes," "estimates," "predicts," "potential," or "continue," or the negative of these terms or other similar expressions. Blue Apron has based these forward-looking statements largely on its current expectations and projections about future events and financial trends that it believes may affect its business, financial condition and results of operations. These forward-looking statements speak only as of the date of this presentation and are subject to a number of risks, uncertainties and assumptions including, without limitation, the company achieving its expectations with regards to its expenses and revenue, its ability to maintain and grow adjusted EBITDA and to achieve or maintain profitability, the sufficiency of the company’s cash resources, the company’s need for additional financing, its ability to effectively manage expenses and cash flows, and its ability to remain in compliance with the financial and other covenants under the company’s indebtedness; its ability, including the timing and extent, to obtain additional financing and sufficiently manage costs and to fund investments in operations in amounts necessary to support the execution of the company’s growth strategy; its ability, including the timing and extent, to successfully execute the company’s growth strategy, cost-effectively attract new customers and retain existing customers, and to expand its direct-to-consumer product offerings; its ability to sustain the recent increase in demand resulting from the COVID-19 (coronavirus) pandemic and to retain new customers; any material and adverse impact of the COVID-19 pandemic on the company’s operations and results, including as a result of the loss of adequate labor, whether as a result of heightened absenteeism or challenges in recruiting and retention or otherwise, any prolonged closures, or series of temporary closures, of one or more fulfillment centers and supply chain or carrier interruptions or delays; changes in consumer behaviors that could lead to declines in demand, both as stay-at-home orders and restaurant and other restrictions are lifted to varying degrees across the United States, and/or as consumer fears dissipate, and/or as a result of the COVID-19 pandemic’s impact on financial markets and economic conditions, including on consumer spending habits; its ability to identify, consummate and realize the anticipated benefits of strategic alternatives and the structure, terms and specific risks and uncertainties associated with any such potential strategic alternatives; achieving its expectations regarding the benefits and expected costs and charges associated with the company’s closure of its Arlington, Texas fulfillment center; its ability to maintain and grow the value of the company’s brand and reputation; its expectations regarding, and the stability of, its supply chain, including potential shortages or interruptions in the supply or delivery of ingredients, as a result of COVID-19 or otherwise; its ability to maintain food safety and prevent food-borne illness incidents; its ability to accommodate general changes in consumer tastes and preferences or in consumer spending; its ability to effectively compete; its ability to attract and retain qualified employees and key personnel in sufficient numbers; its ability to comply with modified or new laws and regulations applying to its business; risks resulting from its vulnerability to adverse weather conditions, natural disasters and public health crises, including pandemics; its ability to obtain and maintain intellectual property protection; and other risks more fully described in the company’s Annual Report on Form 10-K for the year ended December 31, 2019 filed with the Securities and Exchange Commission (“SEC”) on February 18, 2020, the company’s Quarterly Report on Form 10-Q for the quarter ended March 31, 2020 filed with the SEC on April 29, 2020, the company’s Quarterly Report on Form 10-Q for the quarter ended June 30, 2020 to be filed with the SEC, and in other filings that the company may make with the SEC in the future. The company assumes no obligation to update any forward-looking statements contained in this presentation as a result of new information, future events or otherwise. This presentation also includes adjusted EBITDA which is a non-GAAP financial measure that is not prepared in accordance with, nor an alternative to, financial measures prepared in accordance with U.S. generally accepted accounting principles (“GAAP”). In addition, this non-GAAP financial measure is not based on any standardized methodology prescribed by GAAP and is not necessarily comparable to similarly-titled measures presented by other companies. A reconciliation of this measure to the most directly comparable GAAP measures is included in the Appendix to this presentation. Certain data in this presentation was obtained from various external sources, and neither the company nor its affiliates, advisors, or representatives make any representation as to the accuracy or completeness of that data or any commitment to update such data after the date of this presentation. Such data involve risks and uncertainties and are subject to change based on various factors.

Second Quarter 2020 Business Highlights

Q2 2020 Earnings Call4 Linda Findley Kozlowski President and Chief Executive Officer
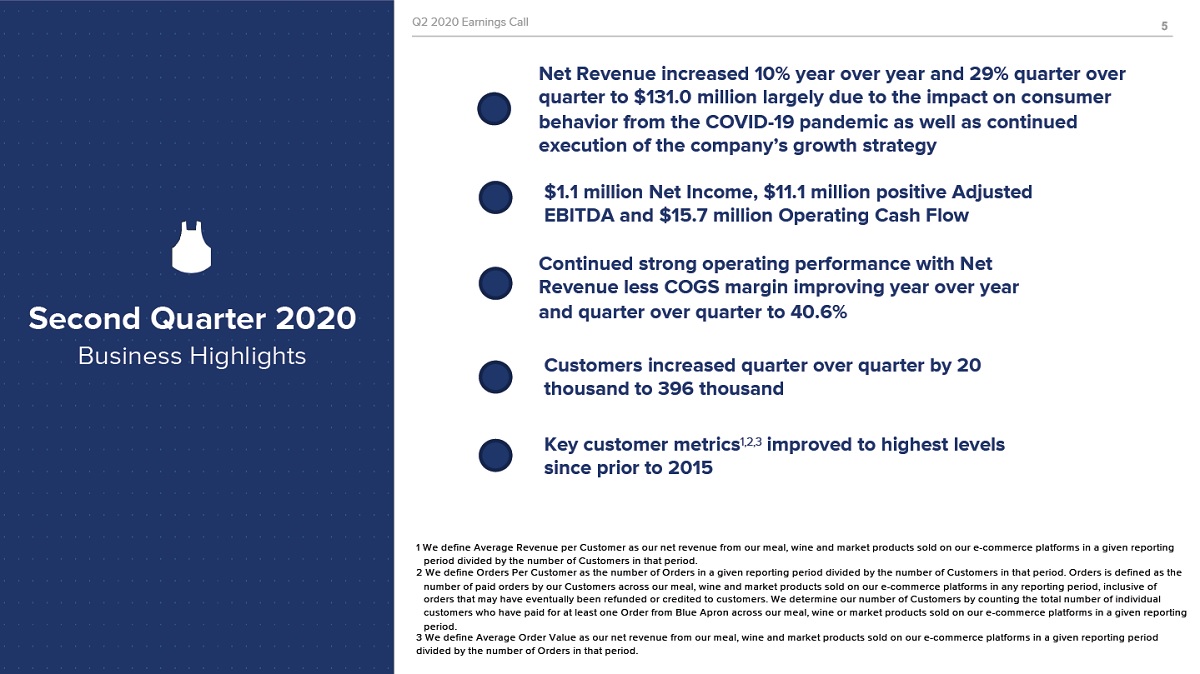
Q2 2020 Earnings Call Q2 2020 Earnings Call5 Net Revenue increased 10% year over year and 29% quarter over quarter to $131.0 million largely due to the impact on consumer behavior from the COVID-19 pandemic as well as continued execution of the company’s growth strategy $1.1 million Net Income, $11.1 million positive Adjusted EBITDA and $15.7 million Operating Cash Flow Second Quarter 2020 Business Highlights Continued strong operating performance with Net Revenue less COGS margin improving year over year and quarter over quarter to 40.6% Customers increased quarter over quarter by 20 thousand to 396 thousand Key customer metrics1,2,3 improved to highest levels since prior to 2015 1 W e define Average Revenue per Customer as our net revenue from our meal, wine and market products sold on our e-commerce platforms in a given reporting period divided by the number of Customers in that period. 2 W e define Orders Per Customer as the number of Orders in a given reporting period divided by the number of Customers in that period. Orders is defined as the number of paid orders by our Customers across our meal, wine and market products sold on our e-commerce platforms in any reporting period, inclusive of orders that may have eventually been refunded or credited to customers. W e determine our number of Customers by counting the total number of individual customers who have paid for at least one Order from Blue Apron across our meal, wine or market products sold on our e-commerce platforms in a given reporting period. 3 W e define Average Order Value as our net revenue from our meal, wine and market products sold on our e-commerce platforms in a given reporting period divided by the number of Orders in that period.
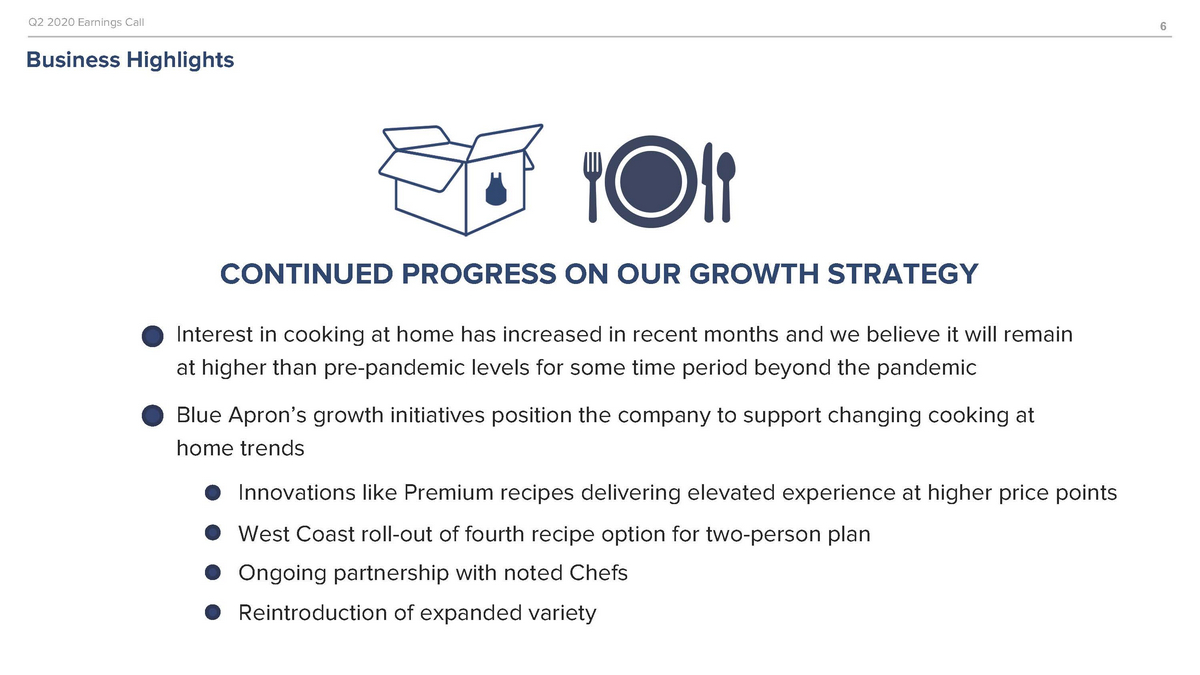
Q2 2020 Earnings Call6 Business Highlights CONTINUED PROGRESS ON OUR GROWTH STRATEGY Interest in cooking at home has increased in recent months and we believe it will remain at higher than pre-pandemic levels for some time period beyond the pandemic Blue Apron’s growth initiatives position the company to support changing cooking at home trends Innovations like Premium recipes delivering elevated experience at higher price points West Coast roll-out of fourth recipe option for two-person plan Ongoing partnership with noted Chefs Reintroduction of expanded variety
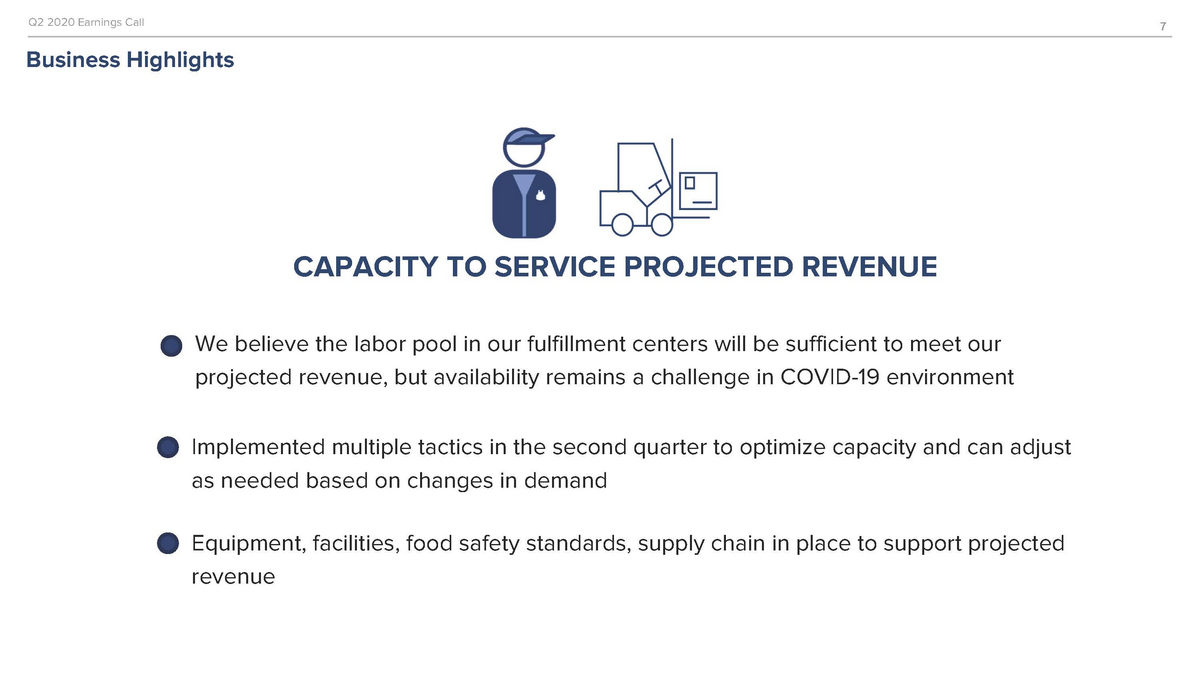
Q2 2020 Earnings Call7 Business Highlights CAPACITY TO SERVICE PROJECTED REVENUE We believe the labor pool in our fulfillment centers will be sufficient to meet our projected revenue, but availability remains a challenge in COVID-19 environment Implemented multiple tactics in the second quarter to optimize capacity and can adjust as needed based on changes in demand Equipment, facilities, food safety standards, supply chain in place to support projected revenue
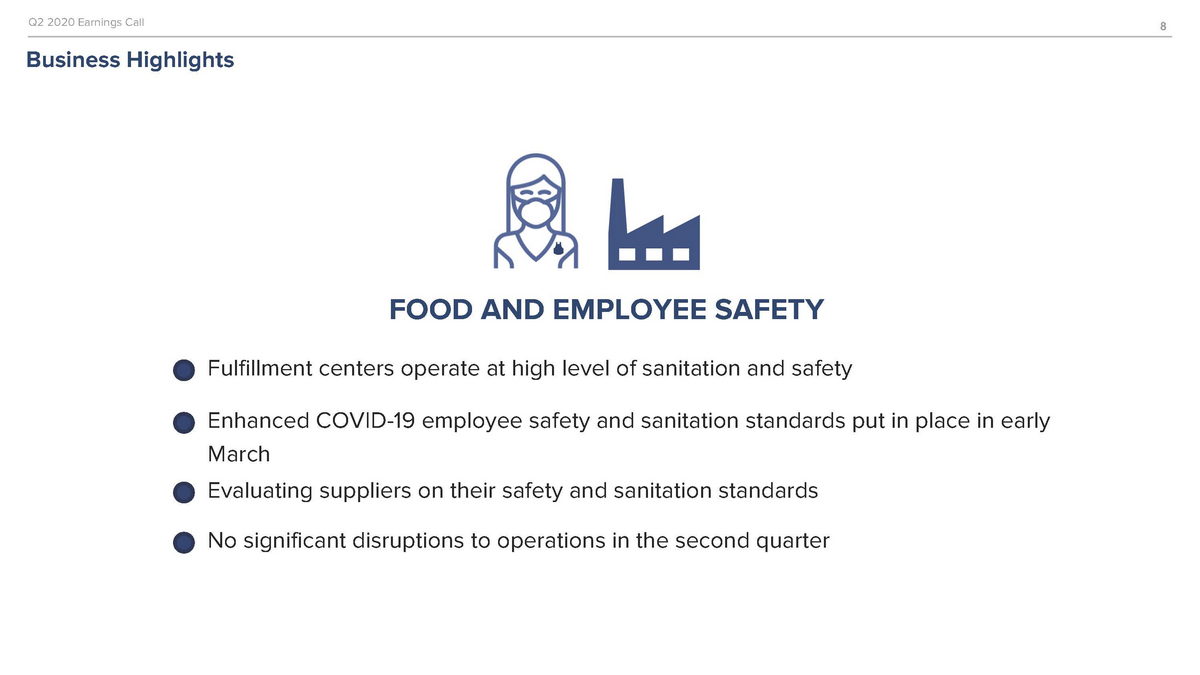
Q2 2020 Earnings Call8 Business Highlights FOOD AND EMPLOYEE SAFETY Fulfillment centers operate at high level of sanitation and safety Enhanced COVID-19 employee safety and sanitation standards put in place in early March Evaluating suppliers on their safety and sanitation standards No significant disruptions to operations in the second quarter

Second Quarter 2020 Financial Highlights

Q2 2020 Earnings Call10 Tim Bensley Chief Financial Officer
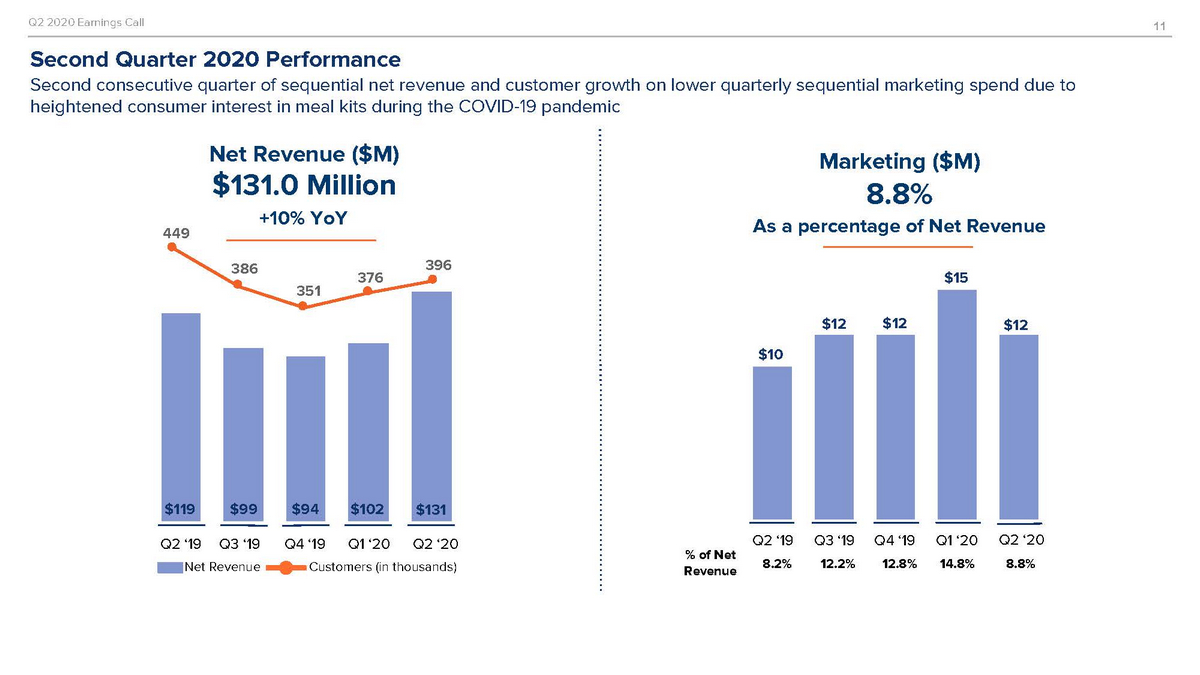
Q2 2020 Earnings Call11 Second Quarter 2020 Performance Second consecutive quarter of sequential net revenue and customer growth on lower quarterly sequential marketing spend due to heightened consumer interest in meal kits during the COVID-19 pandemic 449 Net Revenue ($M) $ Marketing ($M) As a pe 386 351 376 396 $10 $12$12$12 $119$99 $94 $102 $131 131.0 Million +10% YoY 8.8% rcentage of Net Revenue $15 Q2 ‘19Q3 ‘19Q4 ‘19Q1 ‘20 Q2 ‘20 Net RevenueCustomers (in thousands) % of Net Revenue Q2 ‘19Q3 ‘19Q4 ‘19Q1 ‘20 Q2 ‘20 8.2%12.2%12.8%14.8%8.8%
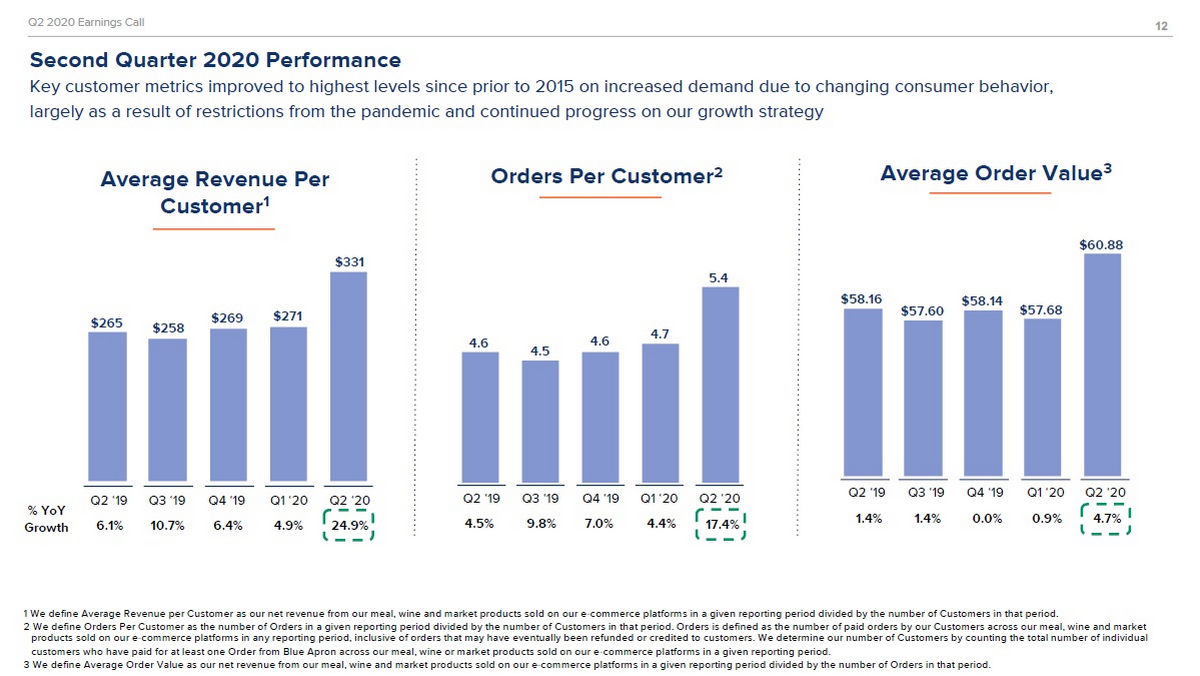
Q2 2020 Earnings Call12 Second Quarter 2020 Performance Key customer metrics improved to highest levels since prior to 2015 on increased demand due to changing consumer behavior, largely as a result of restrictions from the pandemic and continued progress on our growth strategy Aver Ord $265 $258 $269 $271 $331 4.6 4.5 4.6 4.7 5.4 $58.16 $57.60 $58.14 $57.68 % YoY Growth 6.1%10.7% 6.4%4.9%24.9% 4.5% 9.8% age Order Value3 Q2 ‘19Q3 ‘19Q4 ‘19Q1 ‘20 Q2 ‘20 age Revenue PerAver Customer1 $60.88 Q2 ‘19Q3 ‘19Q4 ‘19Q1 ‘20 Q2 ‘20 1.4%1.4%0.0%0.9%4.7% Q2 ‘19Q3 ‘19Q4 ‘19Q1 ‘20 Q2 ‘20 ers Per Customer2 7.0%4.4%17.4% 1 W e define Average Revenue per Customer as our net revenue from our meal, wine and market products sold on our e-commerce platforms in a given reporting period divided by the number of Customers in that period. 2 W e define Orders Per Customer as the number of Orders in a given reporting period divided by the number of Customers in that period. Orders is defined as the number of paid orders by our Customers across our meal, wine and market products sold on our e-commerce platforms in any reporting period, inclusive of orders that may have eventually been refunded or credited to customers. W e determine our number of Customers by counting the total number of individual customers who have paid for at least one Order from Blue Apron across our meal, wine or market products sold on our e-commerce platforms in a given reporting period. 3 W e define Average Order Value as our net revenue from our meal, wine and market products sold on our e-commerce platforms in a given reporting period divided by the number of Orders in that period.
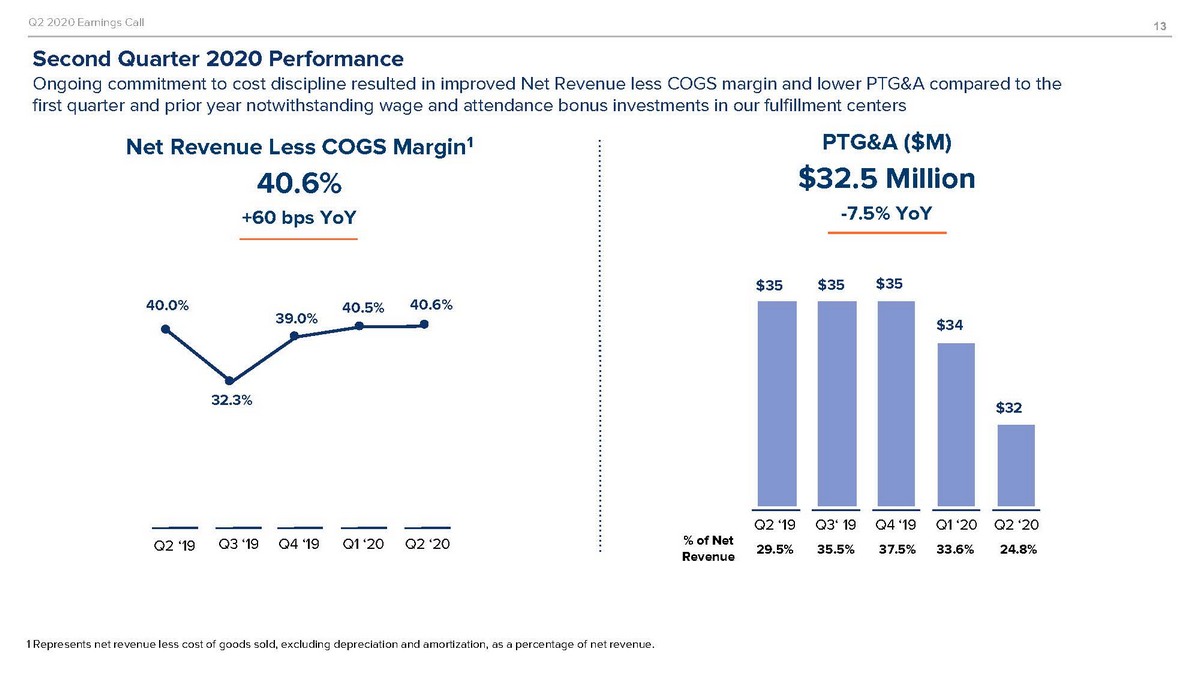
Q2 2020 Earnings Call13 Second Quarter 2020 Performance Ongoing commitment to cost discipline resulted in improved Net Revenue less COGS margin and lower PTG&A compared to the first quarter and prior year notwithstanding wage and attendance bonus investments in our fulfillment centers Net Revenue Less COGS Margin1 PTG&A ($M) $ 40.0% 39.0% 40.5% $35 $ $34 32.3% $32 % of Net Revenue Q4 ‘19Q1 ‘20 Q2 ‘20 Q2 ‘19Q3‘ 19 Q2 ‘19Q3 ‘19Q4 ‘19Q1 ‘20 Q2 ‘20 40.6% +60 bps YoY 40.6% 32.5 Million -7.5% YoY 35 $35 1 Represents net revenue less cost of goods sold, excluding depreciation and amortization, as a percentage of net revenue.
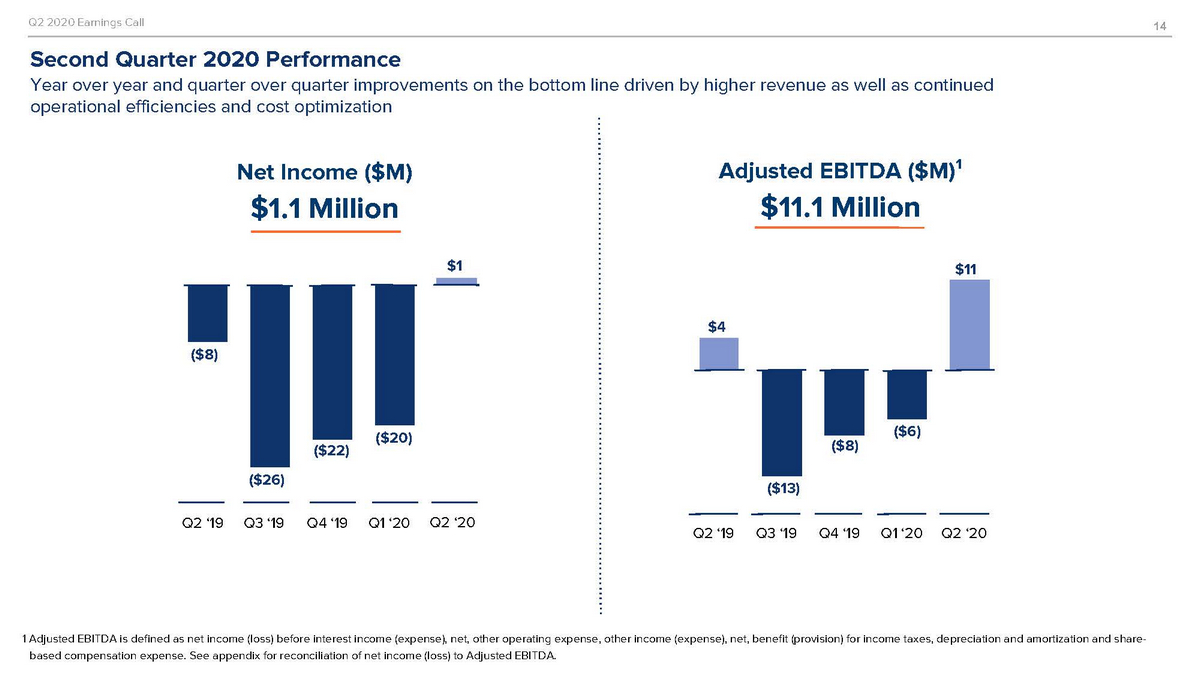
Q2 2020 Earnings Call14 Second Quarter 2020 Performance Year over year and quarter over quarter improvements on the bottom line driven by higher revenue as well as continued operational efficiencies and cost optimization NAdjusted EBITDA ($M)¹ $11.1 Million $11 $4 ($8) ($26) ($22) ($20) ($13) ($8) ($6) Q2 ‘19Q3 ‘19Q4 ‘19Q1 ‘20 Q2 ‘20 Q2 ‘19Q3 ‘19Q4 ‘19Q1 ‘20 Q2 ‘20 et Income ($M) $1.1 Million $1 1 Adjusted EBITDA is defined as net income (loss) before interest income (expense), net, other operating expense, other income (expense), net, benefit (provision) for income taxes, depreciation and amortization and share-based compensation expense. See appendix for reconciliation of net income (loss) to Adjusted EBITDA.

Financial Outlook
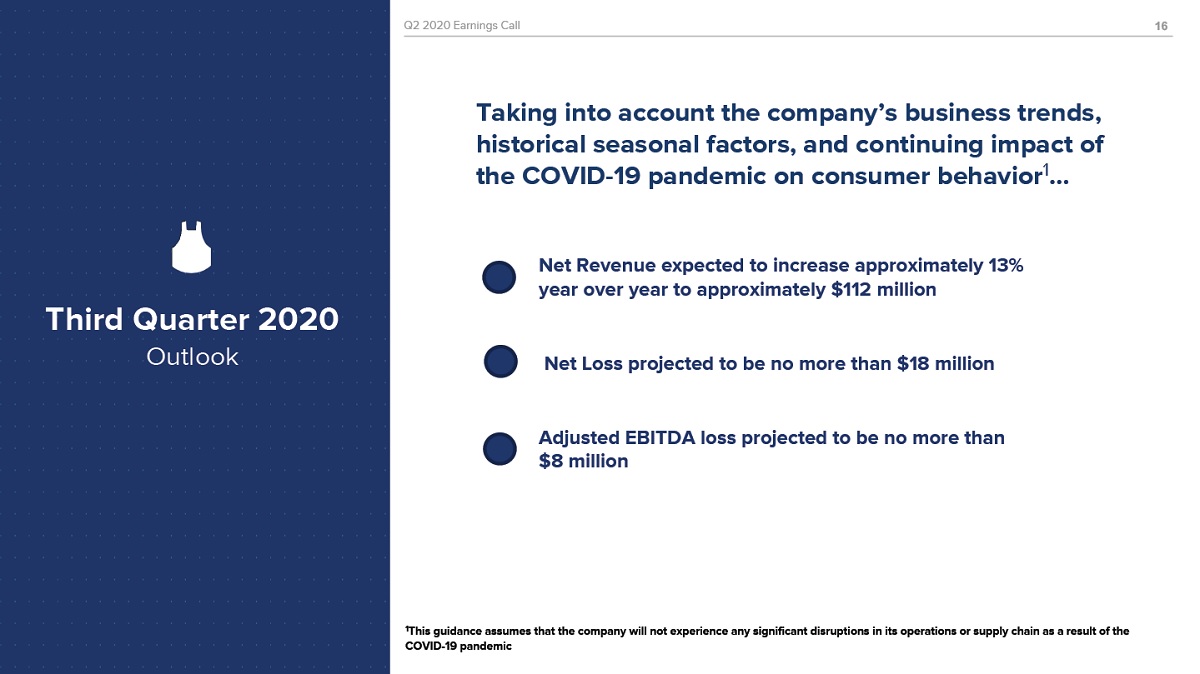
Q2 2020 Earnings Call Q2 2020 Earnings Call16 Taking into account the company’s business trends, historical seasonal factors, and continuing impact of the COVID-19 pandemic on consumer behavior1… Third Quarter 2020 Outlook Net Revenue expected to increase approximately 13% year over year to approximately $112 million Net Loss projected to be no more than $18 million Adjusted EBITDA loss projected to be no more than $8 million 1This guidance assumes that the company will not experience any significant disruptions in its operations or supply chain as a result of the COVID-19 pandemic

Q&A

Appendix: Adjusted EBITDA Reconciliation
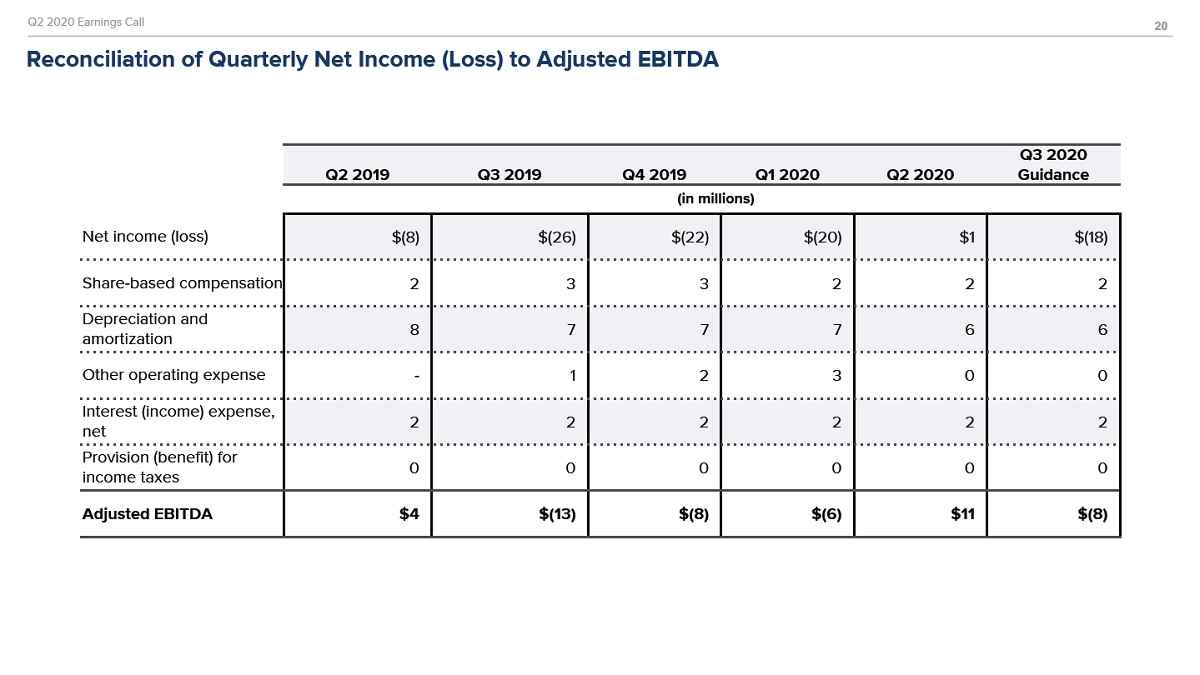
Q2 2020 Earnings Call Reconciliation of Quarterly Net Income (Loss) to Adjusted EBITDA 20 Q2 2019 Q3 2019 Q4 2019 Q1 2020 Q2 2020 Q3 2020 Guidance (in millions) Net income (loss) $(8) $(26) $(22) $(20) $1 $(18) Share-based compensation 2 3 3 2 2 2 Depreciation and amortization 8 7 7 7 6 6 Other operating expense - 1 2 3 0 0 Interest (income) expense, net 2 2 2 2 2 2 Provision (benefit) for income taxes 0 0 0 0 0 0 Adjusted EBITDA $4 $(13) $(8) $(6) $11 $(8)