Attached files
| file | filename |
|---|---|
| 8-K - FORM 8-K - SOUTHERN COPPER CORP/ | tm2025798d2_8k.htm |
Exhibit 99.1
 |
RESULTS SECOND QUARTER AND SIX MONTHS 2020 Investor Relations: Raul Jacob Victor Pedraglio +(602) 264-1375 southerncopper@southernperu.com.pe www.southerncoppercorp.com July 28, 2020 Southern Copper Corporation (NYSE and BVL: SCCO) 2Q20 net sales were $1,785.4 million. Sales volumes increased for copper (+11.0%), molybdenum (+15.4%) and silver (+28.1%). However, due to lower metal prices for copper (-12.6% LME), molybdenum (-32.1%) and zinc (-28.8%), net sales fell 1.8% when compared to 2Q19. On a QoQ basis, net sales were 3.8% higher than in 1Q20. 2Q20 net income was $259.5 million, which represented a 35.5% decrease with regard to the $402.4 million registered in 2Q19. The net income margin in 2Q20 was situated at 14.5%, versus 22.1% in 2Q19. These decreases were mainly attributable to lower sales and an increase in operating costs (+9.4%). Costs increased due to growth in: sales volumes, leachable material costs, and third parties copper purchases. Higher costs were partially offset by a decrease in fuel costs and by the effect of exchange rate depreciation on local currency costs. On a QoQ basis, net income was 20.8% higher than in 1Q20. 2Q20 adjusted EBITDA was $770.0 million, which represented a decrease of 18.3% with regard to the $942.8 million registered in 2Q19. The adjusted EBITDA margin in 2Q20 was situated at 43.1% versus 51.9% in 2Q19. On a QoQ basis, EBITDA was 7.1% higher than in 1Q20. Copper production decreased slightly, falling 1.3% YoY to situate at 253,097 tons. This drop was attributable to lower production at our Buenavista mine (-6.8%) due to a decrease in ore grades. This was partially offset by higher production at our Cuajone mine (+9.9%) due to higher ore grades and recoveries. Copper production increased 2.1% for the 6M20 when compared to the same period of 2019 due to higher production at our Peruvian mines (+9.5%). This good performance was partially offset by lower production at our Buenavista mine (-5.0%) due to lower ore grades. By-product production: Molybdenum production increased (+16.3%) in 2Q20 compared to 2Q19 due to higher production at our Peruvian mines, led by the new Toquepala molybdenum plant and our Buenavista operation. Mined silver production increased by 13.5% in 2Q20 as a result of higher production at our IMMSA and La Caridad operations. Mined zinc production decreased 11.5% this quarter, which was mainly due to lower production at the Charcas mine (-26.3%) and to the shutdown at our Santa Eulalia operation due to flooding; these negative variances in zinc production were partially offset by a production increase of 2,821 tons (+249%) at the San Martin mine. For the first half of the year, molybdenum production increased 26.4% when compared to 6M19 due to higher production at all our mines. Mined silver production increased 17.3% due to higher production at our open pit and underground mines. Mined zinc production decreased 3.7% for the same period. Operating cash cost per pound of copper, including by-product revenue credits, was $0.67 in 2Q20, which represented an improvement of 16.7% compared to the $0.81 reported in 2Q19. This result was primarily attributable to a decrease in the production cost.; |
 |
In 6M20, the operating cash cost per pound of copper, including by-product revenue credits, was $0.72. This represented an improvement of 15.9% compared to the $0.85 reported in 6M19. This result was mainly due to a decrease in the production cost and to the unit cost effect of higher production. Cash flow from operating activities in 6M20 was $894.5 million, which represented an increase of 13.9% over the $785.3 million posted in 6M19. This improvement was attributable to strong cash generation at our operations due to an increase in sales volumes and cost control efficiencies. In 2Q20, we spent $113.3 million on capital investments, which reflected a 37.2% decrease with regard to 2019 and represented 43.7% of net income this quarter. In the first half of the year, we spent $214.3 million on capital investments, which represented 45.2% of net income. Dividends: On July 23, 2020, the Board of Directors authorized a dividend of $0.40 per share payable on August 25, 2020 for shareholders of record at the close of business on August 12, 2020. Mr. German Larrea, Chairman of the Board, commenting on the Company´s progress and current circumstances, said: “We continue to fight the COVID-19 pandemic by prioritizing efforts to safeguard the health and well-being of our workforce, their families and near-by communities. Our Company is operating in total compliance with local, regional and national emergency measures, and we have implemented rigorous hygiene, sanitation and safety protocols at all of our facilities. Southern Copper is making every effort to keep the pace of production at satisfactory levels while achieving a competitive cash cost. This is reflected in our 2Q20 cash cost per pound of $0.67, net of by-product credits. We believe that our strong financial position, cost competitiveness and copper reserves will allow us to overcome these difficult times. Considering the current environment and the impacts of the COVID-19 pandemic, we believe that mining investment will play an important role in the recovery of both the Mexican and Peruvian economies. As such, we will continue to develop our projects, consistent with our belief that Southern Copper’s operations constitute risk-controlled generators of economic resources that provide well-remunerated employment and tax revenues to the countries in which we operate. We reaffirm our intention to generate long-term value for our shareholders by driving highly competitive projects and cost reduction efforts. We are also committed to promoting the development of the local communities, regions and countries where we operate to share prosperity; ensure the sustainability of our business and preserve the wellbeing of society.” 2Q20 www.southerncoppercorp.com Page 2 of 10 SECOND QUARTER AND SIX MONTHS 2020 RESULTS SOUTHERN COPPER |
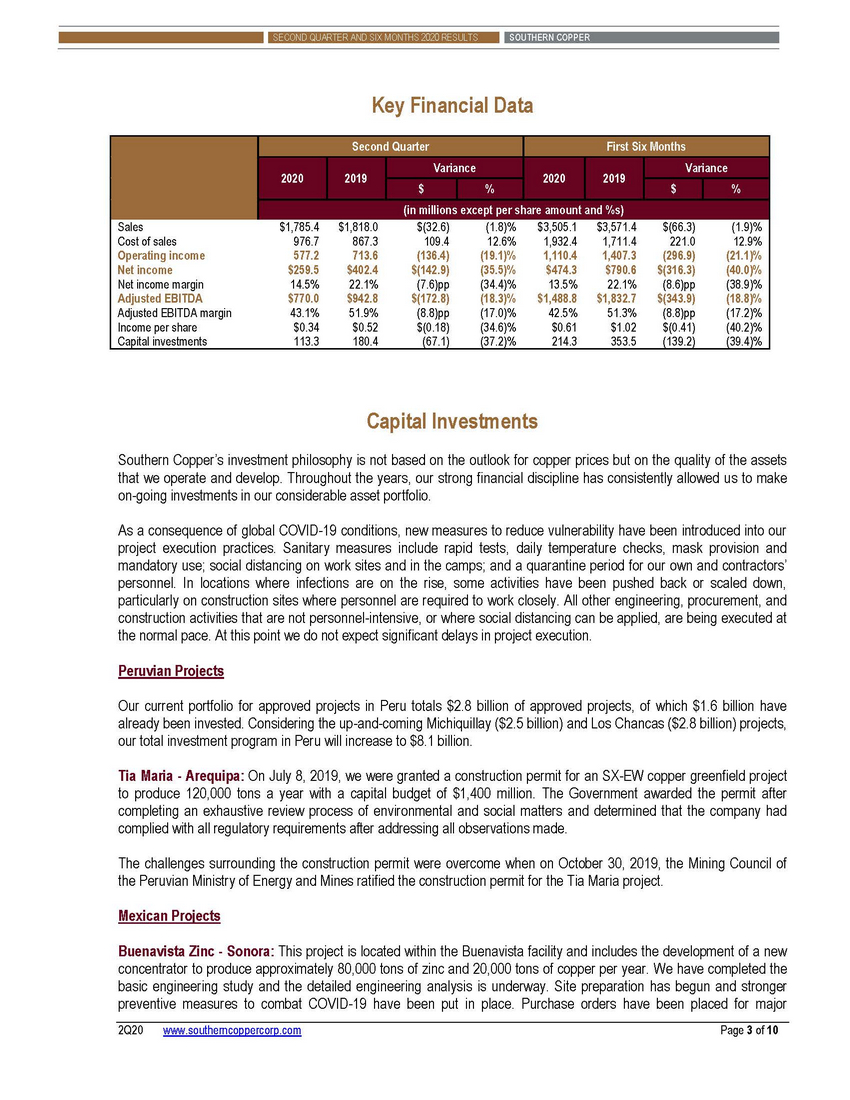 |
Key Financial Data Capital Investments Southern Copper’s investment philosophy is not based on the outlook for copper prices but on the quality of the assets that we operate and develop. Throughout the years, our strong financial discipline has consistently allowed us to make on-going investments in our considerable asset portfolio. As a consequence of global COVID-19 conditions, new measures to reduce vulnerability have been introduced into our project execution practices. Sanitary measures include rapid tests, daily temperature checks, mask provision and mandatory use; social distancing on work sites and in the camps; and a quarantine period for our own and contractors’ personnel. In locations where infections are on the rise, some activities have been pushed back or scaled down, particularly on construction sites where personnel are required to work closely. All other engineering, procurement, and construction activities that are not personnel-intensive, or where social distancing can be applied, are being executed at the normal pace. At this point we do not expect significant delays in project execution. Peruvian Projects Our current portfolio for approved projects in Peru totals $2.8 billion of approved projects, of which $1.6 billion have already been invested. Considering the up-and-coming Michiquillay ($2.5 billion) and Los Chancas ($2.8 billion) projects, our total investment program in Peru will increase to $8.1 billion. Tia Maria - Arequipa: On July 8, 2019, we were granted a construction permit for an SX-EW copper greenfield project to produce 120,000 tons a year with a capital budget of $1,400 million. The Government awarded the permit after completing an exhaustive review process of environmental and social matters and determined that the company had complied with all regulatory requirements after addressing all observations made. The challenges surrounding the construction permit were overcome when on October 30, 2019, the Mining Council of the Peruvian Ministry of Energy and Mines ratified the construction permit for the Tia Maria project. Mexican Projects Buenavista Zinc - Sonora: This project is located within the Buenavista facility and includes the development of a new concentrator to produce approximately 80,000 tons of zinc and 20,000 tons of copper per year. We have completed the basic engineering study and the detailed engineering analysis is underway. Site preparation has begun and stronger preventive measures to combat COVID-19 have been put in place. Purchase orders have been placed for major 2Q20 www.southerncoppercorp.com Page 3 of 10 Second Quarter First Six Months 2020 2019 Variance 2020 2019 Variance $ % $ % (in millions except per share amount and %s) Sales $1,785.4 $1,818.0 $(32.6) (1.8)% $3,505.1 $3,571.4 $(66.3) (1.9)% Cost of sales 976.7 867.3 109.4 12.6% 1,932.4 1,711.4 221.0 12.9% Operating income 577.2 713.6 (136.4) (19.1)% 1,110.4 1,407.3 (296.9) (21.1)% Net income $259.5 $402.4 $(142.9) (35.5)% $474.3 $790.6 $(316.3) (40.0)% Net income margin 14.5% 22.1% (7.6)pp (34.4)% 13.5% 22.1% (8.6)pp (38.9)% Adjusted EBITDA $770.0 $942.8 $(172.8) (18.3)% $1,488.8 $1,832.7 $(343.9) (18.8)% Adjusted EBITDA margin 43.1% 51.9% (8.8)pp (17.0)% 42.5% 51.3% (8.8)pp (17.2)% Income per share $0.34 $0.52 $(0.18) (34.6)% $0.61 $1.02 $(0.41) (40.2)% Capital investments 113.3 180.4 (67.1) (37.2)% 214.3 353.5 (139.2) (39.4)% SECOND QUARTER AND SIX MONTHS 2020 RESULTS SOUTHERN COPPER |
 |
equipment and manufacturing of some of them is already in process. The project has all the necessary permits. The capital budget is $413 million, and we expect to initiate operations in 3Q22. When completed, this new facility will double the Company’s zinc production capacity and will provide 490 direct jobs and 1,470 indirect jobs. Pilares – Sonora: Located 6 kilometers from La Caridad, this project consists of an open-pit mine operation with an annual production capacity of 35,000 tons of copper concentrate. A new 25-meter wide off-road facility for mining trucks is under construction and will be used to transport the ore from the pit to the primary crushers at the La Caridad copper concentrator. This project will significantly improve the over-all mineral ore grade (combining the 0.78% expected from Pilares with the 0.34% from La Caridad). The budget for Pilares is $159 million and we expect the project to begin production in the first half of 2022. El Pilar – Sonora: This low capital intensity copper greenfield project is strategically located in Sonora, Mexico, approximately 45 kilometers from our Buenavista mine. Its copper oxide mineralization contains estimated proven and probable reserves of 325 million tons of ore with an average copper grade of 0.287%. El Pilar will operate as a conventional open-pit mine and copper cathodes will be produced using highly cost efficient and environmentally friendly SX-EW technology. The budget for El Pilar is $310 million and we expect the project to start production in 2023. Construction at the pilot plant and experimental pads have ended and tests are being performed. The first results from experimental pads on leaching process have confirmed adequate levels of copper recovery. Conference Call The Company’s second quarter earnings conference call will be held on Wednesday, July 29, 2020, beginning at 10:00 AM – EST (9:00 AM Lima and Mexico City time). To participate: Dial-in number: 877-455-8486 in the U.S. 629-228-0768 outside the U.S. Raul Jacob, SCC Vice President of Finance, Treasurer & CFO 3599597 and “Southern Copper Corporation Second Quarter 2020 Earnings Results” Conference ID: 2Q20 www.southerncoppercorp.com Page 4 of 10 SECOND QUARTER AND SIX MONTHS 2020 RESULTS SOUTHERN COPPER |
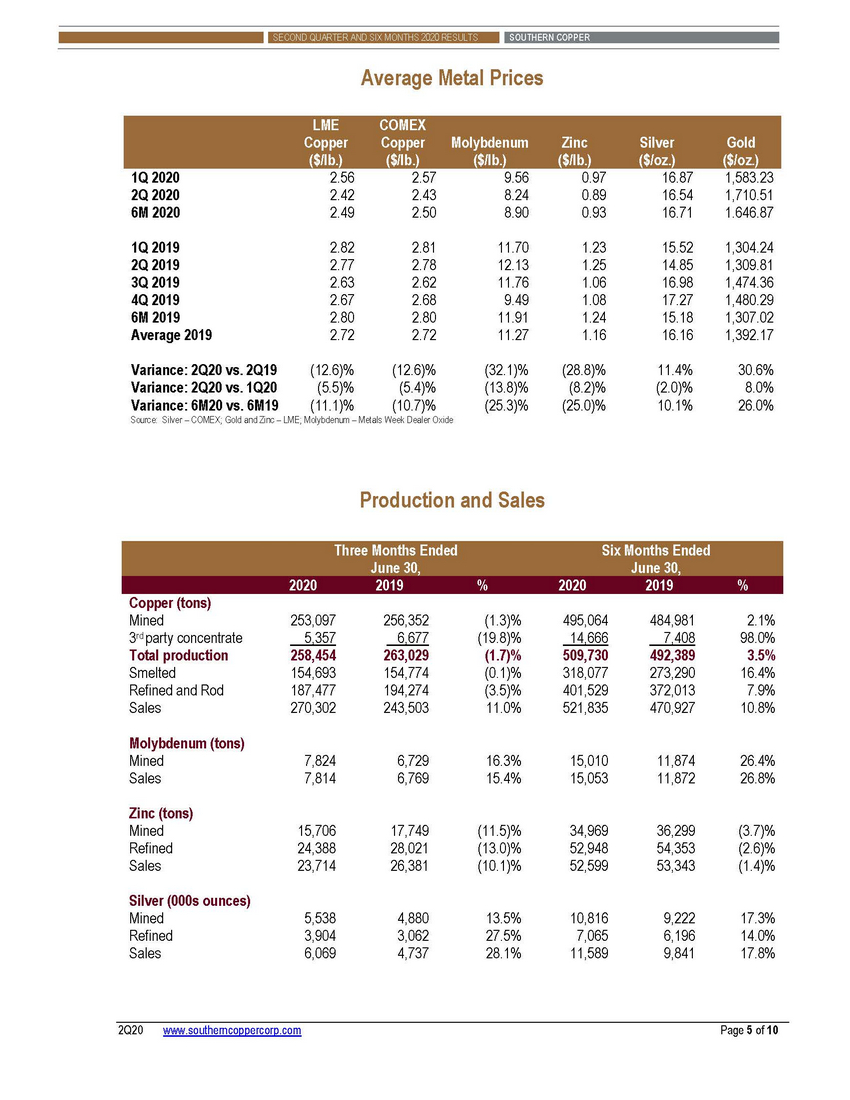 |
Average Metal Prices 1Q 2020 2Q 2020 6M 2020 2.56 2.42 2.49 2.57 2.43 2.50 9.56 8.24 8.90 0.97 0.89 0.93 16.87 16.54 16.71 1,583.23 1,710.51 1.646.87 1Q 2019 2Q 2019 3Q 2019 4Q 2019 6M 2019 Average 2019 2.82 2.77 2.63 2.67 2.80 2.72 2.81 2.78 2.62 2.68 2.80 2.72 11.70 12.13 11.76 9.49 11.91 11.27 1.23 1.25 1.06 1.08 1.24 1.16 15.52 14.85 16.98 17.27 15.18 16.16 1,304.24 1,309.81 1,474.36 1,480.29 1,307.02 1,392.17 Variance: 2Q20 vs. 2Q19 Variance: 2Q20 vs. 1Q20 Variance: 6M20 vs. 6M19 (12.6)% (5.5)% (11.1)% (12.6)% (5.4)% (10.7)% (32.1)% (13.8)% (25.3)% (28.8)% (8.2)% (25.0)% 11.4% (2.0)% 10.1% 30.6% 8.0% 26.0% Source: Silver – COMEX; Gold and Zinc – LME; Molybdenum – Metals Week Dealer Oxide Production and Sales Copper (tons) Mined 3rd party concentrate Total production Smelted Refined and Rod Sales 253,097 5,357 256,352 6,677 (1.3)% (19.8)% (1.7)% (0.1)% (3.5)% 11.0% 495,064 14,666 484,981 7,408 2.1% 98.0% 3.5% 16.4% 7.9% 10.8% 258,454 154,693 187,477 270,302 263,029 154,774 194,274 243,503 509,730 318,077 401,529 521,835 492,389 273,290 372,013 470,927 Molybdenum (tons) Mined Sales 7,824 7,814 6,729 6,769 16.3% 15.4% 15,010 15,053 11,874 11,872 26.4% 26.8% Zinc (tons) Mined Refined Sales 15,706 24,388 23,714 17,749 28,021 26,381 (11.5)% (13.0)% (10.1)% 34,969 52,948 52,599 36,299 54,353 53,343 (3.7)% (2.6)% (1.4)% Silver (000s ounces) Mined Refined Sales 5,538 3,904 6,069 4,880 3,062 4,737 13.5% 27.5% 28.1% 10,816 7,065 11,589 9,222 6,196 9,841 17.3% 14.0% 17.8% 2Q20 www.southerncoppercorp.com Page 5 of 10 Three Months EndedSix Months Ended June 30,June 30, 20202019%20202019% LMECOMEX CopperCopperMolybdenumZincSilverGold ($/lb.)($/lb.)($/lb.)($/lb.)($/oz.)($/oz.) SECOND QUARTER AND SIX MONTHS 2020 RESULTS SOUTHERN COPPER |
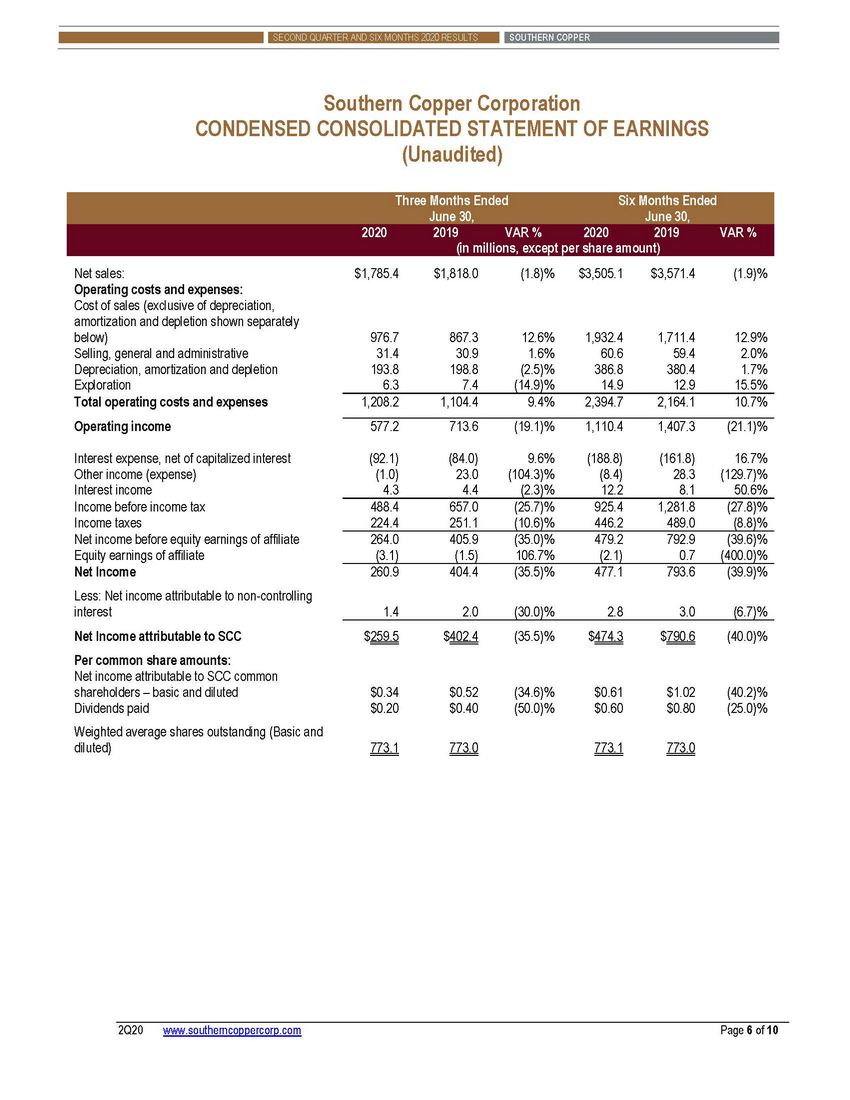 |
Southern Copper Corporation CONDENSED CONSOLIDATED STATEMENT OF EARNINGS (Unaudited) Net sales: Operating costs and expenses: Cost of sales (exclusive of depreciation, amortization and depletion shown separately below) Selling, general and administrative Depreciation, amortization and depletion Exploration Total operating costs and expenses Operating income $1,785.4 $1,818.0 (1.8)% $3,505.1 $3,571.4 (1.9)% 976.7 31.4 193.8 6.3 867.3 30.9 198.8 7.4 12.6% 1.6% (2.5)% (14.9)% 1,932.4 60.6 386.8 14.9 1,711.4 59.4 380.4 12.9 12.9% 2.0% 1.7% 15.5% 1,208.2 1,104.4 9.4% 2,394.7 2,164.1 10.7% 577.2 713.6 (19.1)% 1,110.4 1,407.3 (21.1)% Interest expense, net of capitalized interest Other income (expense) Interest income Income before income tax Income taxes Net income before equity earnings of affiliate Equity earnings of affiliate Net Income Less: Net income attributable to non-controlling interest Net Income attributable to SCC Per common share amounts: Net income attributable to SCC common shareholders – basic and diluted Dividends paid Weighted average shares outstanding (Basic and diluted) (92.1) (1.0) 4.3 (84.0) 23.0 4.4 9.6% (104.3)% (2.3)% (188.8) (8.4) 12.2 (161.8) 28.3 8.1 16.7% (129.7)% 50.6% 488.4 224.4 657.0 251.1 (25.7)% (10.6)% 925.4 446.2 1,281.8 489.0 (27.8)% (8.8)% 264.0 (3.1) 405.9 (1.5) (35.0)% 106.7% 479.2 (2.1) 792.9 0.7 (39.6)% (400.0)% 260.9 404.4 (35.5)% 477.1 793.6 (39.9)% 1.4 2.0 (30.0)% 2.8 3.0 (6.7)% $259.5 $402.4 (35.5)% $474.3 $790.6 (40.0)% $0.34 $0.20 $0.52 $0.40 (34.6)% (50.0)% $0.61 $0.60 $1.02 $0.80 (40.2)% (25.0)% 773.1 773.0 773.1 773.0 2Q20 www.southerncoppercorp.com Page 6 of 10 Three Months EndedSix Months Ended June 30,June 30, 20202019VAR %20202019VAR % (in millions, except per share amount) SECOND QUARTER AND SIX MONTHS 2020 RESULTS SOUTHERN COPPER |
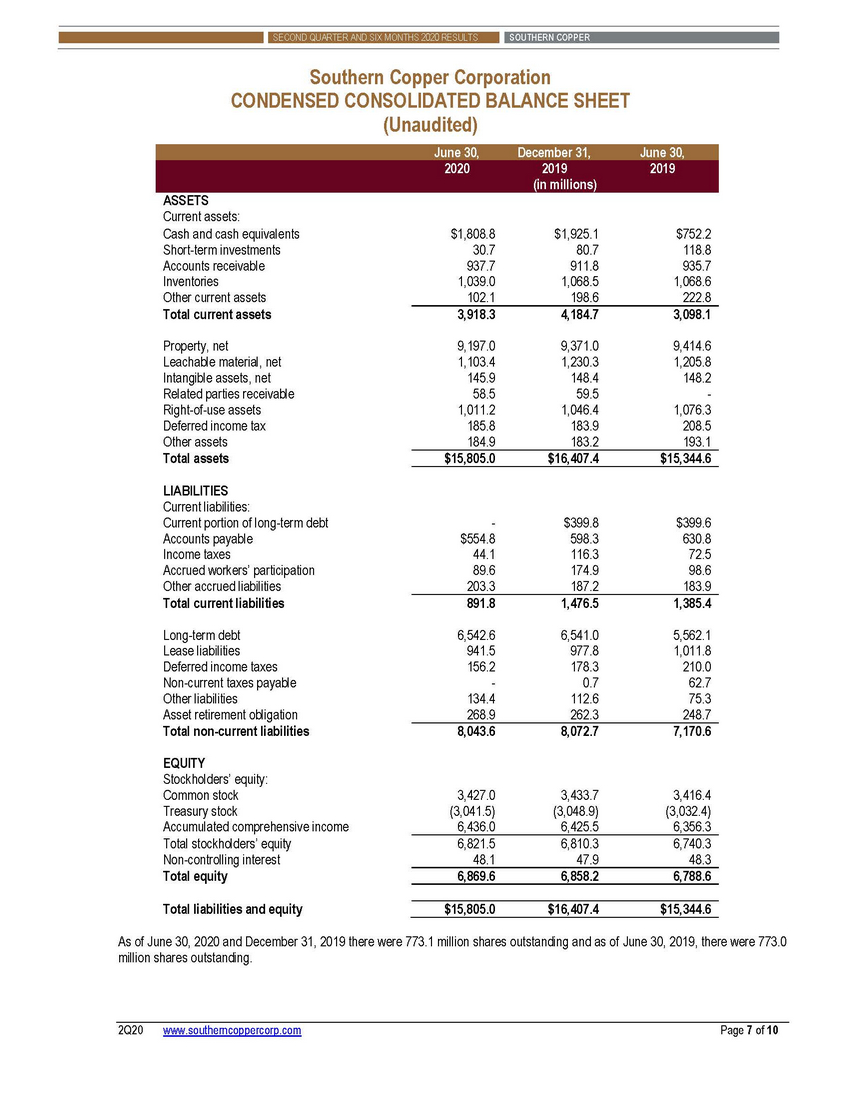 |
Southern Copper Corporation CONDENSED CONSOLIDATED BALANCE SHEET (Unaudited) ASSETS Current assets: Cash and cash equivalents Short-term investments Accounts receivable Inventories Other current assets Total current assets $1,808.8 30.7 937.7 1,039.0 102.1 $1,925.1 80.7 911.8 1,068.5 198.6 $752.2 118.8 935.7 1,068.6 222.8 3,918.3 4,184.7 3,098.1 Property, net Leachable material, net Intangible assets, net Related parties receivable Right-of-use assets Deferred income tax Other assets Total assets 9,197.0 1,103.4 145.9 58.5 1,011.2 185.8 184.9 9,371.0 1,230.3 148.4 59.5 1,046.4 183.9 183.2 9,414.6 1,205.8 148.2 - 1,076.3 208.5 193.1 $15,805.0 $16,407.4 $15,344.6 LIABILITIES Current liabilities: Current portion of long-term debt Accounts payable Income taxes Accrued workers’ participation Other accrued liabilities Total current liabilities - $554.8 44.1 89.6 203.3 $399.8 598.3 116.3 174.9 187.2 $399.6 630.8 72.5 98.6 183.9 891.8 1,476.5 1,385.4 Long-term debt Lease liabilities Deferred income taxes Non-current taxes payable Other liabilities Asset retirement obligation Total non-current liabilities 6,542.6 941.5 156.2 - 134.4 268.9 6,541.0 977.8 178.3 0.7 112.6 262.3 5,562.1 1,011.8 210.0 62.7 75.3 248.7 8,043.6 8,072.7 7,170.6 EQUITY Stockholders’ equity: Common stock Treasury stock Accumulated comprehensive income Total stockholders’ equity Non-controlling interest Total equity 3,427.0 (3,041.5) 6,436.0 3,433.7 (3,048.9) 6,425.5 3,416.4 (3,032.4) 6,356.3 6,821.5 48.1 6,810.3 47.9 6,740.3 48.3 6,869.6 6,858.2 6,788.6 Total liabilities and equity $15,805.0 $16,407.4 $15,344.6 As of June 30, 2020 and December 31, 2019 there were 773.1 million shares outstanding and as of June 30, 2019, there were 773.0 million shares outstanding. 2Q20 www.southerncoppercorp.com Page 7 of 10 June 30,December 31,June 30, 202020192019 (in millions) SECOND QUARTER AND SIX MONTHS 2020 RESULTS SOUTHERN COPPER |
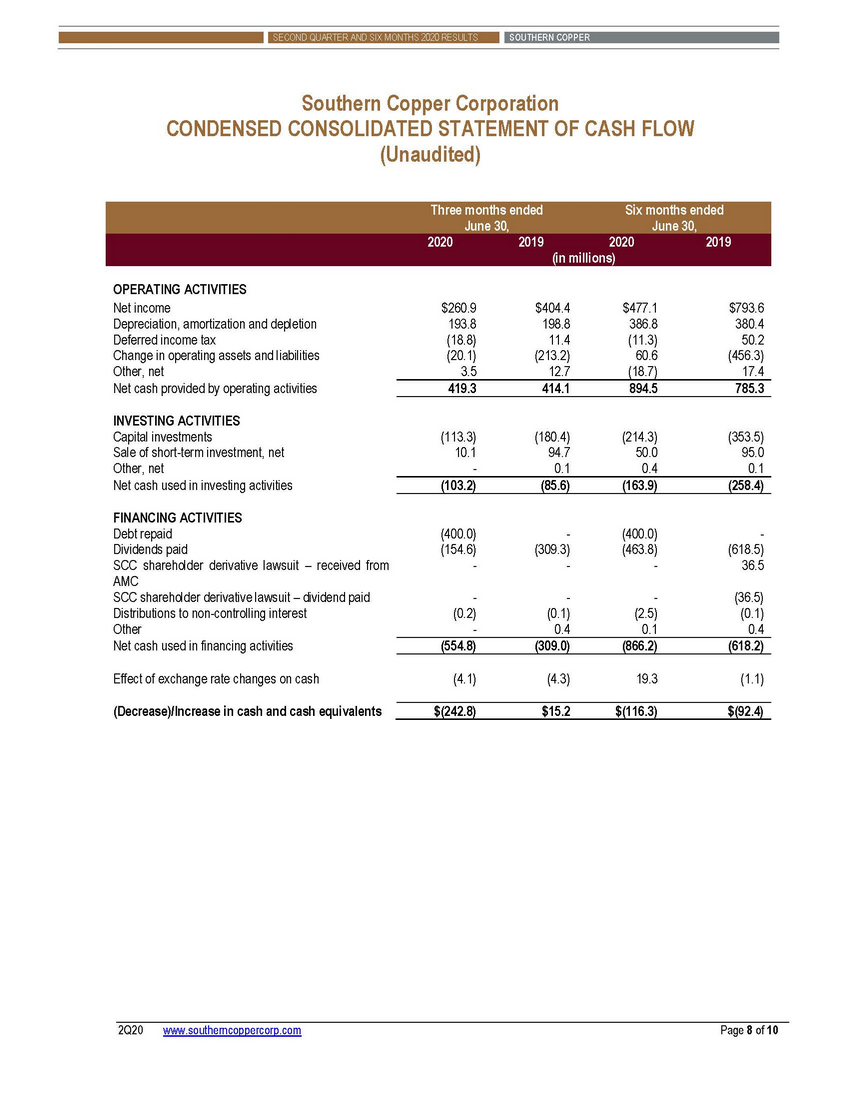 |
Southern Copper Corporation CONDENSED CONSOLIDATED STATEMENT OF CASH FLOW (Unaudited) OPERATING ACTIVITIES Net income Depreciation, amortization and depletion Deferred income tax Change in operating assets and liabilities Other, net Net cash provided by operating activities $260.9 193.8 (18.8) (20.1) 3.5 $404.4 198.8 11.4 (213.2) 12.7 $477.1 386.8 (11.3) 60.6 (18.7) $793.6 380.4 50.2 (456.3) 17.4 419.3 414.1 894.5 785.3 INVESTING ACTIVITIES Capital investments Sale of short-term investment, net Other, net Net cash used in investing activities (113.3) 10.1 - (180.4) 94.7 0.1 (214.3) 50.0 0.4 (353.5) 95.0 0.1 (103.2) (85.6) (163.9) (258.4) FINANCING ACTIVITIES Debt repaid Dividends paid SCC shareholder derivative lawsuit – received from AMC SCC shareholder derivative lawsuit – dividend paid Distributions to non-controlling interest Other Net cash used in financing activities (400.0) (154.6) - - (309.3) - (400.0) (463.8) - - (618.5) 36.5 - (0.2) - - (0.1) 0.4 - (2.5) 0.1 (36.5) (0.1) 0.4 (554.8) (309.0) (866.2) (618.2) Effect of exchange rate changes on cash (4.1) (4.3) 19.3 (1.1) (Decrease)/Increase in cash and cash equivalents $(242.8) $15.2 $(116.3) $(92.4) 2Q20 www.southerncoppercorp.com Page 8 of 10 Three months endedSix months ended June 30,June 30, 2020201920202019 (in millions) SECOND QUARTER AND SIX MONTHS 2020 RESULTS SOUTHERN COPPER |
 |
Company Profile Southern Copper Corporation (SCC) is one of the largest integrated copper producers in the world and we believe we currently have the largest copper reserves in the industry. The Company is a NYSE and Lima Stock Exchange listed company that is 88.9% owned by Grupo Mexico, a Mexican company listed on the Mexican stock exchange. The remaining 11.1% ownership interest is held by the international investment community. The Company operates mining units and metallurgical facilities in Mexico and Peru and conducts exploration activities in Argentina, Chile, Ecuador, Mexico and Peru. SCC Corporate Address USA 1440 E Missouri Ave, Suite 160 Phoenix, AZ 85014, U. S. A. Phone: (602) 264-1375 Fax: (602) 264-1397 Mexico Campos Eliseos N° 400 Colonia Lomas de Chapultepec Delegacion Miguel Hidalgo C.P. 11000 - MEXICO Phone: (5255) 1103-5000 Fax: (5255) 1103-5567 Peru Av. Caminos del Inca 171 Urb. Chacarilla del Estanque Santiago de Surco Lima 15038 – PERU Phone: (511) 512-0440 Fax: (511) 512-0492 ### This news release contains forward-looking statements as that term is defined in the Private Securities Litigation Reform Act of 1995. In addition to the risks and uncertainties noted in this news release, there are certain factors that could cause results to differ materially from those anticipated by some of the statements made. These factors include those listed in the Company’s most recently filed quarterly reports on Form 10-Q and annual report on Form 10-K. The Company expressly disclaims any obligation to release publicly any updates or revisions to any forward -looking statements contained herein to reflect any change in the Company’s expectations with regard thereto or any change in events, conditions or circumstances on which any statement is based. 2Q20 www.southerncoppercorp.com Page 9 of 10 SECOND QUARTER AND SIX MONTHS 2020 RESULTS SOUTHERN COPPER |
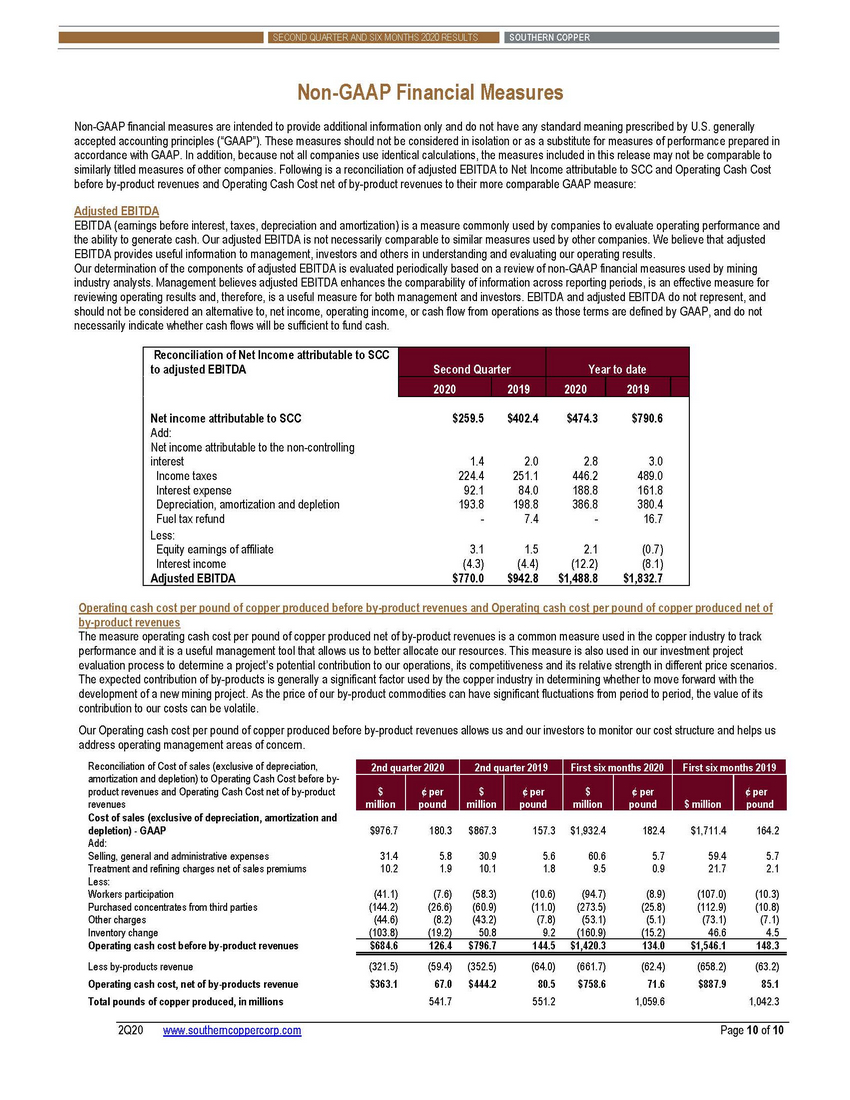 |
Non-GAAP Financial Measures Non-GAAP financial measures are intended to provide additional information only and do not have any standard meaning prescribed by U.S. generally accepted accounting principles (“GAAP”). These measures should not be considered in isolation or as a substitute for measures of performance prepared in accordance with GAAP. In addition, because not all companies use identical calculations, the measures included in this release may not be comparable to similarly titled measures of other companies. Following is a reconciliation of adjusted EBITDA to Net Income attributable to SCC and Operating Cash Cost before by-product revenues and Operating Cash Cost net of by-product revenues to their more comparable GAAP measure: Adjusted EBITDA EBITDA (earnings before interest, taxes, depreciation and amortization) is a measure commonly used by companies to evaluate operating performance and the ability to generate cash. Our adjusted EBITDA is not necessarily comparable to similar measures used by other companies. We believe that adjusted EBITDA provides useful information to management, investors and others in understanding and evaluating our operating results. Our determination of the components of adjusted EBITDA is evaluated periodically based on a review of non-GAAP financial measures used by mining industry analysts. Management believes adjusted EBITDA enhances the comparability of information across reporting periods, is an effective measure for reviewing operating results and, therefore, is a useful measure for both management and investors. EBITDA and adjusted EBITDA do not represent, and should not be considered an alternative to, net income, operating income, or cash flow from operations as those terms are defined by GAAP, and do not necessarily indicate whether cash flows will be sufficient to fund cash. Operating cash cost per pound of copper produced before by-product revenues and Operating cash cost per pound of copper produced net of by-product revenues The measure operating cash cost per pound of copper produced net of by-product revenues is a common measure used in the copper industry to track performance and it is a useful management tool that allows us to better allocate our resources. This measure is also used in our investment project evaluation process to determine a project’s potential contribution to our operations, its competitiveness and its relative strength in different price scenarios. The expected contribution of by-products is generally a significant factor used by the copper industry in determining whether to move forward with the development of a new mining project. As the price of our by-product commodities can have significant fluctuations from period to period, the value of its contribution to our costs can be volatile. Our Operating cash cost per pound of copper produced before by-product revenues allows us and our investors to monitor our cost structure and helps us address operating management areas of concern. Reconciliation of Cost of sales (exclusive of depreciation, amortization and depletion) to Operating Cash Cost before by-product revenues and Operating Cash Cost net of by-product revenues Cost of sales (exclusive of depreciation, amortization and depletion) - GAAP Add: Selling, general and administrative expenses Treatment and refining charges net of sales premiums Less: Workers participation Purchased concentrates from third parties Other charges Inventory change Operating cash cost before by-product revenues Less by-products revenue Operating cash cost, net of by-products revenue Total pounds of copper produced, in millions $976.7 180.3 $867.3 157.3 $1,932.4 182.4 $1,711.4 164.2 31.4 10.2 5.8 1.9 30.9 10.1 5.6 1.8 60.6 9.5 5.7 0.9 59.4 21.7 5.7 2.1 (41.1) (144.2) (44.6) (103.8) (7.6) (26.6) (8.2) (19.2) (58.3) (60.9) (43.2) 50.8 (10.6) (11.0) (7.8) 9.2 (94.7) (273.5) (53.1) (160.9) (8.9) (25.8) (5.1) (15.2) (107.0) (112.9) (73.1) 46.6 (10.3) (10.8) (7.1) 4.5 $684.6 126.4 $796.7 144.5 $1,420.3 134.0 $1,546.1 148.3 (321.5) $363.1 (59.4) 67.0 541.7 (352.5) $444.2 (64.0) 80.5 551.2 (661.7) $758.6 (62.4) 71.6 1,059.6 (658.2) $887.9 (63.2) 85.1 1,042.3 2Q20 www.southerncoppercorp.com Page 10 of 10 2nd quarter 20202nd quarter 2019First six months 2020First six months 2019 $ ¢ per$ ¢ per$ ¢ per¢ per millionpoundmillionpoundmillionpound$ millionpound Reconciliation of Net Income attributable to SCC to adjusted EBITDA Second Quarter Year to date 2020 2019 2020 2019 Net income attributable to SCC$259.5$402.4$474.3$790.6 Add: Net income attributable to the non-controlling interest1.42.02.83.0 Income taxes224.4251.1446.2489.0 Interest expense92.184.0188.8161.8 Depreciation, amortization and depletion193.8198.8386.8380.4 Fuel tax refund-7.4-16.7 Less: Equity earnings of affiliate3.11.52.1 (0.7) Interest income (4.3) (4.4)(12.2)(8.1) Adjusted EBITDA$770.0$942.8$1,488.8$1,832.7 SECOND QUARTER AND SIX MONTHS 2020 RESULTS SOUTHERN COPPER |