Attached files
| file | filename |
|---|---|
| EX-99.1 - EARNINGS RELEASE - OMNICOM GROUP INC. | e10477ex99-1.htm |
| 8-K - CURRENT REPORT - OMNICOM GROUP INC. | omc8k0724.htm |
Exhibit 99.2

Second Quarter 2020 Results July 28, 2020 Investor Presentation

2020 vs. 2019 P&L Summary Second Quarter 1 July 28, 2020 Second Quarter 2020 (a) 2019 Revenue $ 2,800.7 $ 3,719.8 Operating Expenses (b) 2,738.2 3,146.1 Operating Profit 62.5 573.7 Net Interest Expense 47.2 50.2 Income Tax Expense 21.9 130.6 Tax Rate % 143.1% 24.9% Income (Loss) From Equity Method Investments (7.8) 1.2 Net Income (Loss) Attributed To Noncontrolling Interests 9.8 23.4 Net Income (Loss) - Omnicom Group Inc. $ (24.2) $ 370.7 Diluted Shares (millions) 215.4 220.9 Earnings (Loss) per Share - Diluted $ (0.11) $ 1.68 Dividends Declared Per Common Share $ 0.65 $ 0.65 (a) During the second quarter of 2020 , we recorded expenses for certain repositioning actions related to the realignment of our businesses in reaction to the coronavirus 2019 ("COVID - 19 ") pandemic and recorded a net loss on the disposition of certain subsidiaries . The net impact of these items decreased Operating Profit by $ 277 . 9 million, Net Income - Omnicom Group Inc . by $ 223 . 1 million and Earnings per Share - Diluted by $ 1 . 03 per share for the three months ended June 30 , 2020 . Additional information regarding the realignment actions and net loss on dispositions are presented in the slides that follow . (b) Additional information on our operating expenses can be found on page 3 .

2020 vs. 2019 P&L Summary Year to Date 2 July 28, 2020 Year to Date 2020 (a) 2019 Revenue $ 6,207.6 $ 7,188.7 Operating Expenses (b) 5,724.9 6,186.1 Operating Profit 482.7 1,002.6 Net Interest Expense 93.0 96.2 Income Tax Expense 119.3 233.2 Tax Rate % 30.6% 25.7% Income (Loss) From Equity Method Investments (13.0) 0.7 Net Income Attributed To Noncontrolling Interests 23.4 40.0 Net Income - Omnicom Group Inc. $ 234.0 $ 633.9 Diluted Shares (millions) 216.5 222.5 Earnings per Share - Diluted $ 1.08 $ 2.85 Dividends Declared Per Common Share $ 1.30 $ 1.30 (a) During the second quarter of 2020, we recorded expenses for certain repositioning actions related to the realignment of our b usi nesses in reaction to the COVID - 19 pandemic and recorded a net loss on the disposition of certain subsidiaries. The net impact of these items decreased Operating Profit by $277.9 million a nd Net Income - Omnicom Group Inc. by $223.1 million and Earnings per Share - Diluted by $1.03 per share for the six months ended June 30, 2020. Additional information regarding the realignment acti ons and net loss on dispositions are presented in the slides that follow. (b) Additional information on our operating expenses can be found on page 3.

Operating Expense Detail Second Quarter Year to Date Rev Rev Revenue Operating expenses: Salary and service costs: Salary and related service costs Third - party service costs (a) Occupancy and other costs Repositioning costs and net loss on dispositions Cost of services Selling, general and administrative expenses Depreciation and amortization Total operating expenses Operating Profit 2020 % of 2019 % of 2020 % of 2019 % of Rev Rev $ 2,800.7 $ 3,719.8 $ 6,207.6 $ 7,188.7 1,424.7 50.9 % 1,660.2 44.6 % 3,067.1 49.4 % 3,326.2 46.3 % 606.4 21.7 % 1,005.0 27.0 % 1,497.3 24.1 % 1,906.6 26.5 % 290.0 10.4 % 315.4 8.5 % 599.6 9.7 % 624.7 8.7 % 277.9 9.9 % — n/a 277.9 4.5 % — n/a 2,599.0 2,980.6 5,441.9 5,857.5 82.1 2.9 % 107.7 2.9 % 168.9 2.7 % 211.2 2.9 % 57.1 2.0 % 57.8 1.6 % 114.1 1.8 % 117.4 1.6 % 2,738.2 97.8 % 3,146.1 84.6 % 5,724.9 92.2 % 6,186.1 86.1 % $ 62.5 $ 573.7 $ 482.7 $ 1,002.6 (a) Third - party service costs are expenses paid to third - party vendors incurred primarily in connection with performance obligat ions for our services where we have determined that we are acting as principal. These third - party expenses also include incidental costs incurred in the performance of our services including airfar e, mileage, hotel and out - of - town expenses, etc. 3 July 28, 2020
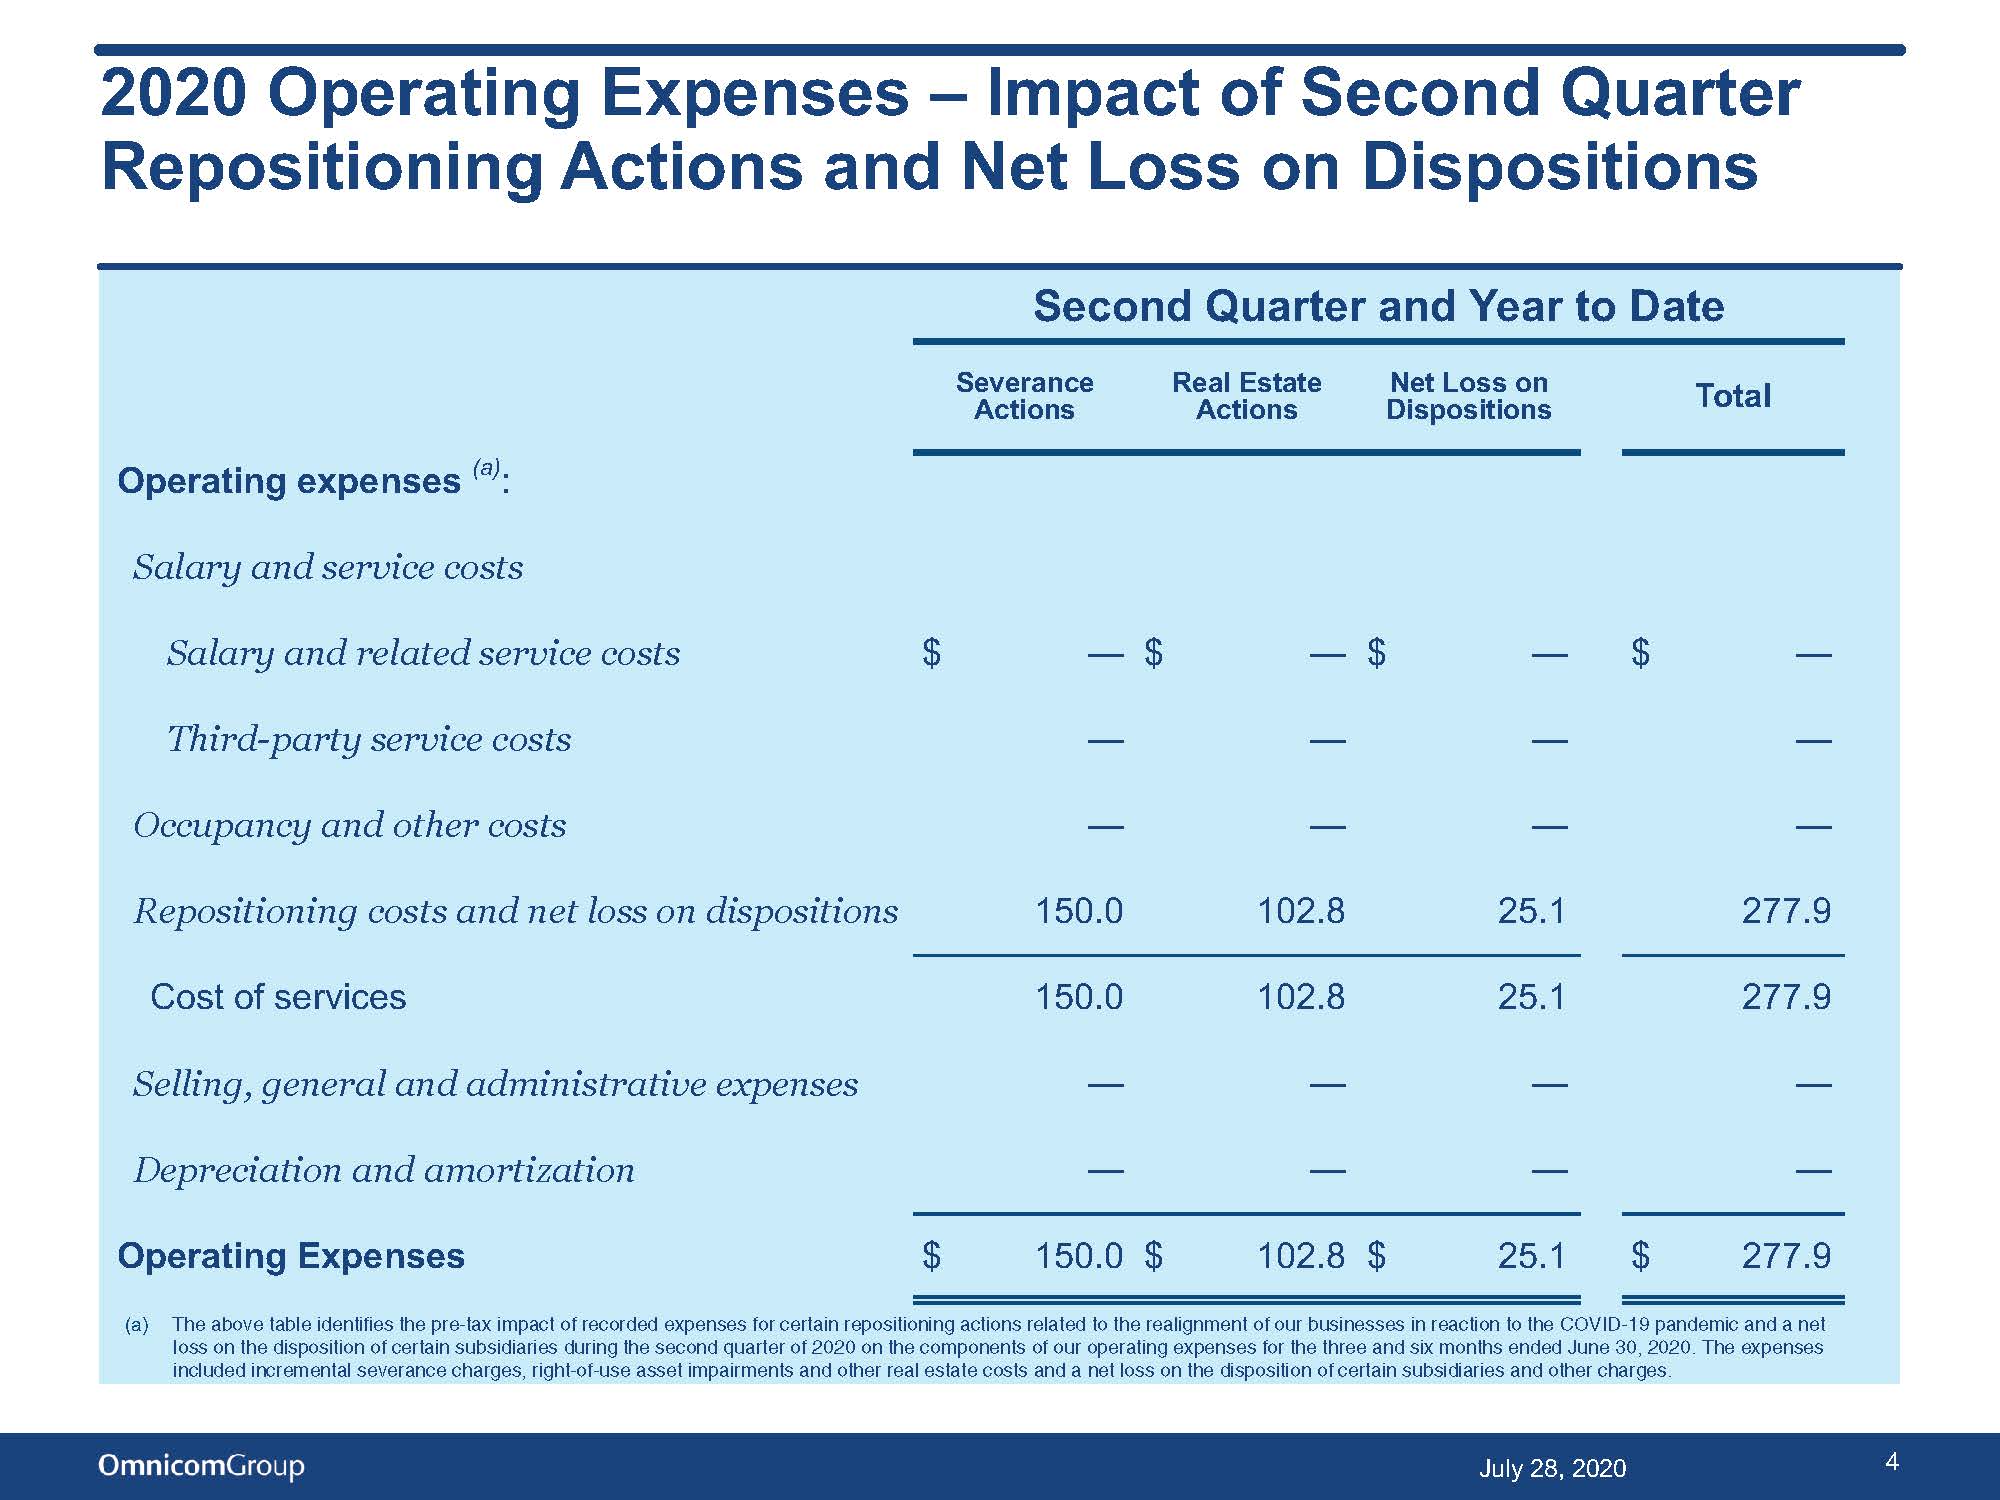
2020 Operating Expenses – Impact of Second Quarter Repositioning Actions and Net Loss on Dispositions Second Quarter and Year to Date Severance Actions Real Estate Actions Net Loss on Dispositions T otal Operating expenses (a) : Salary and service costs Salary and related service costs Third - party service costs Occupancy and other costs Repositioning costs and net loss on dispositions Cost of services Selling, general and administrative expenses Depreciation and amortization Operating Expenses $ — — — 150.0 $ — — — 102.8 $ — — — 25.1 $ — — — 277.9 150.0 — — 102.8 — — 25.1 — — 277.9 — — $ 150.0 $ 102.8 $ 25.1 $ 277.9 4 July 28, 2020 (a) The above table identifies the pre-tax impact of recorded expenses for certain repositioning actions related to the realignment of our businesses in reaction to the COVID-19 pandemic and a net loss on the disposition of certain subsidiaries during the second quarter of 2020 on the components of our operating expenses for the three and six months ended June 30, 2020. The expenses included incremental severance charges, right-of-use asset impairments and other real estate costs and a net loss on the disposition of certain subsidiaries and other charges.

2020 Non - GAAP Financial Measures - Adjusted for the Impact of Second Quarter 2020 Repositioning Actions and Net Loss on Dispositions Second Quarter 2020 (a) Non - GAAP Adjustments Non - GAAP 2020 Adjusted Interests Operating Profit $ 62.5 $ 277.9 $ 340.4 Net Interest Expense 47.2 — 47.2 Income Tax Expense 21.9 54.8 76.7 Tax Rate % 143.1% 19.7% 26.2% Income (Loss) from Equity Method Investments (7.8) — (7.8) Net Income (Loss) Attributed to Noncontrolling 9.8 — 9.8 Net Income (Loss) - Omnicom Group Inc. $ (24.2) $ 223.1 $ 198.9 Diluted Shares (millions) 215.4 215.4 215.4 Earnings (Loss) per Share - Diluted $ (0.11) $ 1.03 $ 0.92 5 July 28, 2020 The above table presents the U.S. GAAP financial measures of Operating Profit, Income Tax Expense, Net Income - Omnicom Group Inc. and Earnings (Loss) per Share - Diluted as reported, as well as the impact certain repositioning actions and of the net loss recognized on dispositions of certain subsidiaries which were re cor ded during the three months ended June 30, 2020. The amounts presented in the column "Non - GAAP 2020 Adjusted" excludes these items from our results for the period presented, which are non - GAAP operat ing performance measures. We believe that the amounts excluding the impact of these items are useful measures for investors to understand the impact these items had on our reported results. No n - GAAP financial measures should not be considered in isolation from, or as a substitute for, financial information presented in compliance with U.S. GAAP. Non - GAAP financial measures reported by us may not be comparable to similarly titled amounts reported by other companies. (a) During the second quarter of 2020, recorded expenses for certain repositioning actions related to the realignment of o ur businesses in reaction to the COVID - 19 pandemic and recorded a net loss on the disposition of certain subsidiaries. The net impact of these items decreased Operating Profit by $277.9 million, Net Income - Omnicom Group Inc. by $223.1 million and Earnings per Share - Diluted by $1.03 per share for the three months ended June 30, 2020.

2020 vs. 2019 Non - GAAP Financial Measures - Adjusted for the Impact of Second Quarter 2020 Repositioning Actions and Net Loss on Dispositions The above table identifies the U.S. GAAP financial measures of Operating Profit, Income Tax Expense, Net Income - Omnicom Group Inc. and Earnings (Loss) per Share - Diluted, as well as the non - GAAP amounts excluding the impact of certain repositioning actions and the net loss recognized on dispositions of certain subsidiaries in the column entitled "Non - GAAP 2020 Adjusted" for the three months ended June 30, 2020. We believe that the amounts presented in the "Non - GAAP 2020 Adjusted" column are useful measures for investors to understand the im pact these items had on our reported results. Non - GAAP financial measures should not be considered in isolation from, or as a substitute for, financial information presented in compliance with U.S. GAAP. Non - GAAP financial measures reported by us may not be comparable to similarly titled amounts reported by other companies. a) During the three months ended June 30, 2020, we recorded expenses for certain repositioning actions related to the realignmen t of our businesses in reaction to the COVID - 19 pandemic and recorded a net loss on the disposition of certain subsidiaries. The net impact of these items decreased Operating Profit by $277.9 milli on, Net Income - Omnicom Group Inc. by $223.1 million and Earnings per Share - Diluted by $1.03 per share for the three months ended June 30, 2020. Second Quarter Interests 2020 (a) Non - GAAP 2020 Adjusted 2019 Operating Profit $ 62.5 $ 340.4 $ 573.7 Net Interest Expense 47.2 47.2 50.2 Income Tax Expense 21.9 76.7 130.6 Tax Rate % 143.1% 26.2% 24.9% Income (Loss) From Equity Method Investments (7.8) (7.8) 1.2 Net Income (Loss) Attributed To Noncontrolling 9.8 9.8 23.4 Net Income (Loss) - Omnicom Group Inc. $ (24.2) $ 198.9 $ 370.7 Diluted Shares (millions) 215.4 215.4 220.9 Earnings (Loss) per Share - Diluted $ (0.11) $ 0.92 $ 1.68 Dividends Declared Per Common Share $ 0.65 $ 0.65 $ 0.65 6 July 28, 2020

2020 Non - GAAP Financial Measures - Adjusted for the Impact of Second Quarter 2020 Repositioning Actions and Net Loss on Dispositions Year to Date 2020 (a) Non - GAAP Adjustments Non - GAAP 2020 Adjusted Net Income Attributed to Noncontrolling Interests 23.4 — 23.4 Operating Profit $ 482.7 $ 277.9 $ 760.6 Net Interest Expense 93.0 — 93.0 Income Tax Expense 119.3 54.8 174.1 Tax Rate % 30.6% 19.7% 26.1% Income (Loss) from Equity Method Investments (13.0) — (13.0) 7 July 28, 2020 Net Income - Omnicom Group Inc. $ 234.0 $ 223.1 $ 457.1 Diluted Shares (millions) 216.5 216.5 216.5 Earnings per Share - Diluted $ 1.08 $ 1.03 $ 2.11 The above table presents the U.S. GAAP financial measures of Operating Profit, Income Tax Expense, Net Income - Omnicom Group Inc. and Earnings per Share - Diluted as reported, as well as the impact certain repositioning actions and of the net loss recognized on dispositions of certain subsidiaries which were record ed in the second quarter of 2020, for the six months ended June 30, 2020. The amounts presented in the column "Non - GAAP 2020 Adjusted" excludes these items from our results for the period presented, which a re non - GAAP operating performance measures. We believe that the amounts excluding the impact of these items are useful measures for investors to understand the impact these items had on our re ported results. Non - GAAP financial measures should not be considered in isolation from, or as a substitute for, financial information presented in compliance with U.S. GAAP. Non - GAAP financial measures reported by us may not be comparable to similarly titled amounts reported by other companies. (a) During the second quarter of 2020, we recorded expenses for certain repositioning actions related to the realignment of o ur businesses in reaction to the COVID - 19 pandemic and recorded a net loss on the disposition of certain subsidiaries. The net impact of these items decreased Operating Profit by $277.9 million, Net Income - Omnicom Group Inc. by $223.1 million and Earnings per Share - Diluted by $1.03 per share for the six months ended June 30, 2020.

2020 vs. 2019 Non - GAAP Financial Measures - Adjusted for the Impact of Second Quarter 2020 Repositioning Actions and Net Loss on Dispositions Year to Date 2020 (a) Non - GAAP 2020 Adjusted 2019 Operating Profit $ 482.7 $ 760.6 $ 1,002.6 Net Interest Expense 93.0 93.0 96.2 Income Tax Expense 119.3 174.1 233.2 Tax Rate % 30.6% 26.1% 25.7% Income (Loss) From Equity Method Investments (13.0) (13.0) 0.7 Net Income Attributed To Noncontrolling Interests 23.4 23.4 40.0 Net Income - Omnicom Group Inc. $ 234.0 $ 457.1 $ 633.9 Diluted Shares (millions) 216.5 216.5 222.5 Earnings per Share - Diluted $ 1.08 $ 2.11 $ 2.85 Dividends Declared Per Common Share $ 1.30 $ 1.30 $ 1.30 8 July 28, 2020 The above table identifies the U.S. GAAP financial measures of Operating Profit, Income Tax Expense, Net Income - Omnicom Group Inc. and Earnings per Share - Diluted as reported, as well as the non - GAAP amounts excluding the impact of certain repositioning actions and the net loss recognized on dispositions of certain subsidiaries in the column entitled "Non - GAAP 2020 Adjusted" for the six months ended June 30, 2020. We believe that the amounts presented in the "Non - GAAP 2020 Adjusted" column are useful measures for investors to understand the im pact these items had on our reported results. Non - GAAP financial measures should not be considered in isolation from, or as a substitute for, financial information presented in compliance with U.S. GAAP. Non - GAAP financial measures reported by us may not be comparable to similarly titled amounts reported by other companies (a) During the second quarter of 2020, we recorded expenses for certain repositioning actions related to the realignment of o ur businesses in reaction to the COVID - 19 pandemic and recorded a net loss on the disposition of certain subsidiaries. The net impact of these items decreased Operating Profit by $277.9 million, Net Income - Omnicom Group Inc. by $223.1 million and Earnings per Share - Diluted by $1.03 per share for the six months ended June 30, 2020.

2020 Total Revenue Change Second Quarter Year to Date $ % ∆ $ % ∆ Prior Period Revenue $ 3,719.8 $ 7,188.7 Foreign exchange rate impact (a) (61.6) - 1.7% (111.6) - 1.6% Acquisition revenue, net of disposition revenue (b) (2.7) - 0.1% (26.6) - 0.4% Organic growth (c) (854.8) - 23.0% (842.9) - 11.7% Current Period Revenue $ 2,800.7 - 24.7% $ 6,207.6 - 13.6% (a) Foreign exchange rate impact: calculated by translating the current period’s local currency revenue using the prior period average exchange rates to derive current period constant currency revenue. The foreign exchange rate impact is the difference between the current period revenue in U.S. Dollars and the current period constant currency revenue. (b) Acquisition revenue, net of disposition revenue: Acquisition revenue is calculated as if the acquisition occurred twelve mont hs prior to the acquisition date by aggregating the comparable prior period revenue of acquisitions through the acquisition date. As a result, acquisition revenue excludes the positive or negative difference between our current period revenue subsequent to the acquisition date and the comparable prior period revenue and the positive or negative growth after the acquisition date is attributed to organic growth. Disposition re ven ue is calculated as if the disposition occurred twelve months prior to the disposition date by aggregating the comparable prior period revenue of disposals through the disposition date. The acquisition revenue and dis pos ition revenue amounts are netted in the presentation above. (c) Organic growth: calculated by subtracting the foreign exchange rate impact, and the acquisition revenue, net of disposition r eve nue components from total revenue growth. 9 July 28, 2020

2020 Revenue by Discipline Second Quarter Healthcare 10.7% PR 10.6% CRM Execution Advertising & Support 53.5% 8.1% CRM Consumer Experience 17.1% % Organic $ Mix % Growth Growth (a) Year to Date Healthcare 9.3% PR 10.1% CRM Execution & Support 8.8% CRM Consumer Experience 17.1% $ Mix Advertising 54.7% % Growth % Organic Growth (a) Advertising $ 1,499.5 - 28.7% - 26.6% Advertising $ 3,392.3 - 15.9% - 13.9% CRM Consumer 478.7 - 26.7% - 25.6% Experience CRM Consumer Experience 1,061.7 - 15.2% - 14.0% CRM Execution & 227.8 - 29.7% - 27.6% Support CRM Execution & Support 545.9 - 18.8% - 13.7% PR 295.8 - 15.3% - 13.9% PR 627.5 - 8.2% - 7.0% Healthcare 298.9 2.7% 3.2% Healthcare 580.2 5.7% 6.2% Total $ 2,800.7 - 24.7% - 23.0% Total $ 6,207.6 - 13.6% - 11.7% (a) “Organic Growth” reflects the year - over - year increase or decrease in revenue from the prior period, excluding the foreign exchan ge rate impact, acquisition revenue, net of disposition revenue as defined on page 9. 10 July 28, 2020
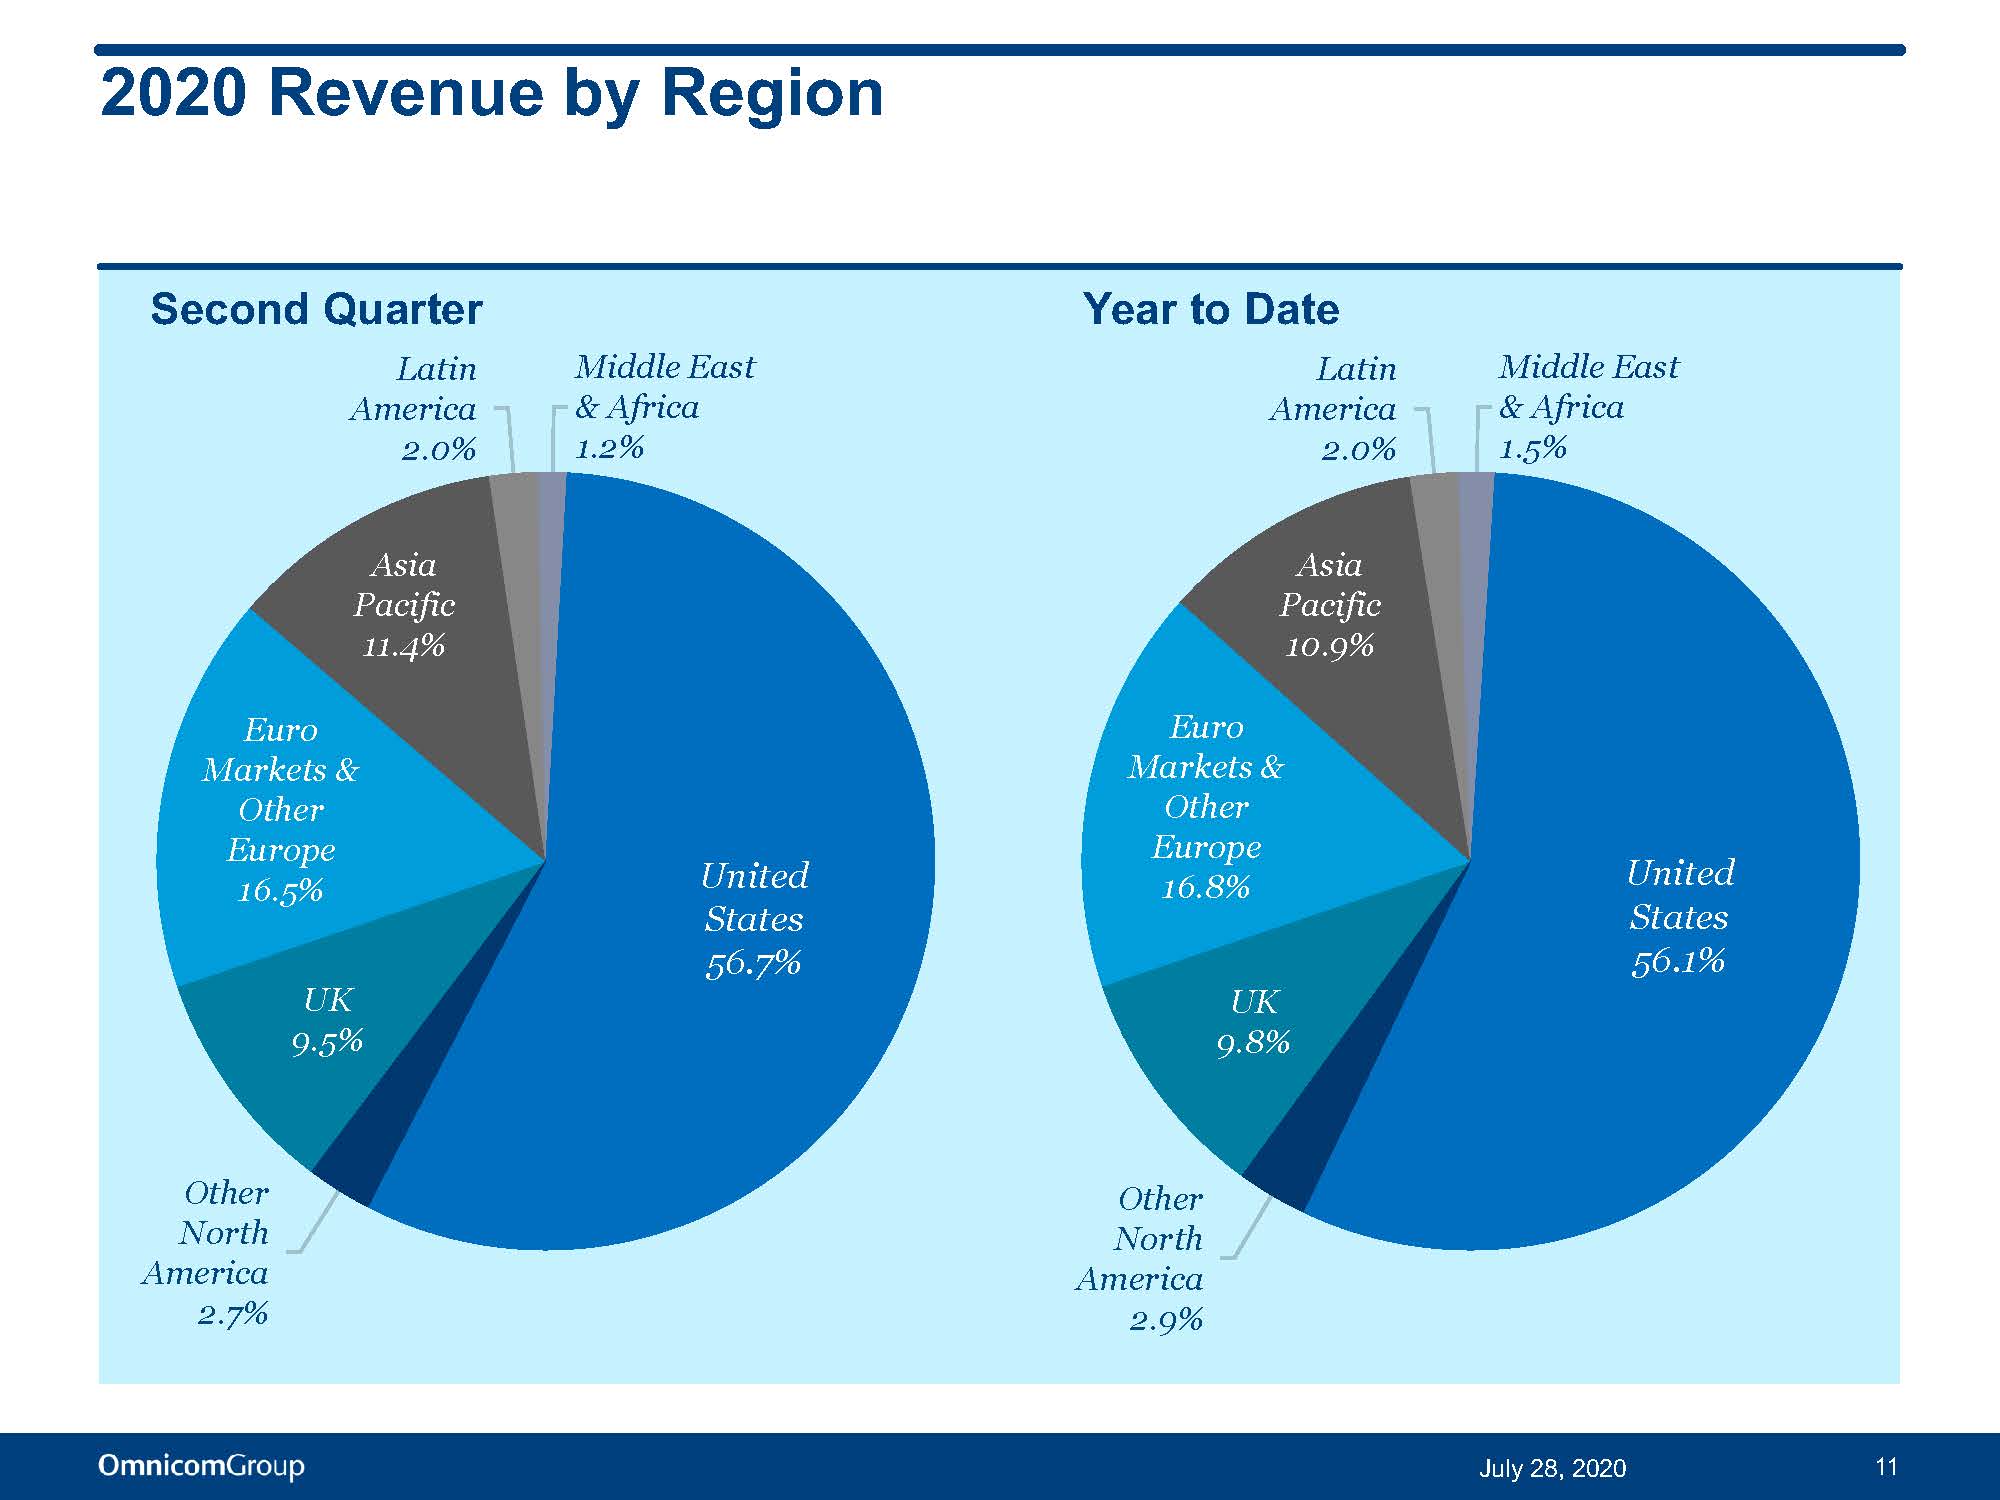
UK 9.8% Euro Markets & Other Europe 16.8% Asia Pacific 10.9% Middle East & Africa 1.5% United States 56 . 1 % Other North America 2.9% UK 9.5% 11 July 28, 2020 Euro Markets & Other Europe 16.5% Asia Pacific 11.4% Second Quarter Latin America 2.0% Middle East & Africa 1.2% United States 56 . 7 % Other North America 2.7% 2020 Revenue by Region Year to Date Latin America 2.0%

2020 Revenue by Region Second Quarter Year to Date $ Mix % Growth % Organic Growth (a) $ 1,587.4 - 20.8% - 20.7% 76.6 - 32.3% - 29.6% 265.5 - 26.5% - 23.7% 462.0 - 31.5% - 29.4% United States Other North America UK Euro Markets & Other Europe Asia Pacific 319.8 - 21.5% - 18.6% Latin America 54.9 - 43.3% - 24.1% Middle East & Africa 34.5 - 43.4% - 39.4% Total $ 2,800.7 - 24.7% - 23.0% $ Mix % Growth % Organic Growth (a) United States Other North America UK Euro Markets & Other Europe Asia Pacific Latin America Middle East & Africa 90.1 - 35.6% - 33.2% Total $ 6,207.6 - 13.6% - 11.7% $ 3,481.7 - 10.5% 179.6 - 17.7% 610.5 - 12.8% 1,040.3 - 18.8% 679.1 - 12.2% 126.3 - 32.0% (a) “Organic Growth” reflects the year - over - year decrease in revenue from the prior period, excluding the foreign exchange rate impa ct, acquisition revenue, net of disposition revenue as defined on page 9. 12 July 28, 2020

Other 7% Services 2% Oil, Gas & Utilities 2% Education 1% Government 3% Not - for - Profit 1% Pharma & Health 16% Retail 6% Tech 8% Telcom 6% T&E 8% Auto 10% Consumer Products 8% Financial Services 8% Food & Beverage 14% Revenue by Industry Year to Date – 2020 Other 8% 13 July 28, 2020 Services 2% Oil, Gas & Utilities 2% Education 1% Government 2% Not - for - Profit 2% Pharma & Health 14% Retail 7% Tech 7% Telcom 5% T&E 8% Auto 10% Consumer Products 9% Financial Services 9% Food & Beverage 14% Year to Date – 2019

Other 6% 14 July 28, 2020 Services 2% Oil, Gas & Utilities 2% Education 1% Government 3% Not - for - Profit 1% Pharma & Health 18% Retail 6% Tech 9% Telcom 6% T&E 6% Auto 9% Consumer Products 9% Financial Services 8% Food & Beverage 14% Revenue by Industry Second Quarter – 2020 % Mix % Change excluding FX rate impact (a) Food and Beverage 14% (26.3)% Consumer Products 9% (27.3)% Pharma & Health 18% (2.8)% Financial Services 8% (28.1)% Technology 9% (3.4)% Auto 9% (29.0)% Travel & Entertainment 6% (46.5)% Telecommunications 6% (9.4)% Retail 6% (37.0)% Services 2% (25.1)% Oil,Gas & Utilities 2% (33.9)% Not - for - Profit 1% (29.2)% Government 3% 9.8 % Education 1% (8.9)% Other 6% (31.7)% Total 100% (23.1)% (a) % Change excluding FX rate impact, reflects the year - over - year percentage change in revenue from the prior period, excluding the foreign exchange rate impact, as defined on page 9.
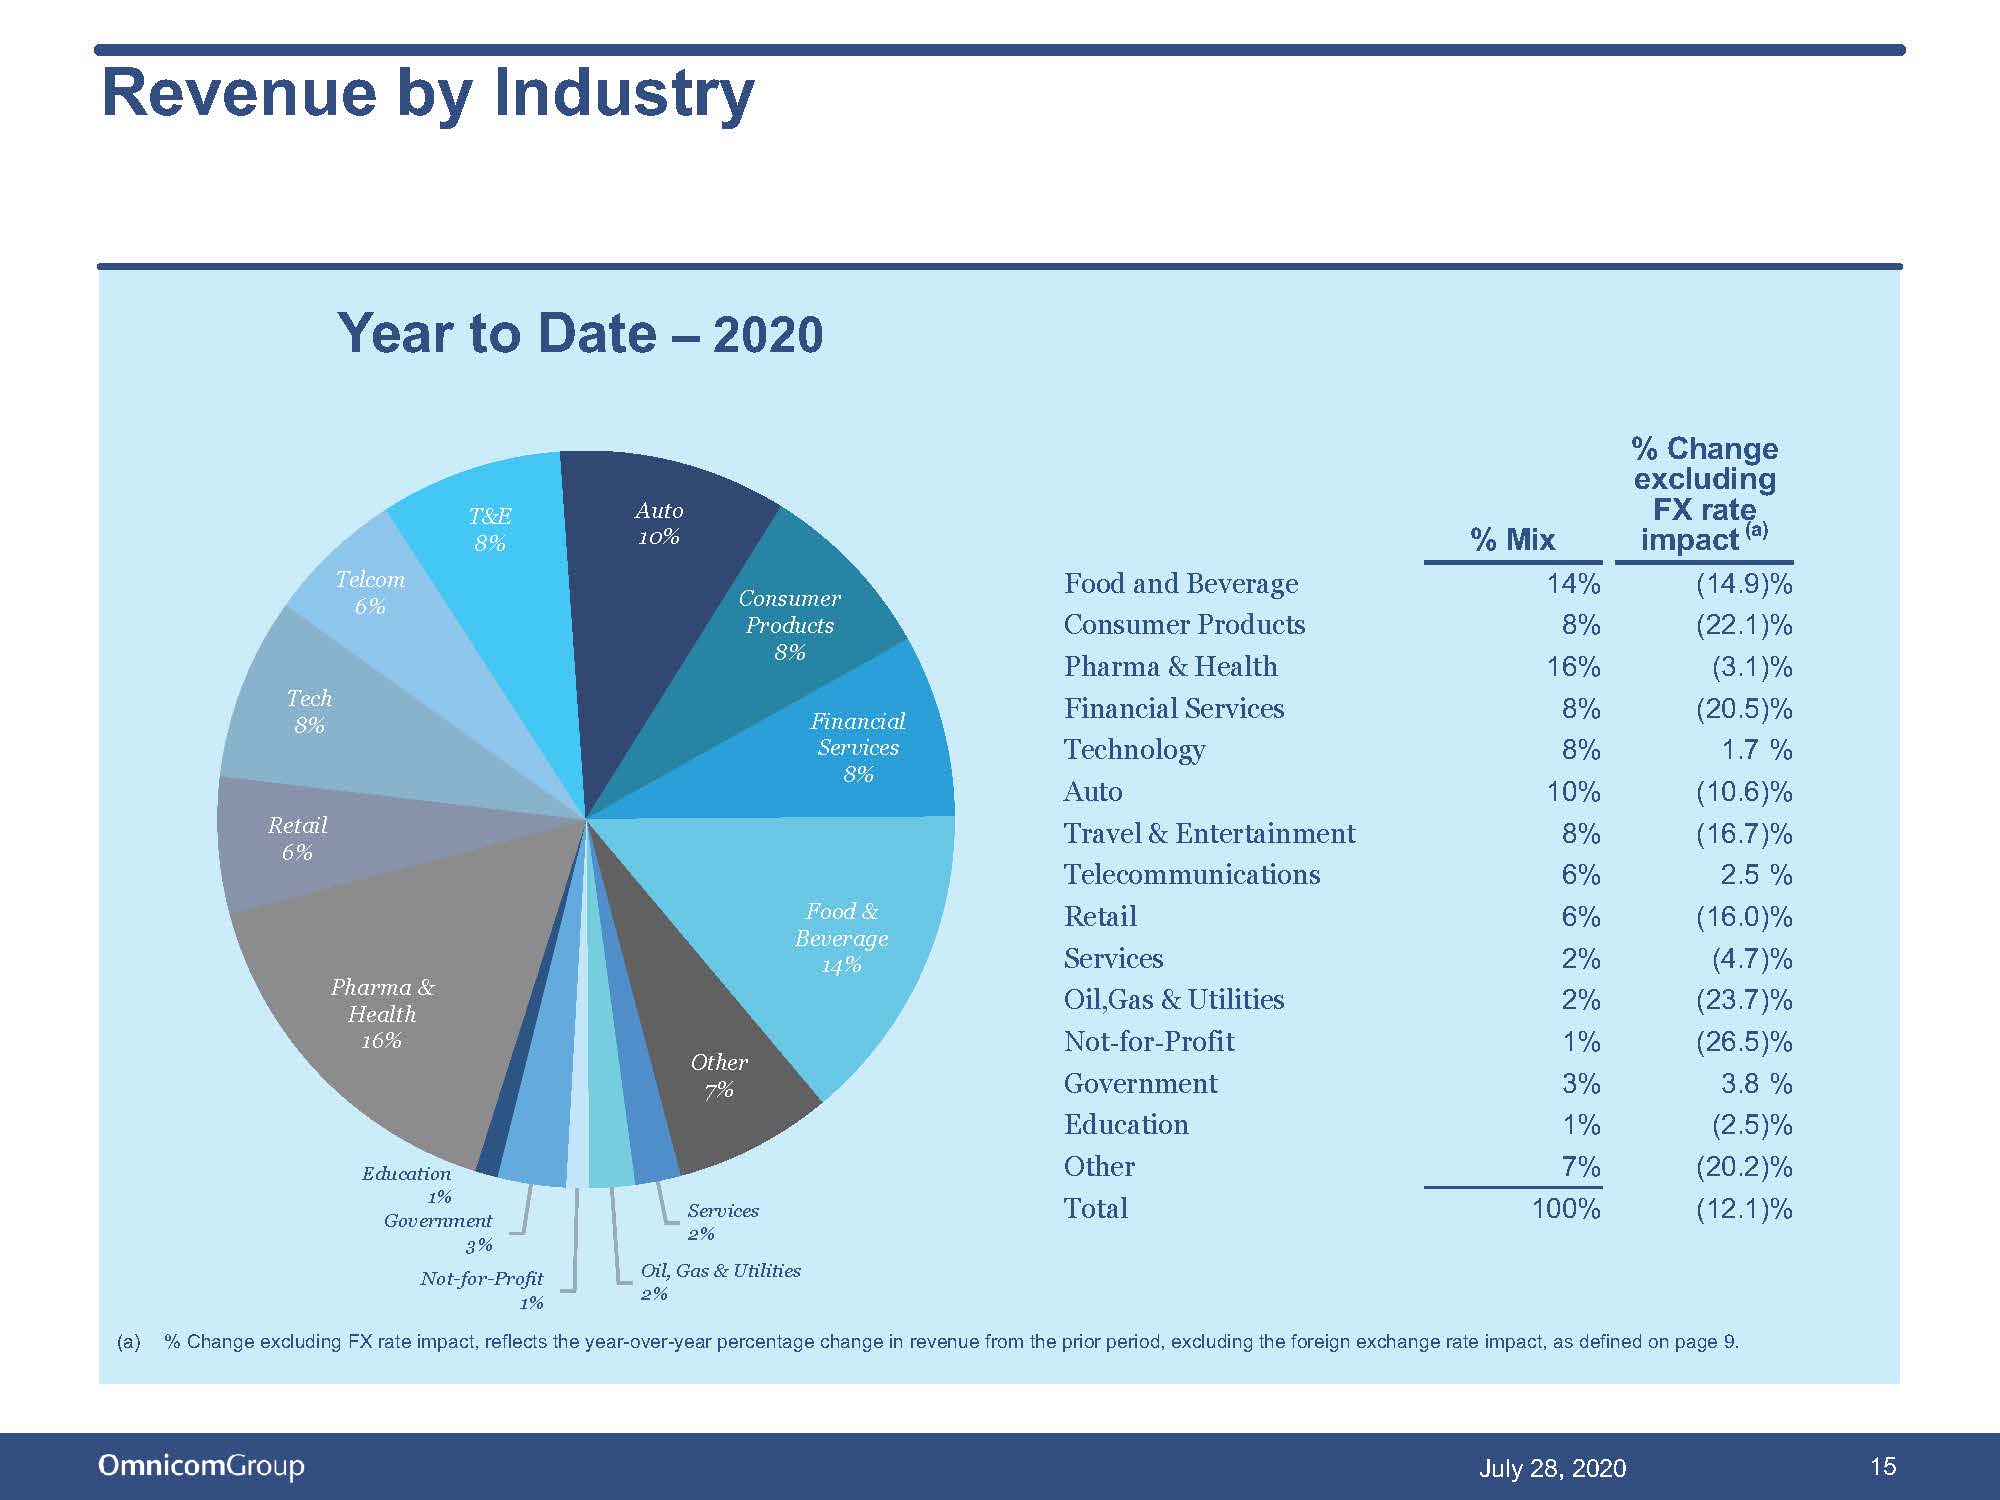
Revenue by Industry Year to Date – 2020 Other 7% 15 July 28, 2020 Services 2% Oil, Gas & Utilities 2% Education 1% Government 3% Not - for - Profit 1% Pharma & Health 16% Retail 6% Tech 8% Telcom 6% T&E 8% Auto 10% Consumer Products 8% Financial Services 8% Food & Beverage 14% % Mix % Change excluding FX rate impact (a) Food and Beverage 14% (14.9)% Consumer Products 8% (22.1)% Pharma & Health 16% (3.1)% Financial Services 8% (20.5)% Technology 8% 1.7 % Auto 10% (10.6)% Travel & Entertainment 8% (16.7)% Telecommunications 6% 2.5 % Retail 6% (16.0)% Services 2% (4.7)% Oil,Gas & Utilities 2% (23.7)% Not - for - Profit 1% (26.5)% Government 3% 3.8 % Education 1% (2.5)% Other 7% (20.2)% Total 100% (12.1)% (a) % Change excluding FX rate impact, reflects the year - over - year percentage change in revenue from the prior period, excluding the foreign exchange rate impact, as defined on page 9.

Cash Flow Performance Six Months Ended June 30 Activities, net 2020 2019 Net Income $ 257.4 $ 673.9 Depreciation and Amortization of Intangible Assets 114.1 117.4 Share - Based Compensation 34.9 34.3 Repositioning Costs and Net Loss on Dispositions 277.9 — Other Items to Reconcile to Net Cash Used in Operating 39.3 (11.9 ) Free Cash Flow (a) $ 723.6 $ 813.7 16 July 28, 2020 Additional information regarding our cash flows can be found in our condensed cash flow statement on page 26. (a) The Free Cash Flow amounts presented above are non - GAAP liquidity measures. See page 33 for the definition of this measure a nd page 30 for the reconciliation of the non - GAAP financial measures, which reconciles Free Cash Flow to the Net Cash Used in Operating Activities for the periods presented above.

Cash Flow Performance Six Months Ended June 30 2020 2019 Free Cash Flow (a) $ 723.6 $ 813.7 Primary Uses of Cash: Dividends paid to Common Shareholders 282.9 280.4 Dividends paid to Noncontrolling Interest Shareholders 35.2 46.1 Capital Expenditures 33.6 48.8 Acquisition of Businesses and Affiliates, Acquisition of Additional Noncontrolling Interests and Contingent Purchase Price Payments, net of Proceeds from Sale of Investments and other 26.0 33.9 Stock Repurchases, net of Proceeds from Stock Plans 202.9 523.7 Primary Uses of Cash (a) 580.6 932.9 Net Free Cash Flow (a) $ 143.0 $ (119.2 ) 17 July 28, 2020 Additional information regarding our cash flows can be found in our condensed cash flow statement on page 27. (a) The Free Cash Flow, Primary Uses of Cash and Net Free Cash Flow amounts presented above are non - GAAP liquidity measures. See page 34 for the definit ion of these measures and page 31 for the reconciliation of non - GAAP financial measures, which reconciles Free Cash Flow to the Net Cash Used in Operating Activities and Net Free Cash Flow to the Net Decrease in Cash and Cash Equivalents for the periods presented above.

Current Credit Picture 18 July 28, 2020 2020 2019 EBITDA (a) $ 1,830.6 $ 2,376.8 Total Debt / EBITDA 3.1 x 2.3 x Net Debt (b) / EBITDA 1.3 x 1.1 x Debt Bank Loans (Due Less Than 1 Year) $ 6.4 $ 16.1 CP & Borrowings Issued Under Revolver — — 2019 OFL Short - term Euro Notes (c) — 592.4 USD - denominated Senior Notes (d) 4,600.0 4,900.0 EUR - denominated Senior Notes (d) 1,124.4 — Other Debt (10.3) 25.4 Total Debt $ 5,720.5 $ 5,533.9 Cash, Cash Equivalents and Short Term Investments 3,281.0 2,903.5 Net Debt (b) $ 2,439.5 $ 2,630.4 Twelve Months Ended June 30 (a) EBITDA is a non - GAAP performance measure. See page 33 for the definition of this measure and page 29 for the reconciliation of n on - GAAP financial measures. (b) Net Debt is a non - GAAP liquidity measure. See page 33 for the definition of this measure, which is reconciled in the table above. (c) In February 2019, Omnicom Finance Limited ("OFL") issued € 520 million of senior notes in a private placement to an investor outside the United States. The notes were unsecured, non - inter est bearing and matured on August 14, 2019. (d) See pages 21 and 22 for additional information on our Senior Notes.

Historical Returns Return on Invested Capital (ROIC) (a) : Twelve months ended June 30, 2020 17.8% Twelve months ended June 30, 2019 23.3% Return on Equity (b) : Twelve months ended June 30, 2020 38.9% Twelve months ended June 30, 2019 56.3% (a) Return on Invested Capital is After Tax Reported Operating Profit (a non - GAAP performance measure – see page 33 for the definition of this measure and page 30 for the reconciliation of non - GAAP financial measures) divided by the average of Invested Capital at the beginning and the end of the period (book value of all long - term liabilities, including those related to operating leases, short - term interest bearing debt, the short - term liability related to operating leases plus shareholders’ equity less cash, cash equivalents, short term investments and operating lease right of use assets) . (b) Return on Equity is Reported Net Income for the given period divided by the average of shareholders’ equity at the beginning and end of the period . 19 July 28, 2020

Supplemental Financial Information 20 July 28, 2020

Omnicom Debt Structure Short - term Debt $6 21 July 28, 2020 2030 Senior Notes $600 2030 Senior Notes $600 2026 Senior Notes $1,400 2024 Senior Notes $750 2022 Senior Notes $1,250 2027 Euro Senior Notes $562 2031 Euro Senior Notes $562 The above chart sets forth Omnicom’s debt outstanding at June 30, 2020. The amounts reflected above for the 2022, 2024, 2026 and 2030 Senior Notes and the 2027 an d 2 031 Euro Senior Notes represent the principal amount of these notes at maturity on May 1, 2022, November 1, 2024, April 15, 2026, April 15 and August 15, 2030, July 8, 2027 and July 8, 2031, respectivel y.

Omnicom Debt Maturity Profile 22 July 28, 2020 Senior Notes 2024 Senior Notes 2027 2030 2030 2031 Euro Senior Senior Euro Senior Notes Notes Senior Notes Notes Other Borrowings $1,400 $1,200 $1,000 $800 $600 $400 $200 $0 2022 2026 Senior Notes Other borrowings at June 30, 2020 include bank loans of $6.4 million, which are due in less than one year. For purposes of this presentation we have included these borrowings as outstanding through February 14, 2025, the date of expiration of our five - year credit facility .

Net Interest Expense Detail Second Quarter Year to Date 2020 % of Rev 2019 % of Rev 2020 % of Rev 2019 % of Rev $ $ 53.7 6.5 66.6 16.4 $ 112.2 19.2 $ 129.6 33.4 Net Interest expense: Interest expense Interest income Net Interest Expense $ 47.2 $ 50.2 $ 93.0 $ 96.2 23 July 28, 2020

Supplemental Prior Period Information 2020 2019 Q1 Q2 Q1 Q2 Q3 Q4 Full Y ear Revenue Operating expenses: Salary and service costs: Salary and related service costs Third - party service costs (a) Occupancy and other costs Repositioning costs and net loss on dispositions Cost of services Selling, general and administrative expenses Depreciation and amortization Total operating expenses Operating Profit $ 3,406.9 $ 2,800.7 $ 3,468.9 $ 3,719.8 $ 3,623.8 $ 4,141.2 $ 14,953.7 1,642.4 1,424.7 1,666.0 1,660.2 1,724.5 1,844.5 6,895.2 890.9 606.4 901.6 1,005.0 980.2 1,190.2 4,077.0 309.6 290.0 309.2 315.4 290.7 306.4 1,221.8 — 277.9 — — — — — 2,842.9 2,599.0 2,876.8 2,980.6 2,995.4 3,341.1 12,194.0 86.8 82.1 103.6 107.7 97.2 97.5 405.9 57.0 57.1 59.6 57.8 57.9 56.2 231.5 2,986.7 2,738.2 3,040.0 3,146.1 3,150.5 3,494.8 12,831.4 $ 420.2 $ 62.5 $ 428.9 $ 573.7 $ 473.3 $ 646.4 $ 2,122.3 24 July 28, 2020 (a) Third - party service costs are expenses paid to third - party vendors incurred primarily in connection with performance obligat ions for our services where we have determined that we are acting as principal. These third - party expenses also include incidental costs incurred in the performance of our services including airfar e, mileage, hotel and out - of - town expenses, etc.

2020 Acquisition Related Expenditures Six Months Ended June 30 Acquisition of Businesses and Affiliates (a) $ — Acquisition of Additional Noncontrolling Interests (b) 16.7 Contingent Purchase Price Payments (c) 12.8 Total Acquisition Expenditures (d) $ 29.5 (a) Includes acquisitions of a majority interest in agencies resulting in their consolidation, including additional interest in e xis ting affiliate agencies resulting in majority ownership. (b) Includes the acquisition of additional equity interests in already consolidated subsidiary agencies which are recorded to Equ ity – Noncontrolling Interest. (c) Includes additional consideration paid for acquisitions completed in prior periods. (d) Total Acquisition Expenditures figure is net of cash acquired. 26 July 28, 2020

Condensed Cash Flow Six Months Ended June 30 2020 2019 Net Income $ 257.4 $ 673.9 Share - Based Compensation 34.9 34.3 Depreciation and Amortization of Intangible Assets 114.1 117.4 Other Items to Reconcile to Net Cash Used in Operating Activities, net 39.3 (11.9) Repositioning costs and net loss on dispositions 277.9 — Changes in Operating Capital (1,585.8) (1,306.6 ) Net Cash Used in Operating Activities (862.2) (492.9) Capital Expenditures (33.6) (48.8) Proceeds from Sale of Investments and other 3.5 0.1 Acquisition of Businesses and Interest in Affiliates, net of cash acquired — (0.7) Proceeds from Dispositions of Subsidiaries 0.2 74.1 Net Cash (Used in) / Provided by Investing Activities (29.9) 24.7 Dividends paid to Common Shareholders (282.9) (280.4) Dividends paid to Noncontrolling Interest Shareholders (35.2) (46.1) Changes in Short - term Debt, net (3.1) 611.1 Proceeds from Long - term Borrowings 1,186.6 — Repayment of Long - term Debt (600.0) — Stock Repurchases, net of Proceeds from Stock Plans (202.9) (523.7) Acquisition of Additional Noncontrolling Interests (16.7) (3.1) Payment of Contingent Purchase Price Obligations (12.8) (30.2) Other Financing Activities, net (38.7) (24.3) Net Cash Used in Financing Activities (5.7) (296.7) Effect of foreign exchange rate changes on cash and cash equivalents (126.9) 10.6 Net Decrease in Cash and Cash Equivalents $ (1,024.7) $ (754.3) 27 July 28, 2020

Net Cash Returned to Shareholders through Dividends and Share Repurchases From 2010 through June 30, 2020, Omnicom distributed 110% of Net Income to shareholders through dividends and share repurchases . Cumulative Cost of Net Shares Repurchased - Payments for repurchases of common stock less proceeds from stock plans (share repur chases were suspended during the first quarter of 2020 in reaction to the COVID - 19 pandemic) Cumulative Dividends Paid Cumulative Net Income - Omnicom Group Inc. % of Cumulative Net Income Returned to Shareholders - Cumulative Dividends Paid plus Cumulative Cost of Net Shares Repurchased d ivided by Cumulative Net Income. $12.0 $10.0 $8.0 $6.0 $4.0 $2.0 $ In Billions 2010 20 1 1 2012 2013 2014 2015 2016 2017 2018 2019 2020 6.8 7.4 7.6 $0.8 $0.0 $1.8 $2.8 $3.8 $4.9 $7.1 $8.2 $9.5 3.7 $10.9 4.3 $11.1 4.6 169% 134% 121% 124% $6.0 122% 1 17% 1 15% 1 10% 1 10% 28 July 28, 2020 135% 108%
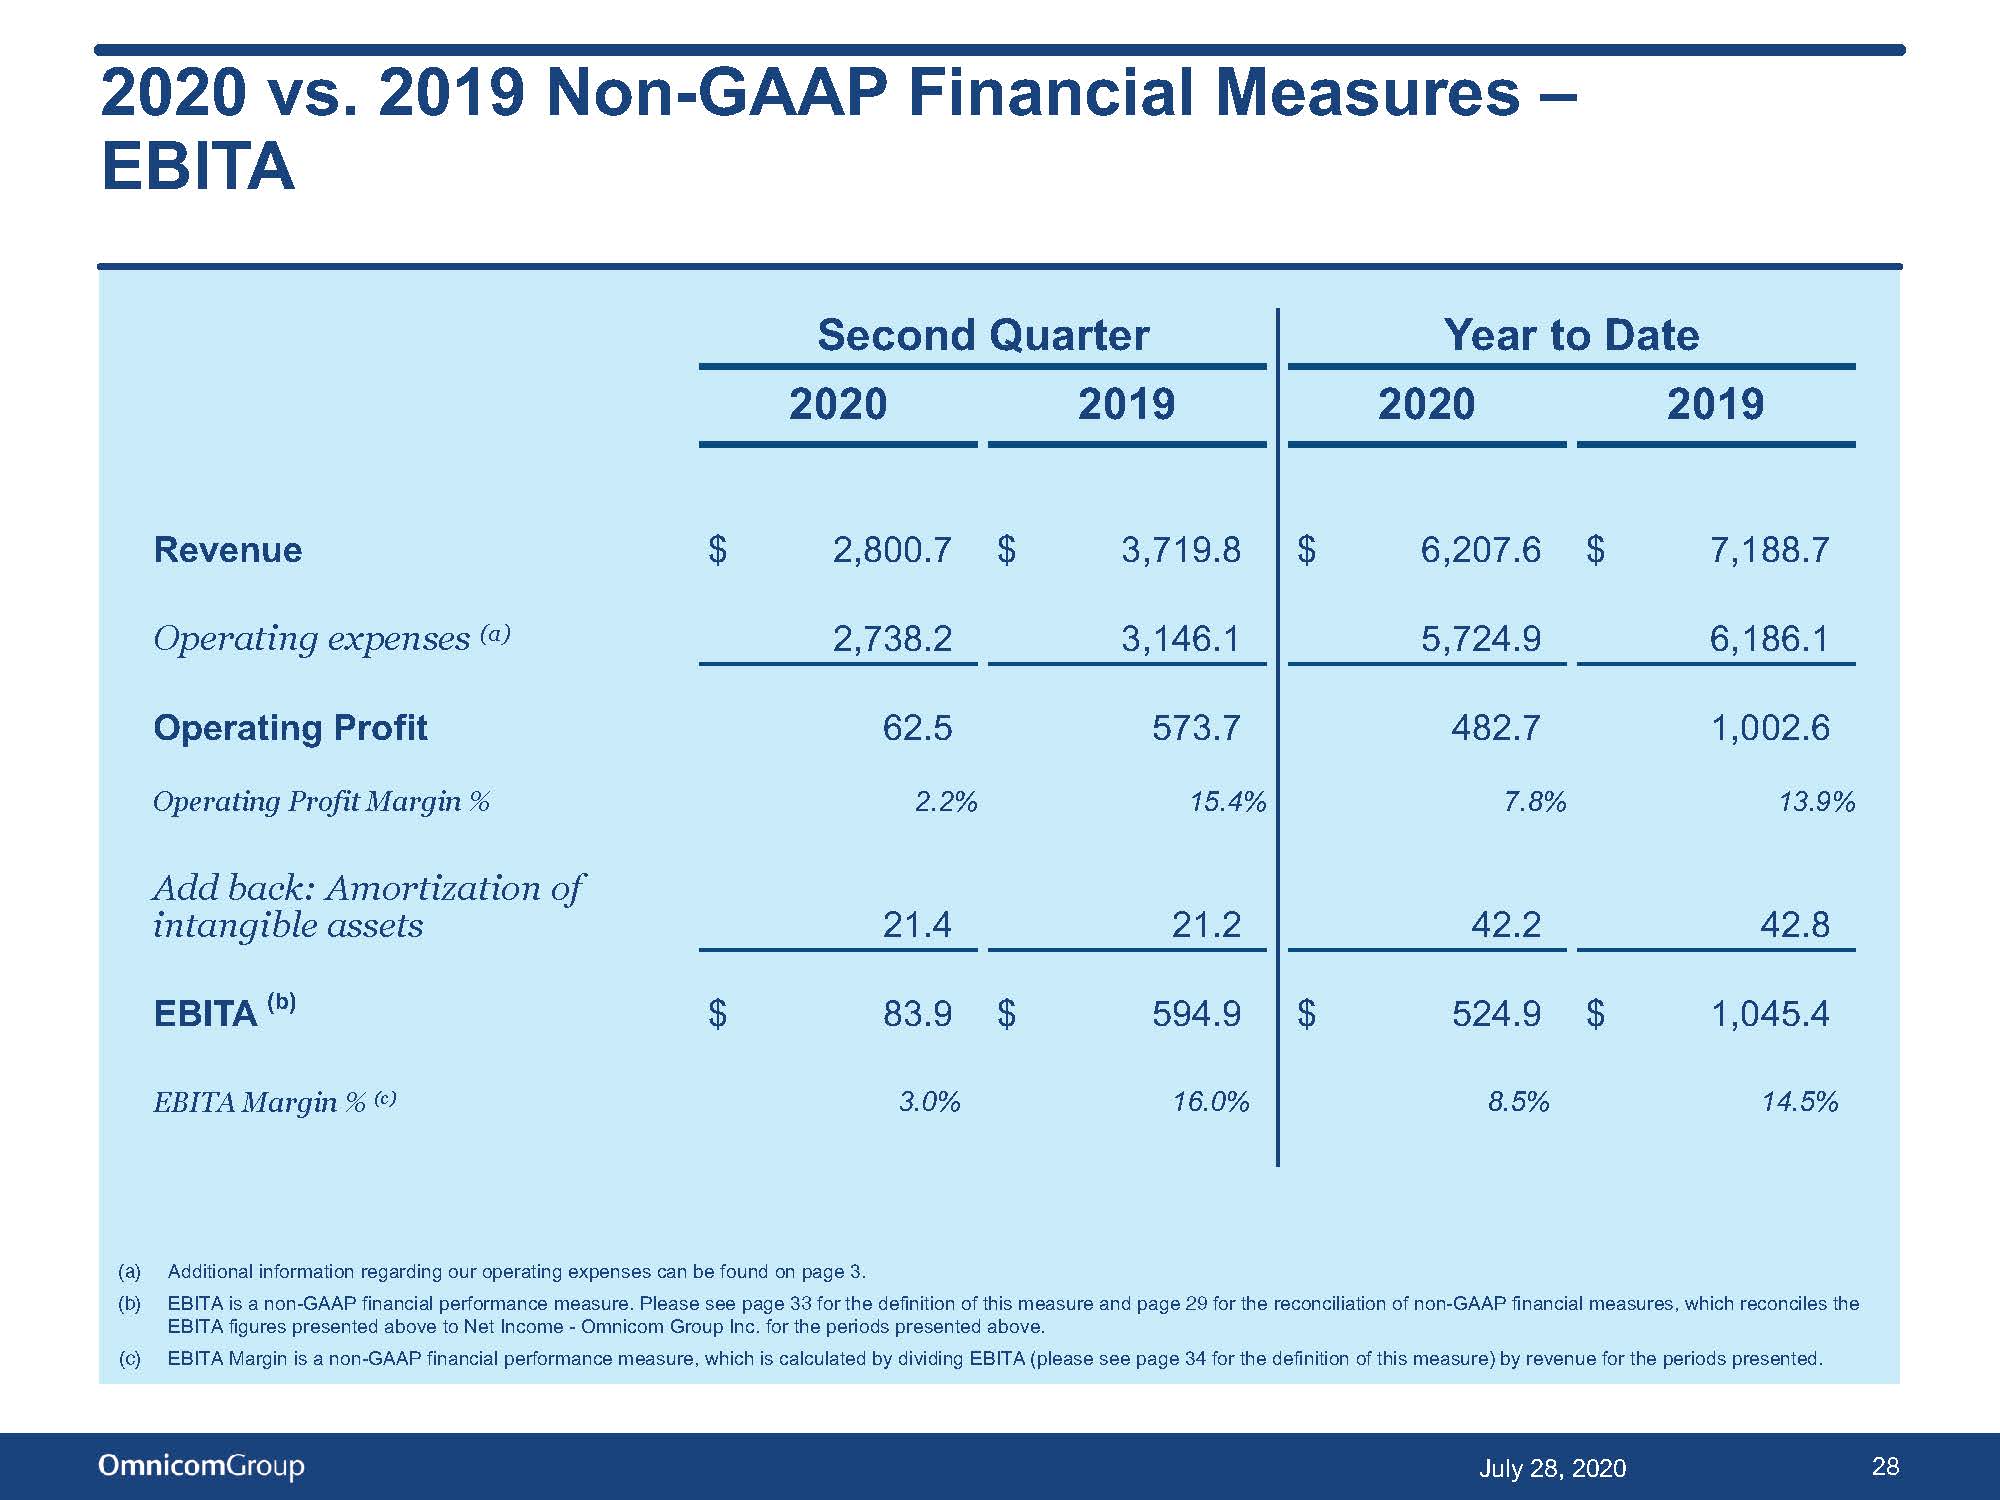
2020 vs. 2019 Non - GAAP Financial Measures – EBITA (a) Additional information regarding our operating expenses can be found on page 3. (b) EBITA is a non - GAAP financial performance measure. Please see page 33 for the definition of this measure and page 29 for the reconcili ation of non - GAAP financial measures, which reconciles the EBITA figures presented above to Net Income - Omnicom Group Inc. for the periods presented above. (c) EBITA Margin is a non - GAAP financial performance measure, which is calculated by dividing EBITA (please see page 34 for the definition of this measure) by revenue for the periods presented. Second Quarter Year to Date 2020 2019 2020 2019 Revenue $ 2,800.7 $ 3,719.8 $ 6,207.6 $ 7,188.7 Operating expenses (a) 2,738.2 3,146.1 5,724.9 6,186.1 Operating Profit 62.5 573.7 482.7 1,002.6 Operating Profit Margin % 2.2% 15.4% 7.8% 13.9% Add back: Amortization of intangible assets 21.4 21.2 42.2 42.8 EBITA (b) $ 83.9 $ 594.9 $ 524.9 $ 1,045.4 EBITA Margin % (c) 3.0% 16.0% 8.5% 14.5% 29 July 28, 2020

Reconciliation of Non - GAAP Financial Measures – EBITA and EBITDA Three Months Ended June 30 Six Months Ended June 30 Twelve Months Ended June 30 2020 2019 2020 2019 2020 2019 Net Income (Loss) - Omnicom Group Inc. $ (24.2) $ 370.7 $ 234.0 $ 633.9 $ 939.2 $ 1,332.0 Net Income (Loss) Attributed to Noncontrolling Interests 9.8 23.4 23.4 40.0 80.2 102.9 Net Income (Loss) (14.4) 394.1 257.4 673.9 1,019.4 1,434.9 Income (Loss) From Equity Method Investments (7.8) 1.2 (13.0) 0.7 (11.7) 7.0 Income Tax Expense 21.9 130.6 119.3 233.2 390.5 498.2 Income Before Income Taxes 15.3 523.5 389.7 906.4 1,421.6 1,926.1 Net Interest Expense 47.2 50.2 93.0 96.2 180.8 206.1 Operating Profit 62.5 573.7 482.7 1,002.6 1,602.4 2,132.2 Amortization of Intangible Assets 21.4 21.2 42.2 42.8 83.2 90.8 EBITA 83.9 594.9 524.9 1,045.4 1,685.6 2,223.0 Depreciation 35.7 36.6 71.9 74.6 145.0 153.8 EBITDA $ 119.6 $ 631.5 $ 596.8 $ 1,120.0 $ 1,830.6 $ 2,376.8 30 July 28, 2020 The above table reconciles the GAAP financial measure of Net Income – Omnicom Group Inc. to the non - GAAP financial measures of EBITDA and EBITA for the periods presented. EBITDA and EBITA, which are defined on page 33, are non - GAAP financial measures within the meaning of applicable SEC rules and regulations. Our credit facility defines EBITDA as earnings before deducting interest expense, income taxes, depreciation and amortization. Our credit facility uses EBITDA to measure our compl ian ce with covenants, such as interest coverage and leverage ratios, as presented on page 18 of this presentation.

Reconciliation of Non - GAAP Financial Measures Six Months Ended June 30 Six Months Ended June 30 2020 2019 Net Cash Used in Operating Activities $ (862.2) $ (492.9) Operating Activities items excluded from Free Cash Flow: Changes in Operating Capital (1,585.8) (1,306.6) Free Cash Flow $ 723.6 $ 813.7 2020 2019 Net Decrease in Cash and Cash Equivalents $ (1,024.7) $ (754.3) Cash Flow items excluded from Net Free Cash Flow: Changes in Operating Capital (1,585.8) (1,306.6) Proceeds from Dispositions of Subsidiaries 0.2 74.1 Changes in Short - term Debt, net (3.1) 611.1 Proceeds from Long - term Borrowings 1,186.6 — Repayment of Long - term Debt (600.0) — Other Financing Activities, net (38.7) (24.3) Effect of foreign exchange rate changes on cash and cash equivalents (126.9) 10.6 Net Free Cash Flow $ 143.0 $ (119.2) Twelve Months Ended June 30 2020 2019 Reported Operating Profit 1,602.4 2,132.2 Effective Tax Rate for the applicable period 27.5% 25.9% Income Taxes on Reported Operating Profit 440.7 552.2 After Tax Reported Operating Profit $ 1,161.7 $ 1,580.0 31 July 28, 2020
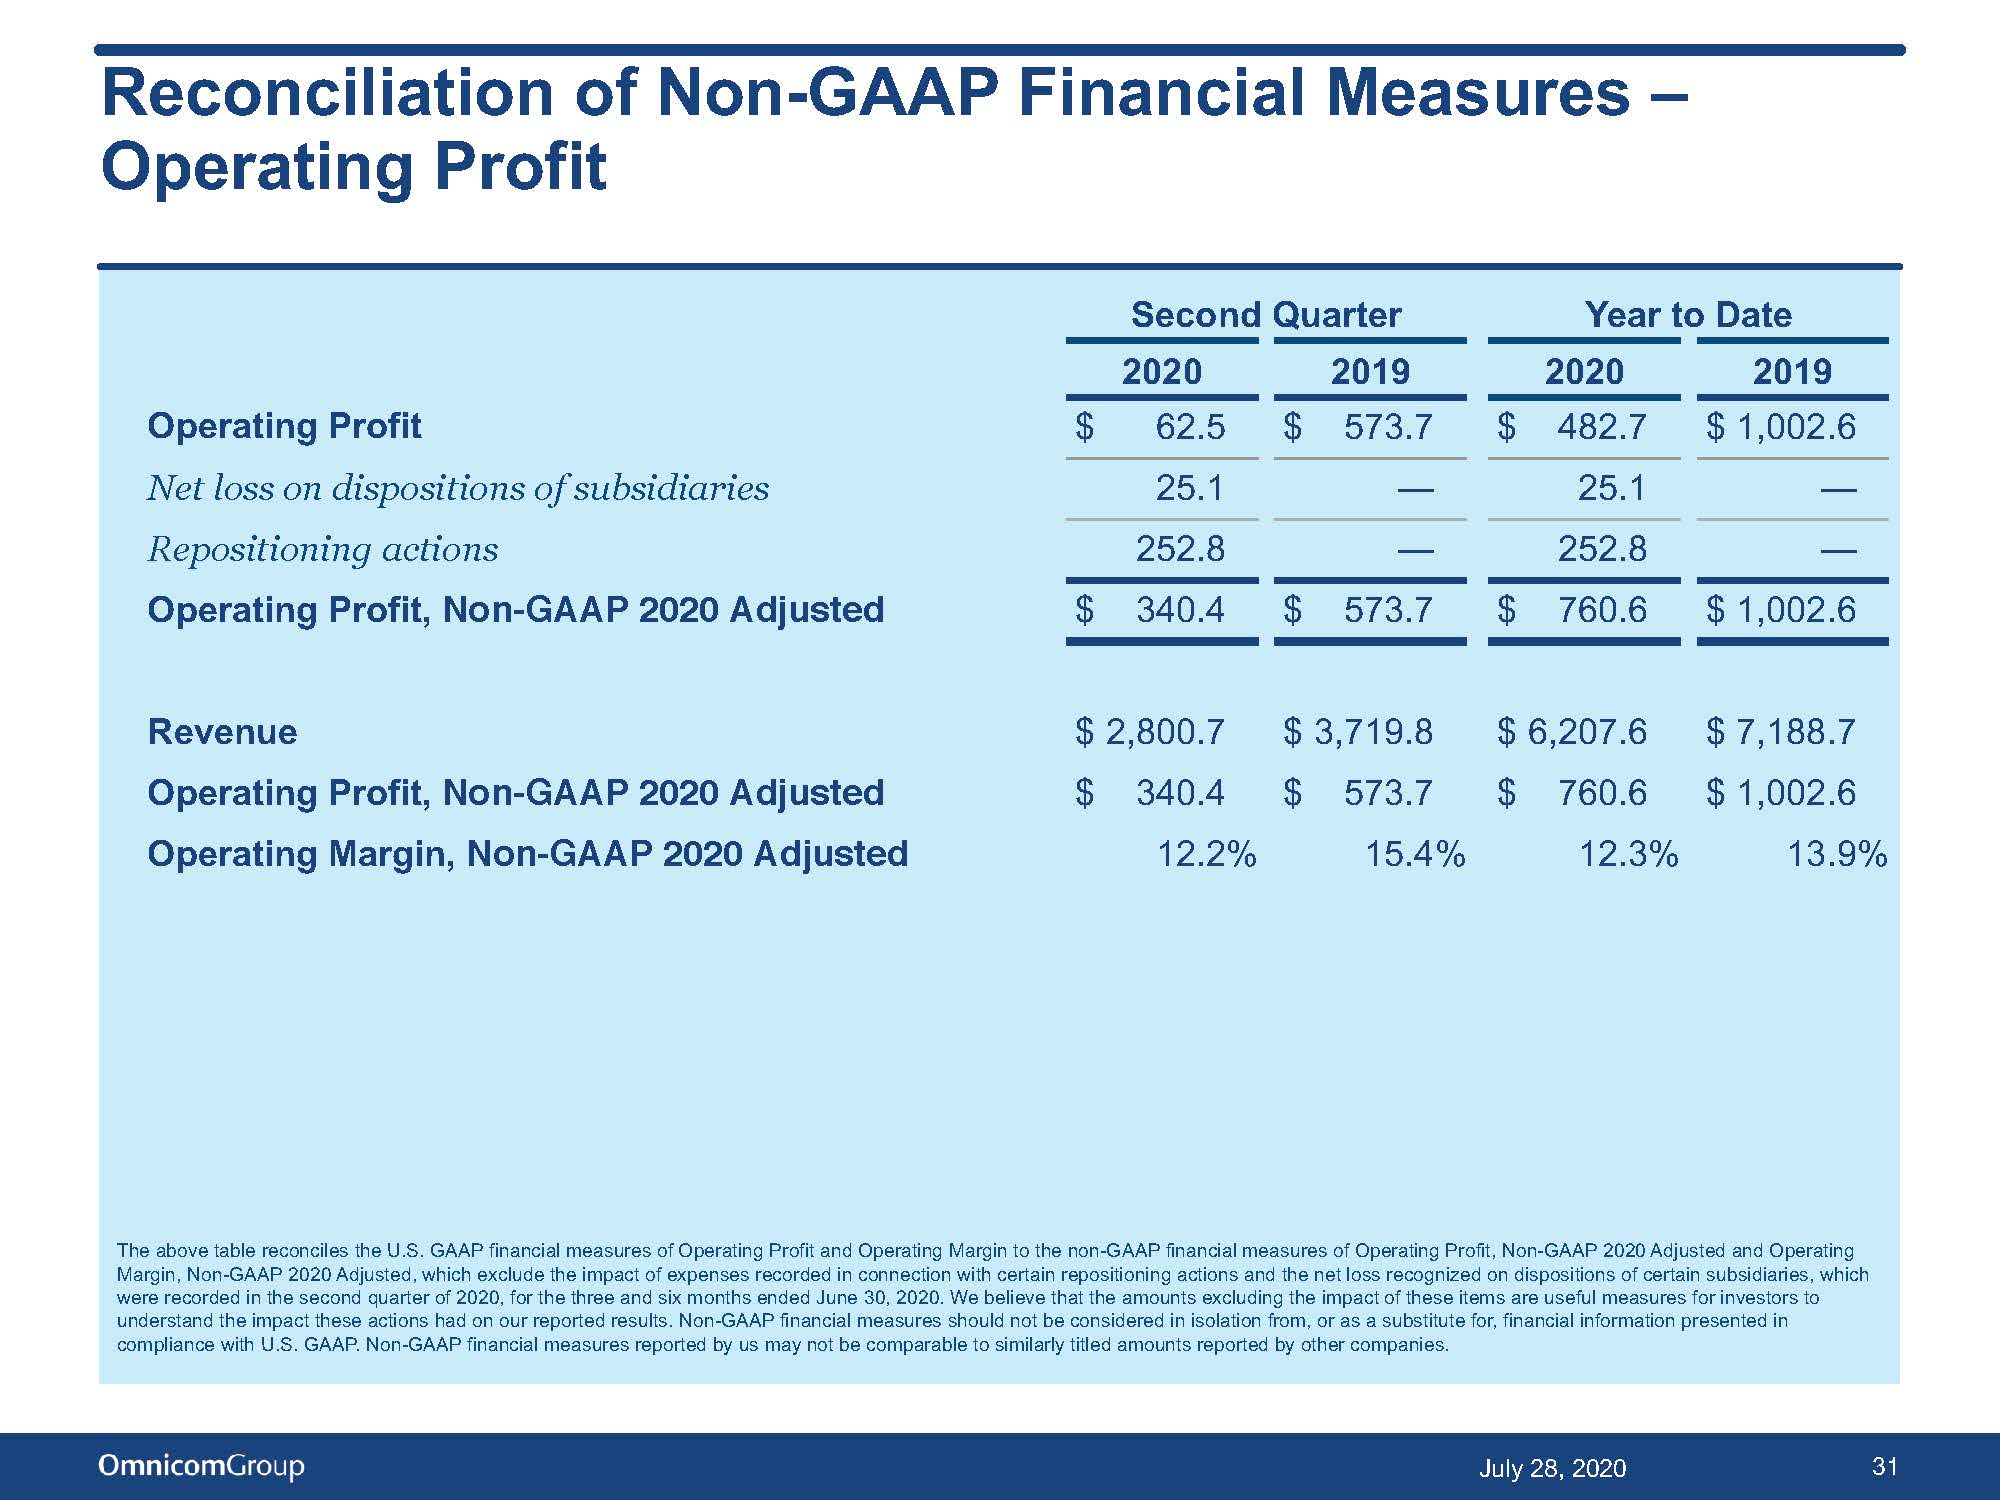
Reconciliation of Non - GAAP Financial Measures – Operating Profit Second Quarter Year to Date 2020 2019 2020 2019 Operating Profit $ 62.5 $ 573.7 $ 482.7 $ 1,002.6 Net loss on dispositions of subsidiaries 25.1 — 25.1 — Repositioning actions 252.8 — 252.8 — Operating Profit, 2020 Non-GAAP 2020 Adjusted $ 340.4 $ 573.7 $ 760.6 $ 1,002.6 Revenue $ 2,800.7 $ 3,719.8 $ 6,207.6 $ 7,188.7 Operating Profit, 2020 Non-GAAP 2020 Adjusted $ 340.4 $ 573.7 $ 760.6 $ 1,002.6 Operating Margin, 2020 Non-GAAP 2020 Adjusted 12.2% 15.4% 12.3% 13.9% 32 July 28, 2020 The above table reconciles the U.S. GAAP financial measures of Operating Profit and Operating Margin to the non - GAAP financial m easures of Operating Profit, Non - GAAP 2020 Adjusted and Operating Margin, Non-GAAP 2020 Adjusted, which exclude the impact of expenses recorded in connection with certain repositioning actions and the net loss recognized on dispositions of certain subsidiaries, which were recorded in the second quarter of 2020, for the three and six months ended June 30, 2020. We believe that the amounts excluding the impact of these items are useful measures for investors to understand the impact these actions had on our reported results. Non - GAAP financial measures should not be considered in isolati on from, or as a substitute for, financial information presented in compliance with U.S. GAAP. Non - GAAP financial measures reported by us may not be comparable to similarly titled amounts reported by other companies.

Reconciliation of 2020 Non - GAAP Financial Measures - Net Income - Omnicom Group Inc. Three Months Six Months Ended June 30, Ended June 30, 2020 2020 Net Income (Loss) - Omnicom Group Inc., as reported $ (24.2) $ 234.0 Net loss on dispositions, before income tax expense 25.1 25.1 Repositioning actions - Incremental Severance and other items, before income tax expense Repositioning actions - Lease terminations, before income tax expense" to "Right-of-use asset impairments and other real estate costs 150.0 102.8 150.0 102.8 Income tax benefit on repositioning actions and loss on dispositions (54.8) (54.8) Net Income - Omnicom Group Inc., Non-GAAP 2020 Adjusted $ 198.9 $ 457.1 33 July 28, 2020 The table above reconciles the U . S . GAAP financial measure of Net Income (Loss) - Omnicom Group Inc . to the non - GAAP financial measure of Net Income - Omnicom Group Inc . , 2020 Non - GAAP Adjusted, which adjusts for the impact of the certain repositioning actions and the net loss recognized on dispositions of certain subsidiaries for the three and six months ended June 30 , 2020 . We believe the amounts adjusted for the impact of these items are useful measures for investors to understand the impact these actions had on the comparability of our reported results . Non - GAAP financial measures should not be considered in isolation from, or as a substitute for, financial information presented in compliance with U . S . GAAP . Non - GAAP financial measures reported by us may not be comparable to similarly titled amounts reported by other companies .

Disclosure 34 July 28, 2020 The preceding materials have been prepared for use in the July 28, 2020 conference call on Omnicom’s results of operations for the three and six months ended June 30, 2020. The call will be archived on the Internet at http://investor.omnicomgroup.com/investor - relations/news - events - and - filings / . Forward - Looking Statements Certain statements in this presentation constitute forward - looking statements, including statements within the meaning of the Pr ivate Securities Litigation Reform Act of 1995. In addition, from time to time, Omnicom Group Inc. ("Omnicom" or the "Company") or its representatives have made, or may make, forward - looking statements, orally or in writing. These statements may discuss goals, intentions and expectations as to future plans, trends, events, results of operations or financial condition, or otherwise, based on current beliefs of the Company’s management as well as assumptions made by, and information currently available to, the Company’s management. Forward - looking statements may be accompanied by words such as “aim,” “anticipate,” “believe,” “plan,” “could,” “sho uld,” “would,” “estimate,” “expect,” “forecast,” “future,” “guidance,” “intend,” “may,” “will,” “possible,” “potential,” “predict,” “project” or similar words, phrases or expressions. These forward - looking statements are subject to various risks and uncertainties, many of which are outside the Company’s control. Therefore, you should not place undue reliance on such statements. Factors that could cause actual results to differ materially from those in the forward - looking statements include: international, national or local economic conditions that could adversely affect the Company or its clients, including those caused by the outbreak of coronavirus disease 2019 (“COVID - 19”); losses on media pur chases and production costs incurred on behalf of clients; reductions in client spending, a slowdown in client payments and a deterioration in the credit markets; th e ability to attract new clients and retain existing clients in the manner anticipated; changes in client advertising, marketing and corporate communications requirements; failure to manage potential conflicts of interest be twe en or among clients; unanticipated changes relating to competitive factors in the advertising, marketing and corporate communications industries; the ability to hire and retain key personnel; currency exchan ge rate fluctuations; reliance on information technology systems; changes in legislation or governmental regulations affecting the Company or its clients; risks associated with assumptions the Company makes in connection with its critical accounting es tim ates and legal proceedings; and the Company’s international operations, which are subject to the risks of currency repatriation restrictions, social or political condition s a nd regulatory environment. The foregoing list of factors is not exhaustive. You should carefully consider the foregoing factors and the other risks and uncertainties that may affect the Company’s business, including those described in Item 1A, “Risk Factors” in Omnicom’s most recent Annual Report on Form 10 - K and other documents filed from time to time with the Securities and Exchange Commission. Except as required under applicable law, the Company does not assume any obligation to update these forward - looking statements. Non - GAAP Financial Measures We present financial measures determined in accordance with generally accepted accounting principles in the United States (“GAAP ”) and adjustments to the GAAP presentation (“Non - GAAP”), which we believe are meaningful for understanding our performance. Non - GAAP financial measures should not be considered in isolation from, or as a su bstitute for, financial information presented in compliance with GAAP. Non - GAAP financial measures as reported by us may not be comparable to similarly titled amounts reported by other companies. We provide a reconciliation of non - GAAP measures to the comparable GAAP measures on pages 27 to 33 . The Non - GAAP measures used in this presentation include the following: Non - GAAP 2020 Adjusted results, defined as our operating results excluding the impact of repositioning actions taken and a net loss on the disposition of certain subsidiaries in the second quarter of 2020. We believe that this is a meaningful operating performance measure to understand he impact these actions had on our reported results. Free Cash Flow, defined as net income plus depreciation, amortization, share based compensation expense plus/(less) other items to reconcile to net cash used in operating activities. We believe Free Cash Flow is a useful measure of liquidity to evaluate our ability to generate excess cash from our operations. Primary Uses of Cash, defined as dividends to common shareholders, dividends paid to non - controlling interest shareholders, capi tal expenditures, cash paid on acquisitions, payments for additional interest in controlled subsidiaries and stock repurchases, net of the proceeds from our stock plans, and excludes changes in operating capital and o the r investing and financing activities, including commercial paper issuances and redemptions used to fund working capital changes. We believe this liquidity measure is useful in identifying the significant uses of our cash. Net Free Cash Flow, defined as Free Cash Flow less the Primary Uses of Cash. Net Free Cash Flow is one of the metrics used by us to assess our so urc es and uses of cash and was derived from our consolidated statements of cash flows. We believe that this liquidity measure is meaningful for understanding our primary sources and primary uses of that cash flow. EBITDA, defined as operating profit before interest, taxes, depreciation and amortization of intangible assets. We believe EBITDA is a meaningful operating performance measure because the financial covenants in our credit facilities are based on EBITDA. EBITA, defined as operating profit before interest, taxes and amortization of intangible assets and EBITA margin, defined as EBITA divided by revenue. We use EBITA and EBITA margin as additional operating performance measures, which excludes the non - cash amortization expense of intangible assets (primarily consisting of amortizatio n arising from acquisitions). Accordingly, we believe it is a useful measure for investors to evaluate the performance of our business. Net Debt, defined as total debt less cash, cash equivalents and short - term investments. We believe net debt, together with the comparable GAAP measures, reflects one of the liquidity metrics used by us to assess our cash management. After Tax Reported Operating Profit, defined as reported operating profit less income taxes calculated using the effective tax rate for the applicable period. Management uses after tax operating profit as a measure of after tax operating performance as it excludes the after tax effects of financing and investing activities on results of operations. Other Information All dollar amounts are in millions except for per share figures on page s 1, 2, 5, 6, 7 and 8 a nd the net cash returned to shareholders figures on page 28. The information contained in this document has not been audited, although some data has been derived from Omnicom’s historical financial statements, including its audited financial statements. In addition, industry, operational and other non - financial data contained in this document have been derived from sources that we believe to be reliable, but we have not independently verified such information, and w e d o not, nor does any other person, assume responsibility for the accuracy or completeness of that information. Certain amounts in prior periods have been reclassified to conform to our current presentation. The incl usi on of information in this presentation does not mean that such information is material or that disclosure of such information is required.