Attached files
| file | filename |
|---|---|
| 8-K - FORM -8K - NABORS INDUSTRIES LTD | tm2025781-1_8k.htm |
| EX-99.1 - EXHIBIT 99.1 - NABORS INDUSTRIES LTD | tm2025781d1_ex99-1.htm |
Exhibit 99.2
 |
NABORS INDUSTRIES 2Q 2020 Earnings Presentation WTueesddayn, eJuslyd28a, y20,20July 29th 2020 |
 |
Forward Looking Statements We often discuss expectations regarding our future markets, demand for our products and services, and Our businesses depend, to a large degree, on the level of spending by oil and gas companies for exploration, our performance in our annual, quarterly, and current reports, press releases, and other written and oral development and production activities. Therefore, sustained lower oil or natural gas prices that have a statements. Such statements, including statements in this document that relate to matters that are not material impact on exploration, development or production activities could also materially affect our financial historical facts, are “forward-looking statements” within the meaning of the safe harbor provisions of position, results of operations and cash flows. Section 27A of the U.S. Securities Act of 1933 and Section 21E of the U.S. Securities Exchange Act of 1934. These “forward-looking statements” are based on our analysis of currently available competitive, The outbreak of COVID-19, along with decisions by large oil and natural gas producing countries, has led to financial and economic data and our operating plans. They are inherently uncertain, and investors should decreases in commodity prices, specifically oil and natural gas prices, resulting from oversupply and demand recognize that events and actual results could turn out to be significantly different from our expectations.weakness. These price decreases caused significant disruptions and volatility in the global marketplace during the first quarter of 2020, leading to a decrease in the demand for our products and services. Lower prices and Factors to consider when evaluating these forward-looking statements include, but are not limited to: the resulting weakness in demand for our services, which have negatively affected our results of operations •The Covid-19 pandemic and its impact on oil and gas markets and prices;and cash flows, have persisted into the second quarter, and there remains continuing uncertainty regarding •fluctuations and volatility in worldwide prices of and demand for oil and natural gas;the length and impact of COVID-19 on the energy industry and the outlook for our business. •fluctuations in levels of oil and natural gas exploration and development activities; •fluctuations in the demand for our services;The above description of risks and uncertainties is by no means all-inclusive, but is designed to highlight what •competitive and technological changes and other developments in the oil and gas and oilfield services industries;we believe are important factors to consider. For a discussion of these factors and other risks and •our ability to renew customer contracts in order to maintain competitiveness;uncertainties, please refer to our filings with the Securities and Exchange Commission ("SEC"), including •the existence of operating risks inherent in the oil and gas and oilfield services industries;those contained in our Annual Reports on Form 10-K and Quarterly Reports on Form 10-Q, which are •the possibility of the loss of one or a number of our large customers;available at the SEC's website at www.sec.gov. •the impact of long-term indebtedness and other financial commitments on our financial and operating flexibility; •our access to and the cost of capital, including the impact of a further downgrade in our credit rating, covenantNon-GAAP Financial Measures restrictions, availability under our unsecured revolving credit facility, and future issuances of debt or equity securities;This presentation refers to certain “non-GAAP” financial measures, such as adjusted EBITDA, adjusted •our dependence on our operating subsidiaries and investments to meet our financial obligations;operating income (loss), net debt and free cash flow. The components of these non-GAAP measures are •our ability to retain skilled employees;computed by using amounts that are determined in accordance with accounting principles generally accepted •our ability to complete, and realize the expected benefits, of strategic transactions;in the United States of America (“GAAP”).A reconciliation of adjusted EBITDA and adjusted operating •changes in tax laws and the possibility of changes in other laws and regulation;income (loss) to income (loss) from continuing operations before income taxes, net debt to total debt, and free •the possibility of political or economic instability, civil disturbance, war or acts of terrorism in any of the countriescash flow to net cash provided by operating activities, which are their nearest comparable GAAP financial in which we do business;measures, is provided in the Appendix at the end of this presentation. •the possibility of changes to U.S. trade policies and regulations including the imposition of trade embargoes or sanctions; and •general economic conditions, including the capital and credit markets. 2 |
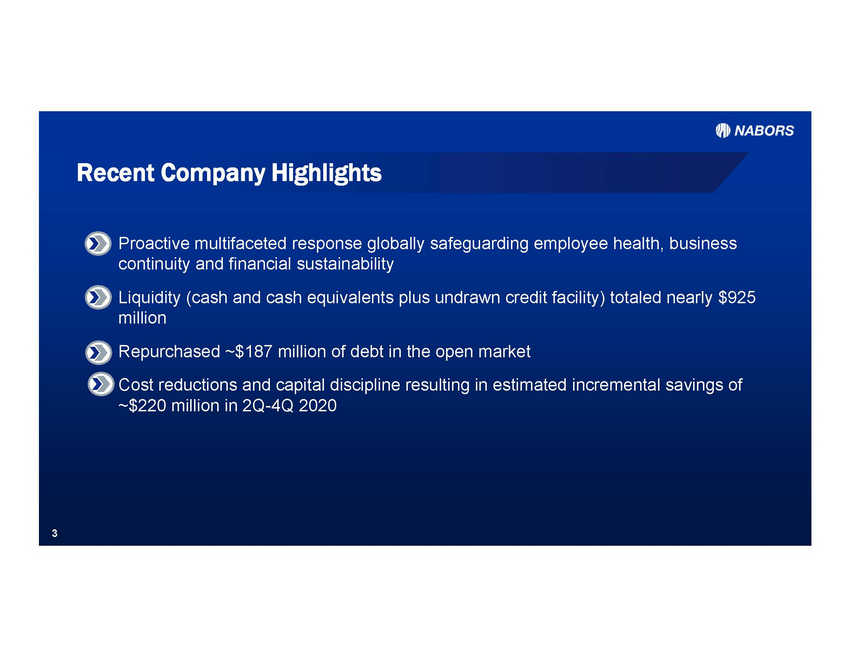 |
Recent Company Highlights Proactive multifaceted response globally safeguarding employee health, business continuity and financial sustainability Liquidity (cash and cash equivalents plus undrawn credit facility) totaled nearly $925 million Repurchased ~$187 million of debt in the open market Cost reductions and capital discipline resulting in estimated incremental savings of ~$220 million in 2Q-4Q 2020 3 |
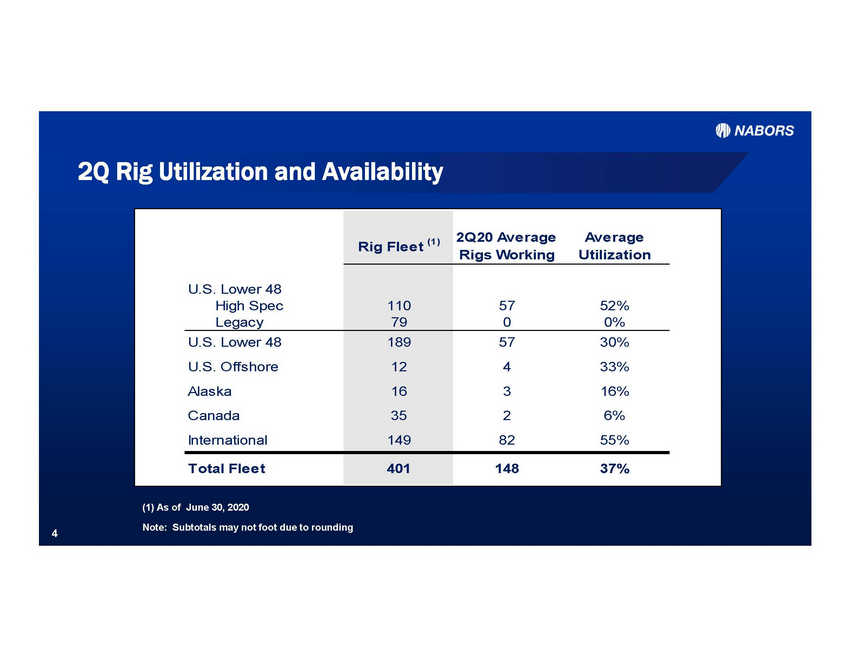 |
2Q Rig Utilization and Availability Rigs Working Utilization (1) As of June 30, 2020 Note: Subtotals may not foot due to rounding 4 U.S. Lower 48 High Spec Legacy Rig Fleet (1) 2Q20 Average Average 110 79 57 52% 0 0% U.S. Lower 48 U.S. Offshore Alaska Canada International 189 12 16 35 149 57 30% 4 33% 3 16% 2 6% 82 55% Total Fleet 401 148 37% |
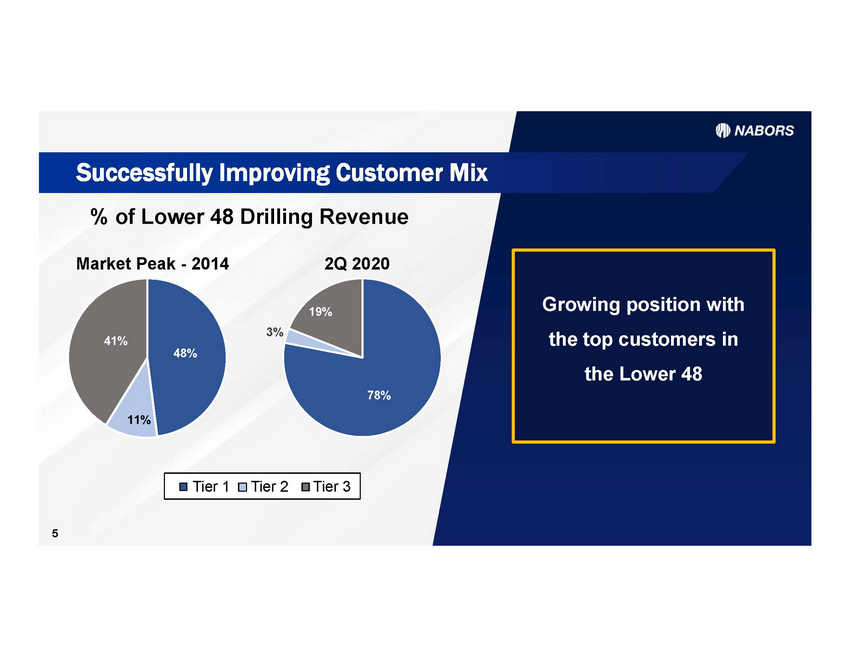 |
Successfully Improving Customer Mix % of Lower 48 Drilling Revenue Market Peak - 2014 2Q 2020 3% 11% 5 Tier 1Tier 2Tier 3 Growing position with the top customers in the Lower 48 |
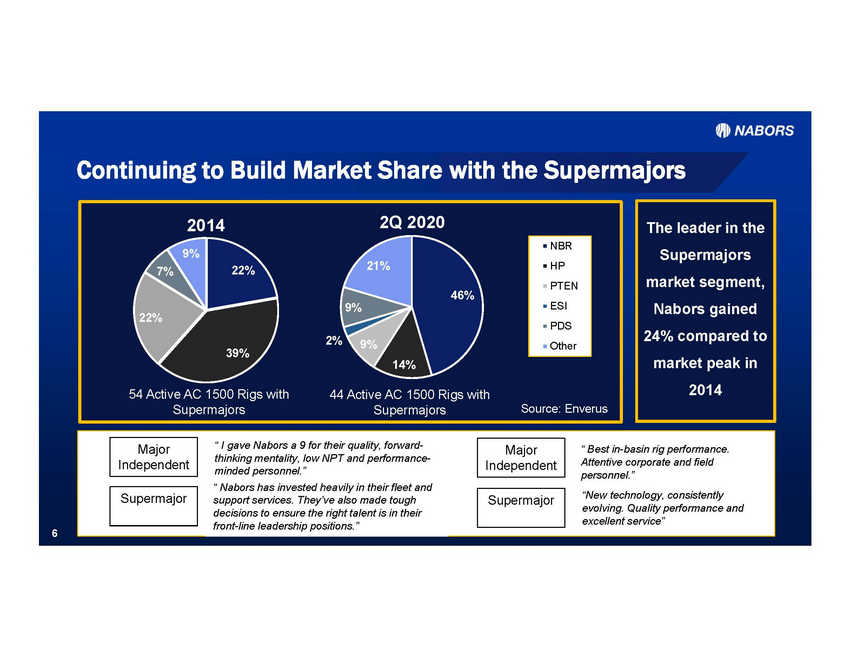 |
Continuing to Build Market Share with the Supermajors thinking mentality, low NPT and performance-Attentive corporate and field “New technology, consistently support services. They’ve also made tough excellent service” front-line leadership positions.” 6 “ I gave Nabors a 9 for their quality, forward-“ Best in-basin rig performance. minded personnel.”personnel.” “ Nabors has invested heavily in their fleet and decisions to ensure the right talent is in theirevolving. Quality performance and Supermajor Supermajor Major Independent Major Independent The leader in the Supermajors market segment, Nabors gained 24% compared to market peak in 2014 20142Q 2020 2% 54 Active AC 1500 Rigs with44 Active AC 1500 Rigs with SupermajorsSupermajorsSource: Enverus NBR HP PTEN ESI PDS Other |
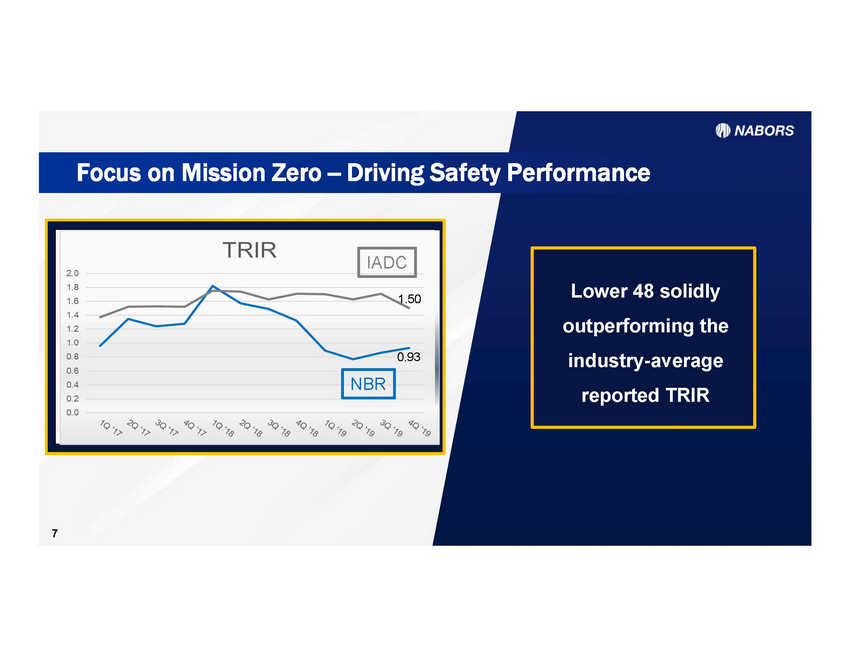 |
Focus on Mission Zero --Driving Safety Performance 7 Lower 48 solidly outperforming the industry-average reported TRIR IADC 1.50 0.93 NBR |
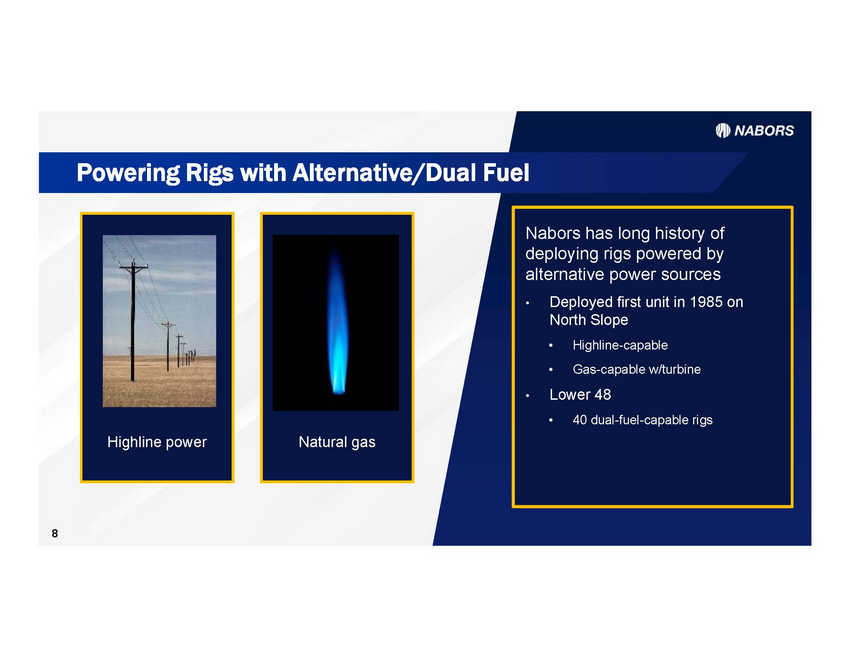 |
Powering Rigs with Alternative/Dual Fuel 8 Highline power Natural gas Nabors has long history of deploying rigs powered by alternative power sources • Deployed first unit in 1985 on North Slope •Highline-capable •Gas-capable w/turbine • Lower 48 •40 dual-fuel-capable rigs |
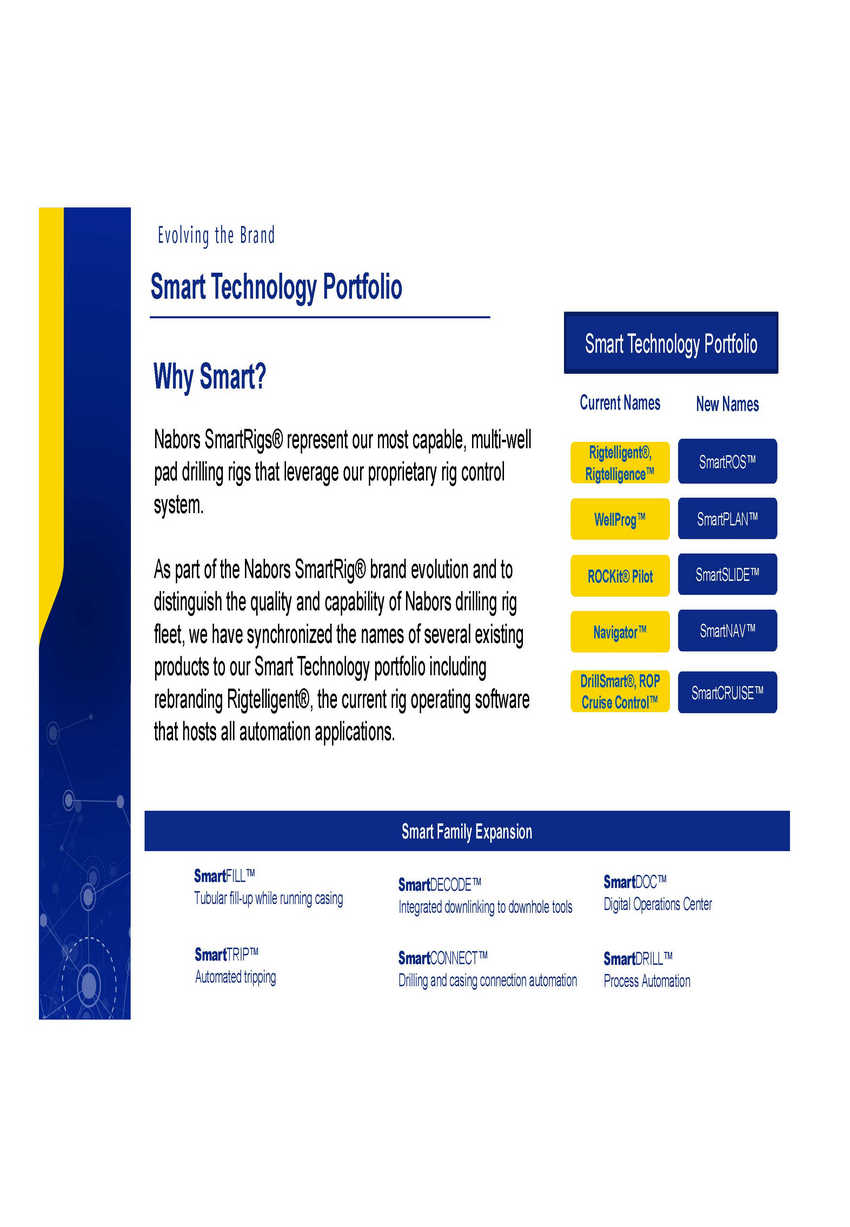 |
Evolving the Brand Smart Technology Portfolio Why Smart? Nabors SmartRigs® represent our most capable, multi-well pad drilling rigs that leverage our proprietary rig control system. Current Names New Names Rigtelligent®, Rigtelligence™ SmartROS™ WellProg™ SmartPLAN™ As part of the Nabors SmartRig® brand evolution and to distinguish the quality and capability of Nabors drilling rig fleet, we have synchronized the names of several existing products to our Smart Technology portfolio including rebranding Rigtelligent®, the current rig operating software that hosts all automation applications. SmartSLIDE™ ROCKit® Pilot Navigator™ SmartNAV™ DrillSmart®, ROP Cruise Control™ SmartCRUISE™ SmartFILL™ Tubular fill-up while running casing SmartDOC™ Digital Operations Center SmartDECODE™ Integrated downlinking to downhole tools SmartTRIP™ Automated tripping SmartCONNECT™ Drilling and casing connection automation SmartDRILL™ Process Automation Smart Family Expansion Smart Technology Portfolio |
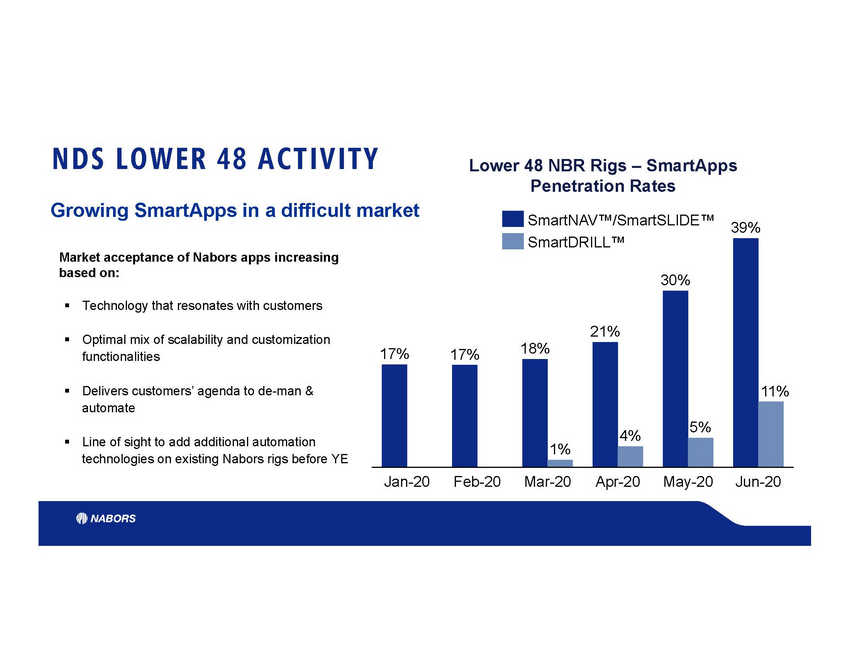 |
NDS LOWER 48 ACTIVITY Lower 48 NBR Rigs – SmartApps Penetration Rates Growing SmartApps in a difficult market SmartNAV™/SmartSLIDE™ 39% Market acceptance of Nabors apps increasing based on: ▪ Technology that resonates with customers ▪ Optimal mix of scalability and customization functionalities Delivers customers’ agenda to de-man & automate 11% ▪ ▪ Line of sight to add additional automation technologies on existing Nabors rigs before YE Jan-20 Feb-20 Mar-20 Apr-20 May-20 Jun-20 SmartDRILL™ 30% 21% 17%17%18% 4%5% 1% |
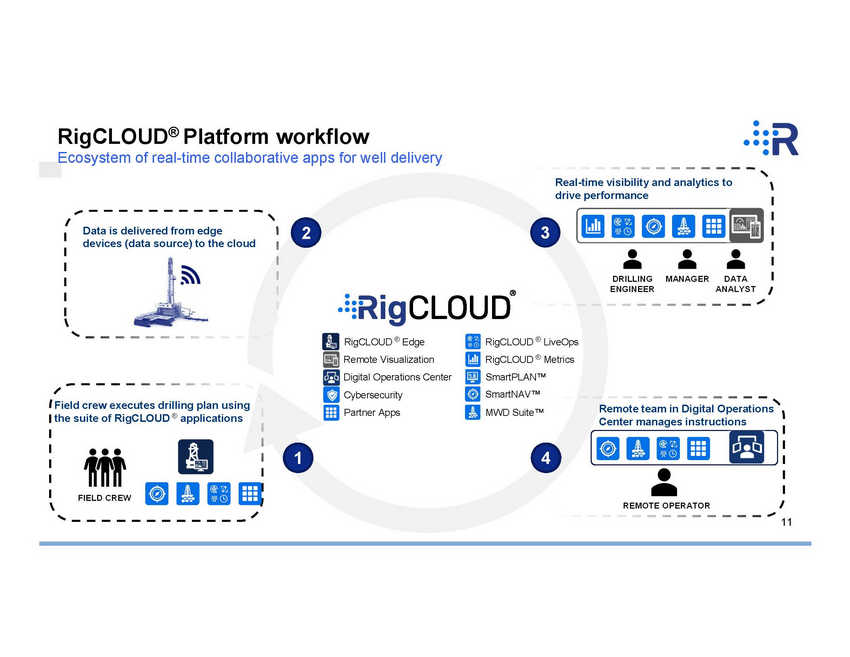 |
RigCLOUD® Platform workflow Ecosystem of real-time collaborative apps for well delivery Real-time visibility and analytics to drive performance 2 3 Data is delivered from edge devices (data source) to the cloud DRILLINGMANAGERDATA ENGINEER ANALYST RigCLOUD ® Edge Remote Visualization Digital Operations Center Cybersecurity Partner Apps RigCLOUD ® LiveOps RigCLOUD ® Metrics SmartPLAN™ SmartNAV™ MWD Suite™ Field crew executes drilling plan using the suite of RigCLOUD ® applications Remote team in Digital Operations Center manages instructions 1 4 FIELD CREW REMOTE OPERATOR 11 |
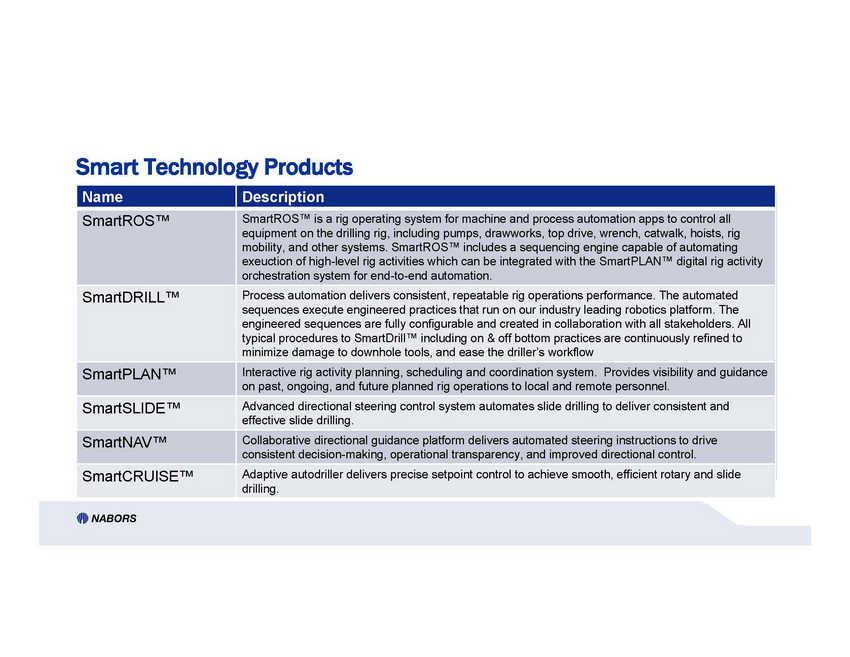 |
Smart Technology Products equipment on the drilling rig, including pumps, drawworks, top drive, wrench, catwalk, hoists, rig sequences execute engineered practices that run on our industry leading robotics platform. The on past, ongoing, and future planned rig operations to local and remote personnel. effective slide drilling. consistent decision-making, operational transparency, and improved directional control. drilling. Name Description SmartROS™ SmartROS™ is a rig operating system for machine and process automation apps to control all mobility, and other systems. SmartROS™ includes a sequencing engine capable of automating exeuction of high-level rig activities which can be integrated with the SmartPLAN™ digital rig activity orchestration system for end-to-end automation. SmartDRILL™ Process automation delivers consistent, repeatable rig operations performance. The automated engineered sequences are fully configurable and created in collaboration with all stakeholders. All typical procedures to SmartDrill™ including on & off bottom practices are continuously refined to minimize damage to downhole tools, and ease the driller’s workflow SmartPLAN™ Interactive rig activity planning, scheduling and coordination system. Provides visibility and guidance SmartSLIDE™ Advanced directional steering control system automates slide drilling to deliver consistent and SmartNAV™ Collaborative directional guidance platform delivers automated steering instructions to drive SmartCRUISE™ Adaptive autodriller delivers precise setpoint control to achieve smooth, efficient rotary and slide |
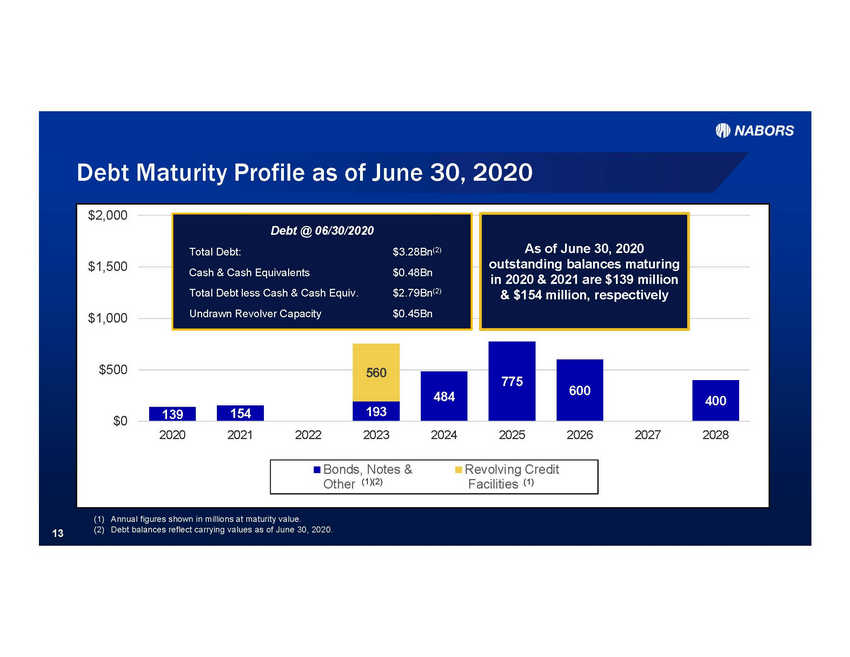 |
Debt Maturity Profile as of June 30, 2020 $2,000 $1,500 $1,000 $500 $0 2020 2021 2022 2023 2024 2025 2026 2027 2028 (1) Annual figures shown in millions at maturity value. (2) Debt balances reflect carrying values as of June 30, 2020. 13 Bonds, Notes &Revolving Credit Other (1)(2)Facilities (1) 560 775 600 484 400 193 139 154 Debt @ 06/30/2020 Total Debt:$3.28Bn(2) Cash & Cash Equivalents$0.48Bn Total Debt less Cash & Cash Equiv.$2.79Bn(2) Undrawn Revolver Capacity$0.45Bn As of June 30, 2020 outstanding balances maturing in 2020 & 2021 are $139 million & $154 million, respectively |