Attached files
| file | filename |
|---|---|
| 8-K - FORM 8-K - McEwen Mining Inc. | tm2025916-1_8k.htm |
Exhibit 99.1
Gold / / Copper Turnaround in Progress NYSE & TSX July 2020 Presentation By: Rob McEwen, Chief Owner & Chairman Peter Mah , Chief Operating Officer Sylvain Guerard, SVP Exploration
MUX Cautionary Statement Risk adverse? Forget about buying our shares. Past performance is unreliable in predicting the future. Unexpected events can happen and can change forecasts. MUX
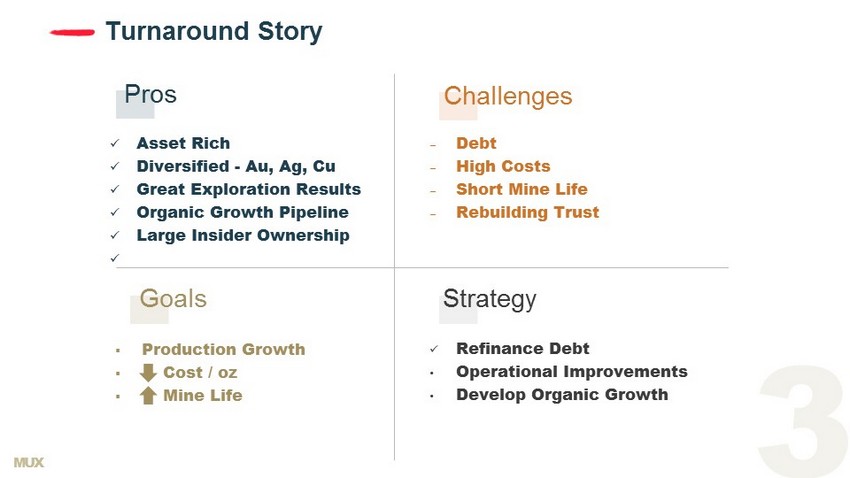
MUX Pros x Asset Rich x Diversified - Au, Ag, Cu x Great Exploration Results x Organic Growth Pipeline x Large Insider Ownership x Challenges - Debt - High Costs - Short Mine Life - Rebuilding Trust Goals ▪ Production Growth ▪ Cost / oz ▪ Mine Life Turnaround Story Strategy x Refinance Debt • Operational Improvements • Develop Organic Growth

MUX MUX’s Portfolio Mines Gold & Silver Development Pipeline Gold & Silver Froome Grey Fox Stock Copper Los Azules Fenix Black Fox Argentina Mexico Nevada Ontario Gold Bar El Gallo San José

MUX Froome 181 koz @ 5.1 g/t Au Production Q4 2021 Grey Fox 888 koz @ 7.1 g/t Au Scoping Study Q4 2020 Stock East: 121 koz @ 1.6 g/t Au Stock West Discovery Fenix Feasibility Study Q4 2020 Timmins, Canada Mexico 1. Resources presented are Measured & Indicated. Please see Appendix for more details. Black Fox Mine 255 koz @ 7.6 g/t Au Gold Bar South Production Q4 2021 Nevada, USA Organic Development Pipeline for Gold & Silver Resources 1 Gold Bar Pick Resource Q3 Reserve Q4
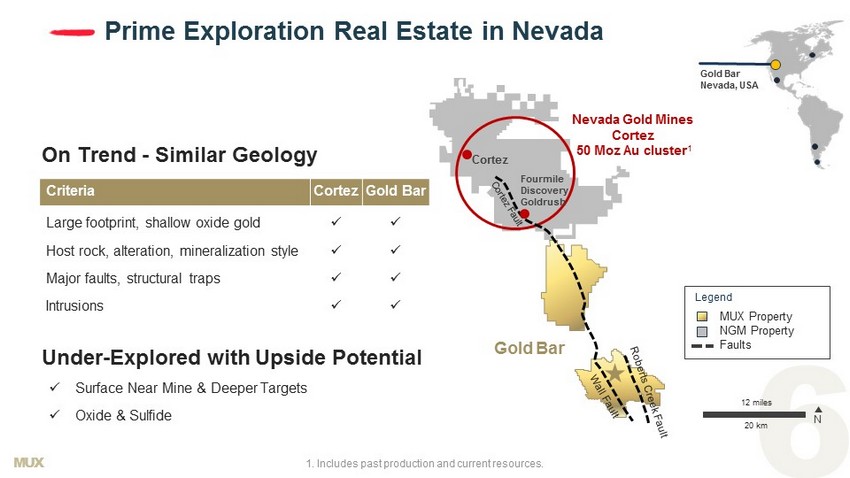
MUX Prime Exploration Real Estate in Nevada Cortez Nevada Gold Mines Cortez 50 Moz Au cluster 1 Fourmile Discovery Goldrush MUX Property NGM Property Faults Gold Bar 20 k m 1 . Includes past production and current resources. Under - Explored with Upside Potential x Surface Near Mine & De eper Targets x Oxide & Sulfide Legend Gold Bar Nevada, USA 12 miles N On Trend - Similar Geology Criteria Cortez Gold Bar Large footprint, shallow oxide gold x x Host rock, alteration, mineralization style x x Major faults, structural traps x x Intrusions x x
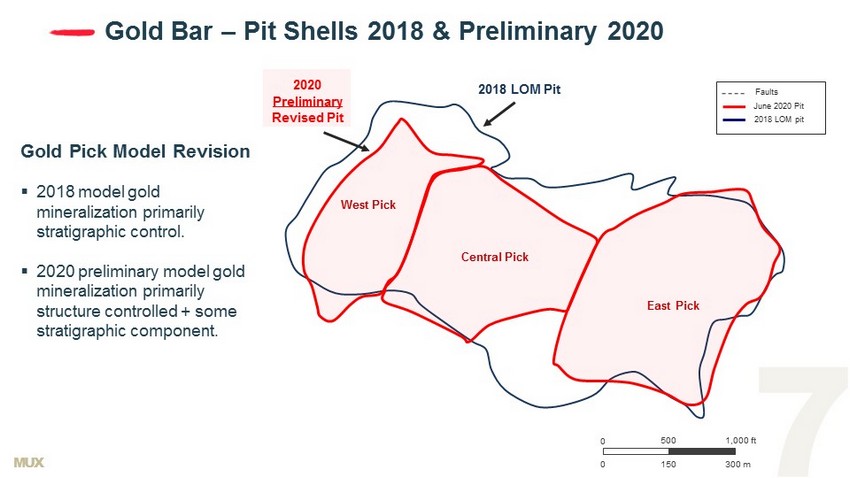
MUX 2018 LOM pit June 2020 Pit Faults Gold Pick Model Revision ▪ 2018 model gold mineralization primarily stratigraphic control. ▪ 2020 preliminary model gold mineralization primarily structure controlled + some stratigraphic component. Gold Bar – Pit Shells 2018 & Preliminary 2020 2018 LOM Pit 2020 Preliminary Revised Pit 0 500 1,000 ft 0 150 300 m West Pick East Pick Central Pick
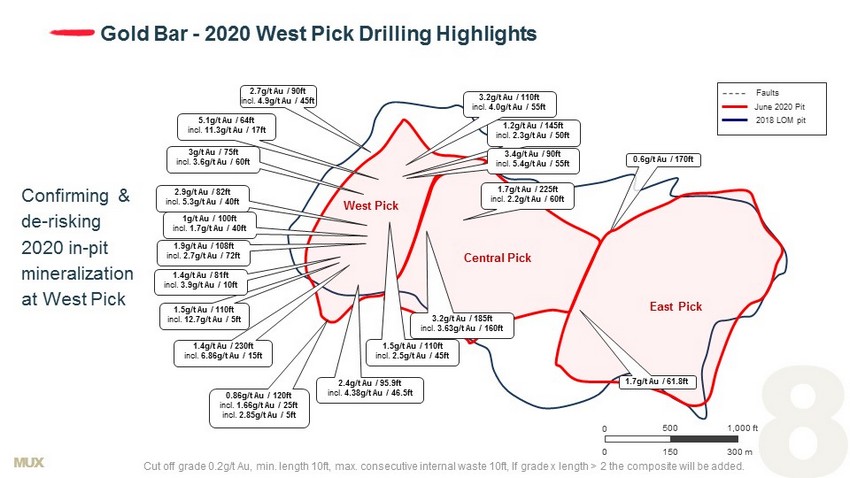
MUX Gold Bar - 2020 West Pick Drilling Highlights 0 500 1,000 ft 0 150 300 m West Pick East Pick Central Pick 2018 LOM pit June 2020 Pit Faults 5.1g/t Au / 64ft incl. 11.3g/t Au / 17ft 2.7g/t Au / 90ft incl. 4.9g/t Au / 45ft 1g/t Au / 100ft incl. 1.7g/t Au / 40ft 2.4g/t Au / 95.9ft incl. 4.38g/t Au / 46.5ft 0.6g/t Au / 170ft 1.9g/t Au / 108ft incl. 2.7g/t Au / 72ft 2.9g/t Au / 82ft incl. 5.3 g/t Au / 40ft 1.4g/t Au / 230ft incl. 6.86g/t Au / 15ft 0.86g/t Au / 120ft incl. 1.66g/t Au / 25ft incl. 2.85g/t Au / 5ft 3.2g/t Au / 185ft incl. 3.63g/t Au / 160ft 1.5g/t Au / 110ft incl. 12.7g/t Au / 5ft 1.5g/t Au / 110ft incl. 2.5g/t Au / 45ft 1.2g/t Au / 145ft incl. 2.3g/t Au / 50ft 1.4g/t Au / 81ft incl. 3.9g/t Au / 10ft 1.7g/t Au / 225ft incl. 2.2g/t Au / 60ft 3.4g/t Au / 90ft incl. 5.4g/t Au / 55ft 3g/t Au / 75ft incl. 3.6g/t Au / 60ft 3.2g/t Au / 110ft incl. 4.0g/t Au / 55ft 1.7g/t Au / 61.8ft C ut off grade 0.2g/t Au, min. length 10ft, max. consecutive internal waste 10ft, If grade x length > 2 the composite will be adde d. . Confirming & de - risking 2020 in - pit mineralization at West Pick

MUX Old Gold Bar Gold Bar - Upside Exploration Near Mine & at Property Scale Gold Bar South Pot Canyon Gold Canyon Cabin Creek Pick ▪ Extensions of known deposits (Gold Bar and Gold Bar South) ▪ Follow - up on positive drill intersections ▪ Deeper targets - “game changer” discovery potential Hunter Taurus Horse Canyon Rutabaga Gold Stone Ridge 6,100 m Gold Bar
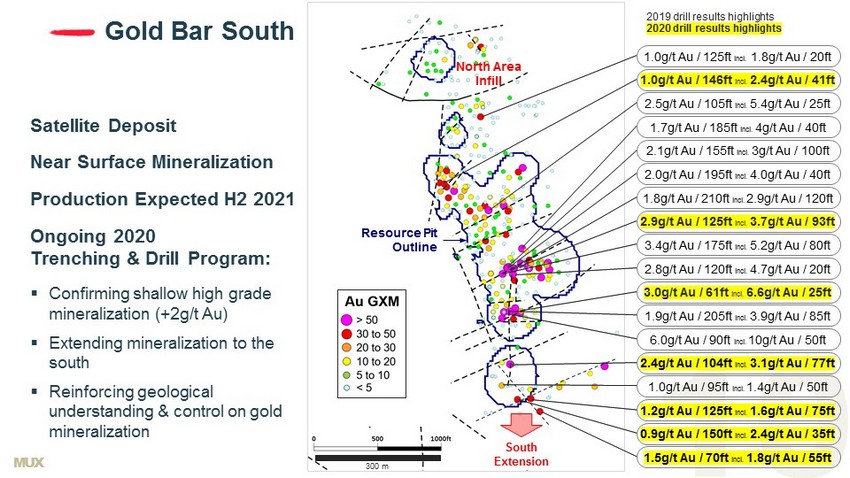
MUX North Area Infill South Extension 300 m Gold Bar South 2019 drill results highlights 2020 drill results highlights Satellite Deposit Near Surface Mineralization Production Expected H2 2021 Ongoing 2020 Trenching & Drill Program: ▪ Confirming shallow high grade mineralization (+2g/t Au) ▪ Extending mineralization to the south ▪ Reinforcing geological understanding & control on gold mineralization 1.0g/t Au / 125ft incl. 1.8g/t Au / 20ft 1.0g/t Au / 146ft incl. 2.4g/t Au / 41ft 2.5g/t Au / 105ft incl. 5.4g/t Au / 25ft 1.7g/t Au / 185ft incl. 4g/ t Au / 40ft 2.1g/t Au / 155ft incl. 3g/t Au / 100ft 1.8g/t Au / 210ft incl. 2.9g/t Au / 120ft 2.0g/t Au / 195ft incl. 4.0g/t Au / 40ft 2.9g/t Au / 125ft incl. 3.7g/t Au / 93ft 2.8g/t Au / 120ft incl. 4.7g/t Au / 20ft 3.4g/t Au / 175ft incl. 5.2g/t Au / 80ft 3.0g/t Au / 61ft incl. 6.6g/t Au / 25ft 1.9g/t Au / 205ft incl. 3.9g/t Au / 85ft 6.0g/t Au / 90ft incl. 10g/t Au / 50ft 2.4g/t Au / 104ft incl. 3.1g/t Au / 77ft 1.0g/t Au / 95ft incl. 1.4g/t Au / 50ft 1.2g/t Au / 125ft incl. 1.6g/t Au / 75ft 0.9g/t Au / 150ft incl. 2.4g/t Au / 35ft 1.5g/t Au / 70ft incl. 1.8g/t Au / 55ft Resource Pit Outline
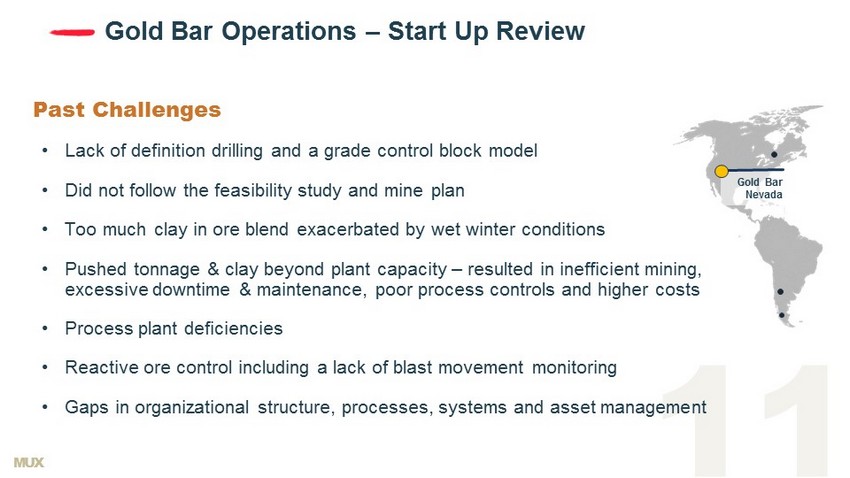
MUX Past Challenges • Lack of definition drilling and a grade control block model • Did not follow the feasibility study and mine plan • Too much clay in ore blend exacerbated by wet winter conditions • Pushed tonnage & clay beyond plant capacity – resulted in inefficient mining, excessive downtime & maintenance, poor process controls and higher costs • Process plant deficiencies • Reactive ore control including a lack of blast movement monitoring • Gaps in organizational structure, processes, systems and asset management Gold Bar Operations – Start Up Review Gold Bar Nevada
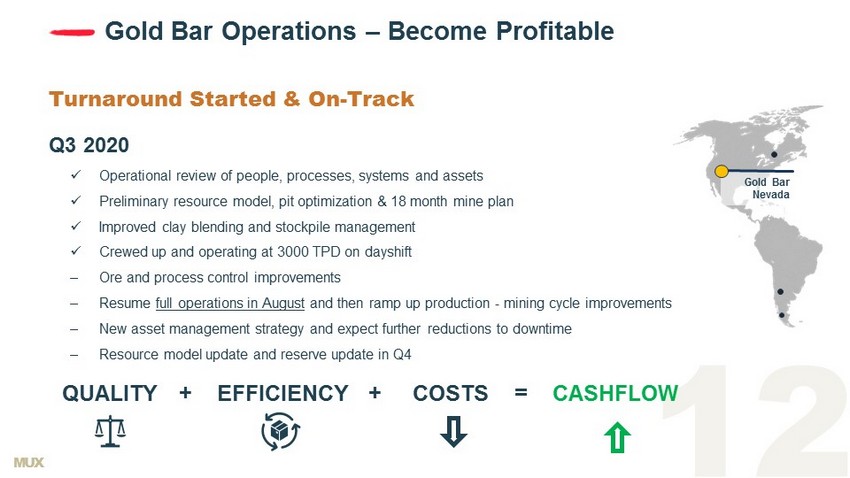
MUX Gold Bar Operations – Become Profitable Turnaround Started & On - Track Q3 2020 x Operational review of people, processes, systems and assets x Preliminary resource model, pit optimization & 18 month mine plan x Improved clay blending and stockpile management x Crewed up and operating at 3000 TPD on dayshift – Ore and process control improvements – Resume full operations in August and then ramp up production - mining cycle improvements – New asset management strategy and expect further reductions to downtime – Resource model update and reserve update in Q4 QUALITY + EFFICIENCY + COSTS = CASHFLOW Gold Bar Nevada
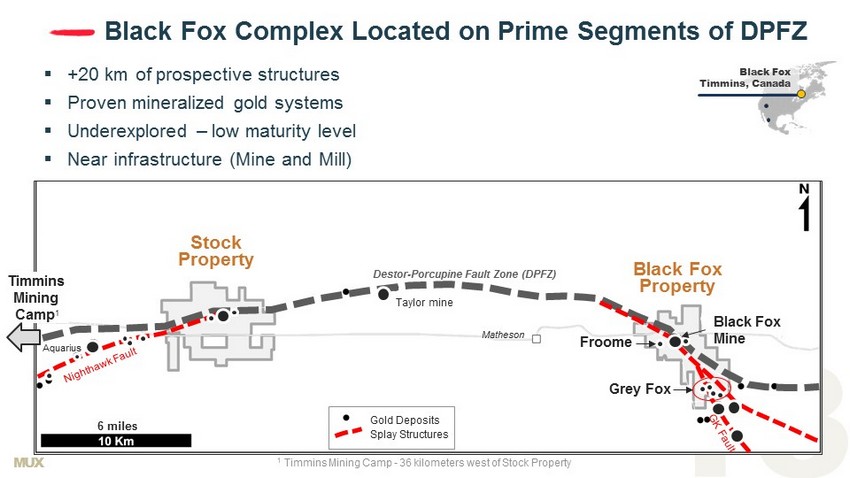
MUX ▪ +20 km of prospective structures ▪ Proven mineralized gold systems ▪ Underexplored – low maturity level ▪ Near infrastructure (Mine and Mill) Black Fox Complex Located on Prime Segments of DPFZ Black Fox Timmins, Canada Taylor mine Aquarius Matheson Destor - Porcupine Fault Zone (DPFZ) Grey Fox Stock Property Froome Timmins Mining Camp 1 Gold Deposits Splay Structures Black Fox Property Black Fox Mine 1 Timmins Mining Camp - 36 kilometers west of Stock Property 6 miles
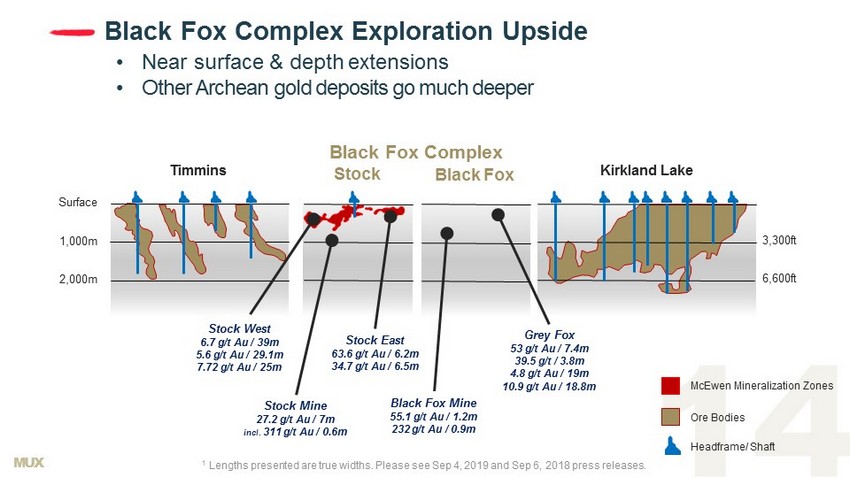
MUX 1 Lengths presented are true widths. Please see Sep 4, 2019 and Sep 6, 2018 press releases. Ore Bodies McEwen Mineralization Zones Stock Mine 27.2 g/t Au / 7m incl. 311 g/t Au / 0.6m Black Fox Mine 55.1 g/t Au / 1.2m 232 g/t Au / 0.9m Black Fox Complex Kirkland Lake Timmins 1,000m 2,000m Surface 3,300ft 6,600ft Stock West 6.7 g/t Au / 39m 5.6 g/t Au / 29.1m 7.72 g/t Au / 25m Stock East 63.6 g/t Au / 6.2m 34.7 g/t Au / 6.5m Grey Fox 53 g/t Au / 7.4m 39.5 g/t / 3.8m 4.8 g/t Au / 19m 10.9 g/t Au / 18.8m Stock Black Fox Black Fox Complex Exploration Upside • Near surface & depth extensions • Other Archean gold deposits go much deeper Headframe/ Shaft
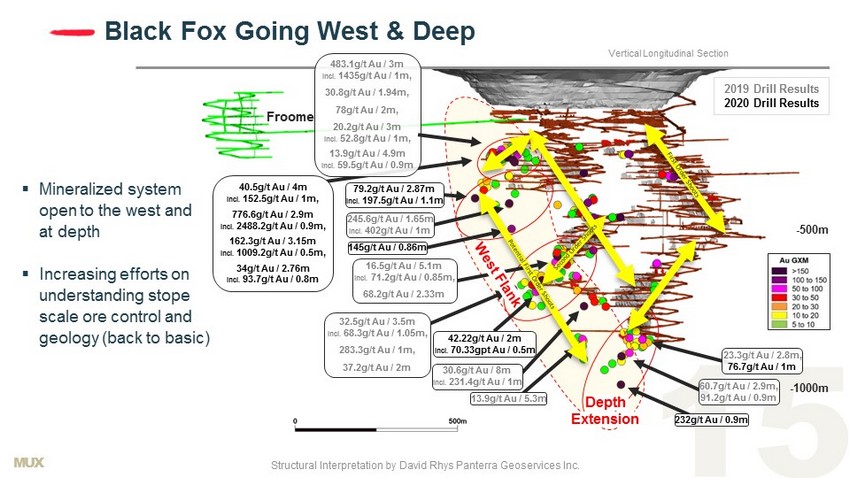
MUX Structural Interpretation by David Rhys Panterra Geoservices Inc. Black Fox Going West & Deep Vertical Longitudinal Section - 500m - 1000m Froome 232g/t Au / 0.9m 60.7g/t Au / 2.9m, 91.2g/t Au / 0.9m 23.3g/t Au / 2.8m, 76.7g/t Au / 1m 13.9g/t Au / 5.3m 30.6g/t Au / 8m incl. 231.4g/t Au / 1m 32.5g/t Au / 3.5m incl. 68.3g/t Au / 1.05m, 283.3g/t Au / 1m, 37.2g/t Au / 2m 16.5g /t Au / 5.1m incl. 71.2g/t Au / 0.85m, 68.2g/t Au / 2.33m 145g/t Au / 0.86m 245.6g/t Au / 1.65m incl. 402g/t Au / 1m 79.2g/t Au / 2.87m incl. 197.5g/t Au / 1.1m 40.5g/t Au / 4m incl. 152.5g/t Au / 1m, 776.6g/t Au / 2.9m incl. 2488.2g/t Au / 0.9m, 162.3g/t Au / 3.15m incl. 1009.2g/t Au / 0.5m, 34g/t Au / 2.76m incl. 93.7g/t Au / 0.8m 483.1g/t Au / 3m incl. 1435g/t Au / 1m, 30.8g/t Au / 1.94m, 78g/t Au / 2m, 20.2g/t Au / 3m incl. 52.8g/t Au / 1m, 13.9g/t Au / 4.9m incl. 59.5g/t Au / 0.9m 2019 Drill Results 2020 Drill Results Depth Extension 42.22g/t Au / 2m incl. 70.33gpt Au / 0.5m ▪ Mineralized system open to the west and at depth ▪ Increasing efforts on understanding stope scale ore control and geology (back to basic)

MUX Black Fox Complex Expansion Strategy 1 Grey Fox Stock Froome Production Growth Target +100 Koz / Year to Leverage Stock Mill Capacity Black Fox Mine - Current 2020 Improve & Sustain Production 2021 Near Term Production 2022 - 2023 Growth & LOM Exploration Discovery Contributing to Blue - Sky Growth Potential 1 Based on existing 1.5 Moz Measured & Indicated Resource.
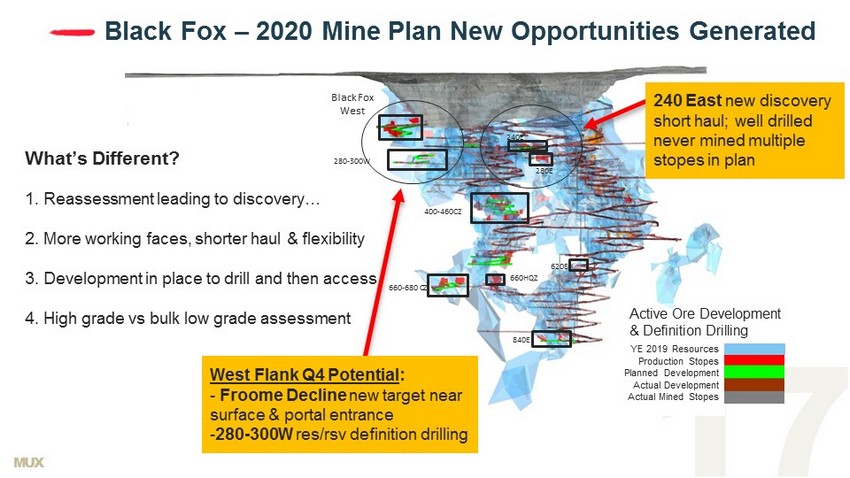
MUX 840E 660HQZ 660 - 680 CZ 400 - 460CZ Black Fox West 280 - 300W 280E 240E 620E YE 2019 Resources Production Stopes Planned Development Actual Development Actual Mined Stopes Black Fox – 2020 Mine Plan New Opportunities Generated Active Ore Development & Definition Drilling What’s Different? 1. Reassessment leading to discovery… 2. More working faces, shorter haul & flexibility 3. Development in place to drill and then access 4. High grade vs bulk low grade assessment West Flank Q4 Potential : - Froome Decline new target near surface & portal entrance - 280 - 300W res/ rsv definition drilling 240 East new discovery short haul; well drilled never mined multiple stopes in plan

MUX Froome Twin Ramp Access – Average 30% Complete ON TARGET EXPECT FIRST ORE Q2 2021 Black Fox Pit North Actual 375m Actual 262m Ventilation Ramp Remaining 637m Haulage Ramp Remaining 718m Haulage Ramp 27% Complete Ventilation Ramp 37% Complete July 15 th Actual Plan View Pit bottom Transverse & longitudinal stope development light green
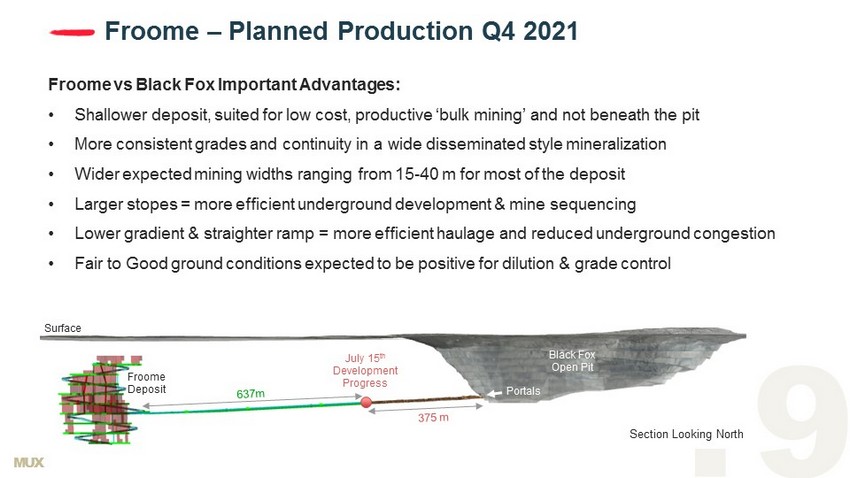
MUX Froome – Planned Production Q4 2021 Froome vs Black Fox Important Advantages: • Shallower deposit, suited for low cost, productive ‘bulk mining’ and not beneath the pit • More consistent grades and continuity in a wide disseminated style mineralization • Wider expected mining widths ranging from 15 - 40 m for most of the deposit • Larger stopes = more efficient underground development & mine sequencing • Lower gradient & straighter ramp = more efficient haulage and reduced underground congestion • Fair to Good ground conditions expected to be positive for dilution & grade control Section Looking North July 15 th Development Progress Portals Black Fox Open Pit Surface Froome Deposit
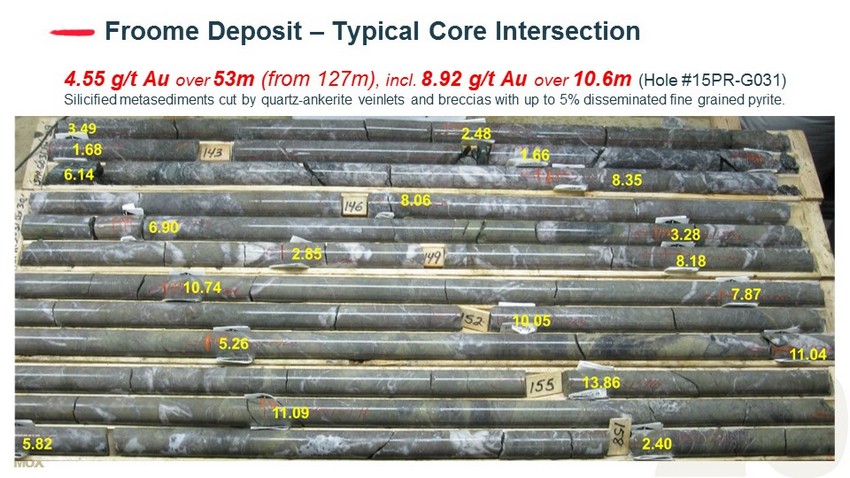
MUX Froome Deposit – Typical Core Intersection 4.55 g/t Au over 53m (from 127m) , incl. 8.92 g/t Au over 10.6m (Hole # 15PR - G031 ) Silicified metasediments cut by quartz - ankerite veinlets and breccias with up to 5% disseminated fine grained pyrite.
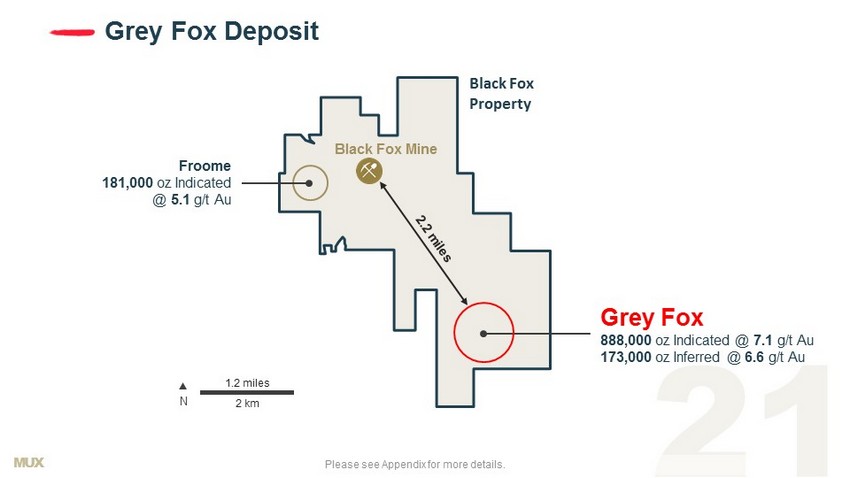
MUX 2 km 1.2 miles N Please see Appendix for more details. Grey Fox Deposit Black Fox Mine Froome 181,000 oz Indicated @ 5.1 g/t Au Grey Fox 888,000 oz Indicated @ 7.1 g/t Au 173,000 oz Inferred @ 6.6 g/t Au Black Fox Property
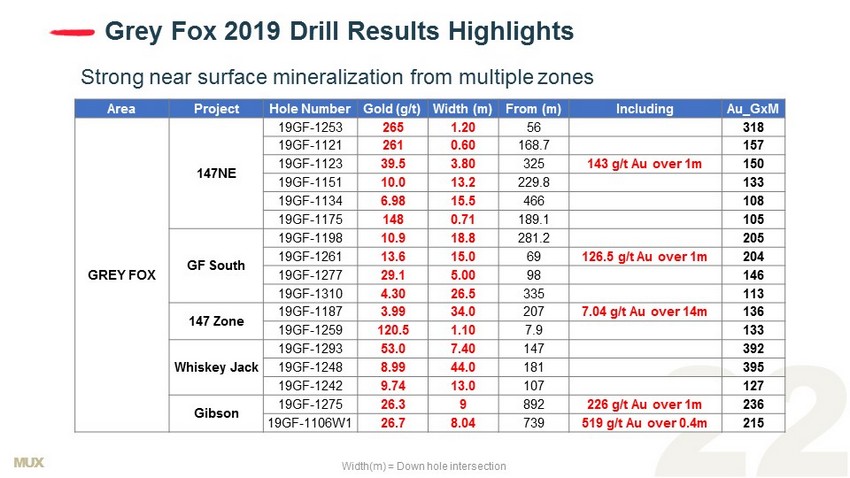
MUX Area Project Hole Number Gold (g/t) Width (m) From (m) Including Au_GxM GREY FOX 147NE 19GF - 1253 265 1.20 56 318 19GF - 1121 261 0.60 168.7 157 19GF - 1123 39.5 3.80 325 143 g/t Au over 1m 150 19GF - 1151 10.0 13.2 229.8 133 19GF - 1134 6.98 15.5 466 108 19GF - 1175 148 0.71 189.1 105 GF South 19GF - 1198 10.9 18.8 281.2 205 19GF - 1261 13.6 15.0 69 126.5 g/t Au over 1m 204 19GF - 1277 29.1 5.00 98 146 19GF - 1310 4.30 26.5 335 113 147 Zone 19GF - 1187 3.99 34.0 207 7.04 g/t Au over 14m 136 19GF - 1259 120.5 1.10 7.9 133 Whiskey Jack 19GF - 1293 53.0 7.40 147 392 19GF - 1248 8.99 44.0 181 395 19GF - 1242 9.74 13.0 107 127 Gibson 19GF - 1275 26.3 9 892 226 g/t Au over 1m 236 19GF - 1106W1 26.7 8.04 739 519 g/t Au over 0.4m 215 Grey Fox 2019 Drill Results Highlights Strong near surface mineralization from multiple zones Width(m) = Down hole intersection
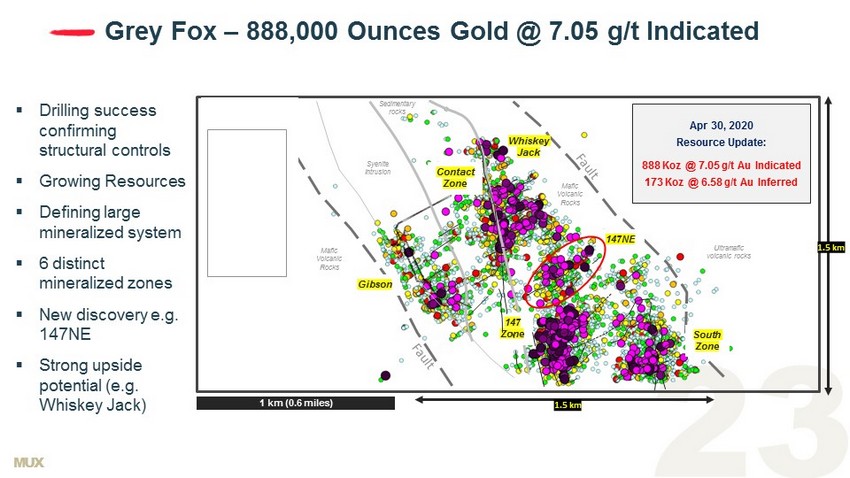
MUX 1 km (0.6 miles) 1.5 km 1.5 km Sedimentary rocks Syenite Intrusion Mafic Volcanic Rocks Mafic Volcanic Rocks 147 Zone Contact Zone Gibson South Zone 147NE Whiskey Jack Apr 30, 2020 Resource Update: 888 Koz @ 7.05 g/t Au Indicated 173 Koz @ 6.58 g/t Au Inferred Ultramafic volcanic rocks Grey Fox – 888,000 Ounces Gold @ 7.05 g/t Indicated ▪ Drilling success confirming structural controls ▪ Growing Resources ▪ Defining large mineralized system ▪ 6 distinct mineralized zones ▪ New discovery e.g. 147NE ▪ Strong upside potential (e.g. Whiskey Jack)
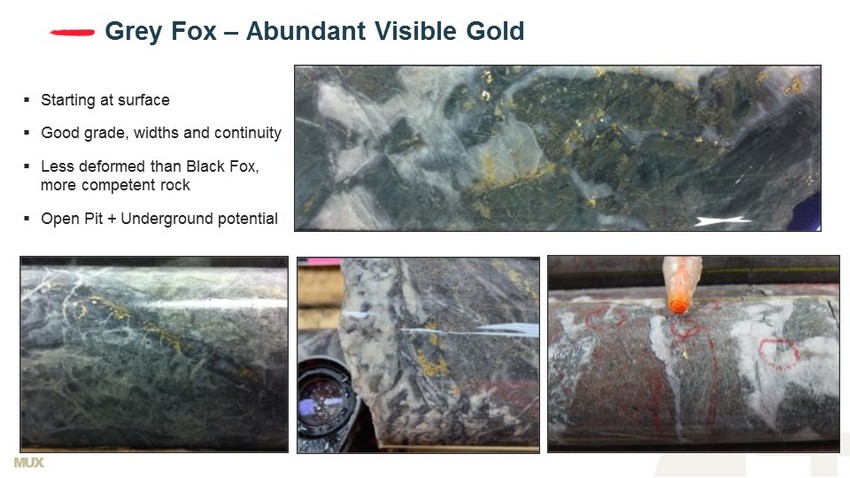
MUX Grey Fox – Abundant Visible Gold ▪ Starting at surface ▪ Good grade, widths and continuity ▪ Less deformed than Black Fox, more competent rock ▪ Open Pit + Underground potential
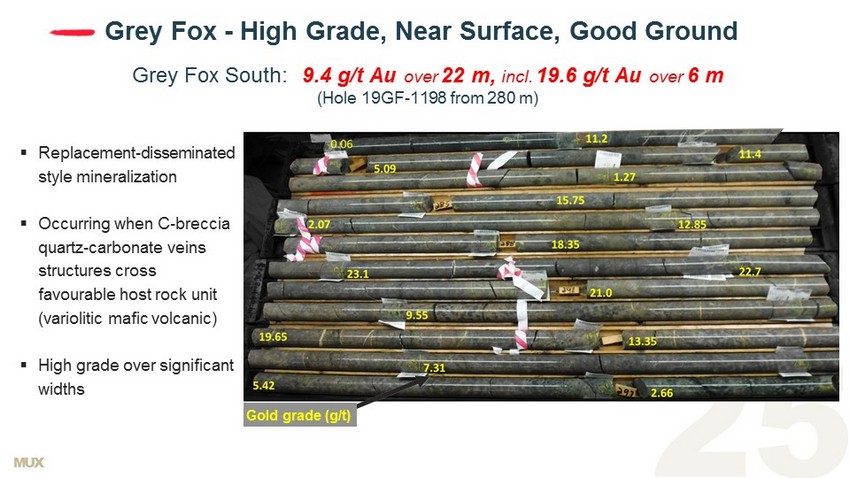
MUX Grey Fox - High Grade, Near Surface, Good Ground Grey Fox South: 9.4 g/t Au over 22 m, incl. 19.6 g/t Au over 6 m (Hole 19GF - 1198 from 280 m) ▪ Replacement - disseminated style mineralization ▪ Occurring when C - breccia quartz - carbonate veins structures cross favourable host rock unit (variolitic mafic volcanic) ▪ High grade over significant widths Gold grade (g/t)
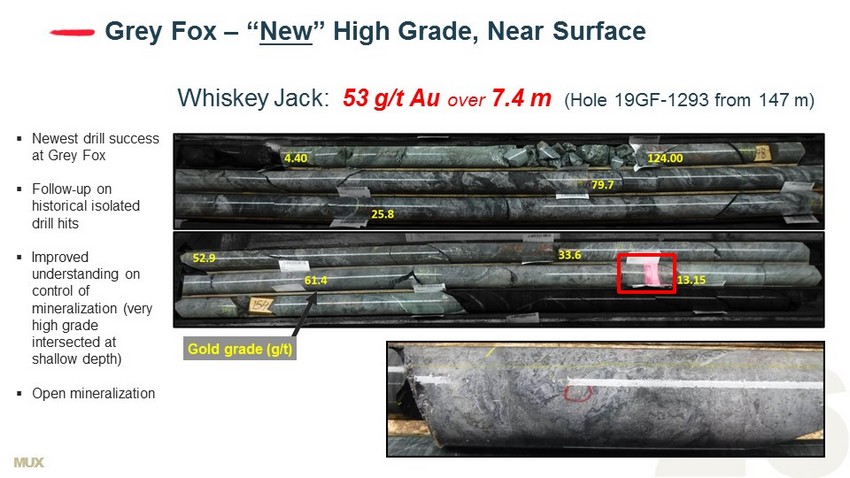
MUX Whiskey Jack: 53 g/t Au over 7.4 m (Hole 19GF - 1293 from 147 m) Grey Fox – “ New ” High Grade, Near Surface Gold grade (g/t) ▪ Newest drill success at Grey Fox ▪ Follow - up on historical isolated drill hits ▪ Improved understanding on control of mineralization (very high grade intersected at shallow depth) ▪ Open mineralization
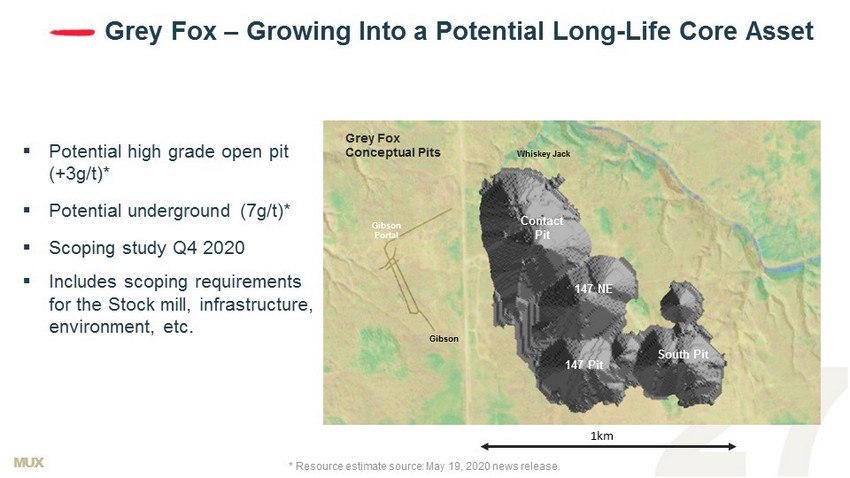
MUX Gibson Portal 147 NE Contact Pit 147 Pit Gibson South Pit 1km Whiskey Jack NORTH ▪ Potential high grade open pit (+3g/t)* ▪ Potential underground (7g/t)* ▪ Scoping study Q4 2020 ▪ Includes scoping requirements for the Stock mill, infrastructure, environment, etc. Grey Fox – Growing Into a Potential L ong - Life Core Asset Grey Fox Conceptual Pits * Resource estimate source: May 19, 2020 news release.
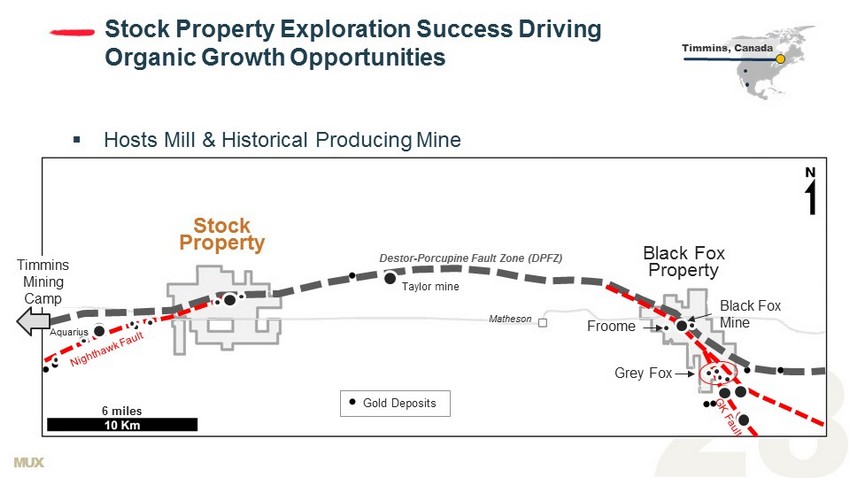
MUX Stock Property Exploration Success Driving Organic Growth Opportunities Timmins, Canada Taylor mine Aquarius Matheson Destor - Porcupine Fault Zone (DPFZ) Grey Fox Stock Property Froome Timmins Mining Camp Gold Deposits Black Fox Property Black Fox Mine ▪ Hosts Mill & Historical Producing Mine 6 miles
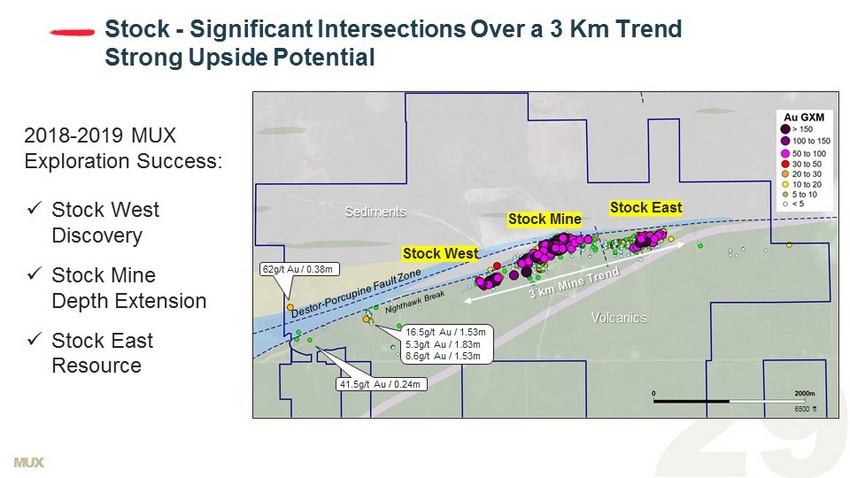
MUX 2018 - 2019 MUX Exploration Success: Stock - Significant Intersections Over a 3 Km Trend Strong Upside Potential 62g/t Au / 0.38m 41.5g/t Au / 0.24m 16.5g/t Au / 1.53m 5.3g/t Au / 1.83m 8.6g/t Au / 1.53m Sediments Volcanics Stock West Stock Mine Stock East 6500 ft x Stock West Discovery x Stock Mine Depth Extension x Stock East Resource
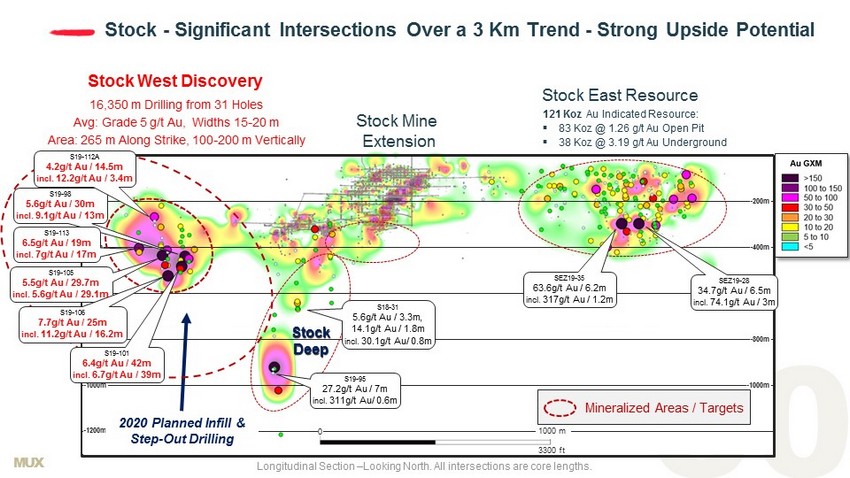
MUX - 200m - 400m - 600m - 800m - 1000m - 1200m - 200m - 400m - 600m - 800m - 1000m Stock - Significant Intersections Over a 3 Km Trend - Strong Upside Potential Stock West Discovery Stock Mine Extension Stock East Resource 1000 m 0 16,350 m Drilling from 31 Holes Avg: Grade 5 g/t Au, Widths 15 - 20 m Area: 265 m Along Strike, 100 - 200 m Vertically 2020 Planned Infill & Step - Out Drilling Mineralized Areas / Targets Stock Deep S19 - 95 27.2g/t Au / 7m incl. 311g/t Au/ 0.6m S18 - 31 5.6g/t Au / 3.3m, 14.1g/t Au / 1.8m incl. 30.1g/t Au/ 0.8m SEZ19 - 28 34.7g/t Au / 6.5m incl. 74.1g/t Au / 3m SEZ19 - 35 63.6g/t Au / 6.2m incl. 317g/t Au / 1.2m 121 Koz Au Indicated Resource: ▪ 83 Koz @ 1.26 g/t Au Open Pit ▪ 38 Koz @ 3.19 g/t Au Underground S19 - 98 5.6g/t Au / 30m incl. 9.1g/t Au / 13m S19 - 105 5.5g/t Au / 29.7m incl. 5.6g/t Au / 29.1m S19 - 106 7.7g/t Au / 25m incl. 11.2g/t Au / 16.2m S19 - 113 6.5g/t Au / 19m incl. 7g/t Au / 17m S19 - 112A 4.2g/t Au / 14.5m incl. 12.2g/t Au / 3.4m S19 - 101 6.4g/t Au / 42m incl. 6.7g/t Au / 39m Longitudinal Section – Looking North. All intersections are core lengths. 3300 ft
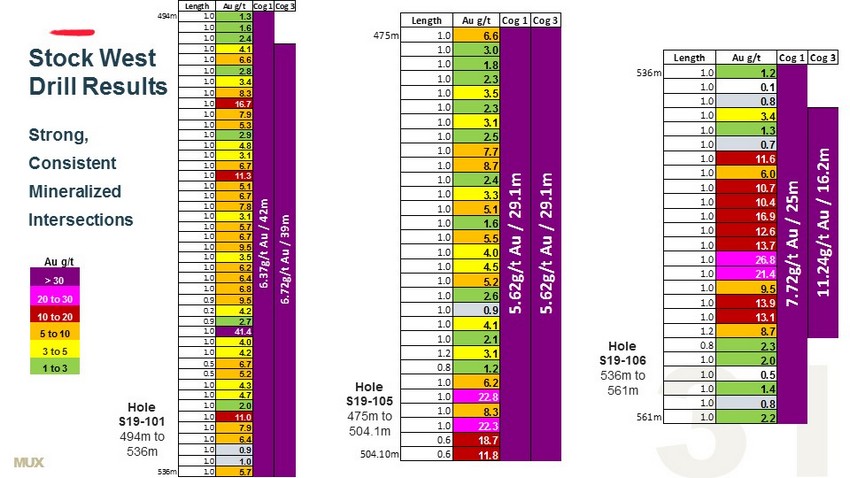
MUX Strong, Consistent Mineralized Intersections Length Au g/t Cog 1Cog 3 475m 1.0 6.6 1.0 3.0 1.0 1.8 1.0 2.3 1.0 3.5 1.0 2.3 1.0 3.1 1.0 2.5 1.0 7.7 1.0 8.7 1.0 2.4 1.0 3.3 1.0 5.1 1.0 1.6 1.0 5.5 1.0 4.0 1.0 4.5 1.0 5.2 1.0 2.6 1.0 0.9 1.0 4.1 1.0 2.1 1.2 3.1 0.8 1.2 1.0 6.2 1.0 22.8 1.0 8.3 1.0 22.3 0.6 18.7 504.10m 0.6 11.8 5.62g/t Au / 29.1m5.62g/t Au / 29.1m Length Au g/t Cog 1Cog 3 536m 1.0 1.2 1.0 0.1 1.0 0.8 1.0 3.4 1.0 1.3 1.0 0.7 1.0 11.6 1.0 6.0 1.0 10.7 1.0 10.4 1.0 16.9 1.0 12.6 1.0 13.7 1.0 26.8 1.0 21.4 1.0 9.5 1.0 13.9 1.0 13.1 1.2 8.7 0.8 2.3 1.0 2.0 1.0 0.5 1.0 1.4 1.0 0.8 561m 1.0 2.2 7.72g/t Au / 25m 11.24g/t Au / 16.2m Hole S19 - 106 536m to 561m Hole S19 - 101 494m to 536m Length Au g/t Cog 1Cog 3 494m 1.0 1.3 1.0 1.6 1.0 2.4 1.0 4.1 1.0 6.6 1.0 2.8 1.0 3.4 1.0 8.3 1.0 16.7 1.0 7.9 1.0 5.3 1.0 2.9 1.0 4.8 1.0 3.1 1.0 6.7 1.0 11.3 1.0 5.1 1.0 6.7 1.0 7.8 1.0 3.1 1.0 5.7 1.0 6.7 1.0 9.5 1.0 3.5 1.0 6.2 1.0 6.4 1.0 6.8 0.9 9.5 0.2 4.2 0.9 2.7 1.0 41.4 1.0 4.0 1.0 4.2 0.5 6.7 0.5 5.2 1.0 4.3 1.0 4.7 1.0 2.0 1.0 11.0 1.0 7.9 1.0 6.4 1.0 0.9 1.0 1.0 536m 1.0 5.7 6.37g/t Au / 42m 6.72g/t Au / 39m Hole S19 - 105 475m to 504.1m Stock West Drill Results Au g/t > 30 20 to 30 10 to 20 5 to 10 3 to 5 1 to 3
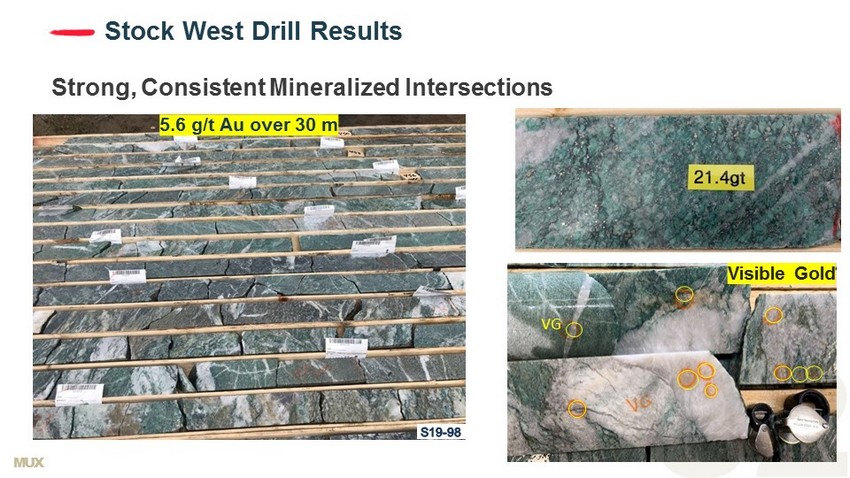
MUX 5.6 g/t Au over 30 m Stock West Drill Results Strong, Consistent Mineralized Intersections Visible Gold VG
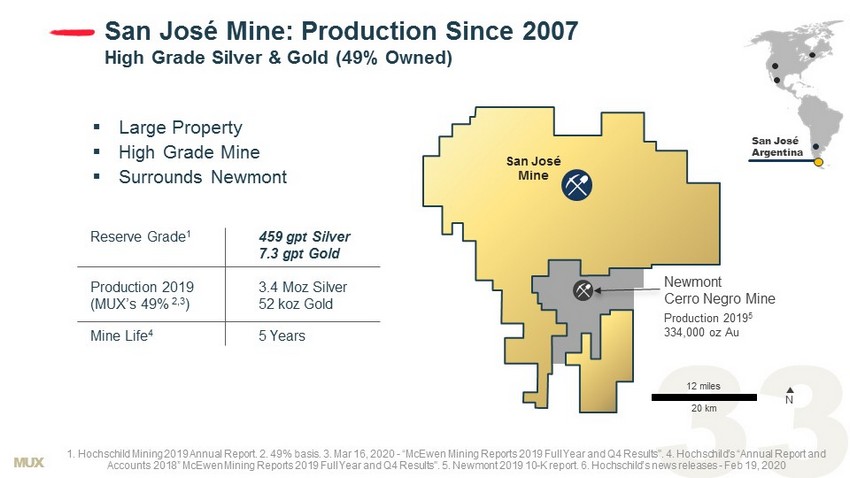
MUX 1. Hochschild Mining 2019 Annual Report. 2. 49% basis. 3. Mar 16, 2020 - “McEwen Mining Reports 2019 Full Year and Q4 Results". 4. Hochschild’s “Annual Report and Accounts 2018” McEwen Mining Reports 2019 Full Year and Q4 Results". 5. Newmont 2019 10 - K report. 6. Hochschild’s news releases - Feb 19, 2020 San José Mine N Production 2019 5 334,000 oz Au 20 k m Newmont Cerro Negro Mine Reserve Grade 1 Production 2019 (MUX’s 49% 2,3 ) Mine Life 4 459 gpt Silver 7.3 gpt Gold 3.4 Moz Silver 52 koz Gold 5 Years 12 miles San José Mine: Production Since 2007 High Grade Silver & Gold (49% Owned) ▪ Large Property ▪ High Grade Mine ▪ Surrounds Newmont San José Argentina

MUX Tonnes Copper Gold Silver Indicated: 962 Million 10.2 Billion lbs @ 0.48% 1.7 Million oz @ 0.06 gpt 55.7 Million oz @ 1.8 gpt Inferred: 2,666 Million 19.3 Billion l bs @ 0.33% 3.8 Million O z @ 0.04 gpt 135.4 Million Oz @ 1.6 gpt Source: Oct 16, 2017 – “NI 43 - 101 Technical Report - Preliminary Economic Assessment Update for the Los Azules Project, Argentina”. Drill Intersections Highlights: 221 m (725 ft) @ 1.62% Cu 200 m (656 ft) @ 0.89% Cu 240 m (787 ft) @ 0.94% Cu 360 m (1,181 ft) @ 0.63% Cu 429 m (1,470 ft) @ 0.75% Cu Los Azules Argentina Significant Optionality to Copper Los Azules : De - Risking

MUX Los Azules - Robust @ $3/lb Copper Highlights PEA 2017 (Hatch) Oct 16, 2017 – “NI 43 - 101 Technical Report - Preliminary Economic Assessment Update for the Los Azules Project, Argentina”. Initial Capex Payback Mine Life After - Tax IRR After - Tax NPV @ 8% Avg. Annual Production 1st 13 Years $2.4 Billion 3.6 Years 36 Years 20% $2.2 Billion 415 Million lbs Cu @ cash cost $1.14/lb + Au & Ag credits
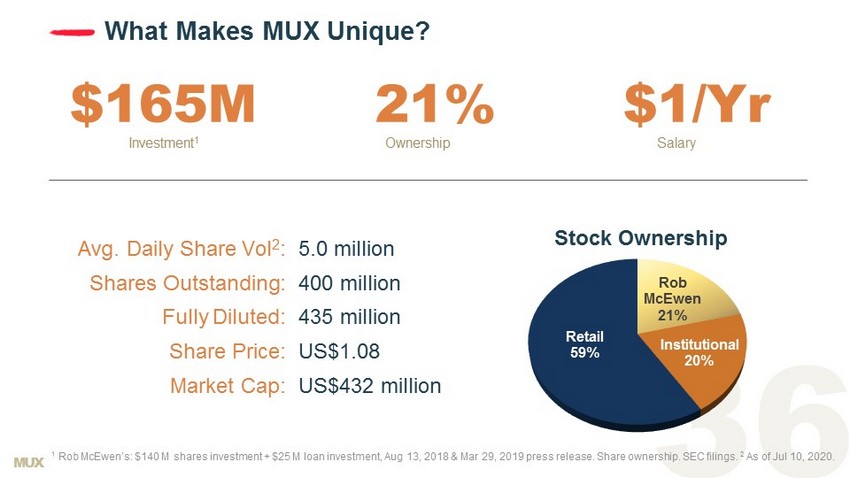
MUX What Makes MUX Unique? $16 5 M 2 1 % $1/ Y r Investment 1 Ownership Salary Avg. Daily Share Vol 2 : Shares Outstanding: Fully Diluted: Share Price: Market Cap : 5.0 million 400 million 435 million US$ 1.08 US$ 432 million Rob McEwen 21% Institutional 20% Retail 59% Stock Ownership 1 Rob McEwen’s: $1 40 M shares investment + $25 M loan investment, Aug 13, 2018 & Mar 29, 2019 press release. Share ownership. SEC filings. 2 As of Jul 10, 2020.
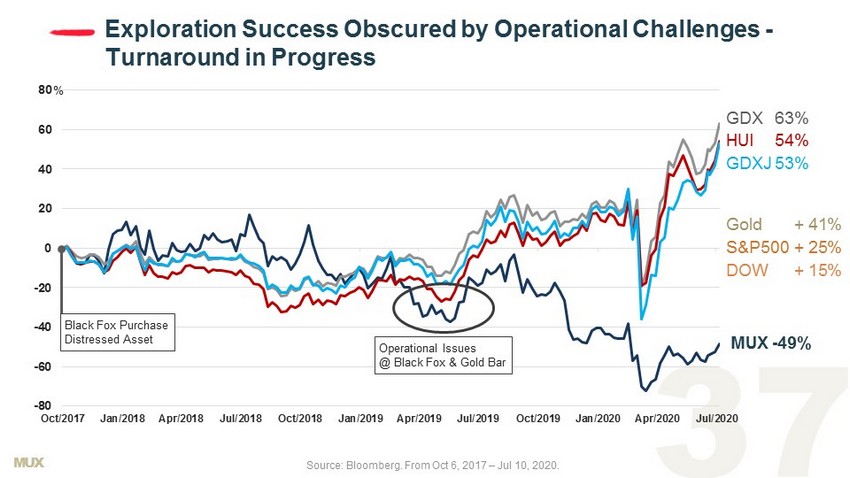
MUX -80 -60 -40 -20 0 20 40 60 80 Oct/2017 Jan/2018 Apr/2018 Jul/2018 Oct/2018 Jan/2019 Apr/2019 Jul/2019 Oct/2019 Jan/2020 Apr/2020 Jul/2020 Exploration Success Obscured by Operational Challenges - Turnaround in Progress % MUX - 49% Source: Bloomberg. From Oct 6, 2017 – Jul 10 , 20 20 . Operational Issues @ Black Fox & Gold Bar GDX 63% HUI 54% GDXJ 53% Gold + 41% S&P500 + 25% DOW + 15% Black Fox Purchase Distressed Asset
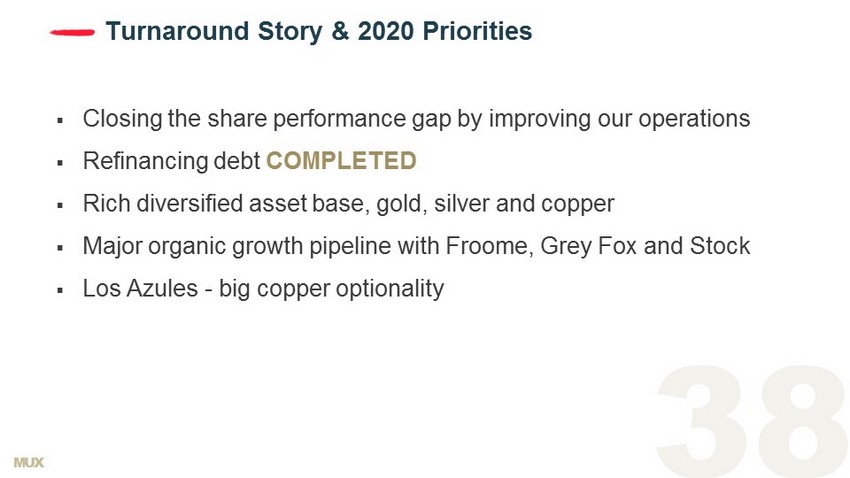
MUX ▪ Closing the share performance gap by improving our operations ▪ Refinancing debt COMPLETED ▪ Rich diversified asset base, gold, silver and copper ▪ Major organic growth pipeline with Froome , Grey Fox and Stock ▪ Los Azules - big copper optionality Turnaround Story & 2020 Priorities

Appendix
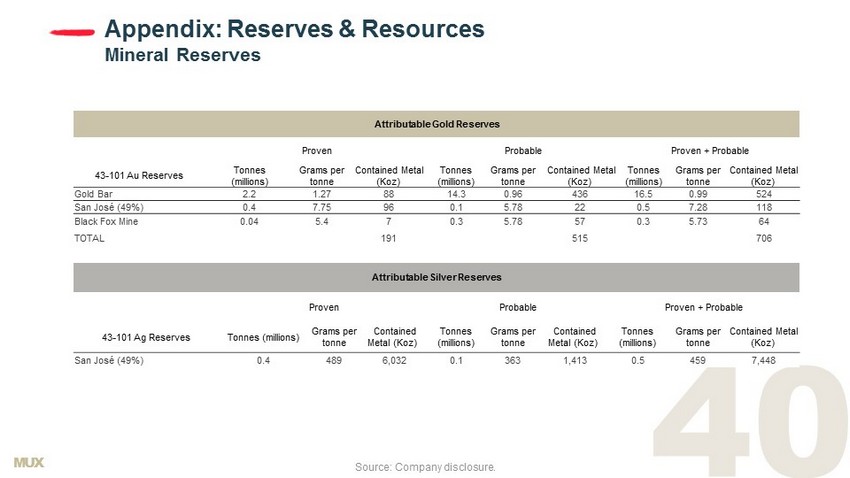
MUX Appendix: Reserves & Resources Mineral Reserves Source: Company disclosure. Attributable Gold Reserves Proven Probable Proven + Probable 43 - 101 Au Reserves Tonnes (millions) Grams per tonne Contained Metal (Koz) Tonnes (millions) Grams per tonne Contained Metal (Koz) Tonnes (millions) Grams per tonne Contained Metal (Koz) Gold Bar 2.2 1.27 88 14.3 0.96 436 16.5 0.99 524 San José (49%) 0.4 7.75 96 0.1 5.78 22 0.5 7.28 118 Black Fox Mine 0.04 5.4 7 0.3 5.78 57 0.3 5.73 64 TOTAL 191 515 706 Attributable Silver Reserves Proven Probable Proven + Probable 43 - 101 Ag Reserves Tonnes (millions) Grams per tonne Contained Metal (Koz) Tonnes (millions) Grams per tonne Contained Metal (Koz) Tonnes (millions) Grams per tonne Contained Metal (Koz) San José (49%) 0.4 489 6,032 0.1 363 1,413 0.5 459 7,448
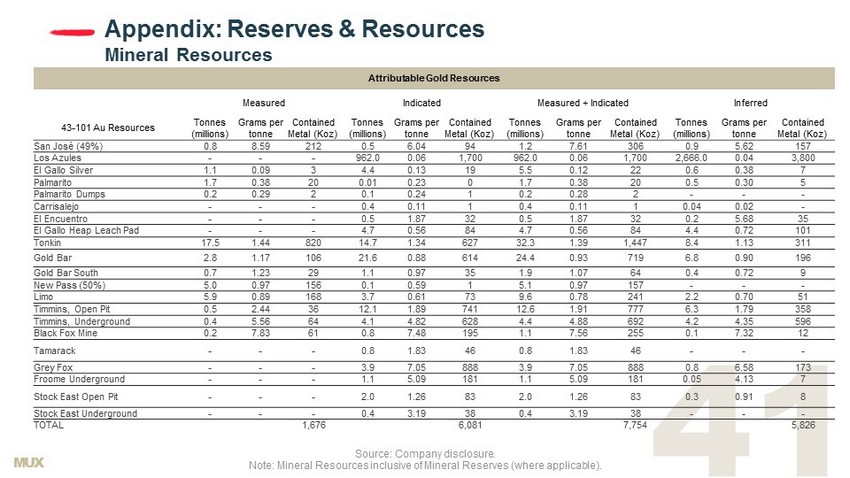
MUX Appendix: Reserves & Resources Mineral Resources Attributable Gold Resources Measured Indicated Measured + Indicated Inferred 43 - 101 Au Resources Tonnes (millions) Grams per tonne Contained Metal (Koz) Tonnes (millions) Grams per tonne Contained Metal (Koz) Tonnes (millions) Grams per tonne Contained Metal (Koz) Tonnes (millions) Grams per tonne Contained Metal (Koz) San José (49%) 0.8 8.59 212 0.5 6.04 94 1.2 7.61 306 0.9 5.62 157 Los Azules - - - 962.0 0.06 1,700 962.0 0.06 1,700 2,666.0 0.04 3,800 El Gallo Silver 1.1 0.09 3 4.4 0.13 19 5.5 0.12 22 0.6 0.38 7 Palmarito 1.7 0.38 20 0.01 0.23 0 1.7 0.38 20 0.5 0.30 5 Palmarito Dumps 0.2 0.29 2 0.1 0.24 1 0.2 0.28 2 - - - Carrisalejo - - - 0.4 0.11 1 0.4 0.11 1 0.04 0.02 - El Encuentro - - - 0.5 1.87 32 0.5 1.87 32 0.2 5.68 35 El Gallo Heap Leach Pad - - - 4.7 0.56 84 4.7 0.56 84 4.4 0.72 101 Tonkin 17.5 1.44 820 14.7 1.34 627 32.3 1.39 1,447 8.4 1.13 311 Gold Bar 2.8 1.17 106 21.6 0.88 614 24.4 0.93 719 6.8 0.90 196 Gold Bar South 0.7 1.23 29 1.1 0.97 35 1.9 1.07 64 0.4 0.72 9 New Pass (50%) 5.0 0.97 156 0.1 0.59 1 5.1 0.97 157 - - - Limo 5.9 0.89 168 3.7 0.61 73 9.6 0.78 241 2.2 0.70 51 Timmins, Open Pit 0.5 2.44 36 12.1 1.89 741 12.6 1.91 777 6.3 1.79 358 Timmins, Underground 0.4 5.56 64 4.1 4.82 628 4.4 4.88 692 4.2 4.35 596 Black Fox Mine 0.2 7.83 61 0.8 7.48 195 1.1 7.56 255 0.1 7.32 12 Tamarack - - - 0.8 1.83 46 0.8 1.83 46 - - - Grey Fox - - - 3 .9 7.05 8 88 3 .9 7.05 8 88 0.8 6.58 173 Froome Underground - - - 1.1 5.09 181 1.1 5.09 181 0.05 4.13 7 Stock East Open Pit - - - 2.0 1.26 83 2.0 1.26 83 0.3 0.91 8 Stock East Underground - - - 0.4 3.19 38 0.4 3.19 38 - - - TOTAL 1,676 6,081 7,754 5,826 Source: Company disclosure. Note: Mineral Resources inclusive of Mineral Reserves (where applicable).

MUX Appendix: Reserves & Resources Mineral Resources (Cont’d) Source: Company disclosure. Note: Mineral Resources inclusive of Mineral Reserves (where applicable). Attributable Silver Resources Measured Indicated Measured + Indicated Inferred 43 - 101 Ag Resources Tonnes (millions) Grams per tonne Contained Metal (Koz) Tonnes (millions) Grams per tonne Contained Metal (Koz) Tonnes (millions) Grams per tonne Contained Metal (Koz) Tonnes (millions) Grams per tonne Contained Metal (Koz) San José (49%) 0.8 537 13,231 0.5 364 5,660 1.2 470 18,888 0.9 356 9,960 Los Azules 962.0 2 55,700 962.0 2 55,700 2,666.0 2 135,400 El Gallo Silver 1.1 150 5,088 4.4 120 17,053 5.5 125 22,140 0.6 82 1,488 Palmarito 1.7 136 7,245 0.01 148 52 1.7 136 7,297 0.5 133 2,258 Palmarito Dumps 0.2 177 1,007 0.1 154 338 0.2 170 1,345 - - - Carrisalejo - - - 0.4 116 1,454 0.4 116 1,454 0.04 821 1,111 El Encuentro - - - 0.5 2 42 0.5 2 42 0.2 19 117 New Pass (50%) 5.0 8 1,320 0.1 3 7 5.1 8 1,326 - - - Tamarack - - - 0.8 26 663 0.8 26 663 - - - TOTAL 27,891 80,969 108,856 150,334
MUX Appendix: Cautionary Note Regarding NON - GAAP Measures In this presentation, we have provided information prepared or calculated according to U . S . GAAP, as well as provided some non - U . S . GAAP ("non - GAAP") performance measures . Because the non - GAAP performance measures do not have any standardized meaning prescribed by U . S . GAAP, they may not be comparable to similar measures presented by other companies . Total Cash Costs per GEO, and All - in Sustaining Costs (“AISC”) per GEO . Total cash costs consist of mining, processing, on - site general and administrative costs, community and permitting costs related to current explorations, royalty costs, refining and treatment charges (for both doré and concentrate products), sales costs, export taxes and operational stripping costs . All - in sustaining cash costs consist of total cash costs (as described above), plus environmental rehabilitation costs, amortization of the asset retirement costs related to operating sites, sustaining exploration and development costs, and sustaining capital expenditures . In order to arrive at our consolidated all - in sustaining costs, we also include corporate general and administrative expenses . Depreciation is excluded from both total cash costs and all - in sustaining cash costs . For both total cash costs and all - in sustaining costs we include our attributable share of total cash costs from operations where we hold less than a 100 % economic share in the production, such as MSC, where we hold a 49 % interest . Total cash cost and all - in sustaining cash cost per GEO sold are calculated on a co - product basis by dividing the respective proportionate share of the total cash costs and all - in sustaining cash costs for the period attributable to each metal by the ounces of each respective metal sold . We use and report these measures to provide additional information regarding operational efficiencies both on a consolidated and an individual mine basis, and believe that these measures provide investors and analysts with useful information about our underlying costs of operations . A reconciliation to the nearest U . S . GAAP measure is provided in McEwen Mining's Annual Report on Form 10 - K for the year ended December 31 , 2019 . Earnings from Mining Operations The term Earnings from Mining Operations used in this presentation is a non - GAAP financial measure . We use and report this measure because we believe it provides investors and analysts with a useful measure of the underlying earnings from our mining operations . We define Earnings from Mining Operations as Gold and Silver Revenues from our El Gallo Mine, Black Fox Mine, and our 49 % attributable share of the San José Mine's Net Sales, less their respective Production Costs Applicable to Sales . To the extent that Production Costs Applicable to Sales may include depreciation and amortization expense related to the fair value increments on historical business acquisitions (fair value paid in excess of the carrying value of the underlying assets and liabilities assumed on the date of acquisition), we deduct this expense in order to arrive at Production Costs Applicable to Sales that only include depreciation and amortization expense incurred at the mine - site level . The San José Mine Net Sales and Production Costs Applicable to Sales are presented, on a 100 % basis, in Note 5 of McEwen Mining's Annual Report on Form 10 - K for the year ended December 31 , 2019 . Cash, Investments and Precious Metals The term cash, investments and precious metals used in this presentation is a non - GAAP financial measure . We report this measure to better understand our liquidity in each reporting period . Cash, investments and precious metals is calculated as the sum of cash, investments and ounces of doré held in inventory, valued at the London P . M . Fix spot price at the corresponding period . A reconciliation to the most directly comparable U . S . GAAP measure, Sales of Gold and Silver, is provided in McEwen Mining's Annual Report on Form 10 - K for the year ended December 31 , 2019 .