Attached files
| file | filename |
|---|---|
| EX-99.1 - EXHIBIT 99.1 - Forterra, Inc. | frta2020q2ex991.htm |
| 8-K - 8-K - Forterra, Inc. | frta2020q28-k.htm |

11 141 185 116 182 144 0 181 239 215 220 225 30 40 89 87 186 73 16 125 224 150 155 160 Investor Presentation July 2020 \\Firmwide.corp.gs.com\ibdroot\projects\IBD-NY\coltan2020\650015_1\Graphics\Photoshop\Fonterra PPT Template\Fonterra PPT Template A.psd

DISCLAIMER Forward-Looking Statements This presentation contains forward-looking statements within the meaning of Section 27A of the Securities Act of 1933, as amended, and Section 21E of the Securities Exchange Act of 1934, as amended. Forward-looking statements may be identified by the use of words such as "anticipate", "believe", "expect", "estimate", "plan", "outlook", and "project" and other similar expressions that predict or indicate future events or trends or that are not statements of historical matters. Forward-looking statements should not be read as a guarantee of future performance or results, and will not necessarily be accurate indications of the times at, or by, which such performance or results will be achieved. Forward- looking statements are based on historical information available at the time the statements are made and are based on management's reasonable belief or expectations with respect to future events, and are subject to risks and uncertainties, many of which are beyond the Company's control, that could cause actual performance or results to differ materially from the belief or expectations expressed in or suggested by the forward-looking statements. Forward- looking statements speak only as of the date on which they are made and the Company undertakes no obligation to update any forward-looking statement to reflect future events, developments or otherwise, except as may be required by applicable law. Investors are referred to the Company's filings with the Securities and Exchange Commission, including its Annual Report on Form 10-K, as updated by any quarterly reporting on Form 10-Q, for additional information regarding the risks and uncertainties that may cause actual results to differ materially from those expressed in any forward-looking statement. Some of the risks and uncertainties that could cause actual results to differ materially from those expressed in any forward looking statement include risks and uncertainties relating to the impacts of the COVID-19 pandemic; the level of construction activity, particularly in the residential construction and non-residential construction markets; government funding of infrastructure and related construction activities; the highly competitive nature of our industry and our ability to effectively compete; the availability and price of the raw materials we use in our business; the ability to implement our growth strategy; our dependence on key customers and the absence of long-term agreements with these customers; the level of construction activity in Texas; energy costs; disruption at one or more of our manufacturing facilities or in our supply chain; construction project delays and our inventory management; our ability to successfully integrate acquisitions; labor disruptions and other union activity; a tightening of mortgage lending or mortgage financing requirements; our current dispute with HeidelbergCement related to the payment of an earnout; compliance with environmental laws and regulations; compliance with health and safety laws and regulations and other laws and regulations to which we and our products are subject; our dependence on key executives and key management personnel; our ability or that of the customers with which we work to retain and attract additional skilled and non-skilled technical or sales personnel; credit and non-payment risks of our customers; warranty and related claims; legal and regulatory claims; the seasonality of our business and its susceptibility to adverse weather; our contract backlog; our ability to maintain sufficient liquidity and ensure adequate financing or guarantees for large projects; delays or outages in our information technology systems and computer networks; security breaches in our information technology systems and other cybersecurity incidents and additional factors discussed in our filings with the Securities and Exchange Commission, including the Company’s Annual Report on Form 10-K and Quarterly Reports on Form 10-Q, that may cause actual results to differ materially from those expressed in any forward-looking statement. Industry Data We use market data and industry forecasts throughout this presentation. Unless otherwise indicated, statements in this presentation concerning our industries and the markets in which we operate, including our general expectations, competitive position, business opportunity and market size, growth and share, are based on publicly available information, periodic industry publications and surveys, government surveys and reports, and reports by market research firms. We have not independently verified market data and industry forecasts provided by any of these third-party sources, although we believe such market data and industry forecasts included in this presentation are reliable. This information cannot always be verified with complete certainty due to the limits on the availability and reliability of raw data, the voluntary nature of the data gathering process and other limitations and uncertainties inherent in surveys of market size. Management estimates are derived from the information and data referred to above, as well as our internal research, calculations and assumptions made by the Company based on our analysis of such information and data and our knowledge of our industries and markets, which we believe to be reasonable, although they have not been independently verified. While we believe that the market position information included in this presentation is generally reliable, such information is inherently imprecise. Assumptions, expectations and estimates of our future performance and the future performance of the industries and markets in which we operate are necessarily subject to a high degree of uncertainty and risk due to a variety of factors, including those described in our filings with the Securities and Exchange Commission. These and other factors could cause results to differ materially from those expressed in the estimates made by the independent parties and by us. 1

Company and Industry Overview
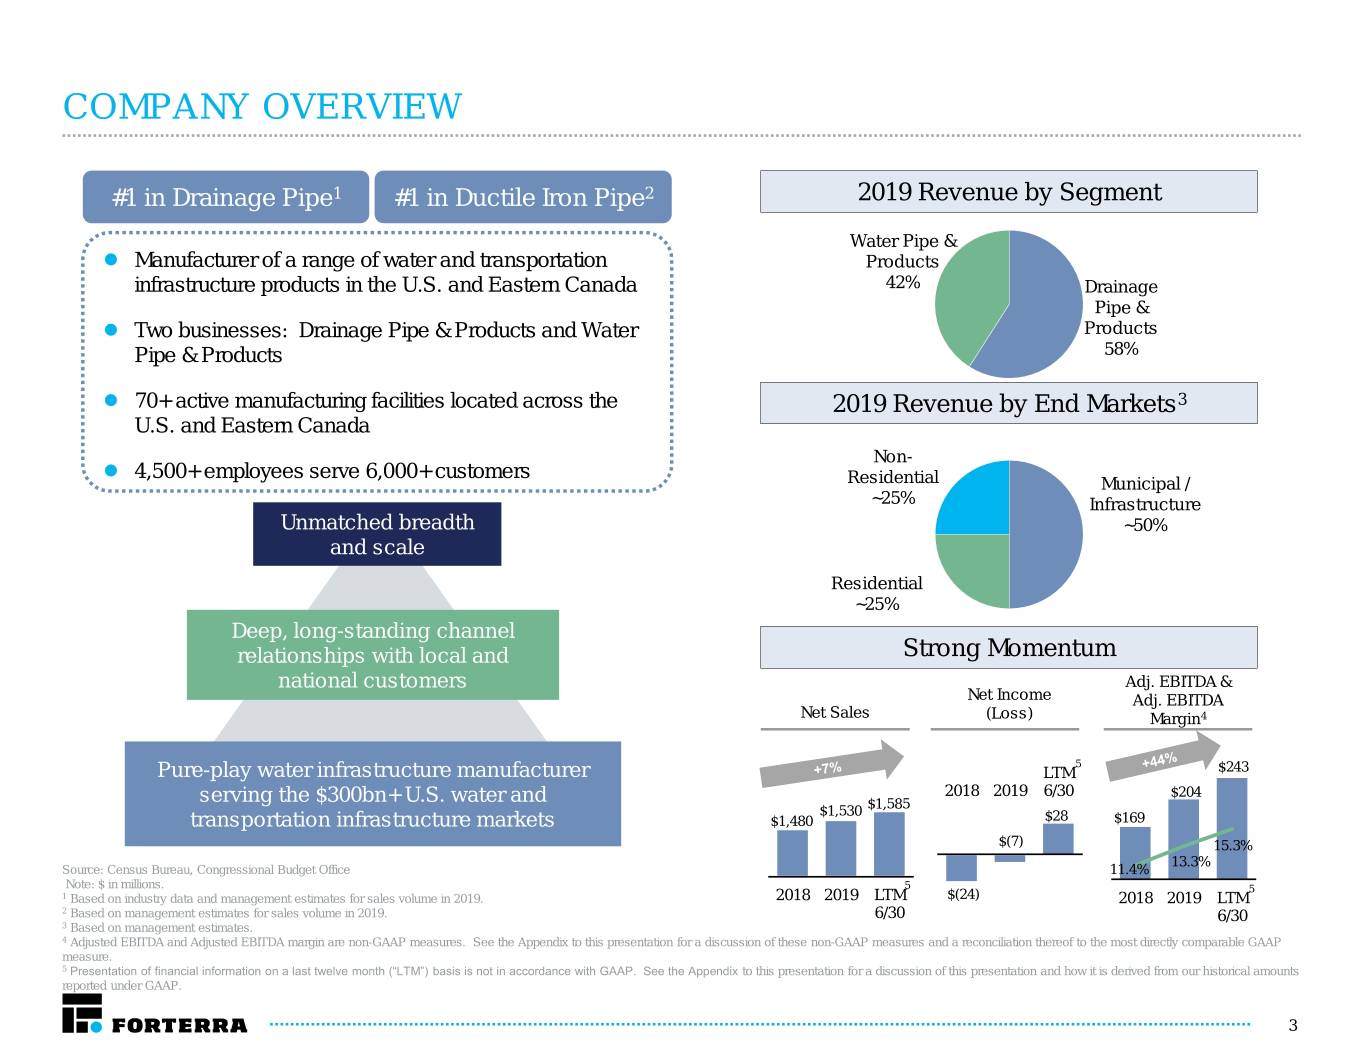
COMPANY OVERVIEW #1 in Drainage Pipe1 #1 in Ductile Iron Pipe2 2019 Revenue by Segment Water Pipe & Manufacturer of a range of water and transportation Products infrastructure products in the U.S. and Eastern Canada 42% Drainage Pipe & Two businesses: Drainage Pipe & Products and Water Products Pipe & Products 58% 70+ active manufacturing facilities located across the 2019 Revenue by End Markets3 U.S. and Eastern Canada Non- 4,500+ employees serve 6,000+ customers Residential Municipal / ~25% Infrastructure Unmatched breadth ~50% and scale Residential ~25% Deep, long-standing channel relationships with local and Strong Momentum national customers Adj. EBITDA & Net Income Adj. EBITDA Net Sales (Loss) Margin4 5 Pure-play water infrastructure manufacturer LTM $243 2018 2019 6/30 $204 serving the $300bn+ U.S. water and $1,585 $1,530 transportation infrastructure markets $1,480 $28 $169 $(7) 15.3% 13.3% Source: Census Bureau, Congressional Budget Office 11.4% Note: $ in millions. 5 5 1 Based on industry data and management estimates for sales volume in 2019. 2018 2019 LTM $(24) 2018 2019 LTM 2 Based on management estimates for sales volume in 2019. 6/30 6/30 3 Based on management estimates. 4 Adjusted EBITDA and Adjusted EBITDA margin are non-GAAP measures. See the Appendix to this presentation for a discussion of these non-GAAP measures and a reconciliation thereof to the most directly comparable GAAP measure. 5 Presentation of financial information on a last twelve month (“LTM”) basis is not in accordance with GAAP. See the Appendix to this presentation for a discussion of this presentation and how it is derived from our historical amounts reported under GAAP. 3
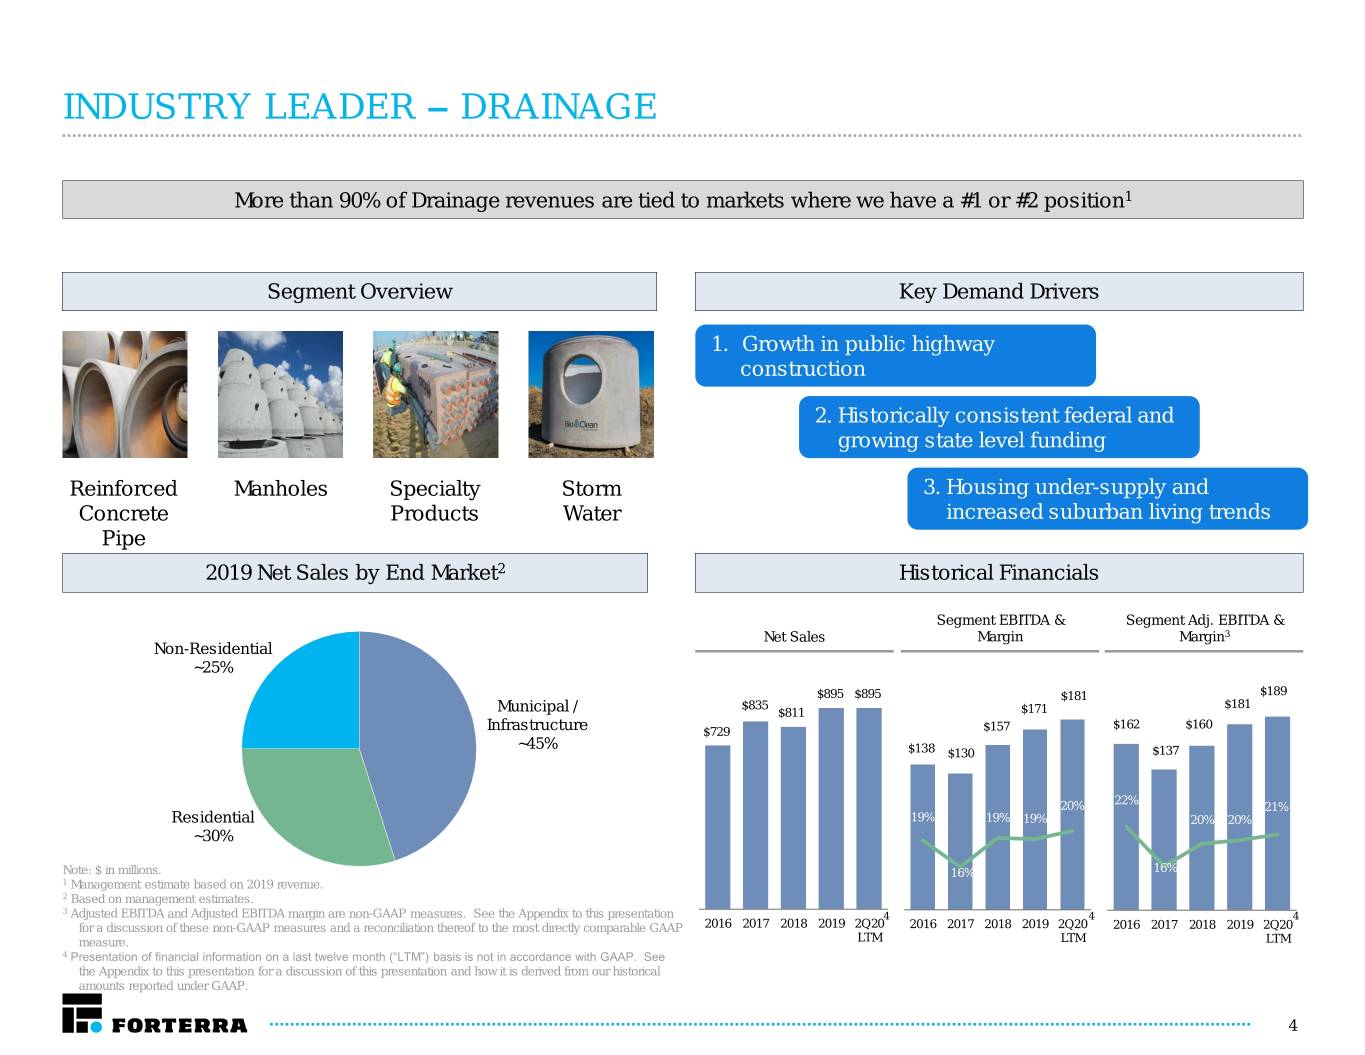
INDUSTRY LEADER – DRAINAGE More than 90% of Drainage revenues are tied to markets where we have a #1 or #2 position1 Segment Overview Key Demand Drivers 1. Growth in public highway construction 2. Historically consistent federal and growing state level funding Reinforced Manholes Specialty Storm 3. Housing under-supply and Concrete Products Water increased suburban living trends Pipe 2019 Net Sales by End Market2 Historical Financials Segment EBITDA & Segment Adj. EBITDA & Net Sales Margin Margin3 Non-Residential ~25% $895 $895 $181 $189 $835 $181 Municipal / $811 $171 $162 $160 Infrastructure $729 $157 ~45% $138 $130 $137 22% 20% 21% Residential 19% 19% 19% 20% 20% ~30% Note: $ in millions. 16% 16% 1 Management estimate based on 2019 revenue. 2 Based on management estimates. 3 Adjusted EBITDA and Adjusted EBITDA margin are non-GAAP measures. See the Appendix to this presentation 4 4 4 for a discussion of these non-GAAP measures and a reconciliation thereof to the most directly comparable GAAP 2016 2017 2018 2019 2Q20 2016 2017 2018 2019 2Q20 2016 2017 2018 2019 2Q20 measure. LTM LTM LTM 4 Presentation of financial information on a last twelve month (“LTM”) basis is not in accordance with GAAP. See the Appendix to this presentation for a discussion of this presentation and how it is derived from our historical amounts reported under GAAP. 4
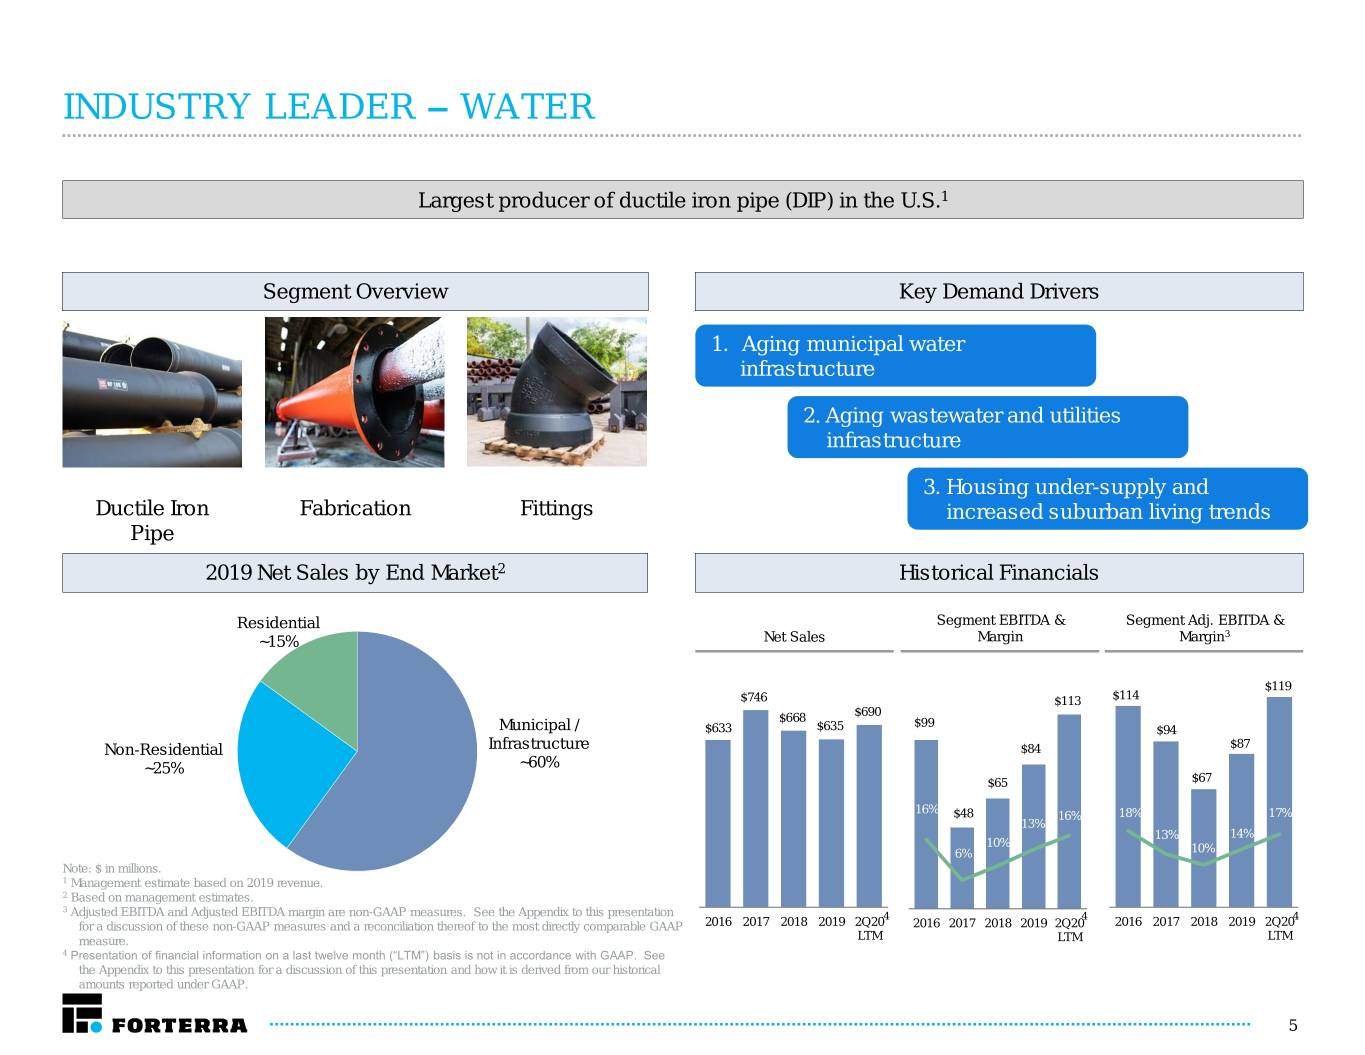
INDUSTRY LEADER – WATER Largest producer of ductile iron pipe (DIP) in the U.S.1 Segment Overview Key Demand Drivers 1. Aging municipal water infrastructure 2. Aging wastewater and utilities infrastructure 3. Housing under-supply and Ductile Iron Fabrication Fittings increased suburban living trends Pipe 2019 Net Sales by End Market2 Historical Financials Residential Segment EBITDA & Segment Adj. EBITDA & 3 ~15% Net Sales Margin Margin $119 $746 $113 $114 $690 $668 $99 Municipal / $633 $635 $94 Non-Residential Infrastructure $84 $87 ~25% ~60% $65 $67 16% $48 16% 18% 17% 13% 13% 14% 10% 6% 10% Note: $ in millions. 1 Management estimate based on 2019 revenue. 2 Based on management estimates. 3 Adjusted EBITDA and Adjusted EBITDA margin are non-GAAP measures. See the Appendix to this presentation 4 4 4 for a discussion of these non-GAAP measures and a reconciliation thereof to the most directly comparable GAAP 2016 2017 2018 2019 2Q20 2016 2017 2018 2019 2Q20 2016 2017 2018 2019 2Q20 measure. LTM LTM LTM 4 Presentation of financial information on a last twelve month (“LTM”) basis is not in accordance with GAAP. See the Appendix to this presentation for a discussion of this presentation and how it is derived from our historical amounts reported under GAAP. 5
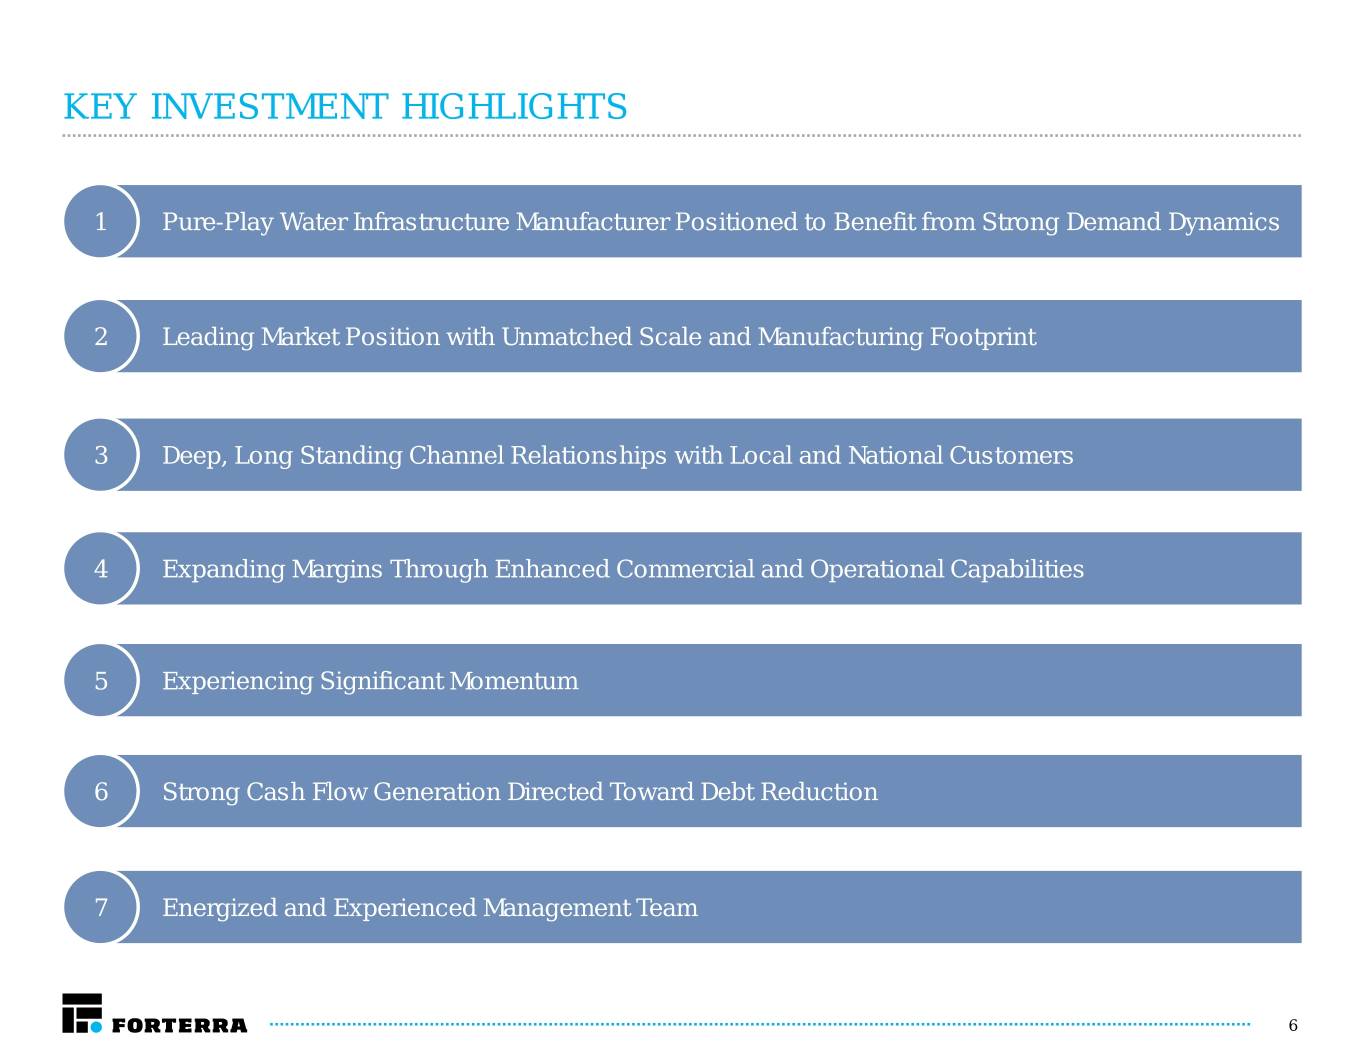
KEY INVESTMENT HIGHLIGHTS 1 Pure-Play Water Infrastructure Manufacturer Positioned to Benefit from Strong Demand Dynamics 2 Leading Market Position with Unmatched Scale and Manufacturing Footprint 3 Deep, Long Standing Channel Relationships with Local and National Customers 4 Expanding Margins Through Enhanced Commercial and Operational Capabilities 5 Experiencing Significant Momentum 6 Strong Cash Flow Generation Directed Toward Debt Reduction 7 Energized and Experienced Management Team 6
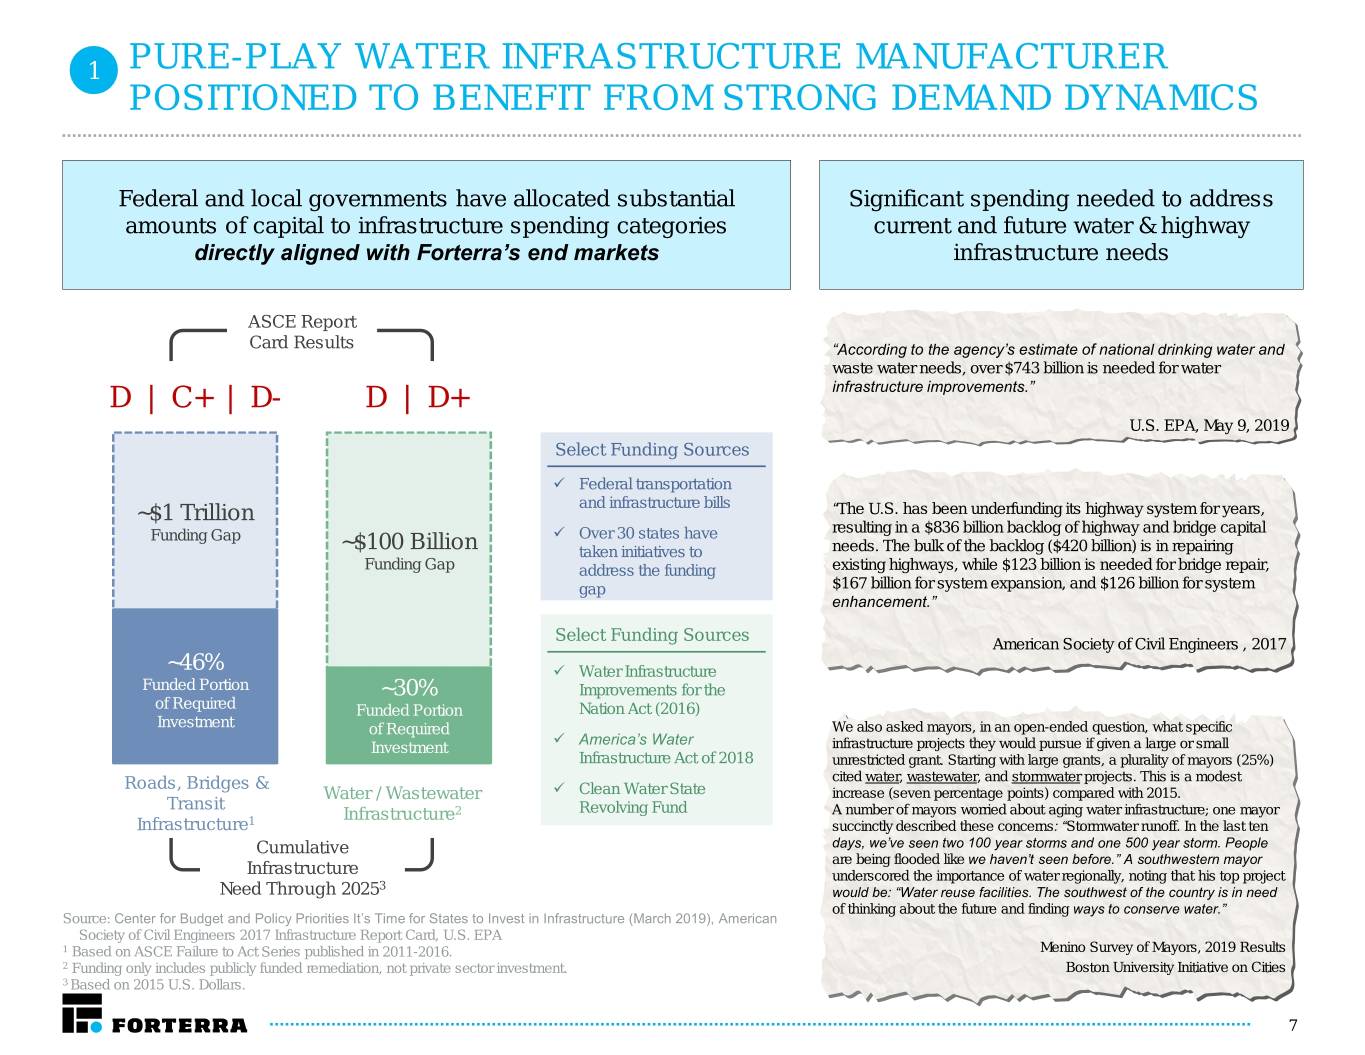
1 PURE-PLAY WATER INFRASTRUCTURE MANUFACTURER POSITIONED TO BENEFIT FROM STRONG DEMAND DYNAMICS Federal and local governments have allocated substantial Significant spending needed to address amounts of capital to infrastructure spending categories current and future water & highway directly aligned with Forterra’s end markets infrastructure needs ASCE Report Card Results “According to the agency’s estimate of national drinking water and waste water needs, over $743 billion is needed for water infrastructure improvements.” D | C+ | D- D | D+ U.S. EPA, May 9, 2019 Select Funding Sources Federal transportation ~$1 Trillion and infrastructure bills “The U.S. has been underfunding its highway system for years, resulting in a $836 billion backlog of highway and bridge capital Funding Gap Over 30 states have ~$100 Billion taken initiatives to needs. The bulk of the backlog ($420 billion) is in repairing Funding Gap address the funding existing highways, while $123 billion is needed for bridge repair, gap $167 billion for system expansion, and $126 billion for system enhancement.” Select Funding Sources American Society of Civil Engineers , 2017 ~46% Water Infrastructure Funded Portion ~30% Improvements for the of Required Funded Portion Nation Act (2016) Investment of Required We also asked mayors, in an open-ended question, what specific America’s Water Investment infrastructure projects they would pursue if given a large or small Infrastructure Act of 2018 unrestricted grant. Starting with large grants, a plurality of mayors (25%) Roads, Bridges & cited water, wastewater, and stormwater projects. This is a modest Water / Wastewater Clean Water State increase (seven percentage points) compared with 2015. Transit Infrastructure2 Revolving Fund A number of mayors worried about aging water infrastructure; one mayor Infrastructure1 succinctly described these concerns: “Stormwater runoff. In the last ten Cumulative days, we’ve seen two 100 year storms and one 500 year storm. People are being flooded like we haven’t seen before.” A southwestern mayor Infrastructure underscored the importance of water regionally, noting that his top project Need Through 20253 would be: “Water reuse facilities. The southwest of the country is in need of thinking about the future and finding ways to conserve water.” Source: Center for Budget and Policy Priorities It’s Time for States to Invest in Infrastructure (March 2019), American Society of Civil Engineers 2017 Infrastructure Report Card, U.S. EPA 1 Based on ASCE Failure to Act Series published in 2011-2016. Menino Survey of Mayors, 2019 Results 2 Funding only includes publicly funded remediation, not private sector investment. Boston University Initiative on Cities 3 Based on 2015 U.S. Dollars. 7

PURE-PLAY WATER INFRASTRUCTURE MANUFACTURER 1 POSITIONED TO BENEFIT FROM STRONG DEMAND DYNAMICS (CONT’D) Public Spending on Transportation & Water Infrastructure1 Aging Pipe $500 Infrastructure $441 Much of the drinking water pipes in the US were laid from the $400 1900s to 1950. This includes lead pipes, which are still in service in some cities $300 $200 ($ in billions) ($ Water $100 Main Breaks $0 This aging water pipe infrastructure contributes to an 1956 1966 1976 1986 1996 2006 2016 estimated 240,000 water main breaks per year in municipalities across the US Public Spending by Infrastructure Category1 $350 Wasted $300 $299 Resources $250 Water main breaks and other maintenance-related incidents Transportation cause trillions of gallons of treated drinking water – a critical $200 resource with increasing cost to end customers – to be $150 $142 wasted each year ($ in billions) ($ $100 Water $50 $0 1956 1966 1976 1986 1996 2006 2016 Indicates recessionary period Source: Congressional Budget Office – Public Spending on Transportation and Water Infrastructure, 1956 to 2017 and American Society of Civil Engineers (ASCE). Note: Spending data presented on nominal basis and not adjusted for inflation. (1) Includes highway, mass transit and rail, aviation, water transportation, water resources and water utilities spending. Water resources includes containment systems (dams, levees, reservoirs, and watersheds as well as sources of freshwater (lakes and rivers). Water utilities includes water supply and wastewater treatment facilities. 8
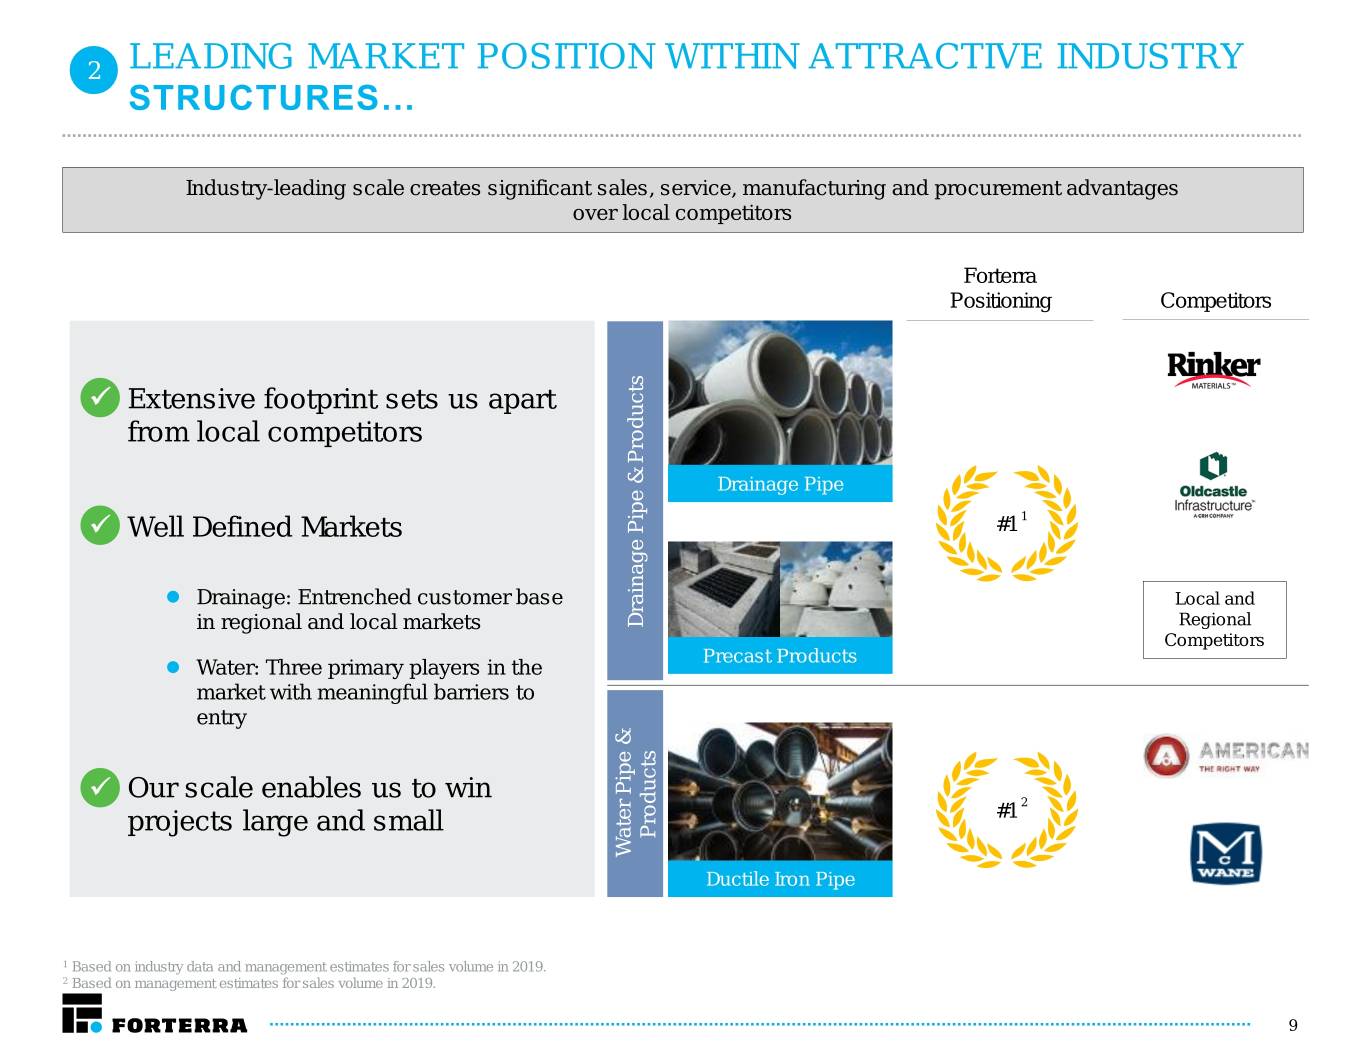
2 LEADING MARKET POSITION WITHIN ATTRACTIVE INDUSTRY STRUCTURES… Industry-leading scale creates significant sales, service, manufacturing and procurement advantages over local competitors Forterra Positioning Competitors Extensive footprint sets us apart from local competitors Drainage Pipe Well Defined Markets #1 1 Drainage: Entrenched customer base Local and in regional and local markets PipeProducts & Drainage Regional Competitors Precast Products Water: Three primary players in the market with meaningful barriers to entry Our scale enables us to win 2 projects large and small #1 Products Water Pipe & Water Ductile Iron Pipe 1 Based on industry data and management estimates for sales volume in 2019. 2 Based on management estimates for sales volume in 2019. 9
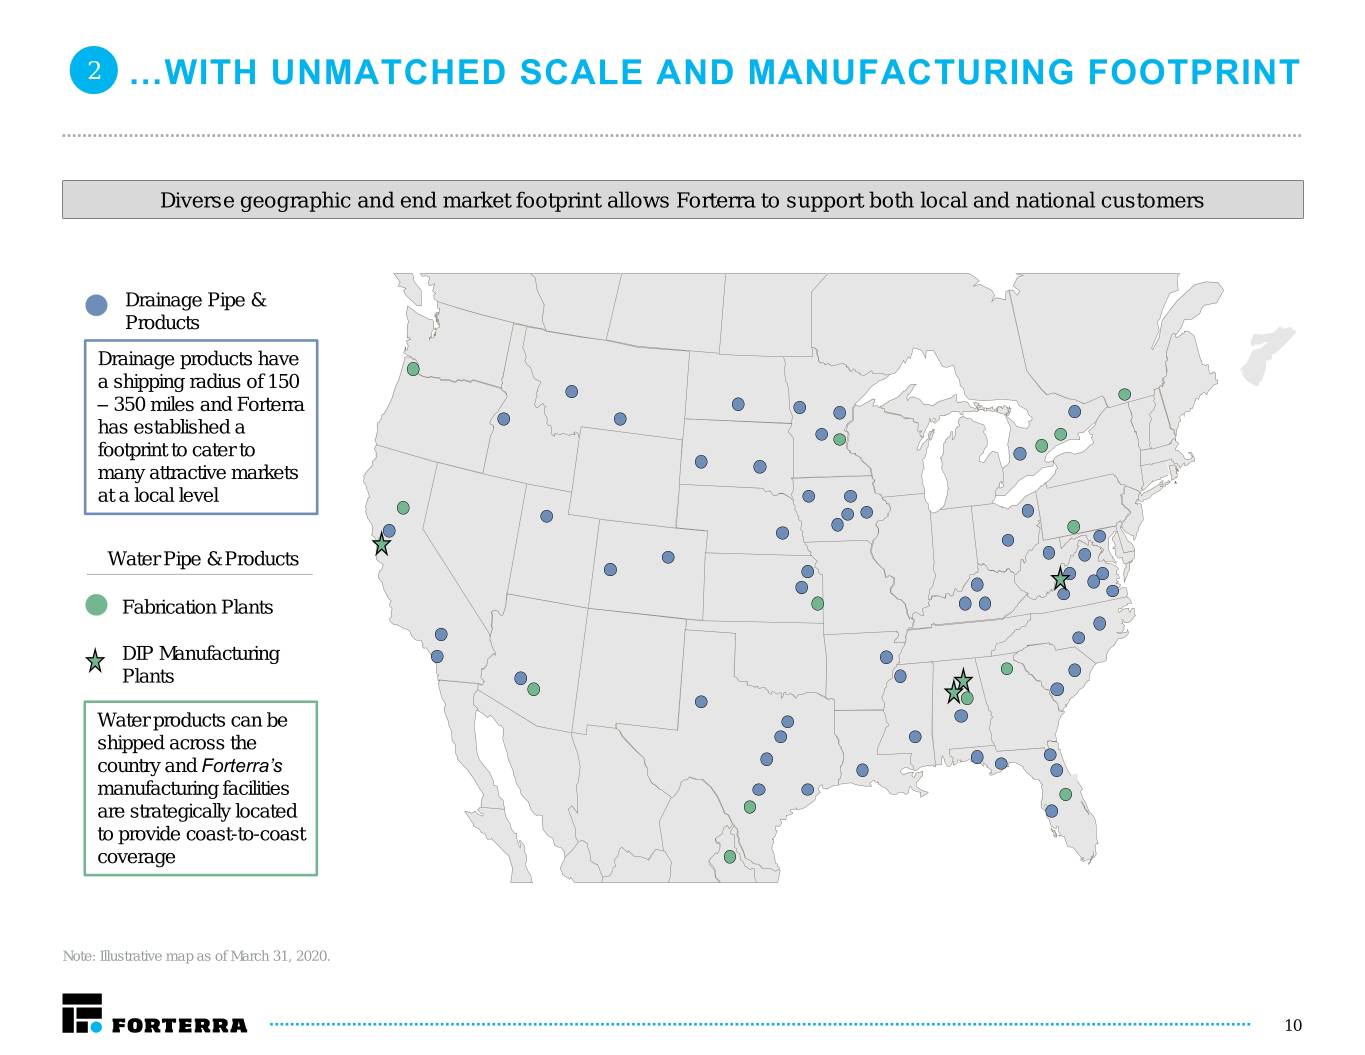
2 …WITH UNMATCHED SCALE AND MANUFACTURING FOOTPRINT Diverse geographic and end market footprint allows Forterra to support both local and national customers Drainage Pipe & Products Drainage products have a shipping radius of 150 – 350 miles and Forterra has established a footprint to cater to many attractive markets at a local level Water Pipe & Products Fabrication Plants DIP Manufacturing Plants Water products can be shipped across the country and Forterra’s manufacturing facilities are strategically located to provide coast-to-coast coverage Note: Illustrative map as of March 31, 2020. 10

3 DEEP, LONG STANDING CHANNEL RELATIONSHIPS WITH LOCAL AND NATIONAL CUSTOMERS Water Pipe & Products Drainage Pipe & Products Strong Relationships with Market Leading Trust-Based Contractors Relationship Across 1 1 Distributors Each Local Market Nationally Aligned Commercial Long Track Record of Putting Customers’ Philosophy and Strategy 2 2 Interests / Business Strategies First Executed Locally Refined Commercial Strategy Has Been Well- Value before Volume 3 3 Received and Accretive (But not in spite of) 11

4 TRANSFORMATION OF FORTERRA: HEIGHTENED FOCUS ON EXPANDING MARGINS Forterra’s new management is in the early innings of pricing enhancements and operational initiatives that are expected to continue to improve financial performance Plant-Level Enhanced Working Capital G&A Health and Safety Operational Commercial Efficiency Effectiveness Discipline Capabilities We put the health and Making daily safety of our Investing in sales force to Deeper information improvements using our Put inventory in the right employees before expand reach and better delivered faster and at a manufacturing / process places at the right times anything else; our inform our customers of lower cost so operators know-how to drive and match AR & AP most productive our compelling value can make better business efficiencies with limited cycles proposition decisions facilities should be our financial investment safest Revamped Incentive System to Drive Economic Profit Metrics 12

5 EXPERIENCING SIGNIFICANT MOMENTUM LTM Net Sales LTM Gross Profit and Margin 7% 32% $1,569 $1,585 $333 $1,482 $1,476 $1,506 $1,530 $313 $289 $296 $253 $264 19.4% 20.0% 21.0% 17.9% 19.2% 17.1% Q1 19 Q2 19 Q3 19 Q4 19 Q1 20 Q2 20 Q1 19 Q2 19 Q3 19 Q4 19 Q1 20 Q2 20 LTM Net (Loss) Income LTM Adjusted EBITDA and Margin1 Q1 19 Q2 19 Q3 19 Q4 19 Q1 20 Q2 20 41% $243 $219 $28 $195 $204 $172 $177 $4 ($7) ($17) 11.6% 12.0% 13.0% 13.3% 14.0% 15.3% ($29) ($34) Q1 19 Q2 19 Q3 19 Q4 19 Q1 20 Q2 20 Note: Presentation of financial information on a last twelve month (“LTM”) basis is not in accordance with GAAP. See the Appendix to this presentation for a discussion of this presentation and how it is derived from our historical amounts reported under GAAP. 1 Adjusted EBITDA and Adjusted EBITDA margin are non-GAAP measures. See the Appendix to this presentation for a discussion of these non-GAAP measures and a reconciliation thereof to the most directly comparable GAAP measure. 13
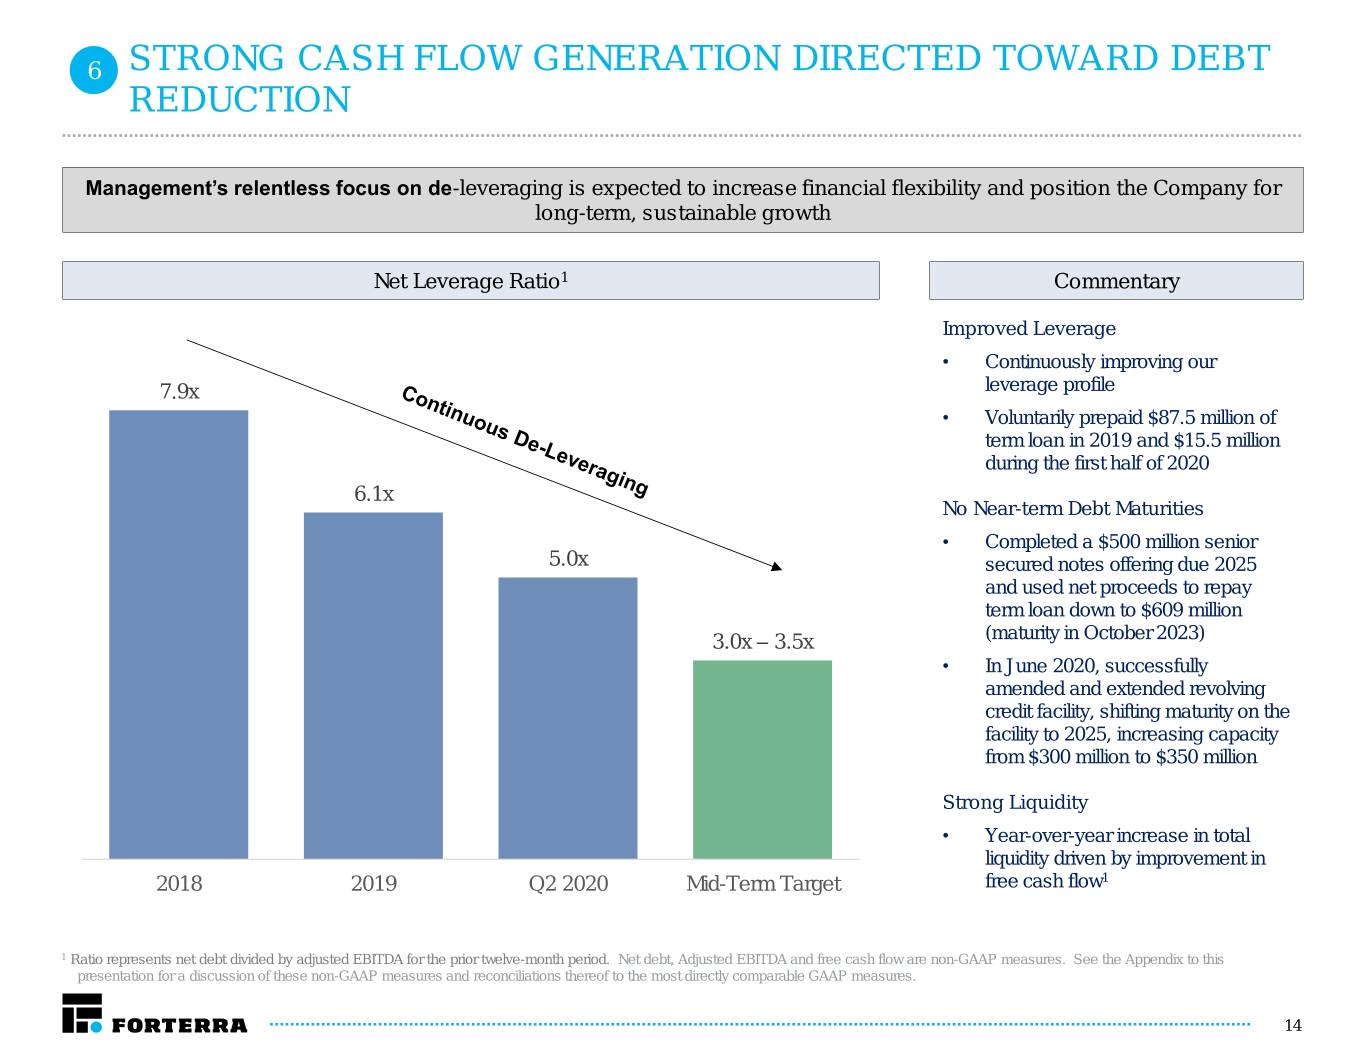
6 STRONG CASH FLOW GENERATION DIRECTED TOWARD DEBT REDUCTION Management’s relentless focus on de-leveraging is expected to increase financial flexibility and position the Company for long-term, sustainable growth Net Leverage Ratio1 Commentary Improved Leverage • Continuously improving our 7.9x leverage profile • Voluntarily prepaid $87.5 million of term loan in 2019 and $15.5 million during the first half of 2020 6.1x No Near-term Debt Maturities • Completed a $500 million senior 5.0x secured notes offering due 2025 and used net proceeds to repay term loan down to $609 million 3.0x – 3.5x (maturity in October 2023) • In June 2020, successfully amended and extended revolving credit facility, shifting maturity on the facility to 2025, increasing capacity from $300 million to $350 million Strong Liquidity • Year-over-year increase in total liquidity driven by improvement in 2018 2019 Q2 2020 Mid-Term Target free cash flow1 1 Ratio represents net debt divided by adjusted EBITDA for the prior twelve-month period. Net debt, Adjusted EBITDA and free cash flow are non-GAAP measures. See the Appendix to this presentation for a discussion of these non-GAAP measures and reconciliations thereof to the most directly comparable GAAP measures. 14

7 ENERGIZED AND EXPERIENCED MANAGEMENT TEAM Forterra’s diverse management team brings cross-industry experience and a proven track record of performance Karl Watson Charlie Brown Lori Browne CEO EVP & CFO EVP & General Counsel Rich Hunter Vik Bhatia Truman Greene President, Drainage President, Water SVP, Human Resources Segment Segment 15
Financial Update
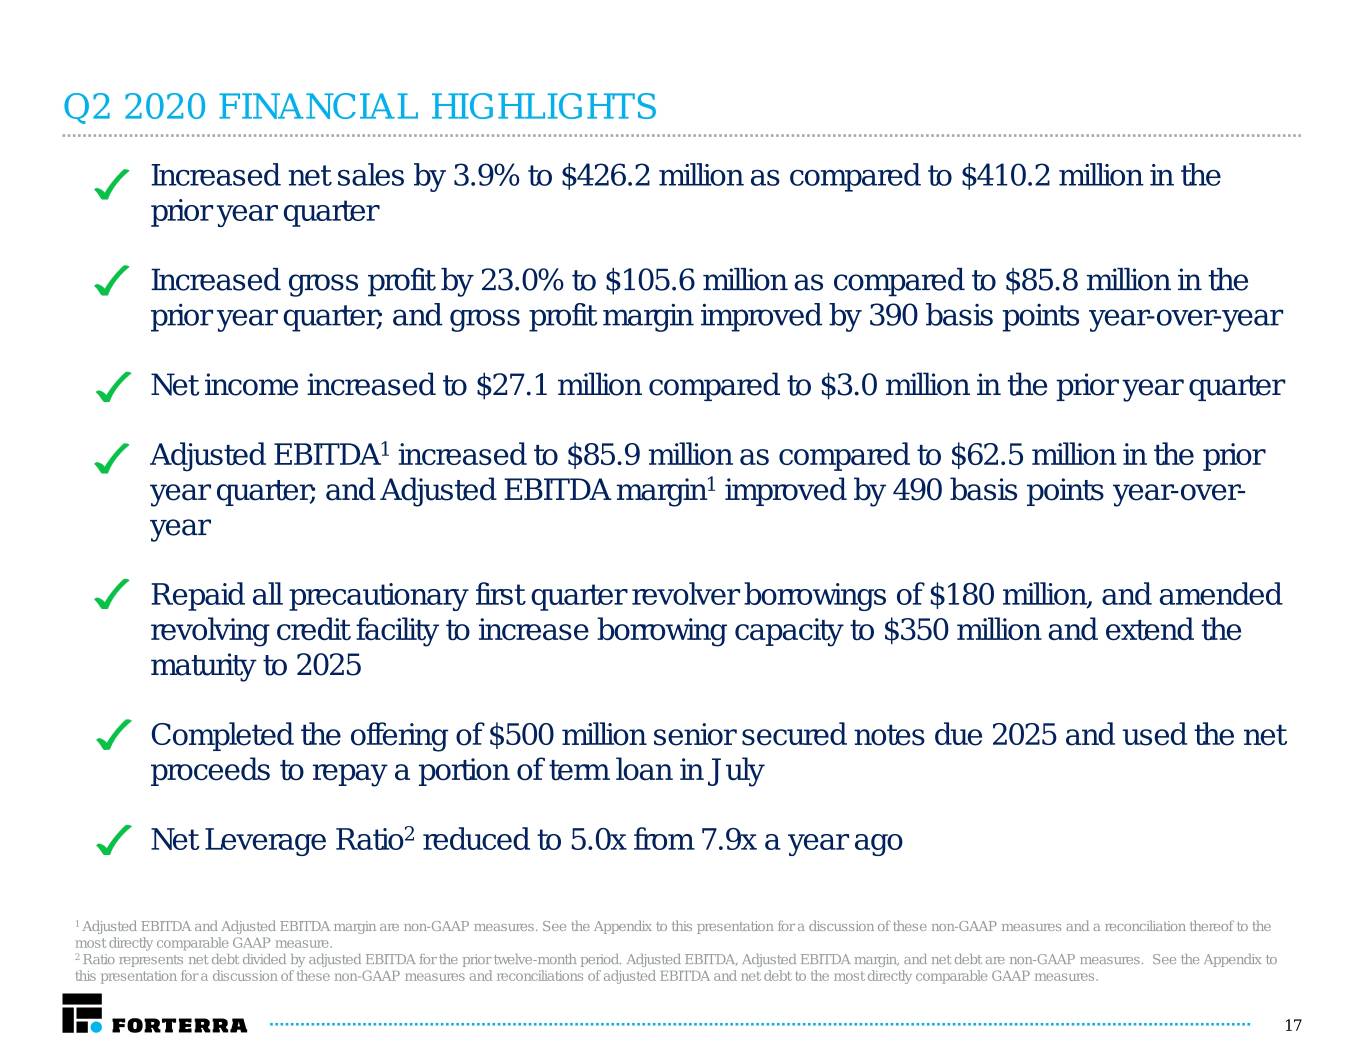
Q2 2020 FINANCIAL HIGHLIGHTS Increased net sales by 3.9% to $426.2 million as compared to $410.2 million in the prior year quarter Increased gross profit by 23.0% to $105.6 million as compared to $85.8 million in the prior year quarter; and gross profit margin improved by 390 basis points year-over-year Net income increased to $27.1 million compared to $3.0 million in the prior year quarter Adjusted EBITDA1 increased to $85.9 million as compared to $62.5 million in the prior year quarter; and Adjusted EBITDA margin1 improved by 490 basis points year-over- year Repaid all precautionary first quarter revolver borrowings of $180 million, and amended revolving credit facility to increase borrowing capacity to $350 million and extend the maturity to 2025 Completed the offering of $500 million senior secured notes due 2025 and used the net proceeds to repay a portion of term loan in July Net Leverage Ratio2 reduced to 5.0x from 7.9x a year ago 1 Adjusted EBITDA and Adjusted EBITDA margin are non-GAAP measures. See the Appendix to this presentation for a discussion of these non-GAAP measures and a reconciliation thereof to the most directly comparable GAAP measure. 2 Ratio represents net debt divided by adjusted EBITDA for the prior twelve-month period. Adjusted EBITDA, Adjusted EBITDA margin, and net debt are non-GAAP measures. See the Appendix to this presentation for a discussion of these non-GAAP measures and reconciliations of adjusted EBITDA and net debt to the most directly comparable GAAP measures. 17

Q2 AND YTD 2020 FINANCIAL PERFORMANCE – CONSOLIDATED ($MM) Net Sales Gross Profit and Margin +4% +8% +23% +29% $426 $757 $410 $702 $106 $164 $86 $128 24.8% 21.7% 20.9% 18.2% Q2 2019 Q2 2020 1H 2019 1H 2020 Q2 2019 Q2 2020 1H 2019 1H 2020 Net Income (Loss) Adjusted EBITDA and Margin1 +37% +47% $27 $ 13 $86 $121 $63 $82 20.1% 15.2% 16.0% 11.7% $3 $(22) Q2 2019 Q2 2020 1H 2019 1H 2020 Q2 2019 Q2 2020 1H 2019 1H 2020 1 Adjusted EBITDA and Adjusted EBITDA margin are non-GAAP measures. See the Appendix to this presentation for a discussion of these non-GAAP measures and a reconciliation thereof to the most directly comparable GAAP measure. 18

Q2 AND YTD 2020 FINANCIAL PERFORMANCE – DRAINAGE ($MM) Net Sales Gross Profit and Margin (3)% +0% +6% +5% $94 $405 $406 $61 $89 $58 $242 $236 26.1% 23.9% 22.0% 23.1% Q2 2019 Q2 2020 1H 2019 1H 2020 Q2 2019 Q2 2020 1H 2019 1H 2020 Segment EBITDA and Margin Adjusted EBITDA and Margin1 Operational Statistics2 +17% +13% +12% +10% 2Q20 1H20 vs. 2Q19 vs. 1H19 $57 $84 $59 $87 $49 $74 $79 Volume $52 (13)% (10)% (tons) 24.4% 24.9% 21.7% 21.4% 20.3% 20.6% 19.5% Pricing 18.3% +9% +9% per Unit Mix Impacted Cost of Goods Sold per Q2 2019 Q2 2020 1H 2019 1H 2020 Q2 2019 Q2 2020 1H 2019 1H 2020 Unit 1 Adjusted EBITDA and Adjusted EBITDA Margin are non-GAAP measures. See the Appendix to this presentation for a discussion of these non-GAAP measures and a reconciliation thereof to the most directly comparable GAAP measure. 2 Operational statistics only pertain to our pipe and precast products and do not include other services, non-volume based products, or non-core products. Pipe and precast products revenue accounted for approximately 90% of Drainage segment revenue. 19
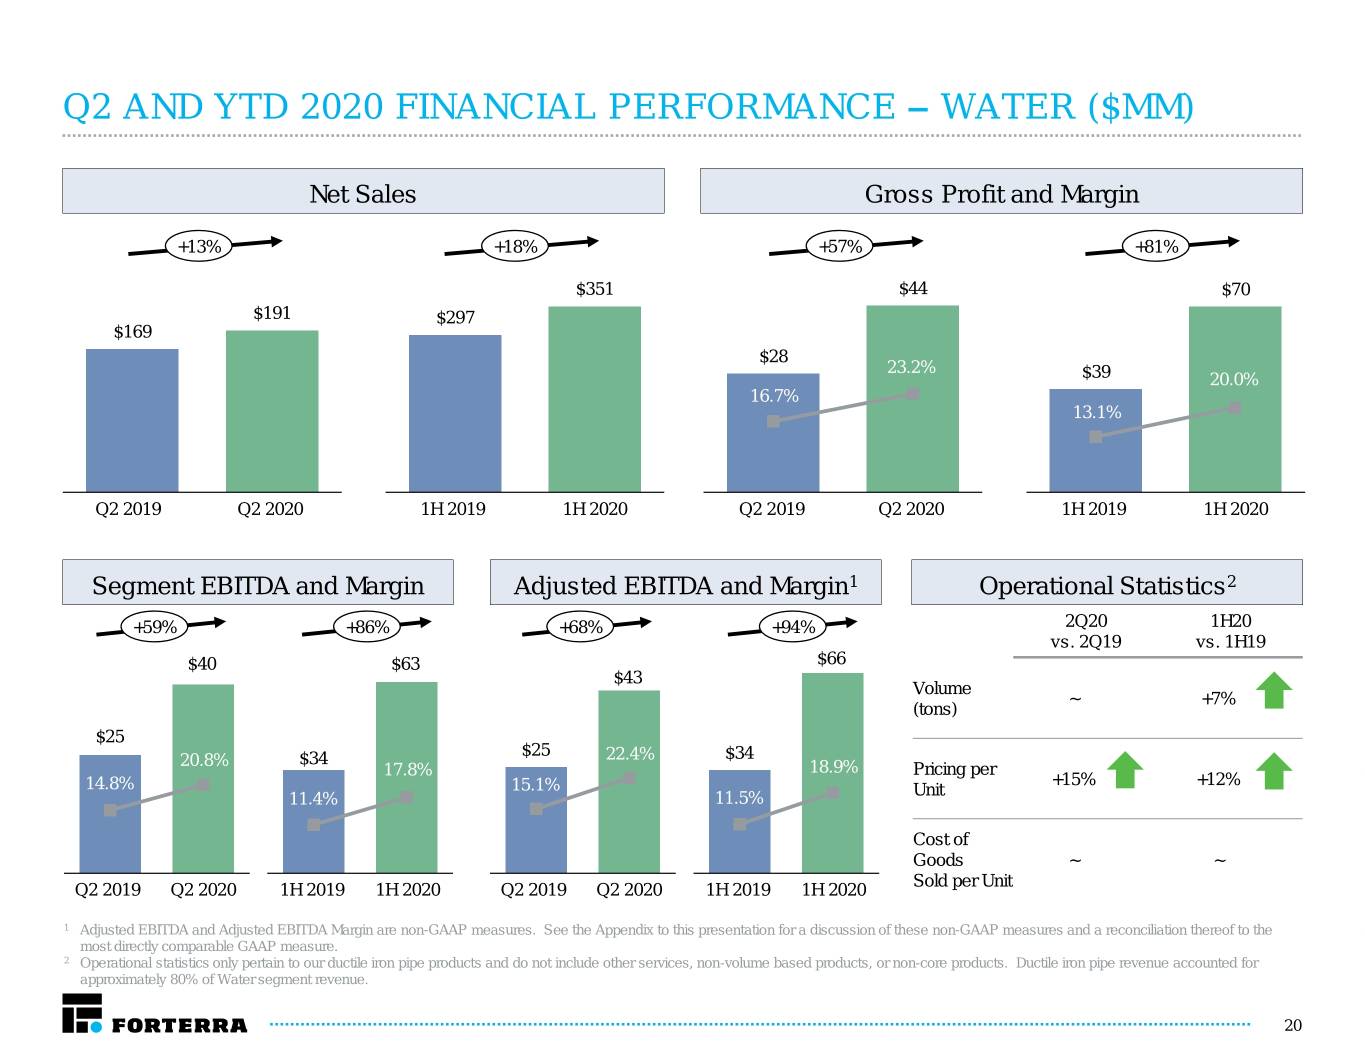
Q2 AND YTD 2020 FINANCIAL PERFORMANCE – WATER ($MM) Net Sales Gross Profit and Margin +13% +18% +57% +81% $351 $44 $70 $191 $297 $169 $28 23.2% $39 20.0% 16.7% 13.1% Q2 2019 Q2 2020 1H 2019 1H 2020 Q2 2019 Q2 2020 1H 2019 1H 2020 Segment EBITDA and Margin Adjusted EBITDA and Margin1 Operational Statistics2 +59% +86% +68% +94% 2Q20 1H20 vs. 2Q19 vs. 1H19 $40 $63 $66 $43 Volume ~ +7% (tons) $25 $25 20.8% $34 22.4% $34 17.8% 18.9% Pricing per +15% +12% 14.8% 15.1% Unit 11.4% 11.5% Cost of Goods ~ ~ Sold per Unit Q2 2019 Q2 2020 1H 2019 1H 2020 Q2 2019 Q2 2020 1H 2019 1H 2020 1 Adjusted EBITDA and Adjusted EBITDA Margin are non-GAAP measures. See the Appendix to this presentation for a discussion of these non-GAAP measures and a reconciliation thereof to the most directly comparable GAAP measure. 2 Operational statistics only pertain to our ductile iron pipe products and do not include other services, non-volume based products, or non-core products. Ductile iron pipe revenue accounted for approximately 80% of Water segment revenue. 20

KEY INVESTMENT HIGHLIGHTS 1 Pure-Play Water Infrastructure Manufacturer Positioned to Benefit from Strong Demand Dynamics 2 Leading Market Position with Unmatched Scale and Manufacturing Footprint 3 Deep, Long Standing Channel Relationships with Local and National Customers 4 Expanding Margins Through Enhanced Commercial and Operational Capabilities 5 Experiencing Significant Momentum 6 Strong Cash Flow Generation Directed Toward Debt Reduction 7 Energized and Experienced Management Team 21
Appendix – Non-GAAP Financial Measures

APPENDIX: NON-GAAP FINANCIAL MEASURES In addition to our results calculated under generally accepted accounting principles in the United States ("GAAP"), in this presentation we also present Adjusted EBITDA and Adjusted EBITDA margin. Adjusted EBITDA and Adjusted EBITDA margin are non-GAAP measures and have been presented in this presentation as supplemental measures of financial performance that are not required by, or presented in accordance with GAAP. We calculate Adjusted EBITDA as the sum of net income (loss), before interest expense (including (gains) losses from extinguishment of debt), depreciation and amortization, income tax benefit (expense) and before (gains) losses on the sale of property, plant and equipment, impairment and exit charges and certain other non-recurring income and expenses, such as transaction costs, inventory step-up impacting margin, non-cash compensation expense and pro-rate share of Adjusted EBITDA from equity method investee, minus earnings from equity method investee. Adjusted EBITDA margin represents Adjusted EBITDA as a percentage of net sales. Adjusted EBITDA and Adjusted EBITDA margin are presented in this presentation because they are important metrics used by management as one of the means by which it assesses our financial performance. Adjusted EBITDA and Adjusted EBITDA margin are also frequently used by analysts, investors and other interested parties to evaluate companies in our industry. We use Adjusted EBITDA and Adjusted EBITDA margin as supplements to GAAP measures of performance to evaluate the effectiveness of our business strategies, to make budgeting decisions, to allocate resources and to compare our performance relative to our peers. Adjusted EBITDA and Adjusted EBITDA margin are also important measures for assessing our operating results and evaluating each operating segment’s performance on a consistent basis, by excluding the impacts of depreciation, amortization, income tax expense, interest expense and other items not indicative of ongoing operating performance. Additionally, these measures, when used in conjunction with related GAAP financial measures, provide investors with additional financial analytical framework which management uses, in addition to historical operating results, as the basis for financial, operational and planning decisions and present measurements that third parties have indicated are useful in assessing the Company and its results of operations. Adjusted EBITDA and Adjusted EBITDA margin have certain limitations. Adjusted EBITDA should not be considered as an alternative to consolidated net income (loss), and in the case of our segment results, Adjusted EBITDA should not be considered an alternative to EBITDA, which the chief operating decision maker reviews for purposes of evaluating segment profit, or in the case of any of the non- GAAP measures, as a substitute for any other measure of financial performance calculated in accordance with GAAP. Similarly, Adjusted EBITDA margin should not be considered as an alternative to gross margin or any other margin calculated in accordance with GAAP. These measures also should not be construed as an inference that our future results will be unaffected by unusual or nonrecurring items for which these non-GAAP measures make adjustments. Additionally, Adjusted EBITDA and Adjusted EBITDA margin are not intended to be liquidity measures because of certain limitations such as: (i) they do not reflect our cash outlays for capital expenditures or future contractual commitments; (ii) they do not reflect changes in, or cash requirements for, working capital; (iii) they do not reflect interest expense, or the cash requirements necessary to service interest, or principal payments, on indebtedness; (iv) they do not reflect income tax expense or the cash necessary to pay income taxes; and (v) although depreciation and amortization are non-cash charges, the assets being depreciated and amortized will often have to be replaced in the future, and these non-GAAP measures do not reflect cash requirements for such replacements. This presentation also includes Total debt, a non-GAAP measure that represents the sum of long-term debt, the current portion of long-term debt, debt issuance cost and original issue discount and finance lease liabilities, and Net debt, which represents Total debt less cash and cash equivalents. Management uses these non-GAAP measures as one of the means by which it assesses financial leverage, and they are therefore useful to investors in evaluating our business using the same measures as management. These measures are also useful to investors because they are often used by securities analysts and other interested parties in evaluating our business. The measures do, however, have certain limitations and should not be considered as alternatives to or in isolation from long- term debt or any other measure calculated in accordance with GAAP. Other companies, including other companies in our industry, may not use either measure in the same way or may calculate it differently than as presented herein. This Presentation also includes free cash flow, a non-GAAP liquidity measure that represents cash flow from operating activities, less capital expenditure, net of proceeds from asset disposal. Management uses free cash flow as one of the means by which it assesses available liquidity for strategic opportunities and other discretionary investment, and it is therefore useful to investors in evaluating our business using the same measures as management. Free cash flow is also useful to investors because it is often used by securities analysts and other interested parties in evaluating our operating results. Free cash flow does however have certain limitations due to the fact that it does not represent the total increase or decrease in the cash, cash equivalents and investments balance for the period nor does it represent the residual cash flow available for discretionary expenditures. Therefore, free cash flow should not be considered as an alternative to or in isolation from net cash flows from operating activities or any other measure of cash flow calculated in accordance with GAAP. This presentation also presents both GAAP and non-GAAP financial measures on a last twelve month (“LTM”) basis. LTM information corresponding to fiscal years (i.e., the periods ended Q4 2018 and Q4 2019) reflects our audited historical results for such fiscal years presented in accordance with GAAP. Information presented for other LTM periods (i.e., the periods ended Q1 2019, Q2 2019, Q3 2019, Q1 2020, and Q2 2020) reflect unaudited trailing four quarter financial information calculated by starting with the results from the most recent audited fiscal year included in such LTM period and then (x) adding quarterly information for subsequent fiscal quarters and (y) subtracting quarterly information for the corresponding prior year period. For example, LTM Q2 2020 has been calculated by starting with the data from the twelve months ended Q4 2019 and then adding data for the six months ended Q2 2020, followed by subtracting data for the six months ended Q2 2019. This presentation is not in accordance with GAAP. However, we believe this information is useful to investors as we use it to evaluate our financial performance for ongoing planning purposes, including a continuous assessment of our financial performance in comparison to budgets and internal projections. We also use such LTM financial data to test compliance with covenants under our debt facilities. This presentation has limitations as an analytical tool, and you should not consider it in isolation or as a substitute for analysis of our results as reported under GAAP. Please see our Annual Reports on Form 10-K and Quarterly Reports on Form 10-Q for the relevant periods for the historical amounts used to calculate the LTM information presented. 23
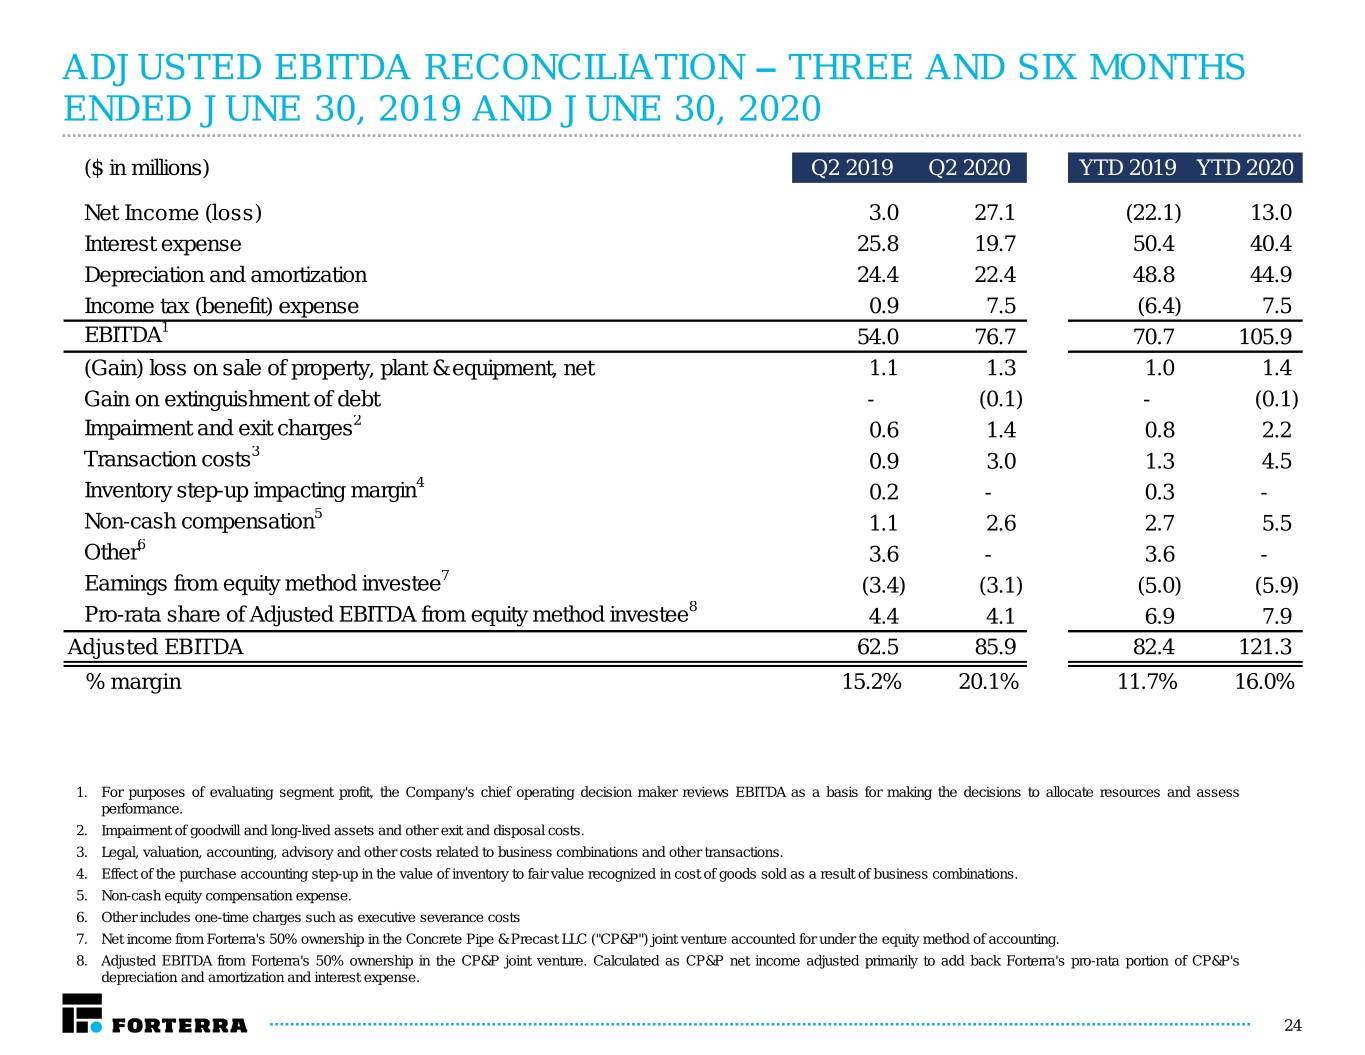
ADJUSTED EBITDA RECONCILIATION – THREE AND SIX MONTHS ENDED JUNE 30, 2019 AND JUNE 30, 2020 ($ in millions) Q2 2019 Q2 2020 YTD 2019 YTD 2020 Net Income (loss) 3.0 27.1 (22.1) 13.0 Interest expense 25.8 19.7 50.4 40.4 Depreciation and amortization 24.4 22.4 48.8 44.9 Income tax (benefit) expense 0.9 7.5 (6.4) 7.5 EBITDA1 54.0 76.7 70.7 105.9 (Gain) loss on sale of property, plant & equipment, net 1.1 1.3 1.0 1.4 Gain on extinguishment of debt - (0.1) - (0.1) Impairment and exit charges2 0.6 1.4 0.8 2.2 Transaction costs3 0.9 3.0 1.3 4.5 Inventory step-up impacting margin4 0.2 - 0.3 - Non-cash compensation5 1.1 2.6 2.7 5.5 Other6 3.6 - 3.6 - Earnings from equity method investee7 (3.4) (3.1) (5.0) (5.9) Pro-rata share of Adjusted EBITDA from equity method investee8 4.4 4.1 6.9 7.9 Adjusted EBITDA 62.5 85.9 82.4 121.3 % margin 15.2% 20.1% 11.7% 16.0% 1. For purposes of evaluating segment profit, the Company's chief operating decision maker reviews EBITDA as a basis for making the decisions to allocate resources and assess performance. 2. Impairment of goodwill and long-lived assets and other exit and disposal costs. 3. Legal, valuation, accounting, advisory and other costs related to business combinations and other transactions. 4. Effect of the purchase accounting step-up in the value of inventory to fair value recognized in cost of goods sold as a result of business combinations. 5. Non-cash equity compensation expense. 6. Other includes one-time charges such as executive severance costs 7. Net income from Forterra's 50% ownership in the Concrete Pipe & Precast LLC ("CP&P") joint venture accounted for under the equity method of accounting. 8. Adjusted EBITDA from Forterra's 50% ownership in the CP&P joint venture. Calculated as CP&P net income adjusted primarily to add back Forterra's pro-rata portion of CP&P's depreciation and amortization and interest expense. 24
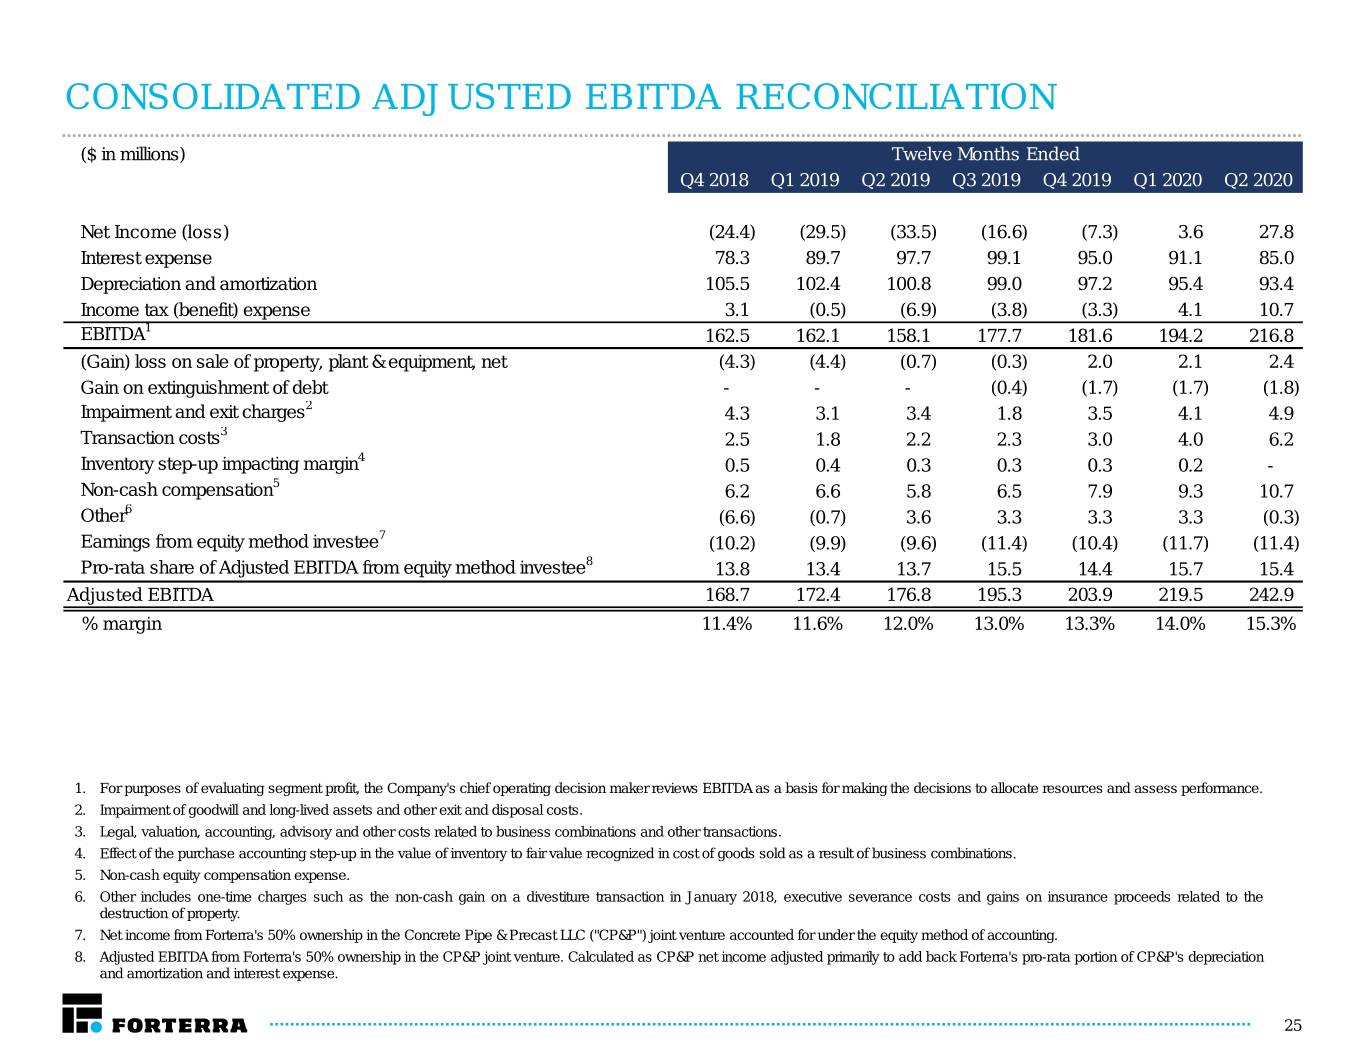
CONSOLIDATED ADJUSTED EBITDA RECONCILIATION ($ in millions) Twelve Months Ended Q4 2018 Q1 2019 Q2 2019 Q3 2019 Q4 2019 Q1 2020 Q2 2020 Net Income (loss) (24.4) (29.5) (33.5) (16.6) (7.3) 3.6 27.8 Interest expense 78.3 89.7 97.7 99.1 95.0 91.1 85.0 Depreciation and amortization 105.5 102.4 100.8 99.0 97.2 95.4 93.4 Income tax (benefit) expense 3.1 (0.5) (6.9) (3.8) (3.3) 4.1 10.7 EBITDA1 162.5 162.1 158.1 177.7 181.6 194.2 216.8 (Gain) loss on sale of property, plant & equipment, net (4.3) (4.4) (0.7) (0.3) 2.0 2.1 2.4 Gain on extinguishment of debt - - - (0.4) (1.7) (1.7) (1.8) Impairment and exit charges2 4.3 3.1 3.4 1.8 3.5 4.1 4.9 Transaction costs3 2.5 1.8 2.2 2.3 3.0 4.0 6.2 Inventory step-up impacting margin4 0.5 0.4 0.3 0.3 0.3 0.2 - Non-cash compensation5 6.2 6.6 5.8 6.5 7.9 9.3 10.7 Other6 (6.6) (0.7) 3.6 3.3 3.3 3.3 (0.3) Earnings from equity method investee7 (10.2) (9.9) (9.6) (11.4) (10.4) (11.7) (11.4) Pro-rata share of Adjusted EBITDA from equity method investee8 13.8 13.4 13.7 15.5 14.4 15.7 15.4 Adjusted EBITDA 168.7 172.4 176.8 195.3 203.9 219.5 242.9 % margin 11.4% 11.6% 12.0% 13.0% 13.3% 14.0% 15.3% 1. For purposes of evaluating segment profit, the Company's chief operating decision maker reviews EBITDA as a basis for making the decisions to allocate resources and assess performance. 2. Impairment of goodwill and long-lived assets and other exit and disposal costs. 3. Legal, valuation, accounting, advisory and other costs related to business combinations and other transactions. 4. Effect of the purchase accounting step-up in the value of inventory to fair value recognized in cost of goods sold as a result of business combinations. 5. Non-cash equity compensation expense. 6. Other includes one-time charges such as the non-cash gain on a divestiture transaction in January 2018, executive severance costs and gains on insurance proceeds related to the destruction of property. 7. Net income from Forterra's 50% ownership in the Concrete Pipe & Precast LLC ("CP&P") joint venture accounted for under the equity method of accounting. 8. Adjusted EBITDA from Forterra's 50% ownership in the CP&P joint venture. Calculated as CP&P net income adjusted primarily to add back Forterra's pro-rata portion of CP&P's depreciation and amortization and interest expense. 25

SEGMENT ADJUSTED EBITDA RECONCILIATION – THREE AND SIX MONTHS ENDED JUNE 30, 2019 AND JUNE 30, 2020 DRAINAGE PIPE & PRODUCTS WATER PIPE & PRODUCTS ($ in millions) Q2 2019 Q2 2020 YTD 2019 YTD 2020 Q2 2019 Q2 2020 YTD 2019 YTD 2020 1 EBITDA $49.0 $57.4 $74.1 $83.5 $25.0 $39.7 $33.7 $62.6 (Gain) loss on sale of property, plant & equipment, net 0.9 (0.3) 0.8 (0.4) 0.2 1.7 0.3 1.7 Impairment and exit charges2 0.1 - 0.1 - 0.5 1.4 0.7 2.2 Inventory step-up impacting margin3 0.2 - 0.3 - - - - - Non-cash compensation4 0.8 0.3 0.9 1.0 0.2 0.4 0.2 0.6 Other5 0.4 0.4 0.8 0.8 (0.4) (0.4) (0.8) (0.8) Earnings from equity method investee6 (3.4) (3.1) (5.0) (5.9) - - - - Pro-rata share of Adjusted EBITDA from equity method investee7 4.4 4.1 6.9 7.9 - - - - Adjusted EBITDA $52.4 $58.8 $78.9 $86.8 $25.4 $42.7 $34.1 $66.3 % margin 21.7% 24.9% 19.5% 21.4% 15.1% 22.4% 11.5% 18.9% 1. For purposes of evaluating segment profit, the Company's chief operating decision maker reviews EBITDA as a basis for making the decisions to allocate resources and assess performance. 2. Impairment of goodwill and long-lived assets and other exit and disposal costs. 3. Effect of the purchase accounting step-up in the value of inventory to fair value recognized in cost of goods sold as a result of business combinations. 4. Non-cash equity compensation expense. 5. Inter-segment charges that are eliminated upon consolidation. 6. Net income from Forterra's 50% ownership in the Concrete Pipe & Precast LLC ("CP&P") joint venture accounted for under the equity method of accounting. 7. Adjusted EBITDA from Forterra's 50% ownership in the CP&P joint venture. Calculated as CP&P net income adjusted primarily to add back Forterra's pro-rata portion of CP&P's depreciation and amortization and interest expense. 26

SEGMENT ADJUSTED EBITDA RECONCILIATION – TWELVE MONTHS ENDED DECEMBER 31, 2016, 2017, 2018 AND 2019 DRAINAGE PIPE & PRODUCTS WATER PIPE & PRODUCTS ($ in millions) 2016 2017 2018 2019 2016 2017 2018 2019 1 EBITDA $138.3 $129.6 $156.7 $171.4 $98.6 $47.6 $64.5 $84.4 (Gain) loss on sale of property, plant & equipment, net 15.5 - (5.6) 1.6 5.7 2.1 1.3 0.5 Impairment and exit charges2 0.2 - 1.9 0.2 1.9 12.4 2.5 3.3 Transaction costs3 - - - - 0.5 - - - Inventory step-up impacting margin4 4.5 2.5 0.5 0.3 10.6 - - - Loss on Business Divestiture5 - - - - - 32.3 - - Non-cash compensation6 - 0.7 1.7 1.6 - 0.4 0.3 0.4 Costs associated with Disposed Sites7 0.2 - - - - - - - Other8 - - 0.9 1.6 (3.3) (1.0) (1.7) (1.6) Earnings from equity method investee9 (11.9) (12.4) (10.2) (10.5) - - - - Pro-rata share of Adjusted EBITDA from equity method investee10 15.1 16.7 13.8 14.4 - - - - Adjusted EBITDA $161.9 $137.1 $159.7 $180.6 $114.0 $93.8 $66.9 $87.0 % margin 22.2% 16.4% 19.7% 20.2% 18.0% 12.6% 10.0% 13.7% Note: Forterra changed the methodology for its calculation of Adjusted EBITDA in Q3 2018 to include the Adjusted EBITDA associated with Forterra’s 50% ownership in the Concrete Pipe & Precast LLC joint venture, which is accounted for under the equity method of accounting. All amounts for periods prior to Q3 2018 were revised to reflect the current presentation in all subsequent public disclosures thereof, and have been similarly updated herein. Adjusted EBITDA for 2016, as calculated pursuant to the current methodology, has not been previously publicly disclosed and the change in methodology increased Adjusted EBITDA for the year ended 2016 by $3.2 million compared to the previously disclosed amount. 1 For purposes of evaluating segment profit, the Company's chief operating decision maker reviews EBITDA as a basis for making the decisions to allocate resources and assess performance. 2 Impairment or abandonment of long-lived assets and other exit charges. 3 Legal, valuation, accounting, advisory and other costs related to business combinations and other transactions. 4 Effect of the purchase accounting step-up in the value of inventory to fair value recognized in cost of goods sold as a result of business combinations. 5 Loss on divestiture of U.S. concrete and steel pressure pipe business, net of specific items for which adjustments are separately made elsewhere in the calculation of adjusted EBITDA presented herein. 6 Non-cash equity compensation expense. 7 Results of operations of our disposed sites for the periods presented, net of specific items for which adjustments are separately made elsewhere in the calculation of adjusted EBITDA presented herein. 8 Other one-time charges or gains. 9 Net income from Forterra's 50% ownership in the CP&P joint venture accounted for under the equity method of accounting. 10 Adjusted EBITDA from Forterra's 50% ownership in the CP&P joint venture. Calculated as CP&P net income adjusted primarily to add back Forterra's pro-rata portion of CP&P's depreciation and amortization and interest expense. 27

SEGMENT ADJUSTED EBITDA RECONCILIATION – LAST TWELVE MONTH (“LTM”) ($ in millions) DRAINAGE PIPE & PRODUCTS WATER PIPE & PRODUCTS Q2 2020 LTM Q2 2020 LTM EBITDA1 180.8 113.3 Loss on sale of property, plant & equipment, net 0.4 2.0 Impairment and exit charges2 0.1 4.8 Non-cash compensation3 1.7 0.8 Other4 1.6 (1.6) Earnings from equity method investee5 (11.4) - Pro-rata share of Adjusted EBITDA from equity method investee6 15.4 - Adjusted EBITDA 188.5 119.2 % margin 21.1% 17.3% 1. For purposes of evaluating segment profit, the Company's chief operating decision maker reviews EBITDA as a basis for making the decisions to allocate resources and assess performance. 2. Impairment of goodwill and long-lived assets and other exit and disposal costs. 3. Non-cash equity compensation expense. 4. Inter-segment charges that are eliminated upon consolidation. 5. Net income from Forterra's 50% ownership in the Concrete Pipe & Precast LLC ("CP&P") joint venture accounted for under the equity method of accounting. 6. Adjusted EBITDA from Forterra's 50% ownership in the CP&P joint venture. Calculated as CP&P net income adjusted primarily to add back Forterra's pro-rata portion of CP&P's depreciation and amortization and interest expense. 28
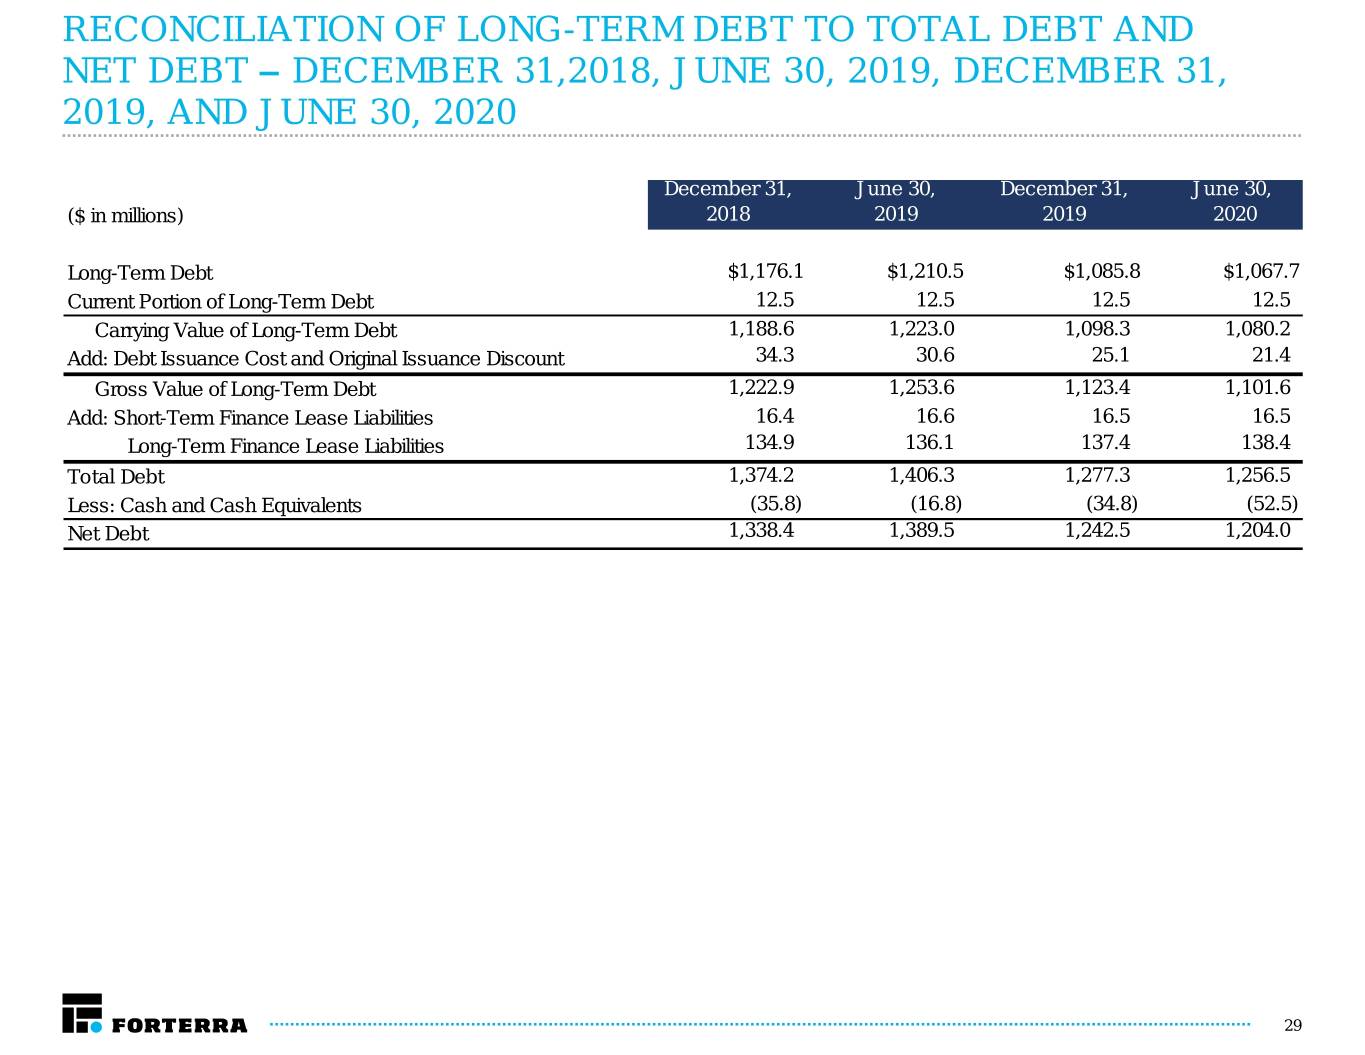
RECONCILIATION OF LONG-TERM DEBT TO TOTAL DEBT AND NET DEBT – DECEMBER 31,2018, JUNE 30, 2019, DECEMBER 31, 2019, AND JUNE 30, 2020 December 31, June 30, December 31, June 30, ($ in millions) 2018 2019 2019 2020 Long-Term Debt $1,176.1 $1,210.5 $1,085.8 $1,067.7 Current Portion of Long-Term Debt 12.5 12.5 12.5 12.5 Carrying Value of Long-Term Debt 1,188.6 1,223.0 1,098.3 1,080.2 Add: Debt Issuance Cost and Original Issuance Discount 34.3 30.6 25.1 21.4 Gross Value of Long-Term Debt 1,222.9 1,253.6 1,123.4 1,101.6 Add: Short-Term Finance Lease Liabilities 16.4 16.6 16.5 16.5 Long-Term Finance Lease Liabilities 134.9 136.1 137.4 138.4 Total Debt 1,374.2 1,406.3 1,277.3 1,256.5 Less: Cash and Cash Equivalents (35.8) (16.8) (34.8) (52.5) Net Debt 1,338.4 1,389.5 1,242.5 1,204.0 29

RECONCILIATION OF FREE CASH FLOW – SIX MONTHS ENDED JUNE 30, 2019 AND 2020 Six Months Ended June 30, ($ in millions) 2019 2020 Net Cash Provided by (Used in) Operating Activities ($27.3) $40.2 Net Cash Provided by (Used in) Investing Activities (24.5) 1.5 Net Cash Provided by (Used in) Financing Activities 32.4 (23.6) Net Cash Provided by (Used in) Operating Activities ($27.3) $40.2 Purchase of property, plant and equipment and intangible assets (34.1) (9.1) Proceeds from sale of fixed assets 9.5 10.6 Free Cash Flow ($51.9) $41.7 Note: The Company defines free cash flow as net cash flow from operations accounted for under GAAP, less capital expenditures and cash paid for intangible assets, plus proceeds from sale of fixed assets. Free cash flow is not a GAAP measurement and may not be comparable to free cash flow reported by other companies. 30
