Attached files
| file | filename |
|---|---|
| EX-99.1 - EX-99.1 - FIRST CITIZENS BANCSHARES INC /DE/ | earningsrelease-q22020.htm |
| 8-K - 8-K - FIRST CITIZENS BANCSHARES INC /DE/ | fcnca-20200728.htm |

Exhibit 99.2 First Citizens BancShares Second Quarter 2020 Earnings July 29, 2020
2 Forward Looking Statements . This presentation may contain forward-looking statements with respect to First Citizens BancShares, Inc.’s (the “Corporation”) financial condition, results of operations and business within the meaning of the Private Securities Litigation Reform Act of 1995, Section 27A of the Securities Act of 1933, as amended, and Section 21E of the Securities Exchange Act of 1934, as amended. Forward-looking statements can be identified by the use of words such as "may," "should," "will," "could," "estimates," "predicts," "potential," "continue," "anticipates," "believes," "plans," "expects," "future," "intends,“, “forecasts," “projects,” the negative of these terms and other comparable terminology. These forward looking statements may include projections of, or guidance on, the Corporation’s future financial performance, expected levels of future expenses, anticipated growth strategies, descriptions of new business initiatives and anticipated trends in the Corporation’s business or financial results. . Forward-looking statements are neither historical facts, nor assurance of future performance. Instead, they are based on current beliefs, expectations and assumptions of the Corporation's management regarding the future of the Corporation’s business, future plans and strategies, projections, anticipated events and trends, the economy and other future conditions. Because forward-looking statements relate to the future, they are subject to inherent uncertainties, risks and changes in circumstances that are difficult to predict and many of which are outside of the Corporation’s control. The Corporation’s actual results and financial condition may differ materially from those indicated in the forward-looking statements. Therefore, you should not unduly rely on any of these forward- looking statements. Any forward-looking statement is based only on information currently available and speaks only as of the date when made. The Corporation undertakes no obligation, other than as required by law, to update or revise any forward-looking statements, whether as a result of new information, future events or otherwise. . Factors that could influence the accuracy of those forward-looking statements include, but are not limited to, the financial success or changing strategies of the Corporation’s customers, customer acceptance of the Corporation’s services, products and fee structure, the competitive nature of the financial services industry, the Corporation’s ability to compete effectively against other financial institutions in its banking markets, actions of government regulators, the level of market interest rates and the Corporation’s ability to manage its interest rate risk, changes in general economic conditions that affect the Corporation’s loan and lease portfolio, the ability of the Corporation’s borrowers to repay their loans and leases, the values of real estate and other collateral, the impact of acquisitions, and the impacts of COVID-19 on the Corporation's business and on its customers. A discussion of additional risks and uncertainties affecting the Corporation can be found in the sections entitled “Risk Factors” and “Management’s Discussion and Analysis of Financial Condition and Results of Operations” in the Corporation’s Annual Report on Form 10-K for the year ended December 31, 2019, which has been filed with the Securities and Exchange Commission (the “SEC”) and is accessible at the Investor Relations section of the Corporation’s website (www.fistcitizens.com) and on the SEC’s website (www.sec.gov). . The Corporation uses certain non-GAAP financial measures in this presentation. These non-GAAP financial measures are reconciled to the most comparable GAAP measures at the end of this presentation. Non-GAAP financial measures are commonly used in the Corporation’s industry, have certain limitations and should not be construed as alternatives to financial measures determined in accordance with GAAP. Non-GAAP financial measures used by the Corporation may not be comparable to similarly named non-GAAP financial measures used by other companies and should be considered only as supplemental to, and not as superior to, financial measures prepared in accordance with GAAP.
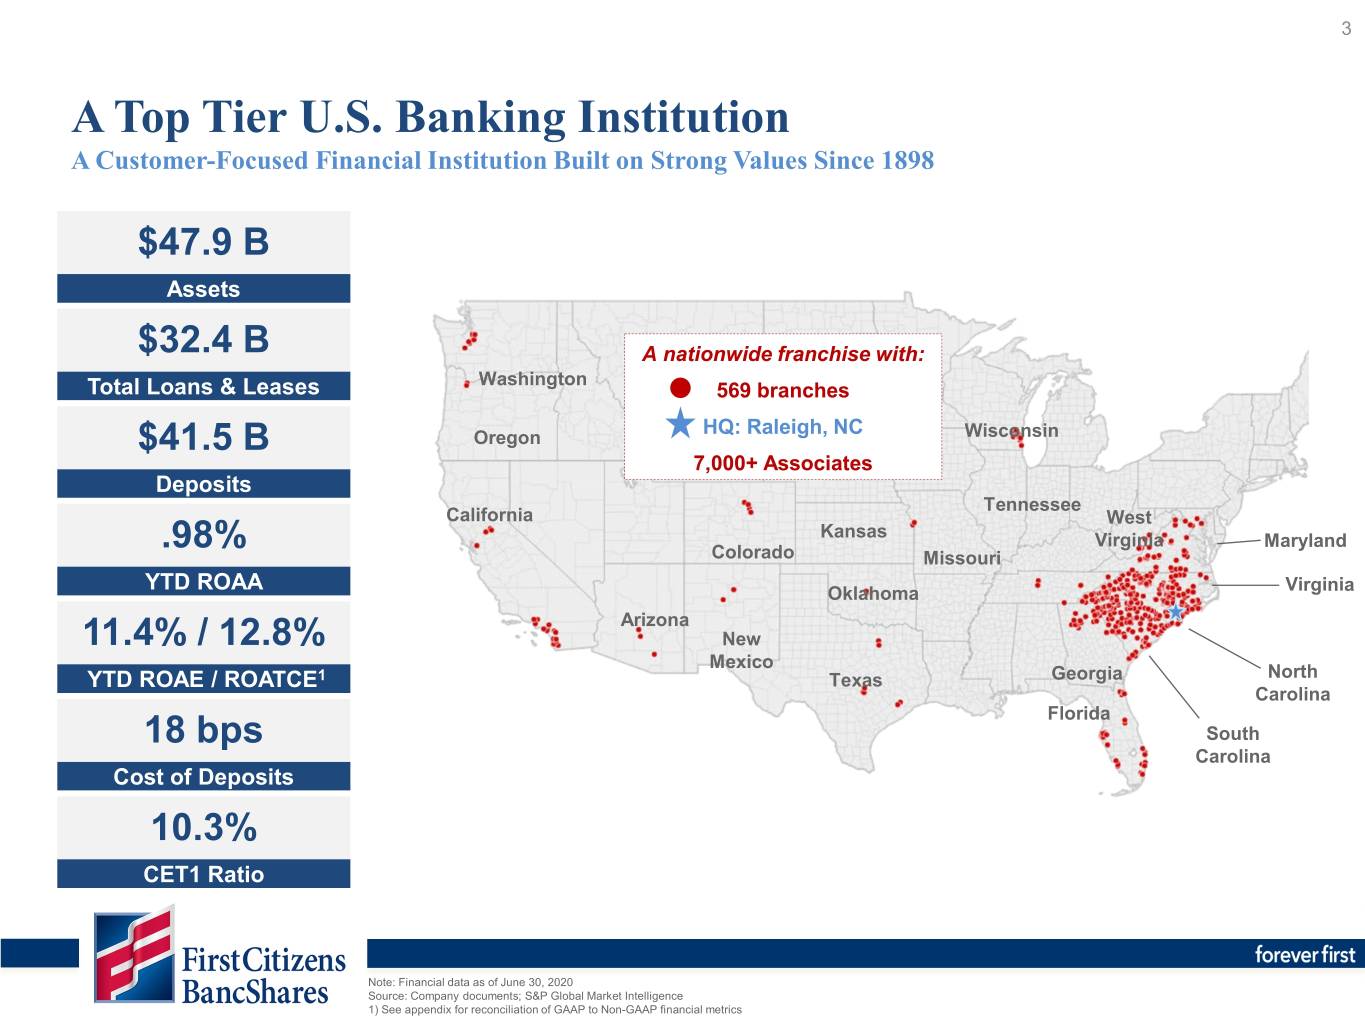
3 A Top Tier U.S. Banking Institution A Customer-Focused Financial Institution Built on Strong Values Since 1898 $47.9 B Assets $32.4 B A nationwide franchise with: Washington Total Loans & Leases 569 branches HQ: Raleigh, NC $41.5 B Oregon Wisconsin 7,000+ Associates Deposits Tennessee California West .98% Kansas Virginia Maryland Colorado Missouri YTD ROAA Oklahoma Virginia Arizona 11.4% / 12.8% New Mexico YTD ROAE / ROATCE1 Texas Georgia North Carolina Florida 18 bps South Carolina Cost of Deposits 10.3% CET1 Ratio Note: Financial data as of June 30, 2020 Source: Company documents; S&P Global Market Intelligence 1) See appendix for reconciliation of GAAP to Non-GAAP financial metrics

4 Key Drivers of Long-Term Success 1. Over 122 years of successful operating history spanning various economic cycles 2. High quality balance sheet with an excellent liquidity position . Strong, low-cost core deposit base with a concentration in high-growth Southeast markets, supplemented with 3 steady growth markets 4. High-touch community banking approach with excellent middle market and small business reach 5. Branch and associate network built to generate and retain a low-cost funding profile and associated fee income businesses 6. Extensive track record of sustainable profitability positioned to drive accelerated core earnings growth 7. Fortified and well-planned infrastructure capable of scaling up through acquisitions 8. Continued investments in customer-facing technology to maintain capabilities with the evolving banking market 9. Opportunistically optimizing capital structure through organic growth, acquisitions and share repurchases 10. Positive and transparent relationship with primary regulators, external accountants, stakeholders and shareholders
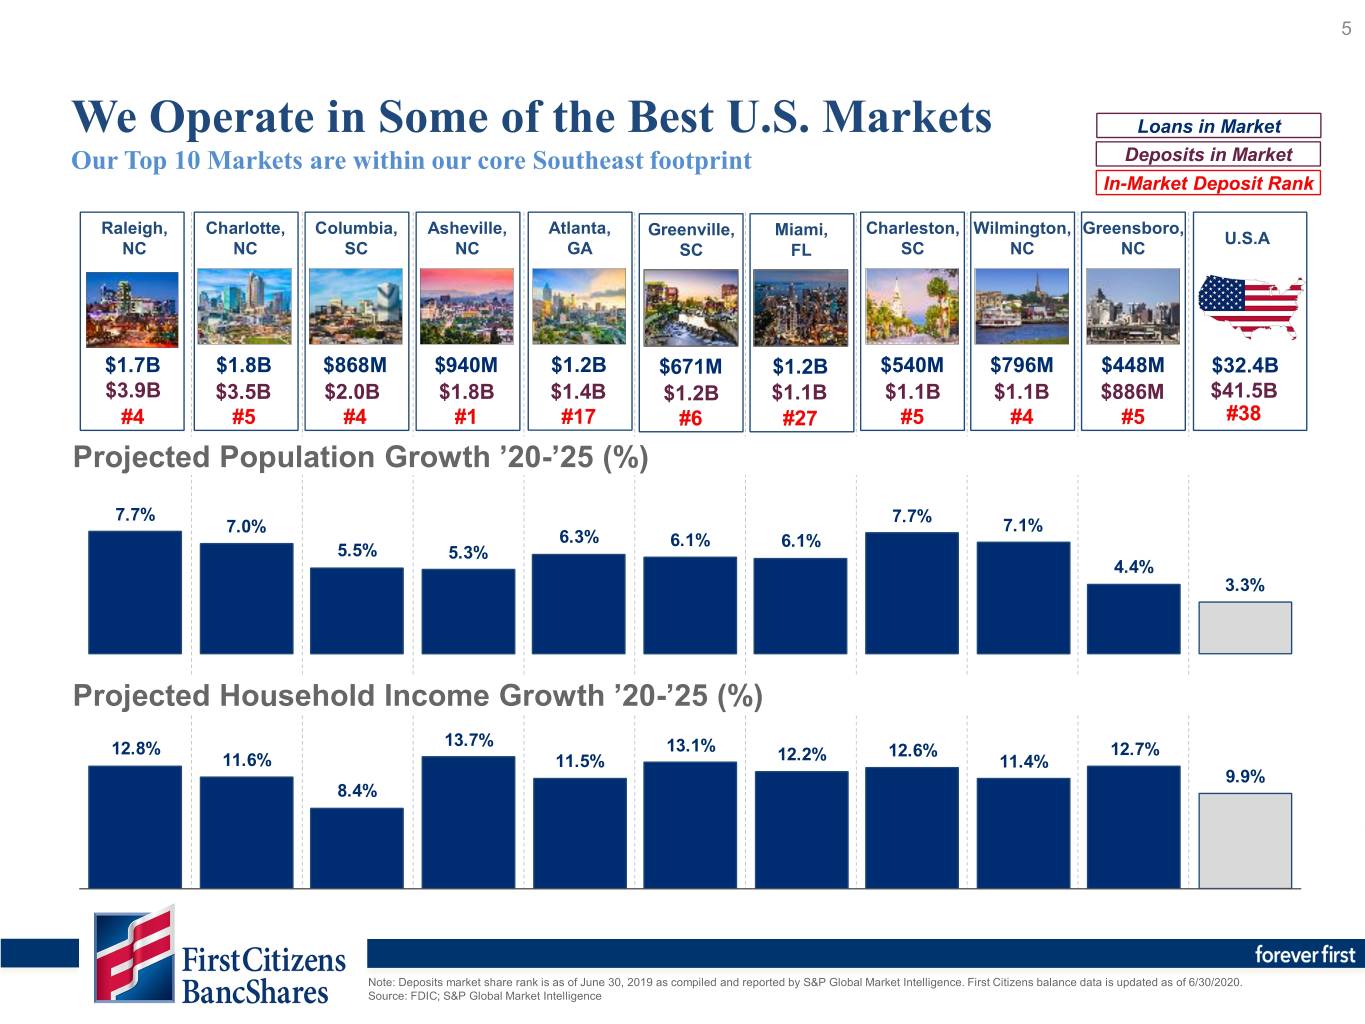
5 We Operate in Some of the Best U.S. Markets Loans in Market Our Top 10 Markets are within our core Southeast footprint Deposits in Market In-Market Deposit Rank Raleigh, Charlotte, Columbia, Asheville, Atlanta, Greenville, Miami, Charleston, Wilmington, Greensboro, U.S.A NC NC SC NC GA SC FL SC NC NC $1.7B $1.8B $868M $940M $1.2B $671M $1.2B $540M $796M $448M $32.4B $3.9B $3.5B $2.0B $1.8B $1.4B $1.2B $1.1B $1.1B $1.1B $886M $41.5B #4 #5 #4 #1 #17 #6 #27 #5 #4 #5 #38 Projected Population Growth ’20-’25 (%) 7.7% 7.7% 7.0% 7.1% 6.3% 6.1% 6.1% 5.5% 5.3% 4.4% 3.3% Projected Household Income Growth ’20-’25 (%) 13.7% 12.8% 13.1% 12.6% 12.7% 11.6% 11.5% 12.2% 11.4% 9.9% 8.4% Note: Deposits market share rank is as of June 30, 2019 as compiled and reported by S&P Global Market Intelligence. First Citizens balance data is updated as of 6/30/2020. Source: FDIC; S&P Global Market Intelligence
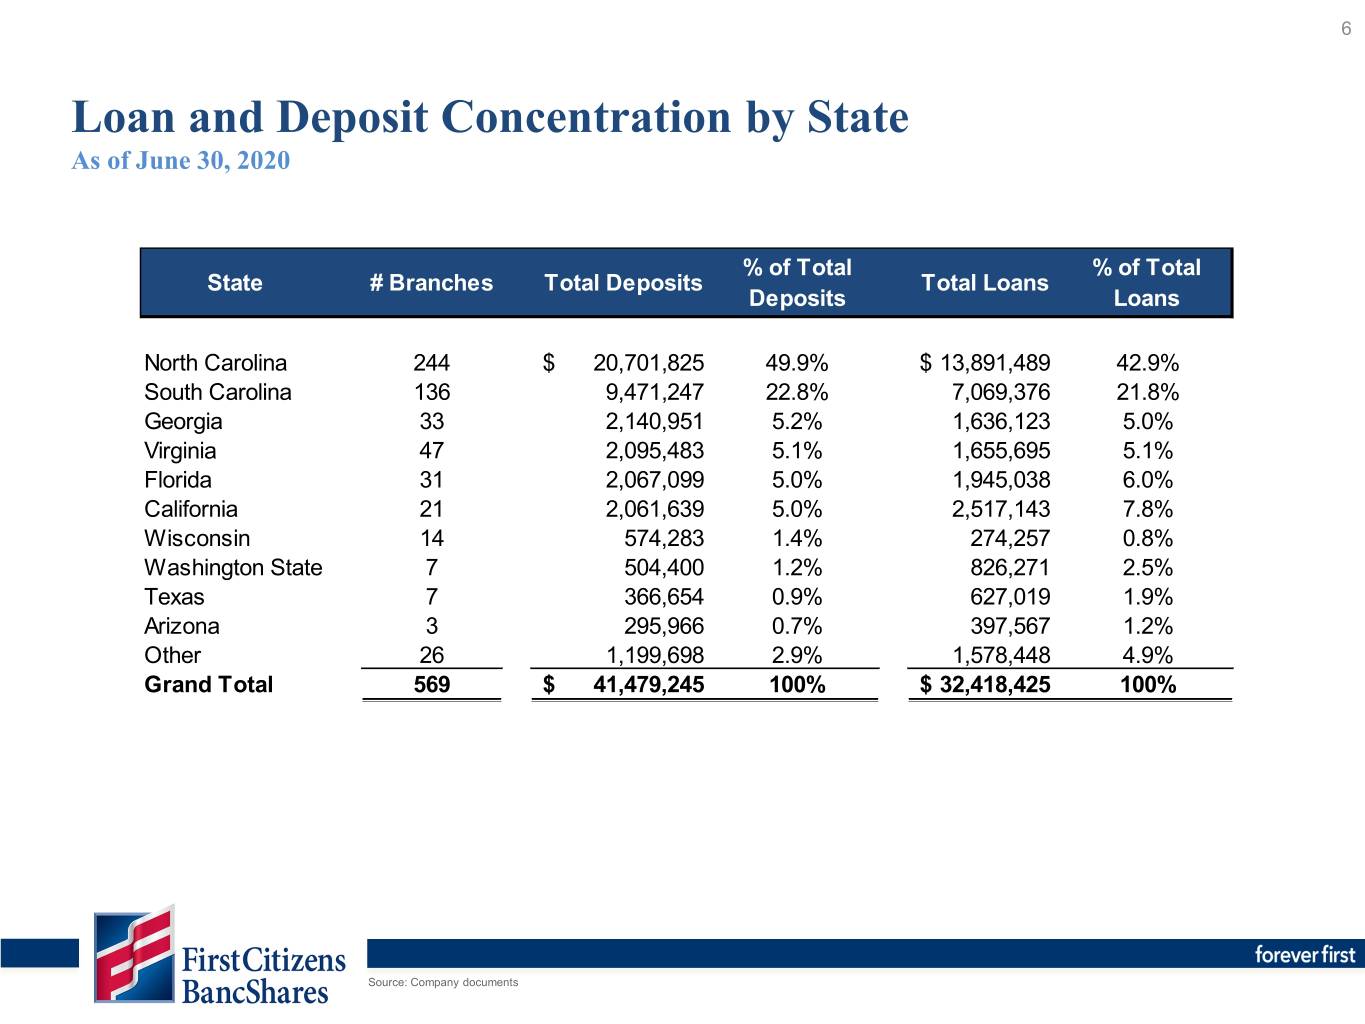
6 Loan and Deposit Concentration by State As of June 30, 2020 % of Total % of Total State # Branches Total Deposits Total Loans Deposits Loans North Carolina NC 244 $ 20,701,825 49.9% $ 13,891,489 42.9% South Carolina SC 136 9,471,247 22.8% 7,069,376 21.8% Georgia GA 33 2,140,951 5.2% 1,636,123 5.0% Virginia VA 47 2,095,483 5.1% 1,655,695 5.1% Florida FL 31 2,067,099 5.0% 1,945,038 6.0% California CA 21 2,061,639 5.0% 2,517,143 7.8% Wisconsin WA 14 574,283 1.4% 274,257 0.8% Washington State CO 7 504,400 1.2% 826,271 2.5% Texas TX 7 366,654 0.9% 627,019 1.9% Arizona NM 3 295,966 0.7% 397,567 1.2% Other 26 1,199,698 2.9% 1,578,448 4.9% Grand Total 569 $ 41,479,245 100% $ 32,418,425 100% Source: Company documents

7 Diversified Loan Portfolio with Strong Asset Quality Asset Quality Highlights Total Loans: $32.4B 0.94% 0.77% Yield: NPAs¹ / Loans + OREO NPAs¹ / Assets 4.10% 18% 9 bps 0.76% NCOs / Average Loans Reserves / Loans2 125% 32% CRE Loans/ TRBC C&D Loans / TRBC $36.1 million YTD reserve build to the ACL related to the 69% 31% potential impact of COVID-19 Fixed Loans/Total Loans2 Variable Loans/Total Loans2 Note: Financial data as of June 30, 2020; Concentration shown as a percent of Total RBC; Fixed, and Floating / Variable Loans shown as a percent of total loans and leases; Source: Company documents; S&P Global Market Intelligence 1) Nonperforming assets defined as nonaccrual loans plus other real estate owned 2) Excludes SBA-PPP loans

8 Historical Credit Quality Comparison Maintaining Solid Risk Management and Consistent Profitability NCOs / Average Loans (bps) ROAA (bps) 98 77 78 61 58 81 83 68 56 66 93 92 63 78 57 68 70 94 115 123 57 136 Nonperforming Assets1 / Loans (%) Note: Financial data as of June 30, 2020; U.S. Banks reflects all depositories headquartered in the U.S. as aggregated and defined by S&P Global Market Intelligence. Source: Company documents; S&P Global Market Intelligence 1) Nonperforming assets defined as nonaccrual loans plus other real estate owned, and presented for non-PCD loans only.
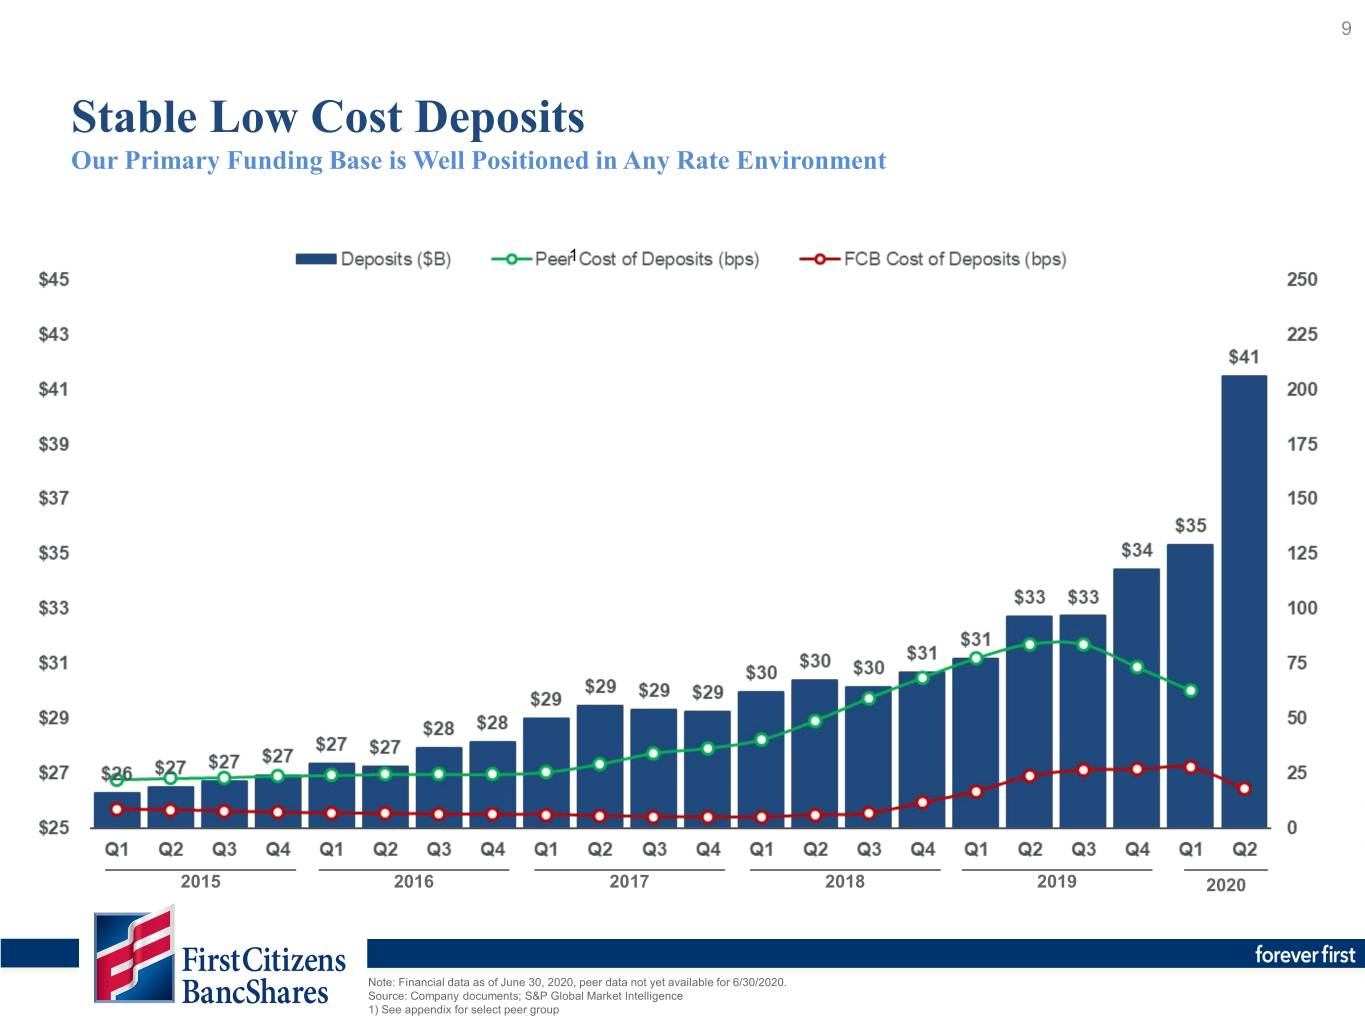
9 Stable Low Cost Deposits Our Primary Funding Base is Well Positioned in Any Rate Environment 1 2015 2016 2017 2018 2019 2020 Note: Financial data as of June 30, 2020, peer data not yet available for 6/30/2020. Source: Company documents; S&P Global Market Intelligence 1) See appendix for select peer group
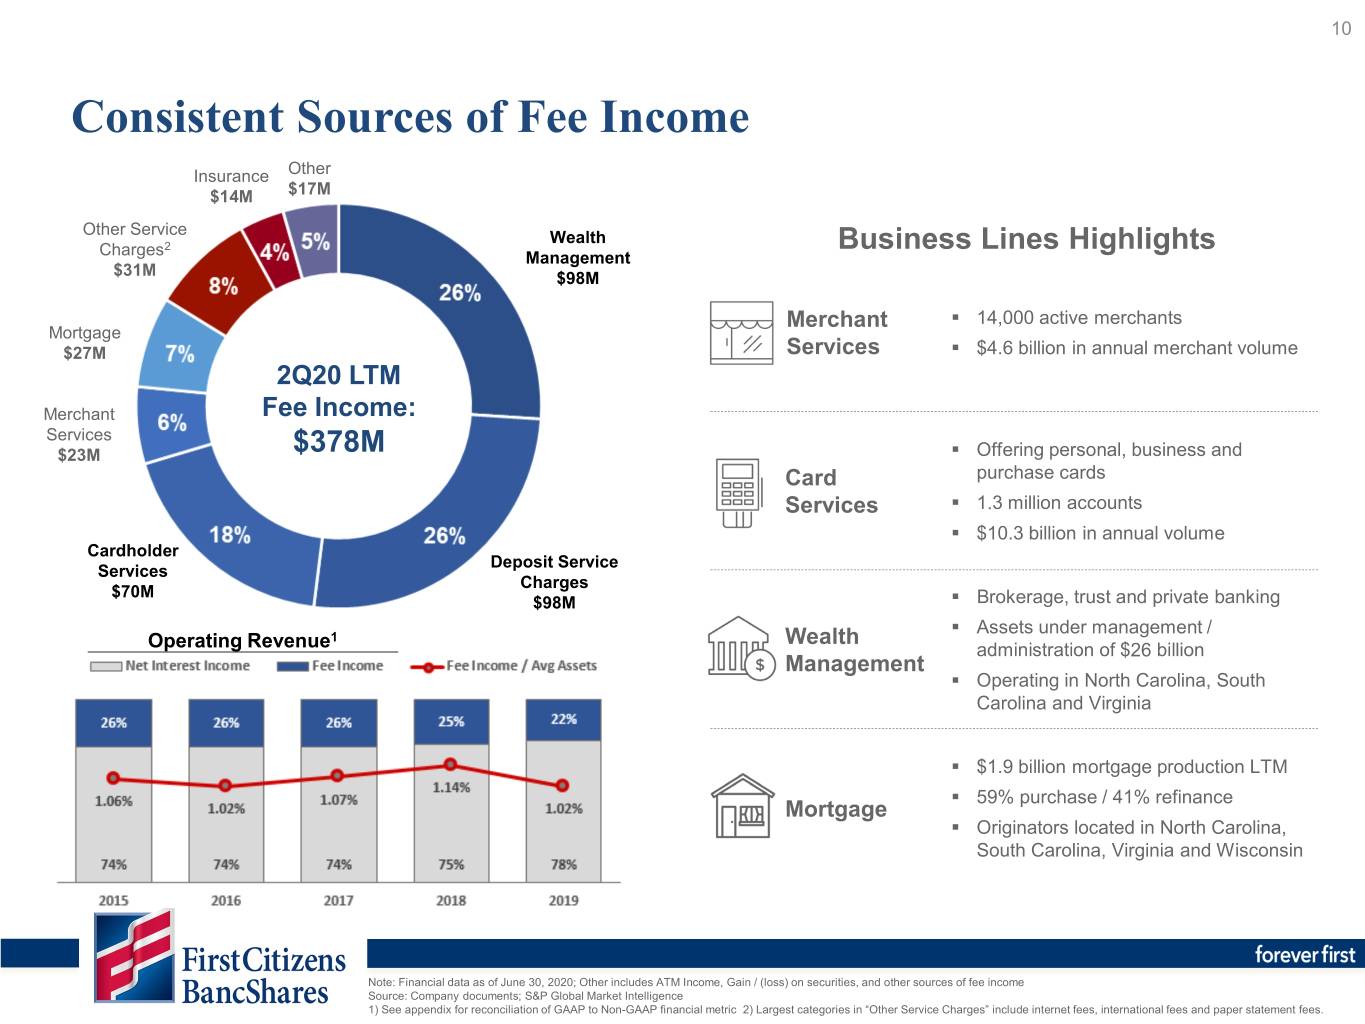
10 Consistent Sources of Fee Income Insurance Other $14M $17M Other Service Wealth Charges2 Business Lines Highlights Management $31M $98M Merchant . 14,000 active merchants Mortgage $27M Services . $4.6 billion in annual merchant volume 2Q20 LTM Merchant Fee Income: Services $23M $378M . Offering personal, business and Card purchase cards Services . 1.3 million accounts . $10.3 billion in annual volume Cardholder Deposit Service Services Charges $70M $98M . Brokerage, trust and private banking . Assets under management / 1 Wealth Operating Revenue administration of $26 billion Management . Operating in North Carolina, South Carolina and Virginia . $1.9 billion mortgage production LTM . 59% purchase / 41% refinance Mortgage . Originators located in North Carolina, South Carolina, Virginia and Wisconsin Note: Financial data as of June 30, 2020; Other includes ATM Income, Gain / (loss) on securities, and other sources of fee income Source: Company documents; S&P Global Market Intelligence 1) See appendix for reconciliation of GAAP to Non-GAAP financial metric 2) Largest categories in “Other Service Charges” include internet fees, international fees and paper statement fees.

11 Extensive and Diligent M&A Experience Helps Supplement Organic Growth A Proven History of Growth… …as an Experienced Acquiror… …with a Strong Regulatory Position Assets ($B) Growth (%) '19 $40 FDIC Target Deposits '18 $35 Date Name ST ($M) '17 $35 '16 $33 05/05/17 Guaranty Bank (MHC) WI $982.3 '15 $31 ‘10 – ’19 '14 $30 $8.5B assets 01/13/17 Harvest Community Bank NJ 121.8 2010’s '13 $21 116% '12 $21 05/06/16 First CornerStone Bank PA 96.9 '11 $21 '10 $21 03/11/16 North Milwaukee ST Bank WI 59.2 '09 $18 '08 $17 02/13/15 Capitol City Bank & Trust GA 266.4 '07 $16 $1.7B assets '06 $16 07/08/11 Colorado Capital Bank CO 606.5 '05 $15 '04 $13 ‘00 – ’09 Biscayne Bancshares, Inc. 06/03/11 Atlantic Bank & Trust SC 183.4 2000’s '03 $13 90% '02 $12 01/21/11 United Western Bank CO 1,604.9 '01 $12 $1.0B assets '00 $11 07/23/10 Williamsburg FNB SC 95.1 '99 $10 '98 $10 03/05/10 Sun American Bank FL 420.0 '97 $9 '96 $8 $955M assets 01/29/10 First Regional Bank CA 1,287.7 '95 $7 '94 $6 ‘90 – ’99 09/25/09 Georgian Bank GA 1,281.9 1990’s '93 $6 163% Community Bankshares, Inc. '92 $5 09/11/09 Venture Bank WA 709.1 '91 $5 $625M assets '90 $5$4 07/17/09 Temecula Valley Bank CA 965.4 Note: Financial data as of June 30, 2020; Growth values reflect the Q4 of previous decade (i.e. ’90 – ’99 reflects the growth from Q4 ‘89 to Q4’99); Deposits from FDIC transactions reflect the amount of deposits assumed. Source: Company documents; S&P Global Market Intelligence
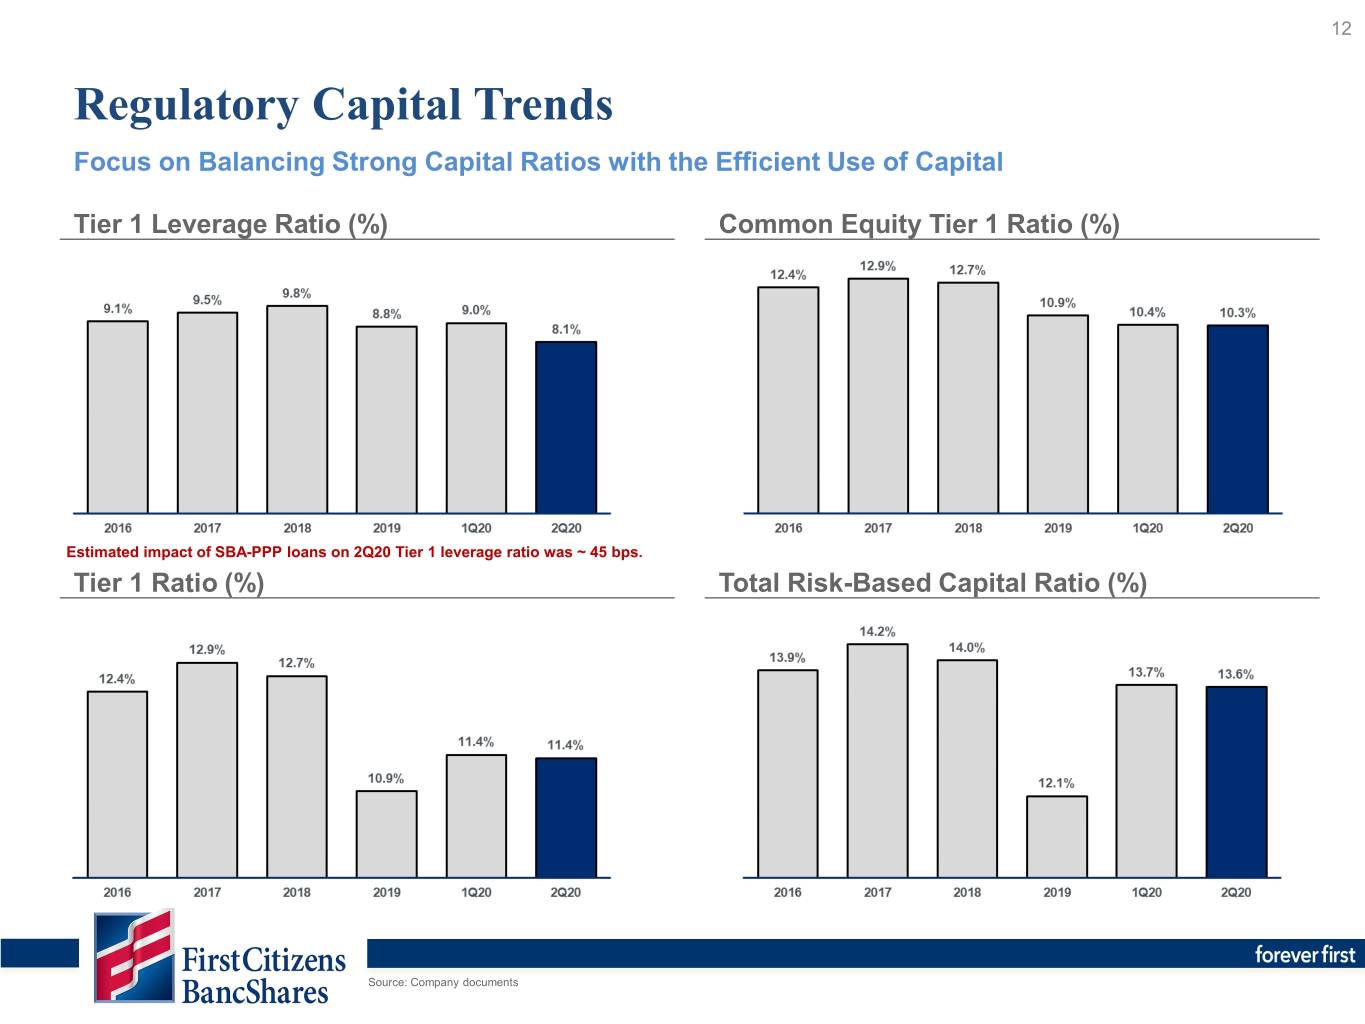
12 Regulatory Capital Trends Focus on Balancing Strong Capital Ratios with the Efficient Use of Capital Tier 1 Leverage Ratio (%) Common Equity Tier 1 Ratio (%) Estimated impact of SBA-PPP loans on 2Q20 Tier 1 leverage ratio was ~ 45 bps. Tier 1 Ratio (%) Total Risk-Based Capital Ratio (%) Source: Company documents

13 Strong and Experienced Management Team Executives with Long Tenure at First Citizens; Many Have Spent Entire Careers with First Citizens Frank B. Holding Jr. Mr. Frank Brown Holding, Jr. has been Chairman since February 2009 and Chief Executive Officer since January 2008. He Chairman & CEO Age: 59 previously served as Chief Executive Officer of former subsidiary, IronStone Bank, from February 2009 to January 2011, and President of First Citizens BancShares, Inc. and First Citizens Bank from 1994 to February 2009. He has been employed by First Citizens Bank since 1983. Hope Holding Bryant Ms. Hope Holding Bryant has been Vice Chairman since January 2011 and Corporate Sales Executive since October 2014. Vice Chairman Age: 57 She previously served as President of former subsidiary, IronStone Bank, from 2006 until January 2011. She has served as an Executive Vice President of the Bank from 2002 until January 2011, and has been employed by First Citizens Bank since 1986. Peter M. Bristow Mr. Peter M. Bristow has been President and Corporate Sales Executive since October 2014. He previously served as President Age: 54 Executive Vice President and Chief Operating Officer of First Citizens Bancorporation Inc., and President and Chief Operating Officer of First Citizens -SC from 2001 to 2014. He has been employed by First Citizens Bank since 1991. Craig L. Nix Mr. Craig L. Nix has been Chief Financial Officer since November 2014. He previously served as Executive Vice President Chief Financial Officer Age: 48 and Chief Financial Officer of First Citizens Bancorporation Inc. and First Citizens Bank -SC from 2001 to 2014. He has been employed by First Citizens Bank since 1999. Lorie K. Rupp Ms. Lorie K. Rupp has been Chief Risk Officer since March 2017. She previously served as Chief Accounting Officer from Chief Risk Officer Age: 55 2013 to 2017. She was a Consulting Director with KPMG, LLP from 2011 to 2013, Senior Vice President of Accounting and Finance of Regions Financial Corporation from 2008 to 2009, and Senior Vice President of Finance of Bank of America from 1990 to 2008. She has been employed by First Citizens Bank since 2013. Jeffrey L. Ward Mr. Jeffrey L. Ward has been Chief Strategy Officer since October 2014. He previously served as Regional Executive Vice Chief Strategy Officer Age: 59 President of the Bank from 2004 to 2014, and has been employed by First Citizens Bank since 1990. Source: Company documents
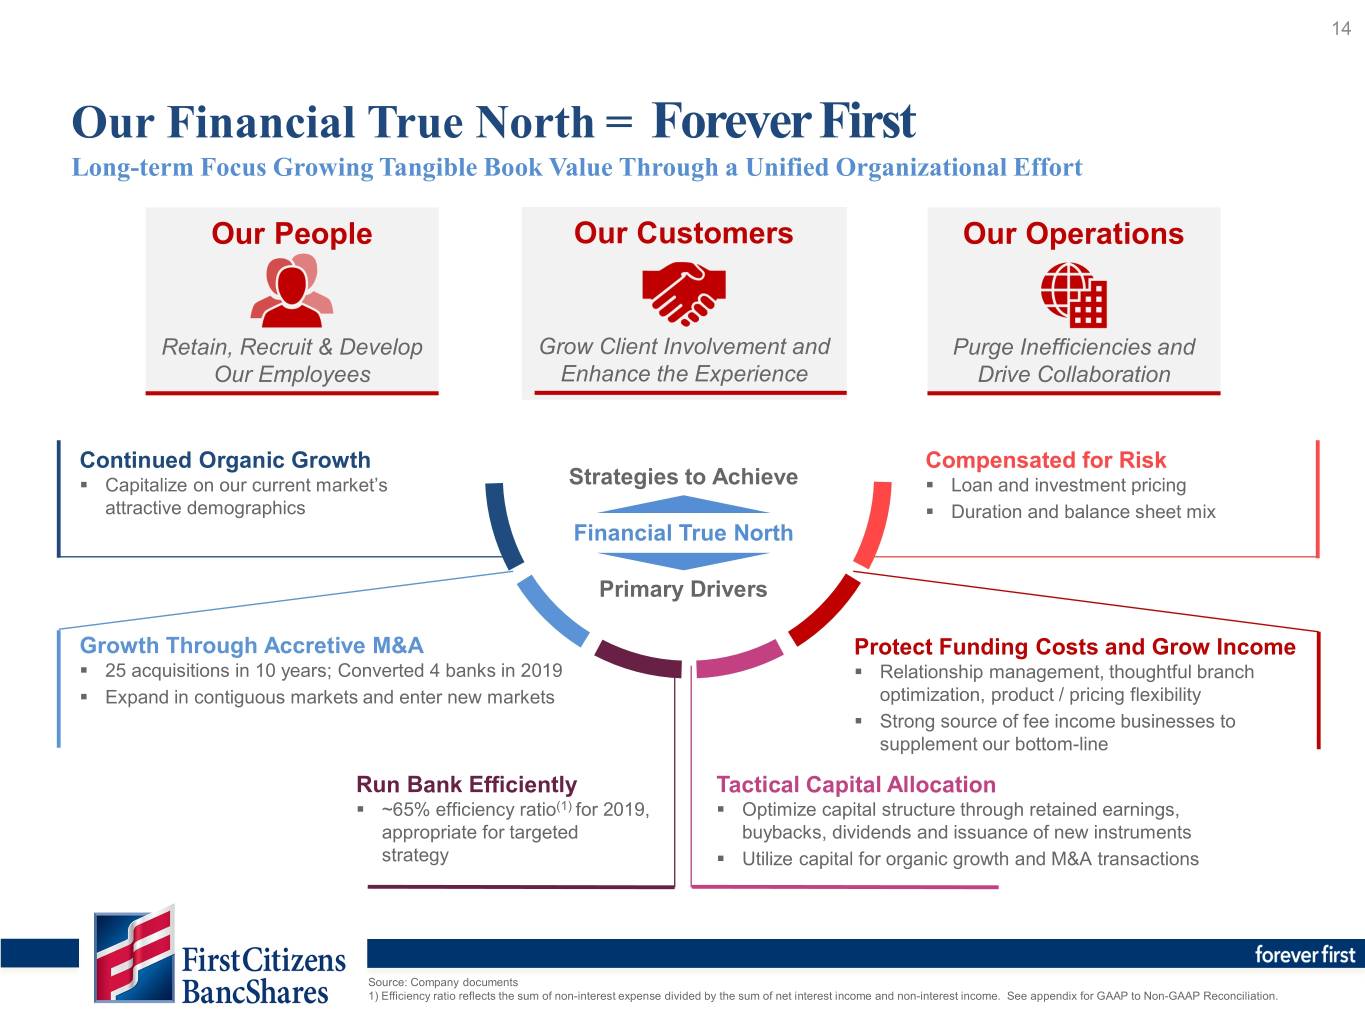
14 Our Financial True North = Forever First Long-term Focus Growing Tangible Book Value Through a Unified Organizational Effort Our People Our Customers Our Operations Retain, Recruit & Develop Grow Client Involvement and Purge Inefficiencies and Our Employees Enhance the Experience Drive Collaboration Continued Organic Growth Compensated for Risk . Capitalize on our current market’s Strategies to Achieve . Loan and investment pricing attractive demographics . Duration and balance sheet mix Financial True North Primary Drivers Growth Through Accretive M&A Protect Funding Costs and Grow Income . 25 acquisitions in 10 years; Converted 4 banks in 2019 . Relationship management, thoughtful branch . Expand in contiguous markets and enter new markets optimization, product / pricing flexibility . Strong source of fee income businesses to supplement our bottom-line Run Bank Efficiently Tactical Capital Allocation . ~65% efficiency ratio(1) for 2019, . Optimize capital structure through retained earnings, appropriate for targeted buybacks, dividends and issuance of new instruments strategy . Utilize capital for organic growth and M&A transactions Source: Company documents 1) Efficiency ratio reflects the sum of non-interest expense divided by the sum of net interest income and non-interest income. See appendix for GAAP to Non-GAAP Reconciliation.

15 Our Operating Strategy Has Resulted in Our Market Success Historical Total Shareholder Return Key Drivers of Our Success NASDAQ S&P • Ability to View Returns Over a Period FCNC.A Bank 500 Long Term Timeline One (9.0%) (25.7%) 7.7% Year • Low-cost, Stable Deposit Base Three 12.7% (26.9%) 30.9% • Strong Capital Base to Support Years Growth Five 60.5% (6.7%) 53.9% Years • Thoughtful Acquisition Strategy Ten 124.3% 58.7% 193.4% Years • Experienced Management Team Fifteen 181.4% (14.6%) 162.3% Years • Diligent Risk Management Note: Market data as of July 23, 2020; Historical Stock Performance reflected for First Citizens BancShares, Inc.’s Class A shares; Total return metric assumes the reinvestment of dividends. Source: FactSet
Second Quarter 2020 Financial Highlights

17 Second Quarter Earnings Highlights 1) The efficiency ratio is a non-GAAP measure. See appendix for GAAP to Non-GAAP reconciliation.
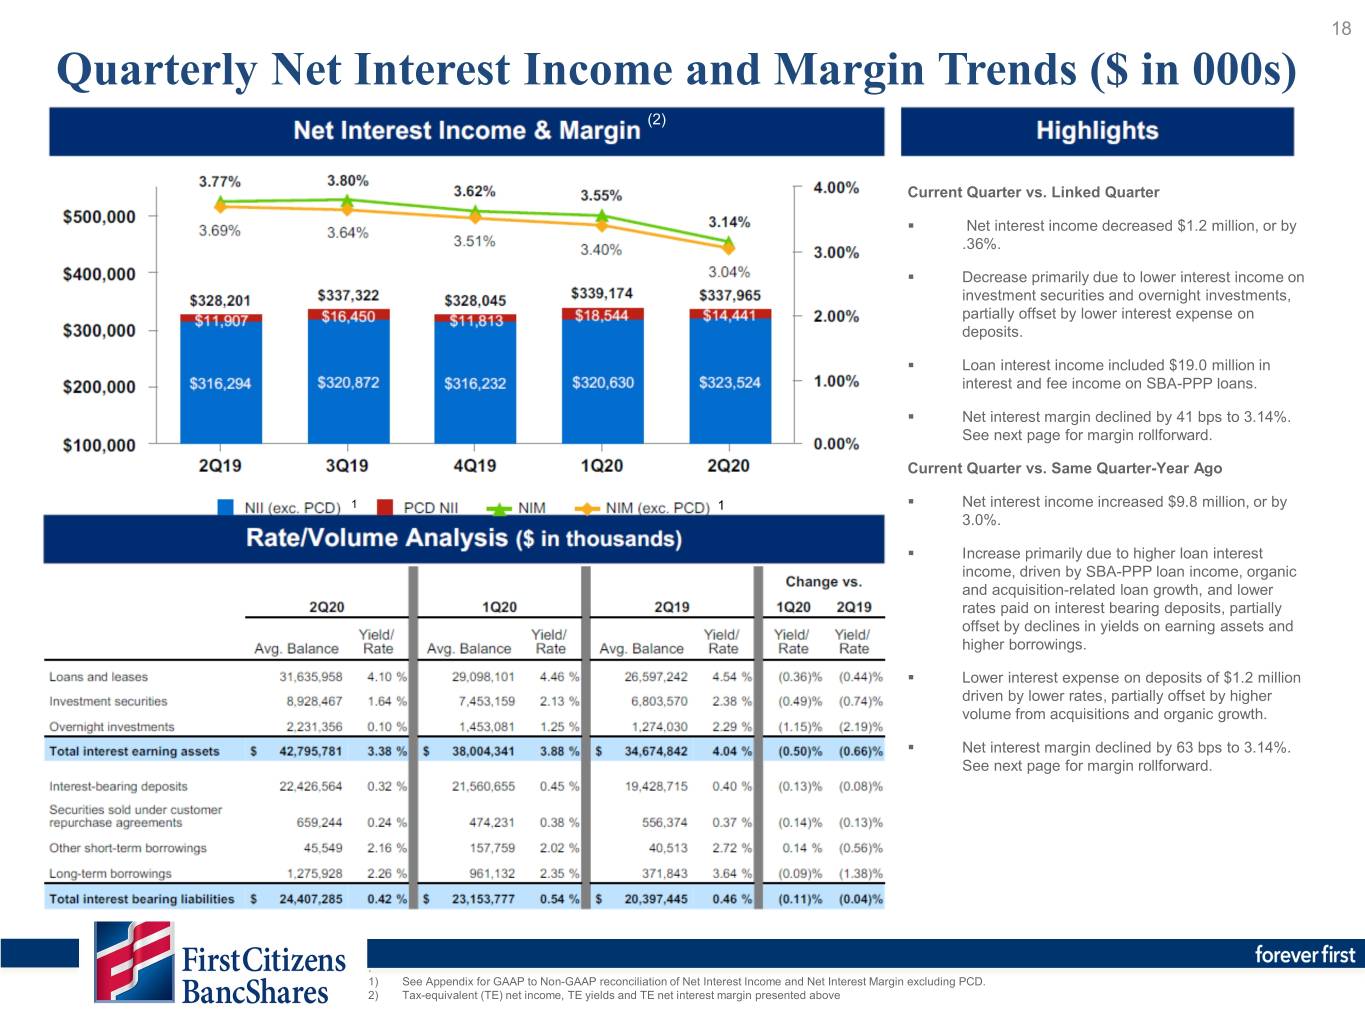
18 Quarterly Net Interest Income and Margin Trends ($ in 000s) (2) Current Quarter vs. Linked Quarter . Net interest income decreased $1.2 million, or by .36%. . Decrease primarily due to lower interest income on investment securities and overnight investments, partially offset by lower interest expense on deposits. . Loan interest income included $19.0 million in interest and fee income on SBA-PPP loans. . Net interest margin declined by 41 bps to 3.14%. See next page for margin rollforward. Current Quarter vs. Same Quarter-Year Ago 1 1 . Net interest income increased $9.8 million, or by 3.0%. . Increase primarily due to higher loan interest income, driven by SBA-PPP loan income, organic and acquisition-related loan growth, and lower rates paid on interest bearing deposits, partially offset by declines in yields on earning assets and higher borrowings. . Lower interest expense on deposits of $1.2 million driven by lower rates, partially offset by higher volume from acquisitions and organic growth. . Net interest margin declined by 63 bps to 3.14%. See next page for margin rollforward. . 1) See Appendix for GAAP to Non-GAAP reconciliation of Net Interest Income and Net Interest Margin excluding PCD. 2) Tax-equivalent (TE) net income, TE yields and TE net interest margin presented above
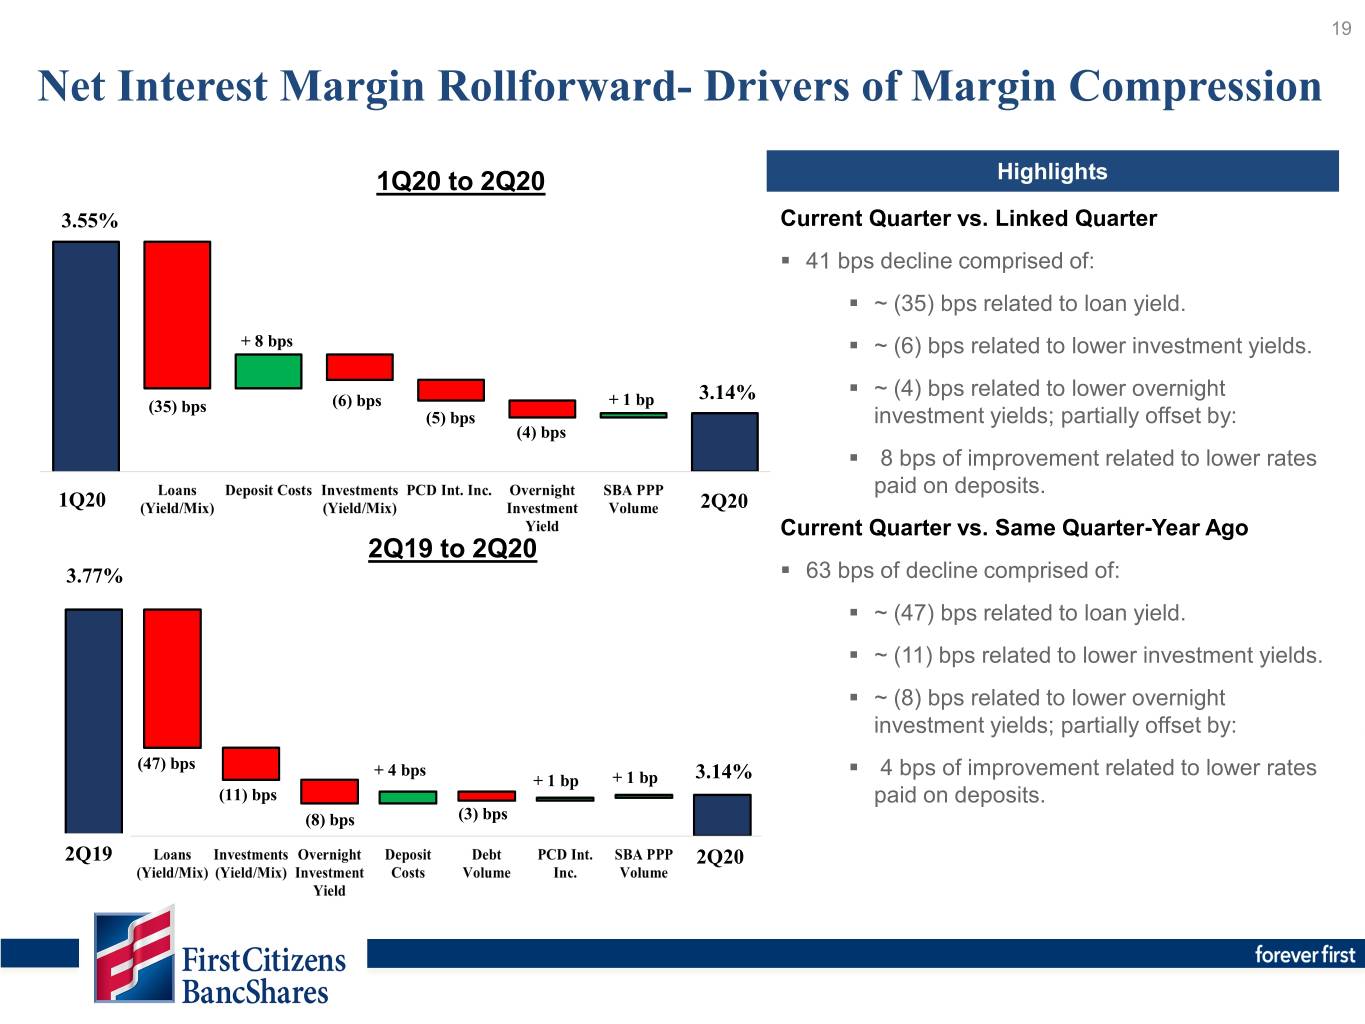
19 Net Interest Margin Rollforward- Drivers of Margin Compression 1Q20 to 2Q20 Highlights 3.55% Current Quarter vs. Linked Quarter . 41 bps decline comprised of: . ~ (35) bps related to loan yield. + 8 bps . ~ (6) bps related to lower investment yields. 3.14% . ~ (4) bps related to lower overnight (35) bps (6) bps + 1 bp (5) bps investment yields; partially offset by: (4) bps . 8 bps of improvement related to lower rates paid on deposits. 1Q20 2Q20 Current Quarter vs. Same Quarter-Year Ago 2Q19 to 2Q20 3.77% . 63 bps of decline comprised of: . ~ (47) bps related to loan yield. . ~ (11) bps related to lower investment yields. . ~ (8) bps related to lower overnight investment yields; partially offset by: (47) bps + 4 bps . 4 bps of improvement related to lower rates + 1 bp + 1 bp 3.14% (11) bps paid on deposits. (8) bps (3) bps 2Q19 2Q20

20 Noninterest Income Highlights ($ in millions) $165 Current Quarter vs. Linked Quarter Noninterest income increased by $101.4 million primarily due to: . $116.0 million increase in the fair market value Core: adjustment on marketable equity securities. $87 $107 $104 . $4.6 million increase in mortgage income, partially offset $101 $64 by: . $10.0 million reduction in service charges on deposits and net card and merchant revenue. Decline mostly attributable to COVID-19 with impacts mostly felt in the Core: Core: Core: Core: April and May timeframe. $94 $95 $93 $96 . $4.0 million decline in wealth income due to lower brokerage fee income primarily impacted by branch closures related to COVID-19. . $6.0 million decline in gain on sale of investment securities. Current Quarter vs. Same Quarter-Year Ago Noninterest income increased by $58.5 million primarily due to: . $61.4 million increase in the fair market value adjustment on marketable equity securities. . $8.0 million increase in gain on sale of securities. . $4.8 million increase in mortgage income, partially offset by: . $10.2 million reduction in service charges on deposits and net card and merchant revenue. Decline mostly (1) attributable to COVID-19. Noninterest income category totals might not foot due to rounding. 1) Non-recurring other income includes FMV adjustment on marketable equitable securities, securities gains and acquired recoveries (that prior to 2020 were reported in noninterest income). See appendix for GAAP to Non-GAAP reconciliation.

21 Noninterest Expense Highlights ($ in millions) Current Quarter vs. Linked Quarter Noninterest expense decreased by $8.3 million primarily due to: $300 $292 $292 . $6.8 million reduction in personnel expense, primarily driven by seasonal benefit impacts and lower health insurance claims. $273 $270 . $4.3 million reduction in core other expenses primarily driven by a decline in operational losses and travel expense, partially offset by: . $3.0 million increase in occupancy and equipment expenses, Core: Core: Core: Core: Core: largely driven by purchase of COVID-19 related supplies. $265 $262 $281 $292 $283 Expect continued cost reductions in the second half of 2020 following the conversion of two acquired banks. Following the conversions and including further personnel savings, expected noninterest expense run rate is $96 - $97 million per month, as merger conversion and personnel savings are partially offset by continued investment in digital and technological capabilities. Efficiency Ratio is 66.75% in 2Q20, down slightly from 67.18% in 1Q20. Current Quarter vs. Same Quarter-Year Ago Noninterest expense increased by $18.3 million primarily due to: . $10.3 million increase in personnel expense, including the addition of personnel from acquisitions ($ 4.5 million of the increase). . $3.5 million increase in processing fees paid to third parties, reflecting continued investments in digital and technological capabilities. (1) Efficiency Ratio was 66.75% in 2Q20, up from 62.92% in 2Q19. The increase was due to net revenue growth of 0.8% versus noninterest expense growth of 6.9%. See appendix for calculation of efficiency ratios. 2Q19 3Q19 4Q19 1Q20 2Q20 Efficiency Ratio 62.92% 60.79% 66.78% 67.18% 66.75% Noninterest expense category totals might not foot due to rounding. See appendix for reconciliation of GAAP to Non-GAAP financial metrics. 1) Other expenses (non-core) include merger expenses and intangible amortization.

22 Second Quarter Balance Sheet Current Quarter vs. Linked Quarter . Loans increased by $3.2 billion, or 43.7% annualized, primarily due to $3.1 billion in SBA-PPP loans, $203 million in organic growth (2.8% annualized organic growth rate), partially offset by a $110 million decrease related to the Entegra branch divestiture in April. . Investment portfolio and overnight investments increased by $663 million and $2.4 billion respectively, funded primarily by growth in demand deposits. . Deposits increased by $6.1 billion, driven by estimated SBA-PPP reciprocal deposits and stimulus check proceeds of $3.5 billion, and $2.8 billion in organic growth (31.9% annualized growth), partially offset by a $185 million decrease related to the Entegra branch divestiture. Current Quarter vs. Same Quarter-Year Ago: . Loans increased $5.7 billion, or by 21.3%, primarily due to $3.1 billion in SBA-PPP loans, $1.6 billion from organic growth (6.1% growth) and $1.0 billion in loans from acquisitions. . Investment Portfolio and Overnight investments increased by $1.5 billion and $2.8 billion respectively, funded primarily by the excess growth in demand deposits. (1) . Deposits increased $8.8 billion from 2Q19, or by $3.9 billion (11.9% growth) when excluding the impacts of $3.5 billion in estimated SBA-PPP reciprocal deposits and stimulus check proceeds and $1.4 billion in acquisition-related deposits. . Other liabilities increased by $1.0 billion, primarily driven by $460 million in growth in FHLB advances, $350 million related to the sub-debt issuance and $200 million in growth from customer repurchase agreements. 1) ACL to Total Loans and Leases excluding SBA-PPP Loans.

23 Loans by Type Highlights Period-end Loan Balances Total Loans and Leases- Annualized and Year over Year Growth (in millions) Total Loans vs. Prior Quarter: 43.7% $32,418 Adjusted Loans1 vs. Prior Quarter: 2.8% 9.4% Total Loans vs. Same Quarter-Year Ago: 21.3 % $28,881 $29,241 Adjusted Loans1 vs Year-Ago Quarter: 6.1% $26,728 $27,197 1.9% 1.9% 1.6% 2.1% 1.9% Current Quarter vs. Linked Quarter . Loans increased $3.2 billion, or by 43.7% on an annualized basis, primarily due to $3.1 billion in SBA-PPP loans, $203 34.9% 34.4% 33.8% 33.5% 30.0% million in organic growth, partially offset by $110 million from the Entegra branch divestiture in April. . Excluding the impact of SBA-PPP loans and divestitures, total loan growth was $203 million, or 2.8% annualized. . Commercial growth was primarily driven by an increase in owner-occupied commercial real estate. Current Quarter vs. Same Quarter-Year Ago 63.0% 63.7% 64.3% 64.6% 58.8% . Loans increased $5.7 billion, or by 21.3% annualized, primarily due to $3.1 billion in SBA-PPP loans, $1.6 billion in organic growth, and $1.0 billion in loans from acquisitions. . Excluding SBA-PPP loans and the impact from acquisitions, total loans increased $1.6 billion over 2Q19, by 6.1%. . Commercial loan growth was driven primarily by owner- occupied commercial real estate loans, while consumer loan growth was driven by residential mortgage growth, partially offset by a decline in home equity loans. Loan category totals might not foot due to rounding. 1) Adjusted loans are Total Loans less the impact of SBA-PPP, acquisitions and divestitures.

24 SBA-PPP SBA-PPP loans extended to over 23 thousand clients, with total loan proceeds of $ 3.2 billion(1) ― Average loan size of approximately $138 thousand. ― 92.3% of overall SBA-PPP loans and 48.1% of outstanding dollars extended to clients with a loan size of less than $350 thousand. ― Loans greater than $2 million represented 0.6% of overall SBA-PPP loans and 15.5% of loan balances. ― Geographic concentration of SBA-PPP loans was in line with existing commercial portfolio distribution: • 46% of SBA-PPP total loans extended in NC markets, 18% in SC markets, 12% in non-Carolina East coast markets, and 24% in non-East Coast markets. ― Primary industry concentration of SBA Loans was Medical (17%), Construction Industry (14%), Professional Services (11%), Dental (9%), Service (7%) and Hospitality (5%). As of 6/30/2020 $ in millions Loan Size # of Loans % of Units $ of Loans % of Loan $ SBA Fee % $ Fee < $350K 21,433 92.3% $1,538.6 48.1% 5.00% $ 76.9 $ 350K - $2mm 1,650 7.1 1,166.8 36.4 3.00 35.0 > $2mm 146 0.6 496.1 15.5 1.00 5.0 Total 23,229 100.0% $3,201.5 100% 3.65% $116.9 1) Total SBA-PPP loan origination volume was $3.2 billion. SBA-PPP related outstanding loan balances as of June 30, 2020 are $3.1 billion, consisting of $3.2 billion in gross loans net of $0.1 billion in related deferred fees.

25 Payment Extension Program As of July 24th, 2020, payment extensions were active on 5,781 accounts with $2.1 billion in outstanding balances (6.5% of total loans). From their peak, active accounts are down by 71% and active outstanding balances are down by 70%. ― Extensions were initially made to performing clients, on a 60 or 90 day basis. As of June 30th, payment extensions were active on 14,646 accounts, and $5.6 billion in outstanding balances (17.3% of total loans), representing $166 million in deferred payments. ― As of July 24th, 5,781 accounts were under an active payment extension, and $2.1 billion in outstanding balances (6.5% of total loans), representing $53 million in deferred payments. ― As of July 24th, 13,874 accounts have moved out of payment extension, totaling $4.9 billion in outstanding balances. 92% of these accounts have made their most recent payment date and the majority of the remainder are within 15 days of their payment due date. 0.7% of accounts are 30 or more days past due, representing 0.23% of balances. ― Through the first three weeks of July, 2.8% of expiring payment extensions have requested a 2nd 90 day extension, compared to 2.7% in the month of June. ― Payment extension requests peaked at the end of March and early April, and have declined significantly since then. Total extensions in June averaged approximately 200 per week, down from a peak of over 5,000 requests per week in late March. Number of Weekly Payment Extension Requests
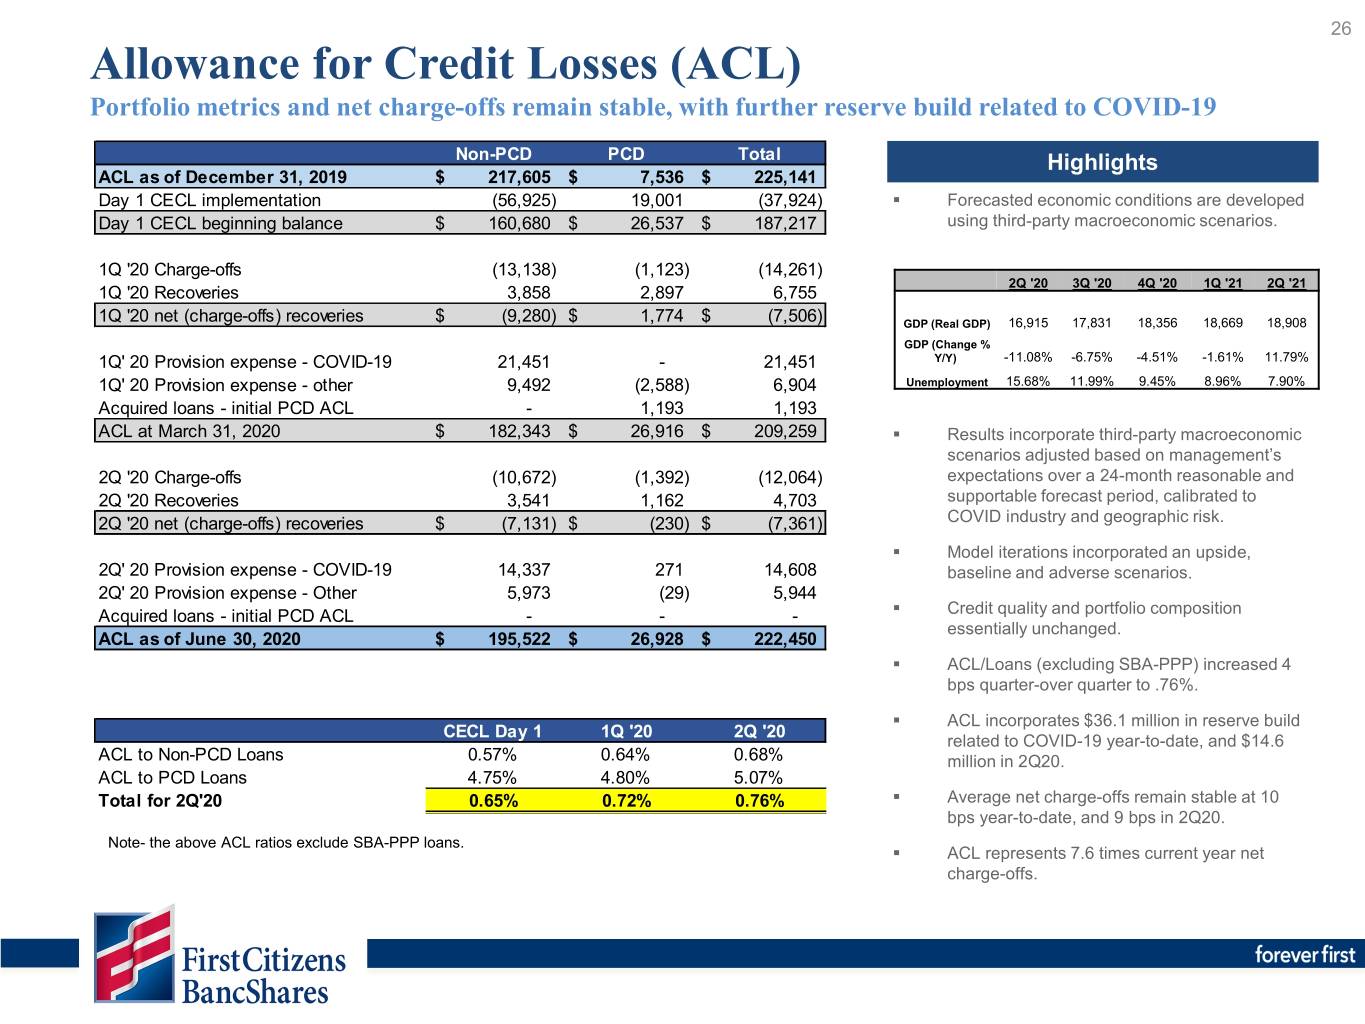
26 Allowance for Credit Losses (ACL) Portfolio metrics and net charge-offs remain stable, with further reserve build related to COVID-19 Non-PCD PCD Total Highlights ACL as of December 31, 2019 $ 217,605 $ 7,536 $ 225,141 Day 1 CECL implementation (56,925) 19,001 (37,924) . Forecasted economic conditions are developed Day 1 CECL beginning balance $ 160,680 $ 26,537 $ 187,217 using third-party macroeconomic scenarios. 1Q '20 Charge-offs (13,138) (1,123) (14,261) 2Q '20 3Q '20 4Q '20 1Q '21 2Q '21 1Q '20 Recoveries 3,858 2,897 6,755 1Q '20 net (charge-offs) recoveries $ (9,280) $ 1,774 $ (7,506) GDP (Real GDP) 16,915 17,831 18,356 18,669 18,908 GDP (Change % 1Q' 20 Provision expense - COVID-19 21,451 - 21,451 Y/Y) -11.08% -6.75% -4.51% -1.61% 11.79% 1Q' 20 Provision expense - other 9,492 (2,588) 6,904 Unemployment 15.68% 11.99% 9.45% 8.96% 7.90% Acquired loans - initial PCD ACL - 1,193 1,193 ACL at March 31, 2020 $ 182,343 $ 26,916 $ 209,259 . Results incorporate third-party macroeconomic scenarios adjusted based on management’s 2Q '20 Charge-offs (10,672) (1,392) (12,064) expectations over a 24-month reasonable and 2Q '20 Recoveries 3,541 1,162 4,703 supportable forecast period, calibrated to 2Q '20 net (charge-offs) recoveries $ (7,131) $ (230) $ (7,361) COVID industry and geographic risk. . Model iterations incorporated an upside, 2Q' 20 Provision expense - COVID-19 14,337 271 14,608 baseline and adverse scenarios. 2Q' 20 Provision expense - Other 5,973 (29) 5,944 . Acquired loans - initial PCD ACL - - - Credit quality and portfolio composition essentially unchanged. ACL as of June 30, 2020 $ 195,522 $ 26,928 $ 222,450 . ACL/Loans (excluding SBA-PPP) increased 4 bps quarter-over quarter to .76%. . ACL incorporates $36.1 million in reserve build CECL Day 1 1Q '20 2Q '20 related to COVID-19 year-to-date, and $14.6 ACL to Non-PCD Loans 0.57% 0.64% 0.68% million in 2Q20. ACL to PCD Loans 4.75% 4.80% 5.07% Total for 2Q'20 0.65% 0.72% 0.76% . Average net charge-offs remain stable at 10 bps year-to-date, and 9 bps in 2Q20. Note- the above ACL ratios exclude SBA-PPP loans. . ACL represents 7.6 times current year net charge-offs.

Credit Quality Metrics 27 Portfolio metrics and net charge-offs remain stable, with further reserve build related to COVID-19 (1) Quarterly Provision Expense $5,198 $6,766 $7,727 $28,355 $20,552 $9,411 $7,390 . Quarterly average net charge-offs declined from the previous quarter and were slightly below the past four quarters. . Provision included a reserve build of $14.6 million in 2Q20 related to COVID-19, which brings the total COVID-19 related reserve build to $36.1 million year-to-date. . Portfolios are performing very well; however, the impacts of SBA- PPP and Payment Extensions are potentially delaying signs of credit deterioration. . As part of the adoption of CECL in 1Q20, loans transferred from performing PCI pools into nonaccrual status contributed $35.9 million of the increase in NPAs as of June 30, 2020. The remainder of the increase was primarily related to acquired loans. 1) Allowance ratio excludes SBA-PPP loans, please see GAAP to Non-GAAP reconciliation in the appendix.

28 Deposits by Type Period-end Deposit Balances Highlights (in millions) Total Deposits- Annualized and Year over Year Growth $41,479 Total Deposits vs. Prior Quarter: 69.8 % 7.9% Adjusted Deposits1 vs. Prior Quarter: 31.9% $35,347 Total Deposits vs. Same Quarter-Year Ago 26.8% $34,431 1 $32,720 $32,743 10.2% Adjusted Deposits vs Year-Ago Quarter 11.9% 11.1% 26.5% 10.6% 10.9% Current Quarter vs. Linked Quarter . Increase of $6.1 billion, or by 69.8% on an annualized basis, driven by a $4.5 billion increase in demand deposits. 26.5% 26.7% 27.3% 27.8% . After excluding growth from estimated SBA-PPP reciprocal deposits 21.8% and consumer stimulus checks totaling $3.5 billion, and the Entegra branch divestiture impact of $185 million, total deposits grew by $2.8 billion, or by 31.9% on an annualized basis. 23.3% 22.8% 24.1% 23.2% Current Quarter vs. Same Quarter-Year Ago . Increase of $8.8 billion, or by 26.8% vs 2Q19, driven by a $5.2 billion or 40.1% increase in demand deposits. . After excluding growth from estimated SBA-PPP reciprocal deposits 39.6% 39.6% 37.5% 38.7% 43.8% and consumer stimulus checks totaling $3.5 billion, and acquisition impacts of $1.4 billion, total deposits grew by $3.9 billion, or 11.9%. All deposit types (demand deposit, checking with interest, money market, savings) grew by at least 10%, with the exception of time deposits which decreased by 6%, as increased volumes related to acquisitions were offset by maturing higher rate deposit accounts. Deposit category totals might not foot due to rounding. 1) Adjusted deposits are total deposits excluding the impacts of acquisitions, estimated impact of SBA-PPP reciprocal deposits and estimated consumer stimulus proceeds.

29 Funding Mix Highlights (in millions) Current Quarter vs. Linked Quarter . Deposits represented 95.4% of our funding mix, up from 94.8%, led by demand deposit growth. . Cost of interest bearing liabilities decreased 12 bps driven by: . Decrease in the cost of interest bearing deposits of 13 bps and total cost of deposits of 10 bps. . Decline in the cost of interest bearing deposits was primarily the maturity of higher-rate time deposits and a reduction in money market rates. Current Quarter vs. Same Quarter-Year Ago . Deposits represented 95.4% of funding, down from 97.3%, primarily due to an increase in FHLB advances and the issuance of subordinated debt in 1Q’20 . Cost of interest bearing liabilities decreased 4 bps driven by: . A decrease in the cost of interest bearing deposits of 8 bps and total cost of deposits of 6 bps.

30 Capital Ratios Net income impact offset by return of capital to shareholders through dividends and repurchases Total Tier 1 Common Risk- Risk- Tier 1 . Year to date net income of $211 Equity Based Based Leverage million contributed to a 68 bps in the Tier 1 total risk-based capital ratio. Capital Capital December 31, 2019 12.12 % 10.86 % 10.86 % 8.81 % . Year to date share repurchases of Net income 0.19 0.19 0.19 0.15 $287 million contributed to a 92 bps decrease in the total risk-based capital Preferred stock offering 1.10 1.10 - 0.90 ratio. Sub-debt issuance 1.14 - - - . The issuance of sub-debt and Common dividends (0.01) (0.01) (0.01) (0.01) preferred stock in the first quarter of Stock repurchases (0.52) (0.52) (0.52) (0.42) 2020 increased the Tier 1 risk-based CECL implementation (0.05) 0.13 0.13 0.10 capital ratio and total risk-based Changes in RWA/AA (0.30) (0.25) (0.23) (0.22) capital ratio by 110 bps and 224 bps, respectively. Impact of acquisitions (0.09) (0.06) (0.05) (0.33) Other 0.07 (0.01) (0.01) - . The SBA-PPP program, with $3.1 March 31, 2020 13.65 % 11.43 % 10.36 % 8.98 % billion in outstanding balances, has decreased the Tier 1 leverage ratio by Net income 0.49 0.49 0.49 0.38 45 bps; the Tier 1 leverage ratio would Common dividends (0.01) (0.01) (0.01) (0.01) be estimated at 8.52% at June 30, Preferred dividends (0.02) (0.02) (0.02) (0.01) 2020 without the impact of the SBA- Stock repurchases (0.40) (0.40) (0.40) (0.32) PPP program. Changes in RWA/AA (0.14) (0.12) (0.11) (0.51) SBA-PPP change in assets - - - (0.45) Other 0.06 0.01 0.01 0.01 June 30, 2020 13.63 % 11.38 % 10.32 % 8.07 % Change since Q1 2020 (0.02) % (0.05) % (0.04) % (0.91) %

31 Looking Ahead- Outlook for the Remainder of 2020 Highlights Commentary . Decline in net interest margin mostly behind us. . Deposit costs expected to continue to decline offsetting some of the low interest rate Net interest income and margin headwind. . Net Interest income- flat to slight increase as recognition of SBA-PPP interest and fee income is partially offset by declining earning asset yields. . Core noninterest income is expected to increase relative to 2Q20 levels, as signs of improvement occurred in June. Levels will depend on the severity of the COVID-19 pandemic and its impact on the economy moving forward. Noninterest income . Continue to assess strategic opportunities to recognize investment portfolio gains. . Net charge-off ratio expected to increase slightly as the positive temporary impact of SBA-PPP loan proceeds and payments extensions subside. Provision and Asset Quality . Further reserve builds not expected at the pace of recent quarters; however, this will depend on the economic recovery and the severity of COVID-19 on it. . Noninterest expense expected to decline based on personnel hiring freeze and conversion of acquired banks. Monthly run rate expected in the $96 - $97 million range following conversions. Noninterest expense & Income taxes . Income tax rate expected to be lower over the next two quarters compared to same- quarter prior year due to impact of tax deductions discussed previously. . Core loan growth, excluding the impact of SBA-PPP loan forgiveness, expected to be flat to low single digit growth due to economy and reduced loan demand. Loans and Deposits . Total deposits expected to decrease the remainder of the year as clients continue to utilize SBA-PPP loan and stimulus check proceeds.
Appendix

33 Reconciliation of Quarterly GAAP to Non-GAAP Measures, Five Quarter Trend June 30, March 31, December 31, September 30, June 30, 2020 2020 2019 2019 2019 Income statement data In thousands Pre-provision net revenue Income before income taxes $ 190,565 74,085 131,528 160,164 155,628 Provision for credit losses 20,552 28,355 7,727 6,766 5,198 Pre-provision net revenue (Non-GAAP) $ 211,117 102,440 139,255 166,930 160,826 Adjusted net interest income (TE) Total net interest income (TE) $ 337,965 339,174 328,045 337,322 328,201 Less: Interest income related to PCD loans (TE) 14,441 18,544 11,813 16,450 11,907 Adjusted net interest income (TE) (Non-GAAP) $ 323,524 320,630 316,232 320,872 316,294 NIM excluding PCD Adjusted net interest income (TE) (Non-GAAP) $ 323,524 320,630 316,232 320,872 316,294 Adjusted average interest earning assets (Non-GAAP) 42,265,349 37,443,648 35,474,284 34,780,411 36,123,553 NIM excluding PCD 3.04% 3.40% 3.51% 3.64% 3.69% Other income (non-core) Securities gains (losses) $ 13,752 19,795 260 1,136 5,719 Fair value adjustments on securities 64,570 (51,408) 7,120 (967) 3,144 Acquired recoveries on PCD loans - - 3,621 5,611 4,222 Other income (non-core) (Non-GAAP) $ 78,322 (31,613) 11,001 5,780 13,085 Other expenses (non-core) Merger related expense $ 4,369 4,232 7,471 3,892 4,084 Amortization of core deposit and other intangible assets 3,956 4,143 3,959 4,191 4,354 Other expenses (non-core) (Non-GAAP) $ 8,325 8,375 11,430 8,083 8,438 Adjusted noninterest income Total noninterest income $ 165,402 64,011 104,393 100,930 106,875 Less: Securities gains (losses) 13,752 19,795 260 1,136 5,719 Less: Fair value adjustments on securities 64,570 (51,408) 7,120 (967) 3,144 Less: Acquired recoveries on PCD loans - - 3,621 5,611 4,222 Adjusted noninterest income (Non-GAAP) $ 87,080 95,624 93,392 95,150 93,790 Adjusted noninterest expense Total noninterest expense $ 291,679 299,971 292,262 270,425 273,397 Less: Merger related expense 4,369 4,232 7,471 3,892 4,084 Less: Amortization of core deposit and other intangible assets 3,956 4,143 3,959 4,191 4,354 Adjusted noninterest expense (Non-GAAP) $ 283,354 291,596 280,832 262,342 264,959 Efficiency ratio Adjusted noninterest expense (numerator) $ 283,354 291,596 280,832 262,342 264,959 Net interest income 337,394 338,400 327,124 336,425 327,348 Adjusted noninterest income 87,080 95,624 93,392 95,150 93,790 Denominator $ 424,474 434,024 420,516 431,575 421,138 Efficiency ratio (Non-GAAP) 66.75% 67.18% 66.78% 60.79% 62.92%
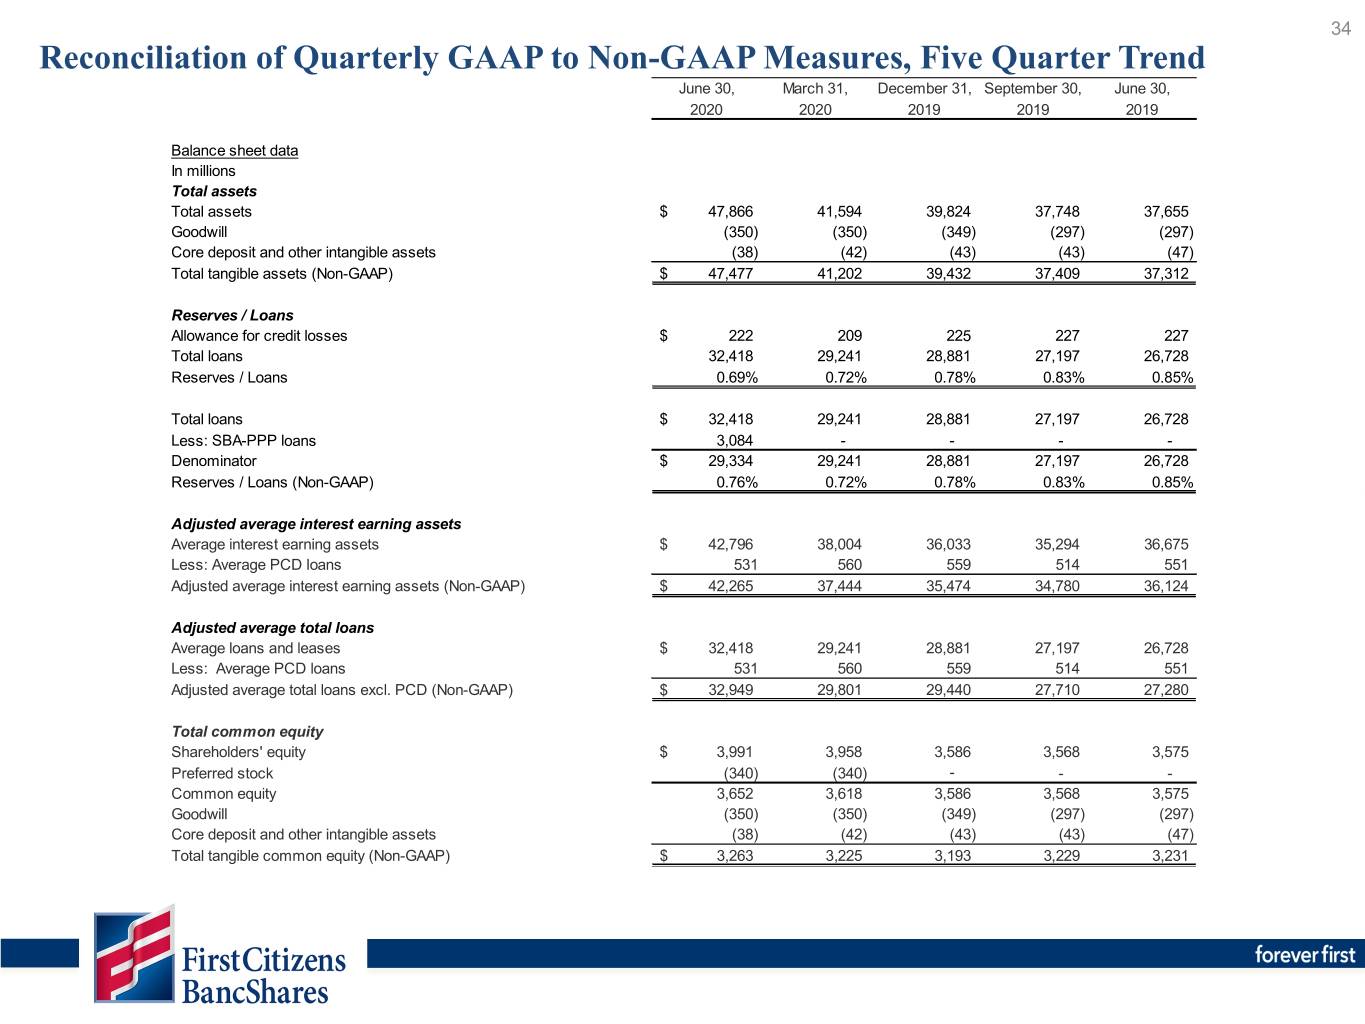
34 Reconciliation of Quarterly GAAP to Non-GAAP Measures, Five Quarter Trend June 30, March 31, December 31, September 30, June 30, 2020 2020 2019 2019 2019 Balance sheet data In millions Total assets Total assets $ 47,866 41,594 39,824 37,748 37,655 Goodwill (350) (350) (349) (297) (297) Core deposit and other intangible assets (38) (42) (43) (43) (47) Total tangible assets (Non-GAAP) $ 47,477 41,202 39,432 37,409 37,312 Reserves / Loans Allowance for credit losses $ 222 209 225 227 227 Total loans 32,418 29,241 28,881 27,197 26,728 Reserves / Loans 0.69% 0.72% 0.78% 0.83% 0.85% Total loans $ 32,418 29,241 28,881 27,197 26,728 Less: SBA-PPP loans 3,084 - - - - Denominator $ 29,334 29,241 28,881 27,197 26,728 Reserves / Loans (Non-GAAP) 0.76% 0.72% 0.78% 0.83% 0.85% Adjusted average interest earning assets Average interest earning assets $ 42,796 38,004 36,033 35,294 36,675 Less: Average PCD loans 531 560 559 514 551 Adjusted average interest earning assets (Non-GAAP) $ 42,265 37,444 35,474 34,780 36,124 Adjusted average total loans Average loans and leases $ 32,418 29,241 28,881 27,197 26,728 Less: Average PCD loans 531 560 559 514 551 Adjusted average total loans excl. PCD (Non-GAAP) $ 32,949 29,801 29,440 27,710 27,280 Total common equity Shareholders' equity $ 3,991 3,958 3,586 3,568 3,575 Preferred stock (340) (340) - - - Common equity 3,652 3,618 3,586 3,568 3,575 Goodwill (350) (350) (349) (297) (297) Core deposit and other intangible assets (38) (42) (43) (43) (47) Total tangible common equity (Non-GAAP) $ 3,263 3,225 3,193 3,229 3,231

35 Reconciliation of Quarterly GAAP to Non-GAAP Measures, Five Quarter Trend Balance sheet data June 30, In thousands 2020 Adjusted loans prior quarter comparison Total loans - June 30, 2020 $ 32,418,425 Total loans - March 31, 2020 (denominator) 29,240,959 Change 3,177,466 Impact of acquisitions 110,246 SBA - PPP loans (3,084,549) Adjusted change annualized (366/91 - numerator) $ 203,163 Growth on an annulized basis (Non-GAAP) 2.8% Adjusted loans year - ago quarter comparison Total loans - June 30, 2020 $ 32,418,425 Total loans - June 30, 2019 (denominator) 26,728,237 Change 5,690,188 Impact of acquisitions (982,922) SBA - PPP loans (3,084,549) Adjusted change (numerator) $ 1,622,717 Growth (Non-GAAP) 6.1% Adjusted deposits prior quarter comparison Total deposits - June 30, 2020 $ 41,479,245 Total deposits - March 31, 2020 (denominator) 35,346,711 Change 6,132,534 Impact of acquisitions 184,750 SBA - PPP reciprocal deposits (estimate) (2,991,845) Consumer stimulus proceeds (estimate) (526,308) Adjusted change annualized (366/91 - numerator) $ 2,799,131 Growth on an annulized basis (Non-GAAP) 31.9% Adjusted deposits year - ago quarter comparison Total deposits - June 30, 2020 $ 41,479,245 Total deposits - June 30, 2019 (denominator) 32,719,671 Change 8,759,574 Impact of acquisitions (1,356,046) SBA - PPP reciprocal deposits (estimate) (2,991,845) Consumer stimulus proceeds (estimate) (526,308) Adjusted change (numerator) $ 3,885,375 Growth (Non-GAAP) 11.9% Balance sheet data In millions 2Q 2020 YTD 1Q 2020 YTD 4Q 2019 YTD 3Q 2019 YTD 2Q 2019 YTD Average total common equity Average shareholders' equity $ 3,835 3,683 3,552 3,545 3,528 Average preferred stock (198) (57) - - - Average common equity 3,637 3,626 3,552 3,545 3,528 Average goodwill (350) (349) (271) (262) (244) Average core deposit and other intangible assets (40) (42) (44) (46) (46) Average tangible common equity (Non-GAAP) $ 3,247 3,235 3,237 3,237 3,238

36 Consolidated Financial Highlights- Earnings Three months ended Six months ended June 30 (Dollars in thousands, except share data; unaudited) June 30, 2020 March 31, 2020 June 30, 2019 2020 2019 SUMMARY OF OPERATIONS Interest income $ 363,257 $ 369,559 $ 350,721 $ 732,816 $ 687,645 Interest expense 25,863 31,159 23,373 57,022 39,825 Net interest income 337,394 338,400 327,348 675,794 647,820 Provision for credit losses 20,552 28,355 5,198 48,907 16,948 Net interest income after provision for credit losses 316,842 310,045 322,150 626,887 630,872 Noninterest income 165,402 64,011 106,875 229,413 210,538 Noninterest expense 291,679 299,971 273,397 591,650 541,054 Income before income taxes 190,565 74,085 155,628 264,650 300,356 Income taxes 36,779 16,916 36,269 53,695 69,638 Net income $ 153,786 $ 57,169 $ 119,359 $ 210,955 $ 230,718 Net interest income, taxable equivalent $ 337,965 $ 339,174 $ 328,201 $ 677,139 $ 649,573 PER COMMON SHARE DATA Net income $ 14.74 $ 5.46 $ 10.56 $ 20.04 $ 20.23 Cash dividends 0.40 0.40 0.40 0.80 0.80 Book value at period-end 367.57 351.90 319.74 367.57 319.74

37 Consolidated Financial Highlights- Balance Sheet and Selected Ratios Three months ended Six months ended June 30 (Dollars in thousands, except share data; unaudited) June 30, 2020 March 31, 2020 June 30, 2019 2020 2019 CONDENSED BALANCE SHEET Cash and due from banks $ 389,233 $ 454,220 $ 284,147 $ 389,233 $ 284,147 Overnight investments 3,107,575 688,518 1,640,264 3,107,575 1,640,264 Investment securities 9,508,476 8,845,197 6,695,578 9,508,476 6,695,578 Loans and leases 32,418,425 29,240,959 26,728,237 32,418,425 26,728,237 Less allowance for credit losses (222,450) (209,259) (226,583) (222,450) (226,583) Other assets 2,664,935 2,574,818 2,533,451 2,664,935 2,533,451 Total assets $ 47,866,194 $ 41,594,453 $ 37,655,094 $ 47,866,194 $ 37,655,094 Deposits $ 41,479,245 $ 35,346,711 $ 32,719,671 $ 41,479,245 $ 32,719,671 Other liabilities 2,395,505 2,290,222 1,360,810 2,395,505 1,360,810 Shareholders’ equity 3,991,444 3,957,520 3,574,613 3,991,444 3,574,613 Total liabilities and shareholders’ equity $ 47,866,194 $ 41,594,453 $ 37,655,094 $ 47,866,194 $ 37,655,094 SELECTED PERIOD AVERAGE BALANCES Total assets $ 45,553,502 $ 40,648,806 $ 37,049,030 $ 43,101,154 $ 36,338,839 Investment securities 8,928,467 7,453,159 6,803,570 8,190,813 6,797,656 Loans and leases 31,635,958 29,098,101 26,597,242 30,367,030 26,059,602 Interest-earning assets 42,795,781 38,004,341 34,674,842 40,400,061 34,056,935 Deposits 39,146,415 34,750,061 32,100,210 36,948,238 31,454,973 Interest-bearing liabilities 24,407,285 23,153,777 20,397,445 23,780,042 20,028,489 Common shareholders' equity 3,648,284 3,625,975 3,546,041 3,637,129 3,528,549 Shareholders' equity $ 3,988,225 $ 3,682,634 $ 3,546,041 $ 3,835,430 $ 3,528,549 Common shares outstanding 10,105,520 10,473,119 11,286,520 10,289,320 11,402,112 SELECTED RATIOS Annualized return on average assets 1.36 % 0.57 % 1.29 % 0.98 % 1.28 % Annualized return on average equity 16.43 6.34 13.50 11.40 13.19 Net yield on interest-earning assets (taxable equivalent) 3.14 3.55 3.77 3.33 3.81 Efficiency ratio 66.8 67.2 62.9 67.0 63.4 Tier 1 risk-based capital ratio 11.4 11.4 12.0 11.4 12.0 Tier 1 common equity ratio 10.3 10.4 12.0 10.3 12.0 Total risk-based capital ratio 13.6 13.7 13.3 13.6 13.3 Tier 1 leverage capital ratio 8.1 9.0 9.4 8.1 9.4 (1) The efficiency ratio is a non-GAAP financial measure wh ich measures productivity and is generally calculated as noninterest expense divided by total revenue (net interest income and noninterest income). The efficiency ratio removes the impact of BancShares’ securities gains, fair market value adjust ment on marketable equit y securities, acquired recoveries previously recognized in other income, merger-related expenses and amortization of core deposits and other intangibles from the calculation. Management uses this ratio to monitor performance and believes this measure provides meaningful information to investors.
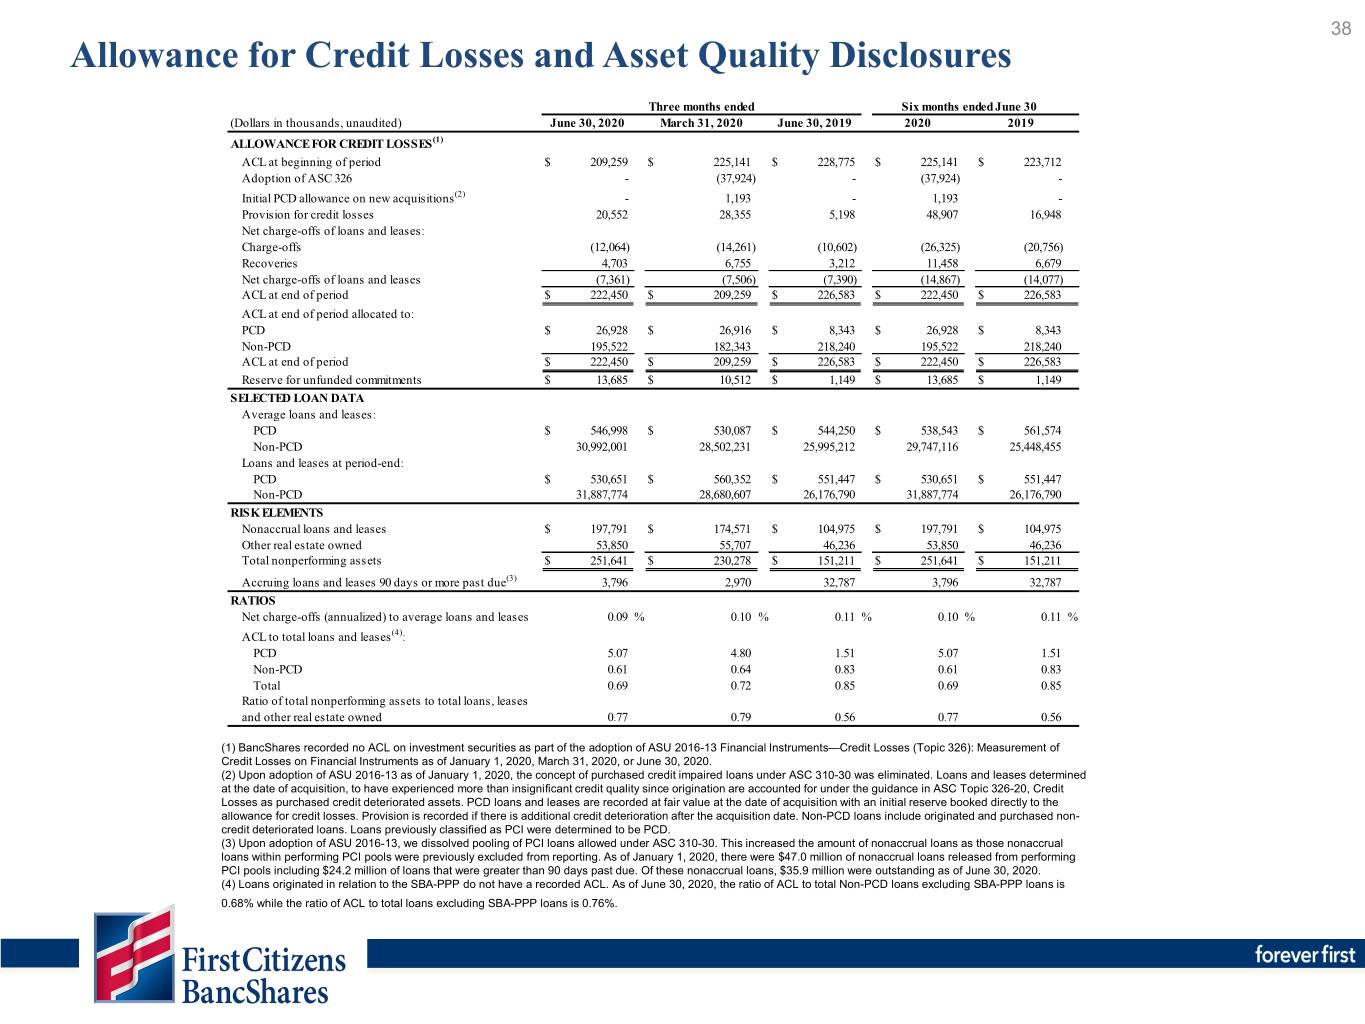
38 Allowance for Credit Losses and Asset Quality Disclosures Three months ended Six months ended June 30 (Dollars in thousands, unaudited) June 30, 2020 March 31, 2020 June 30, 2019 2020 2019 ALLOWANCE FOR CREDIT LOSSES (1) ACL at beginning of period $ 209,259 $ 225,141 $ 228,775 $ 225,141 $ 223,712 Adoption of ASC 326 - (37,924) - (37,924) - Initial PCD allowance on new acquisitions(2) - 1,193 - 1,193 - Provision for credit losses 20,552 28,355 5,198 48,907 16,948 Net charge-offs of loans and leases: Charge-offs (12,064) (14,261) (10,602) (26,325) (20,756) Recoveries 4,703 6,755 3,212 11,458 6,679 Net charge-offs of loans and leases (7,361) (7,506) (7,390) (14,867) (14,077) ACL at end of period $ 222,450 $ 209,259 $ 226,583 $ 222,450 $ 226,583 ACL at end of period allocated to: PCD $ 26,928 $ 26,916 $ 8,343 $ 26,928 $ 8,343 Non-PCD 195,522 182,343 218,240 195,522 218,240 ACL at end of period $ 222,450 $ 209,259 $ 226,583 $ 222,450 $ 226,583 Reserve for unfunded commitments $ 13,685 $ 10,512 $ 1,149 $ 13,685 $ 1,149 SELECTED LOAN DATA Average loans and leases: PCD $ 546,998 $ 530,087 $ 544,250 $ 538,543 $ 561,574 Non-PCD 30,992,001 28,502,231 25,995,212 29,747,116 25,448,455 Loans and leases at period-end: PCD $ 530,651 $ 560,352 $ 551,447 $ 530,651 $ 551,447 Non-PCD 31,887,774 28,680,607 26,176,790 31,887,774 26,176,790 RIS K ELEMENTS Nonaccrual loans and leases $ 197,791 $ 174,571 $ 104,975 $ 197,791 $ 104,975 Other real estate owned 53,850 55,707 46,236 53,850 46,236 Total nonperforming assets $ 251,641 $ 230,278 $ 151,211 $ 251,641 $ 151,211 Accruing loans and leases 90 days or more past due(3) 3,796 2,970 32,787 3,796 32,787 RATIOS Net charge-offs (annualized) to average loans and leases 0.09 % 0.10 % 0.11 % 0.10 % 0.11 % ACL to total loans and leases(4): PCD 5.07 4.80 1.51 5.07 1.51 Non-PCD 0.61 0.64 0.83 0.61 0.83 Total 0.69 0.72 0.85 0.69 0.85 Ratio of total nonperforming assets to total loans, leases and other real estate owned 0.77 0.79 0.56 0.77 0.56 (1) BancShares recorded no ACL on investment securities as part of the adoption of ASU 2016-13 Financial Instruments—Credit Losses (Topic 326): Measurement of Credit Losses on Financial Instruments as of January 1, 2020, March 31, 2020, or June 30, 2020. (2) Upon adoption of ASU 2016-13 as of January 1, 2020, the concept of purchased credit impaired loans under ASC 310-30 was eliminated. Loans and leases determined at the date of acquisition, to have experienced more than insignificant credit quality since origination are accounted for under the guidance in ASC Topic 326-20, Credit Losses as purchased credit deteriorated assets. PCD loans and leases are recorded at fair value at the date of acquisition with an initial reserve booked directly to the allowance for credit losses. Provision is recorded if there is additional credit deterioration after the acquisition date. Non-PCD loans include originated and purchased non- credit deteriorated loans. Loans previously classified as PCI were determined to be PCD. (3) Upon adoption of ASU 2016-13, we dissolved pooling of PCI loans allowed under ASC 310-30. This increased the amount of nonaccrual loans as those nonaccrual loans within performing PCI pools were previously excluded from reporting. As of January 1, 2020, there were $47.0 million of nonaccrual loans released from performing PCI pools including $24.2 million of loans that were greater than 90 days past due. Of these nonaccrual loans, $35.9 million were outstanding as of June 30, 2020. (4) Loans originated in relation to the SBA-PPP do not have a recorded ACL. As of June 30, 2020, the ratio of ACL to total Non-PCD loans excluding SBA-PPP loans is 0.68% while the ratio of ACL to total loans excluding SBA-PPP loans is 0.76%.

39 Average Balance and Net Interest Margin Summary Three months ended June 30, 2020 March 31, 2020 June 30, 2019 Average Income/ Yield/ Average Income/ Yield/ Average Income/ Yield/ (Dollars in thousands, unaudited) Balance Expe nse Rate(2) Balance Expe nse Rate(2) Balance Expe nse Rate(2) INTERES T-EARNING AS S ETS Loans and leases(1) $ 31,635,958 $ 326,618 4.10 % $ 29,098,101 $ 326,155 4.46 % $ 26,597,242 $ 303,803 4.54 % Investment securities: U.S. Treasury 206,575 679 1.32 299,777 1,677 2.25 1,150,001 6,770 2.36 Government agency 657,405 1,428 0.87 721,254 4,121 2.29 383,700 3,034 3.16 M ortgage-backed securities 7,555,947 28,532 1.51 6,060,434 30,707 2.03 4,979,160 28,130 2.26 Corporate bonds 299,250 3,782 5.06 205,504 2,477 4.82 147,669 1,931 5.23 Other investments 209,290 2,236 4.30 166,190 678 1.64 143,040 626 1.76 Total investment securities 8,928,467 36,657 1.64 7,453,159 39,660 2.13 6,803,570 40,491 2.38 Overnight investments 2,231,356 553 0.10 1,453,081 4,518 1.25 1,274,030 7,280 2.29 Total interest-earning assets $ 42,795,781 $ 363,828 3.38 $ 38,004,341 $ 370,333 3.88 $ 34,674,842 $ 351,574 4.04 INTEREST-BEARING LIABILITIES Interest-bearing deposits: Checking with interest $ 8,562,145 $ 1,310 0.06 % $ 8,188,983 $ 1,701 0.08 % $ 7,485,693 $ 1,571 0.08 % Savings 2,846,557 312 0.04 2,593,869 285 0.04 2,658,974 527 0.08 Money market accounts 7,618,883 6,519 0.34 7,016,587 9,109 0.52 5,912,646 5,498 0.37 Time deposits 3,398,979 9,775 1.16 3,761,216 13,099 1.40 3,371,402 11,561 1.38 Total interest-bearing deposits 22,426,564 17,916 0.32 21,560,655 24,194 0.45 19,428,715 19,157 0.40 Securities sold under customer repurchase agreements 659,244 399 0.24 474,231 442 0.38 556,374 515 0.37 Other short-term borrowings 45,549 248 2.16 157,759 804 2.02 40,513 278 2.72 Long-term borrowings 1,275,928 7,300 2.26 961,132 5,719 2.35 371,843 3,423 3.64 Total interest-bearing liabilities $ 24,407,285 $ 25,863 0.42 $ 23,153,777 $ 31,159 0.54 $ 20,397,445 $ 23,373 0.46 Interest rate spread 2.96 % 3.34 % 3.58 % Net interest income and net yield on interest-earning assets $ 337,965 3.14 % $ 339,174 3.55 % $ 328,201 3.77 % (1) Loans and leases include PCD and non-PCD loans, nonaccrual loans and loans held for sale. (2) Yields related to loans, leases and securities exempt from bot h federal and state income taxes, federal income taxes only, or state income taxes only are stated on a taxable-equivalent basis assuming statutory federal income tax rates of 21.0%, as well as state income tax rates of 3.4% for all periods presented. The taxable-equivalent adjust ment was $571 t housand, $774 thousand and $853 thousand for the three months ended June 30, 2020, March 31, 2020 and June 30, 2019, respectively.

40 Select Peer Group Peer Banks City State Ticker # of Offices Assets Associated Banc-Corp Green Bay WI ASB 258 $ 33,908,056 BOK Financial Corporation Tulsa OK BOKF 128 47,185,157 Commerce Bancshares, Inc. Kansas City MO CBSH 161 26,812,474 Cullen/Frost Bankers, Inc. San Antonio TX CFR 160 34,256,806 East West Bancorp, Inc. Pasadena CA EWBC 110 45,948,545 First Horizon National Corporation Memphis TN FHN 492 47,199,416 Fulton Financial Corporation Lancaster PA FULT 230 22,914,522 Hancock Whitney Corporation Gulfport MS HWC 224 31,769,661 People's United Financial, Inc. Bridgeport CT PBCT 419 60,420,600 Synovus Financial Corp. Columbus GA SNV 296 50,619,585 TCF Financial Corporation Detroit MI TCF 515 48,608,892 Valley National Bancorp Wayne NJ VLY 241 39,120,629 Webster Financial Corporation Waterbury CT WBS 157 31,695,112 Wintrust Financial Corporation Rosemont IL WTFC 182 38,791,203 Zions Bancorporation, National Association Salt Lake City UT ZION 426 $ 71,466,849 Source: S&P Global, data as of 3/31/2020.
