Attached files
| file | filename |
|---|---|
| EX-99.1 - EXHIBIT 99.1 - FIRST BANCORP /PR/ | a52256515ex99_1.htm |
| 8-K - FIRST BANCORP. 8-K - FIRST BANCORP /PR/ | a52256515.htm |
Exhibit 99.2

Financial ResultsSecond Quarter 2020

2 Forward-Looking Statements This press release may contain “forward-looking statements” concerning the
Corporation’s future economic, operational and financial performance. The words or phrases “expect,” “anticipate,” “intend,” “look forward,” “should,” “would,” “believe” and similar expressions are meant to identify “forward-looking statements”
within the meaning of Section 27A of the Securities Act of 1933, as amended, and Section 21E of the Securities Exchange Act of 1934, as amended, and are subject to the safe harbor created by such sections. The Corporation cautions readers not
to place undue reliance on any such forward-looking statements, which speak only as of the date made, and advises readers that various factors, including, but not limited to, the following could cause actual results to differ materially from
those expressed in, or implied by, such forward-looking statements: uncertainties relating to the impact of the COVID-19 pandemic, including the recent increase in, and any additional waves of, COVID-19 cases and the development and
availability of a vaccine, on the Corporation’s business, operations, employees, credit quality, financial condition and net income, including because of uncertainties as to the extent and duration of the pandemic and the impact of the pandemic
on consumer spending, borrowing and saving habits, the underemployment and unemployment rates, which can adversely affect repayment patterns, the Puerto Rico economy and the global economy, as well as the risk that COVID-19 may exacerbate any
other factor that could cause our actual results to differ materially from those expressed in or implied by any forward-looking statements; risks related to the effect on the Corporation and its customers of governmental, regulatory, or central
bank responses to COVID-19 and the Corporation’s participation in any such responses or programs, such as the Paycheck Protection Program established by the CARES Act of 2020, including lower net interest margins resulting from the significant
number of loans made under the Paycheck Protection Program and any judgments, claims, damages, penalties, fines or reputational damage resulting from claims or challenges against the Corporation by governments, regulators, customers or
otherwise, relating to the Corporation’s participation in any such responses or programs; risks, uncertainties and other factors related to the proposed acquisition of BSPR, including the impact of the COVID-19 pandemic on the ability to meet
any pending closing conditions to the acquisition on a timely basis, the risk that deposit attrition, customer loss and/or revenue loss prior to or following the acquisition may exceed expectations, including because of the impact of the
COVID-19 pandemic on customers; the risk that significant costs, expenses, and resources associated with or in funding the acquisition may be higher than expected; the ability to successfully complete the integration of systems, procedures, and
personnel of BSPR into FirstBank that are necessary to make the transaction economically successful; the risk that the Corporation may not be able to effectively integrate BSPR into the Corporation’s internal control over financial reporting;
the risk that the cost savings and any other synergies from the acquisition may not be fully realized or may take longer to realize than expected; uncertainty as to the ultimate outcomes of actions taken, or those that may be taken, by the
Puerto Rico government, or the oversight board established by the Puerto Rico Oversight, Management, and Economic Stability Act (“PROMESA”) to address the Commonwealth of Puerto Rico’s financial problems, including a court-supervised debt
restructuring process similar to U.S. bankruptcy protection undertaken pursuant to Title III of PROMESA, the designation by the PROMESA oversight board of Puerto Rico municipalities as instrumentalities covered under PROMESA, the effects of
measures included in the Puerto Rico government fiscal plan, or any revisions to it, on our clients and loan portfolios, and any potential impact from future economic or political developments in Puerto Rico; changes in economic and business
conditions, including those caused by the COVID-19 pandemic, including the recent increase in, and any additional waves of, COVID-19 cases, or other global or regional health crises as well as past or future natural disasters, such as the
earthquakes affecting Puerto Rico’s southern coast, that directly or indirectly affect the financial health of the Corporation’s customer base in the geographic areas we serve and may result in increased costs or losses of property and
equipment and other assets; the impact that a slowing economy and increased unemployment or underemployment may have on the performance of our loan and lease portfolio, the market price of our investment securities, the availability of sources
of funding and the demand for our products; uncertainty as to the timing of the receipt of disaster relief funds allocated to Puerto Rico; a decrease in demand for the Corporation’s products and services, resulting in lower revenues and
earnings because of the continued economic recession in Puerto Rico; uncertainty as to the availability of certain funding sources, such as brokered CDs; the deteriorating weakness of the real estate markets and of the consumer and commercial
sectors, which may be exacerbated by unemployment and underemployment and government restrictions imposed as a result of the COVID-19 pandemic, including the recent increase in, and any additional waves of, COVID-19 cases, and their impact on
the credit quality of the Corporation’s loans and other assets, which have contributed and may continue to contribute to, among other things, higher than targeted levels of non-performing assets, charge-offs and provisions for credit losses,
and may subject the Corporation to further risk from loan defaults and foreclosures; the impact of changes in accounting standards or assumptions in applying those standards, including the impact of the COVID-19 pandemic on the determination of
the allowance for credit losses required by the new CECL accounting standard effective since January 1, 2020; the ability of FirstBank to realize the benefits of its net deferred tax assets; the ability of FirstBank to generate sufficient cash
flow to make dividend payments to the Corporation; adverse changes in general economic conditions in Puerto Rico, the U.S., the U.S. Virgin Islands, and the British Virgin Islands, including the interest rate environment, market liquidity,
housing absorption rates, real estate prices, and disruptions in the U.S. capital markets, including as a result of the COVID-19 pandemic and the recent increase in, and any additional waves of, COVID-19 cases, which may further reduce interest
margins, affect funding sources and demand for all of the Corporation’s products and services, and reduce the Corporation’s revenues and earnings and the value of the Corporation’s assets; uncertainty related to the effect of the
discontinuation of the London Interbank Offered Rate at the end of 2021; an adverse change in the Corporation’s ability to attract new clients and retain existing ones; the risk that additional portions of the unrealized losses in the
Corporation’s investment portfolio are determined to be credit-related, including additional charges to the provision for credit losses on the Corporation’s remaining $8.1 million exposure to the Puerto Rico government’s debt securities held as
part of the available-for-sale securities portfolio; uncertainty about legislative, tax or regulatory changes that affect financial services companies in Puerto Rico, the U.S., and the U.S. and British Virgin Islands, which could affect the
Corporation’s financial condition or performance and could cause the Corporation’s actual results for future periods to differ materially from prior results and anticipated or projected results; changes in the fiscal and monetary policies and
regulations of the U.S. federal government and the Puerto Rico and other governments, including those determined by the Federal Reserve Board, the New York FED, the FDIC, government-sponsored housing agencies, and regulators in Puerto Rico and
the U.S. and British Virgin Islands; the risk of possible failure or circumvention of the Corporation’s internal controls and procedures and the risk that the Corporation’s risk management policies may not be adequate; the Corporation’s ability
to identify and address cyber-security incidents, such as data security breaches, malware, “denial of service” attacks, “hacking” and identity theft, a failure of which could disrupt our business, may result in misuse or misappropriation of
confidential or proprietary information, and could result in the disruption or damage to our systems, increased costs and losses or an adverse effect to our reputation; the risk that the FDIC may increase the deposit insurance premium and/or
require special assessments to replenish its insurance fund, causing an additional increase in the Corporation’s non-interest expenses; the impact on the Corporation’s results of operations and financial condition of business acquisitions, such
as the pending acquisition of BSPR, and dispositions; a need to recognize impairments on the Corporation’s financial instruments, goodwill and other intangible assets relating to business acquisitions, including as a result of the COVID-19
pandemic; the effect of changes in the interest rate environment, including as a result of the impact of the COVID-19 pandemic, including the recent increase in, and any additional waves of, COVID-19 cases, on the global economy, on the
Corporation’s businesses, business practices and results of operations; the risk that the impact of the occurrence of any of these uncertainties on the Corporation’s capital would preclude further growth of the Bank and preclude the
Corporation’s Board of Directors from declaring dividends; uncertainty as to whether FirstBank will be able to continue to satisfy its regulators regarding, among other things, its asset quality, liquidity plans, maintenance of capital levels
and compliance with applicable laws, regulations, and related requirements; and general competitive factors and industry consolidation. The Corporation does not undertake, and specifically disclaims any obligation, to update any
“forward-looking statements” to reflect occurrences or unanticipated events or circumstances after the date of such statements, except as required by the federal securities laws.

Agenda Second Quarter 2020 Highlights Aurelio Alemán, President & Chief Executive OfficerSecond
Quarter 2020 Results of Operations Orlando Berges, Executive Vice President & Chief Financial OfficerQuestions & Answers 3

Second Quarter 2020 Highlights
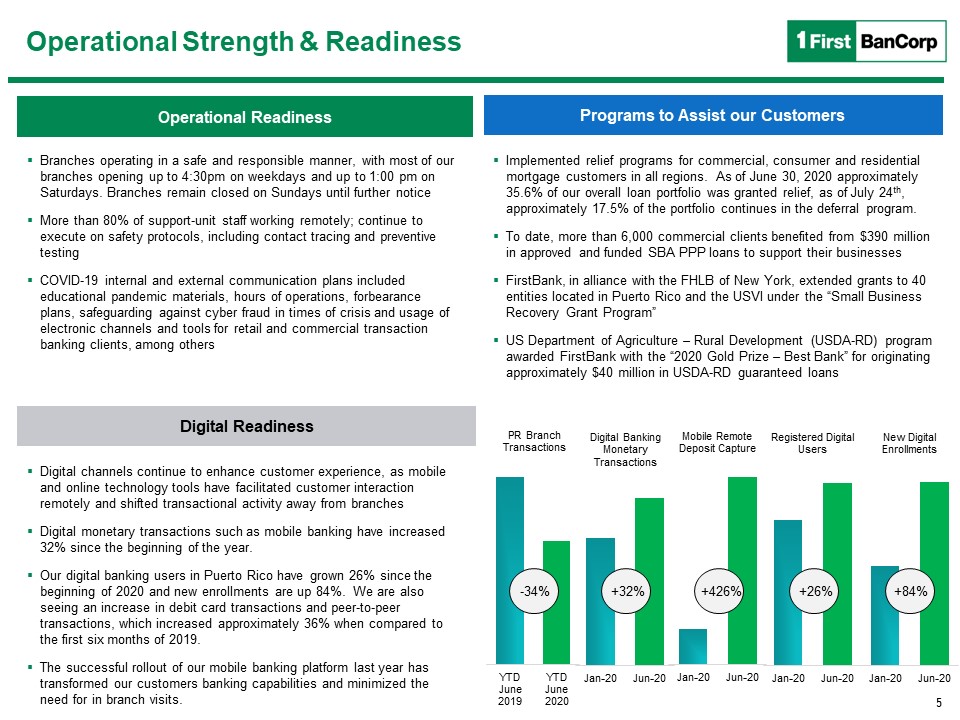
Programs to Assist our Customers Implemented relief programs for commercial, consumer and residential
mortgage customers in all regions. As of June 30, 2020 approximately 35.6% of our overall loan portfolio was granted relief, as of July 24th, approximately 17.5% of the portfolio continues in the deferral program.To date, more than 6,000
commercial clients benefited from $390 million in approved and funded SBA PPP loans to support their businessesFirstBank, in alliance with the FHLB of New York, extended grants to 40 entities located in Puerto Rico and the USVI under the “Small
Business Recovery Grant Program”US Department of Agriculture – Rural Development (USDA-RD) program awarded FirstBank with the “2020 Gold Prize – Best Bank” for originating approximately $40 million in USDA-RD guaranteed loans Digital
Readiness Digital channels continue to enhance customer experience, as mobile and online technology tools have facilitated customer interaction remotely and shifted transactional activity away from branchesDigital monetary transactions such as
mobile banking have increased 32% since the beginning of the year.Our digital banking users in Puerto Rico have grown 26% since the beginning of 2020 and new enrollments are up 84%. We are also seeing an increase in debit card transactions and
peer-to-peer transactions, which increased approximately 36% when compared to the first six months of 2019.The successful rollout of our mobile banking platform last year has transformed our customers banking capabilities and minimized the need
for in branch visits. -34% +32% +426% +26% +84% 5 Operational Readiness Operational Strength & Readiness Branches operating in a safe and responsible manner, with most of our branches opening up to 4:30pm on weekdays and
up to 1:00 pm on Saturdays. Branches remain closed on Sundays until further noticeMore than 80% of support-unit staff working remotely; continue to execute on safety protocols, including contact tracing and preventive testingCOVID-19 internal
and external communication plans included educational pandemic materials, hours of operations, forbearance plans, safeguarding against cyber fraud in times of crisis and usage of electronic channels and tools for retail and commercial
transaction banking clients, among others

6 Loan Originations3 ($ millions) 1 Source: Moody’s Analytics May 2020 2 United States Department of
Labor. Bureau of Labor Statistics, Establishment Survey3 Including refinancing and draws from existing revolving and non-revolving commitments including credit card utilization.4 Core deposits are total deposits excluding brokered deposits.
Core Deposits4 ($ millions) $8,887 $8,543 $10,086 Economic backdrop remains challenging, government stimulus continues to play an important role in mitigating pandemic emergency Unprecedented local and federal stimulus programs (over $14
billion1) have bolstered liquidity in the systemPuerto Rico June 2020 Payroll Employment2 figures at 90% of 2019 average95% of FBP business banking customers and 100% of FBP corporate banking clients have reopenedFBP Puerto Rico hotel portfolio
at 40-60% occupancy rate as of July 15th, but could be impacted by recent tighteningSJU Passenger Movement up to 200k first half of July compared to 42k in the full month of April, although still down 58% compared to first half of July 2019As
of June 30th FBP Hospital portfolio occupancy ranging at 49-71%FirstBank Puerto Rico Merchant / Point of Sale weekly sales up over 300% when comparing the last week of March to the last week of June; June/July 2020 outpacing June/July 2019Auto
lending reopened in Puerto Rico in late-May, with $59 million booked in June, inline with the 2019 average. The trend continues for the first half July with auto loans booked up 14% compared to same period 2019Mortgage lending reopened in
Puerto Rico in mid-May, with $46 million booked in June, above the 2019 average of $33 million. The trend continues for the first half July with mortgage originations booked up 112% compared to same period 2019Small/personal loans applications
still lagging 2019 performanceCore deposits increased $1.2 billion, or 13.5% in 2Q 2020 Residential Commercial Construction Consumer & Auto Retail Commercial CDs & IRAs Public Funds $379 $318 $265 Reopening
Trends While Early Stages of Reopening Efforts Reflect Positive Economic Activity… …We Continue to Monitor the Economic Performance Considering the Recent Tightening of Reopening Efforts due to and Increase in COVID Cases.
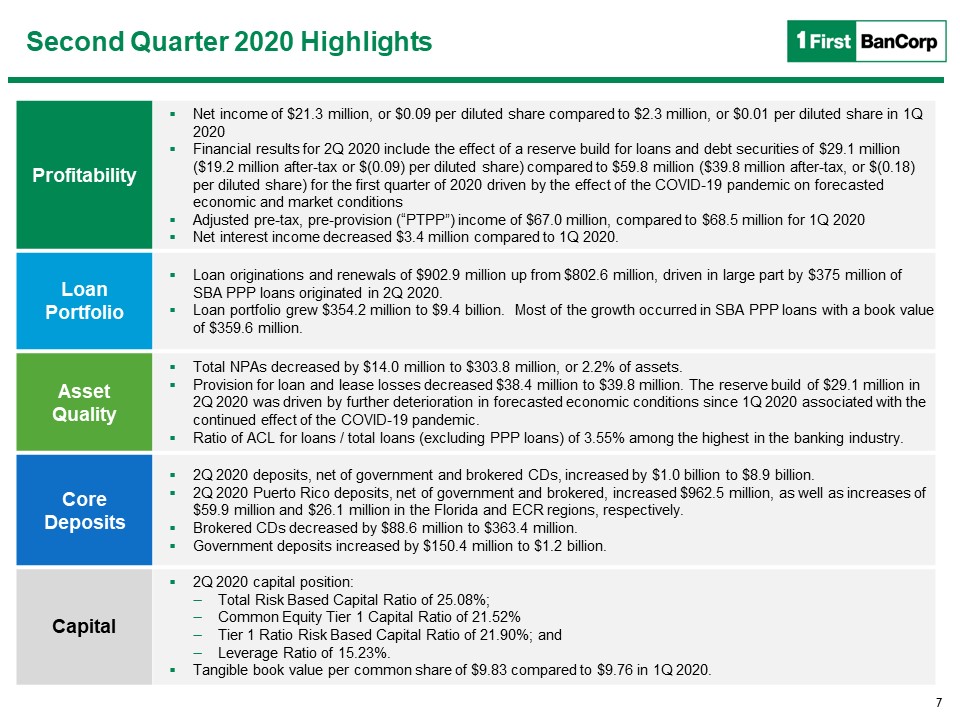
7 Second Quarter 2020 Highlights Profitability Net income of $21.3 million, or $0.09 per diluted
share compared to $2.3 million, or $0.01 per diluted share in 1Q 2020Financial results for 2Q 2020 include the effect of a reserve build for loans and debt securities of $29.1 million ($19.2 million after-tax or $(0.09) per diluted share)
compared to $59.8 million ($39.8 million after-tax, or $(0.18) per diluted share) for the first quarter of 2020 driven by the effect of the COVID-19 pandemic on forecasted economic and market conditionsAdjusted pre-tax, pre-provision (“PTPP”)
income of $67.0 million, compared to $68.5 million for 1Q 2020Net interest income decreased $3.4 million compared to 1Q 2020. Loan Portfolio Loan originations and renewals of $902.9 million up from $802.6 million, driven in large part by $375
million of SBA PPP loans originated in 2Q 2020.Loan portfolio grew $354.2 million to $9.4 billion. Most of the growth occurred in SBA PPP loans with a book value of $359.6 million. Asset Quality Total NPAs decreased by $14.0 million to $303.8
million, or 2.2% of assets.Provision for loan and lease losses decreased $38.4 million to $39.8 million. The reserve build of $29.1 million in 2Q 2020 was driven by further deterioration in forecasted economic conditions since 1Q 2020
associated with the continued effect of the COVID-19 pandemic.Ratio of ACL for loans / total loans (excluding PPP loans) of 3.55% among the highest in the banking industry. Core Deposits 2Q 2020 deposits, net of government and brokered CDs,
increased by $1.0 billion to $8.9 billion. 2Q 2020 Puerto Rico deposits, net of government and brokered, increased $962.5 million, as well as increases of $59.9 million and $26.1 million in the Florida and ECR regions, respectively.Brokered CDs
decreased by $88.6 million to $363.4 million.Government deposits increased by $150.4 million to $1.2 billion. Capital 2Q 2020 capital position: Total Risk Based Capital Ratio of 25.08%;Common Equity Tier 1 Capital Ratio of 21.52%Tier 1 Ratio
Risk Based Capital Ratio of 21.90%; andLeverage Ratio of 15.23%.Tangible book value per common share of $9.83 compared to $9.76 in 1Q 2020.

Results of Operations
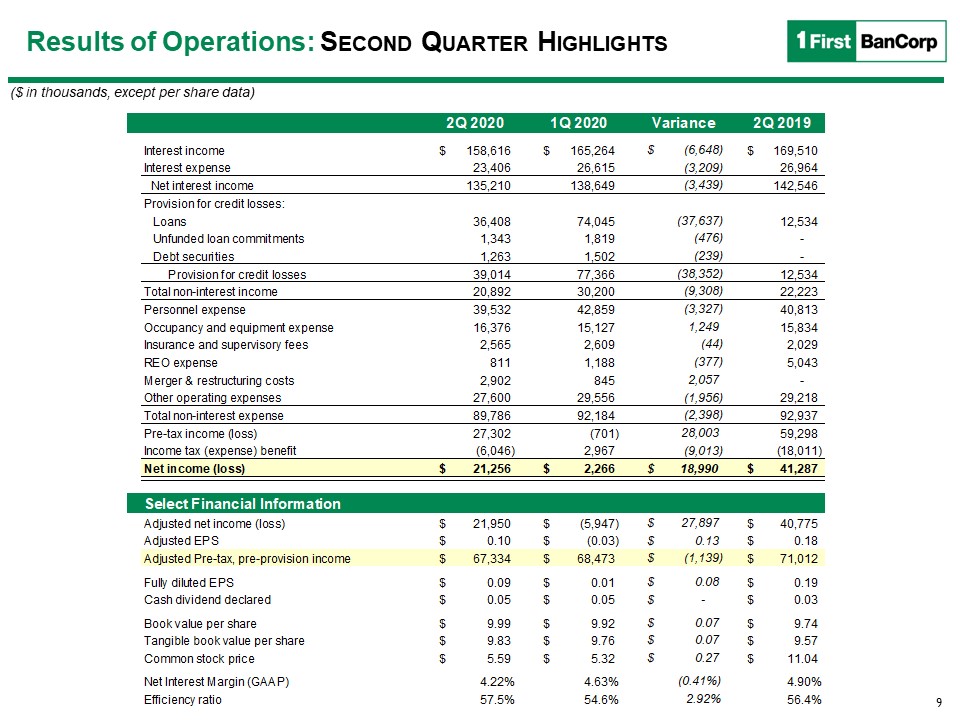
9 Results of Operations: Second Quarter Highlights ($ in thousands, except per share data) Select
Financial Information

10 Key Highlights Net Interest Income ($ millions) Net interest income decreased $3.4 million in 2Q
2020. This decrease was mainly due to a $2.0 million decrease in interest income from interest-bearing cash balances and a $1.6 million decrease in interest income on consumer loans, mostly in credit cards.Interest expense is down $3.2 million,
and the overall cost of funds declined 19 basis points to 0.84%GAAP NIM was 4.22%, compared to 4.63% for 1Q 2020. NIM impact is mostly related to reduced market interest rates and a change in the mix of average earing assets resulting from the
large increase in cash and money market resulting from the increase in deposits. Results of Operations: Net Interest Income
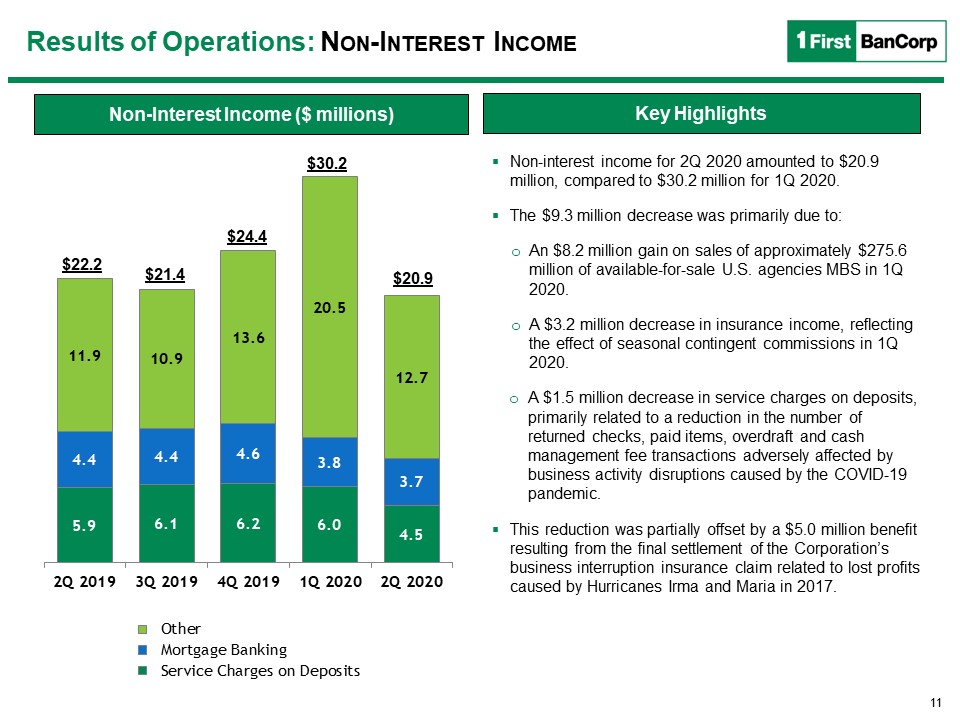
11 Non-interest income for 2Q 2020 amounted to $20.9 million, compared to $30.2 million for 1Q 2020. The
$9.3 million decrease was primarily due to: An $8.2 million gain on sales of approximately $275.6 million of available-for-sale U.S. agencies MBS in 1Q 2020.A $3.2 million decrease in insurance income, reflecting the effect of seasonal
contingent commissions in 1Q 2020.A $1.5 million decrease in service charges on deposits, primarily related to a reduction in the number of returned checks, paid items, overdraft and cash management fee transactions adversely affected by
business activity disruptions caused by the COVID-19 pandemic.This reduction was partially offset by a $5.0 million benefit resulting from the final settlement of the Corporation’s business interruption insurance claim related to lost profits
caused by Hurricanes Irma and Maria in 2017. Results of Operations: Non-Interest Income Non-Interest Income ($ millions) $20.9 $24.4 $30.2 $22.2 $21.4 Key Highlights

12 Results of Operations: Non-interest Expenses Non-interest expenses decreased by $2.4 million in 2Q
2020 to $89.8 million reflecting volume related expense reductions and expense control measures that were implemented.On a non-GAAP basis, adjusted non-interest expenses, excluding the effect of $2.9 million in merger and restructuring costs,
$3 million in COVID-19 pandemic-related expenses, and hurricane-related expenses insurance recoveries, decreased by $8.2 million to $83.9 million for 2Q 2020 compared to $92.1 million for 1Q 2020, due to:A $5.0 million decrease in adjusted
employees’ compensation and benefits expenses, driven by a $2.7 million increase in deferred loan origination costs in connection with the origination of SBA PPP loans, and a decrease of approximately $1.5 million related to lower seasonal
payroll taxes and bonuses expensesA $1.6 million decrease in adjusted business promotion expenses, driven by lower sponsorships, advertising, and marketing activities Non-Interest Expense Key Highlights
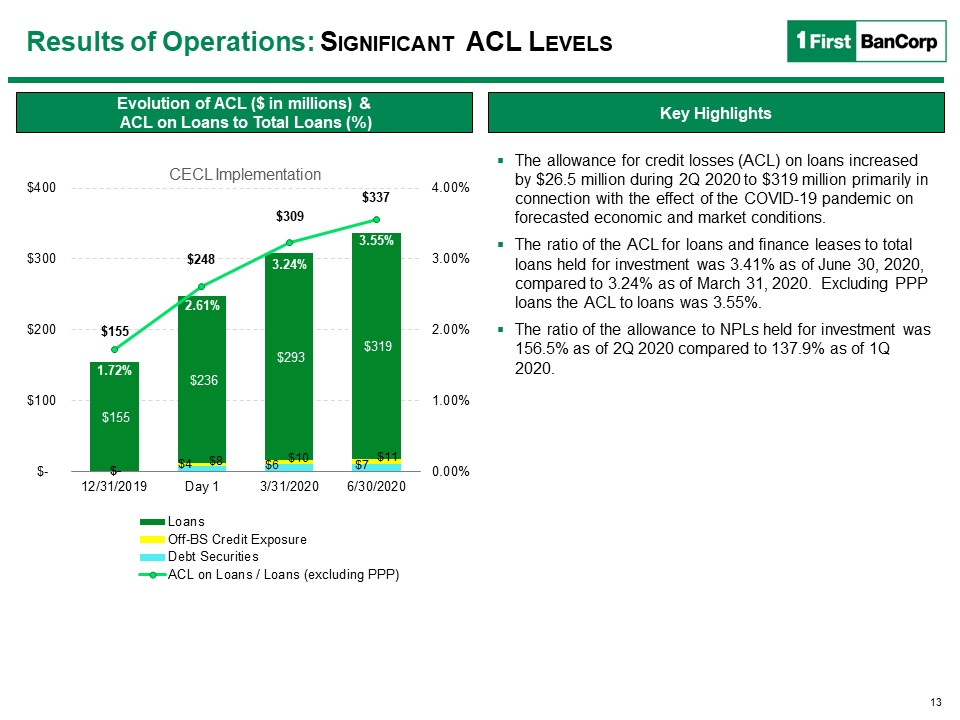
13 Evolution of ACL ($ in millions) & ACL on Loans to Total Loans (%) The allowance for credit
losses (ACL) on loans increased by $26.5 million during 2Q 2020 to $319 million primarily in connection with the effect of the COVID-19 pandemic on forecasted economic and market conditions.The ratio of the ACL for loans and finance leases to
total loans held for investment was 3.41% as of June 30, 2020, compared to 3.24% as of March 31, 2020. Excluding PPP loans the ACL to loans was 3.55%.The ratio of the allowance to NPLs held for investment was 156.5% as of 2Q 2020 compared to
137.9% as of 1Q 2020. Key Highlights Results of Operations: Significant ACL Levels

14 Net Charge-Offs ($ millions) Payment Deferral Programs Implemented moratorium programs for
commercial, consumer and residential mortgage customers in all regions. As of June 30, 2020 approximately 36% of our overall loan portfolio was granted payment deferrals. As of July 24th, customers under deferral programs have been reduced to
approximately 18% of the portfolio. On a percentage basis the amount by portfolio in deferral as of June 30th, compared to July 24th is as follows:Residential from 29% to 19%;Consumer from 34% to 16%; andCommercial from 42% to 19%. Net
charge-offs for 2Q 2020 were $9.9 million, or an annualized 0.43% of average loans, compared to $17.6 million, or an annualized 0.78% of average loans, in 1Q 2020. The decrease of $7.7 million in net charge-offs was mainly related to a $5.7
million decrease in consumer tied to the deferred repayment arrangements provided to borrowers effected by the pandemic and a $2.0 million decrease in residential mortgage loans, primarily related to a lower amount of charge-offs taken on
collateral dependent loans. $24 $18 $19 $10 $14 850 / 29% 784 / 34% 1,746 / 42% $3,380 / 36% 570 / 19% 279 / 16% 801 / 19% $1,650 / 18% Results of Operations: NCOs and Moratorium Activity

15 Non-Performing Assets ($ millions) Total nonaccrual loans decreased by $8.3 million to $204.0
million as of 2Q 2020, compared to $212.3 million as of 1Q 2020. The decrease in NPAs was driven by:$6.0 million decrease in nonaccrual consumer loans, primarily auto loans and small personal loans, driven by charge-offs and collections
recorded in 2Q 2020.$3.4 million decrease in the OREO portfolio balance. The decrease was driven by sales of $3.1 million, primarily residential OREO properties in the Puerto Rico region$2.3 million decrease in non-real estate repossessed
assets, primarily repossessed automobiles.Inflows to nonaccrual loans were $10.7 million, down $20.4 million compared to 1Q 2020. Total NPAs decreased by $14 million to $303.8 million or 2.16% of assets Results of Operations: Asset
Quality Q-o-Q Change in NPAs Migration Trend ($ millions)

Exhibits
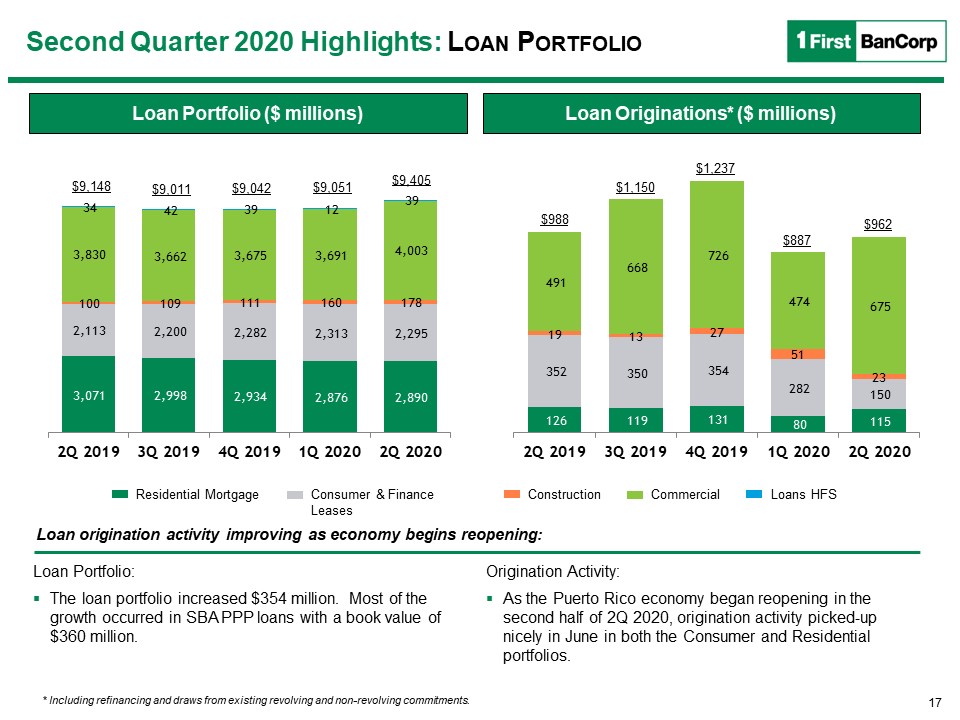
17 Loan Originations* ($ millions) Loan Portfolio ($ millions) Residential Mortgage Consumer &
Finance Leases Construction Commercial Loans HFS Loan origination activity improving as economy begins reopening: * Including refinancing and draws from existing revolving and non-revolving commitments. Second Quarter 2020
Highlights: Loan Portfolio $9,042 $9,405 $887 $9,148 $9,011 $1,150 Loan Portfolio:The loan portfolio increased $354 million. Most of the growth occurred in SBA PPP loans with a book value of $360 million. Origination Activity:As the
Puerto Rico economy began reopening in the second half of 2Q 2020, origination activity picked-up nicely in June in both the Consumer and Residential portfolios. $9,051 $988 $962 $1,237

18 Total Deposit Composition (%) Core Deposits* ($ millions) * Core deposits are total deposits
excluding brokered deposits. Continue improving deposit mix; core deposits increased $1.2 billion in 2Q 2020. Second Quarter 2020 Highlights: Deposit Mix Retail Commercial CDs & IRAs Public Funds $8,887 $8,543 Total
deposits, excluding brokered deposits and government deposits, increased by $1.0 billion to $8.9 billion as of June 30, 2020, consisting of a growth of $962.5 million in the Puerto Rico region, as well as increases of $59.9 million and $26.1
million in the Virgin Islands and Florida regions, respectively. Government deposits increased in the quarter by $150.4 million and totaled $1.2 billion as of June 30, 2020.Brokered certificates of deposits (“CDs”) decreased by $88.6 million
during the second quarter to $363.4 million as of June 30, 2020. $8,533 $10,086 $8,791
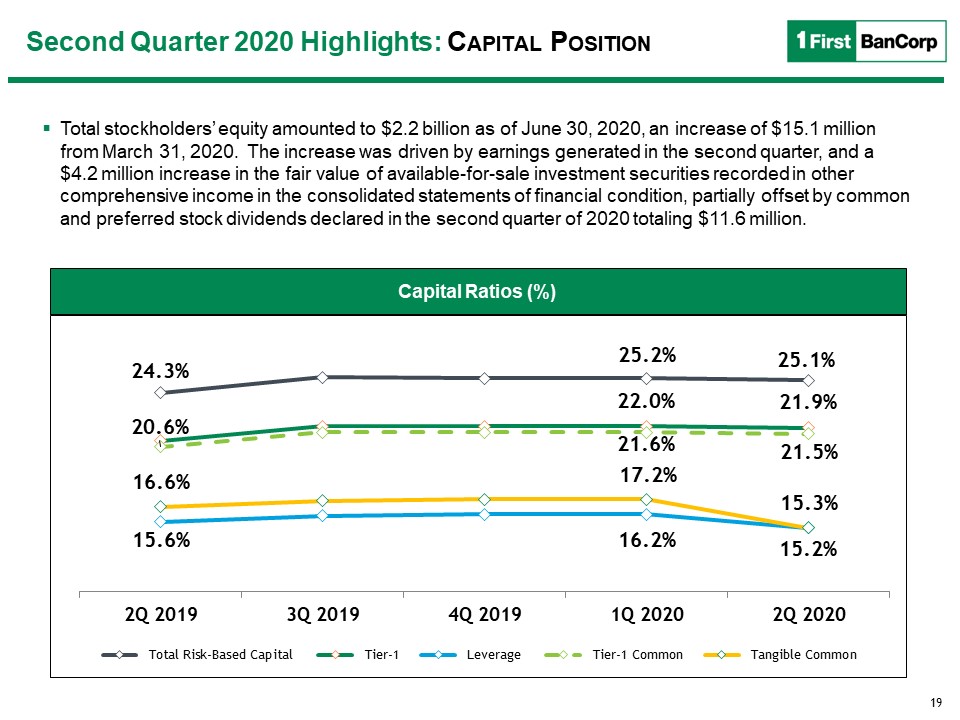
19 Capital Ratios (%) Total stockholders’ equity amounted to $2.2 billion as of June 30, 2020, an
increase of $15.1 million from March 31, 2020. The increase was driven by earnings generated in the second quarter, and a $4.2 million increase in the fair value of available-for-sale investment securities recorded in other comprehensive income
in the consolidated statements of financial condition, partially offset by common and preferred stock dividends declared in the second quarter of 2020 totaling $11.6 million. Capital Ratios (%) Second Quarter 2020 Highlights: Capital
Position
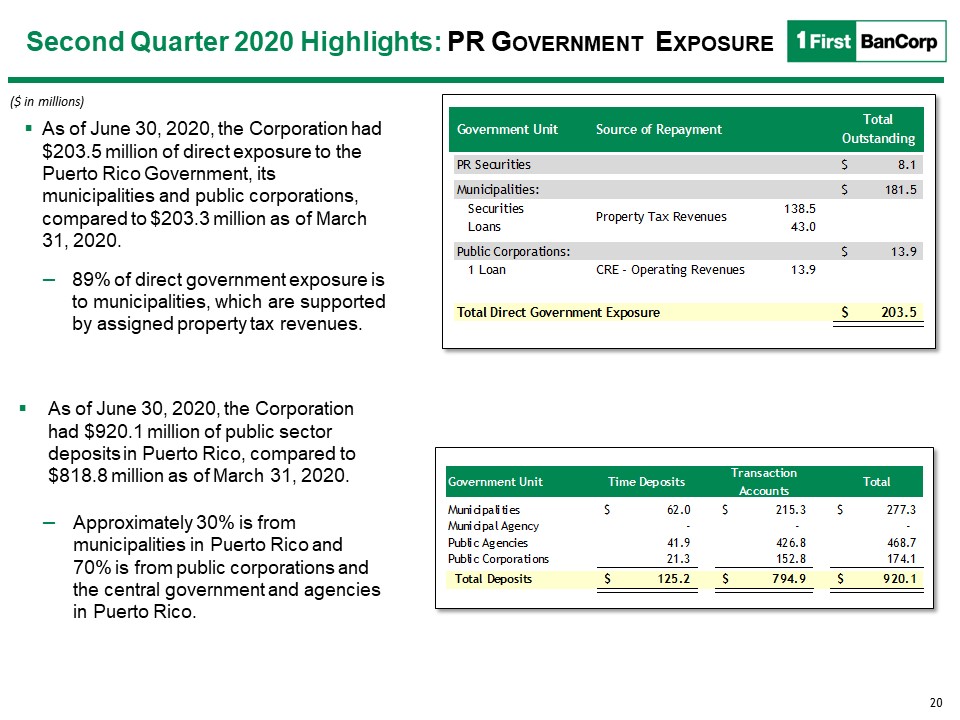
20 Second Quarter 2020 Highlights: PR Government Exposure ($ in millions) As of June 30, 2020, the
Corporation had $203.5 million of direct exposure to the Puerto Rico Government, its municipalities and public corporations, compared to $203.3 million as of March 31, 2020. 89% of direct government exposure is to municipalities, which are
supported by assigned property tax revenues. As of June 30, 2020, the Corporation had $920.1 million of public sector deposits in Puerto Rico, compared to $818.8 million as of March 31, 2020.Approximately 30% is from municipalities in Puerto
Rico and 70% is from public corporations and the central government and agencies in Puerto Rico.
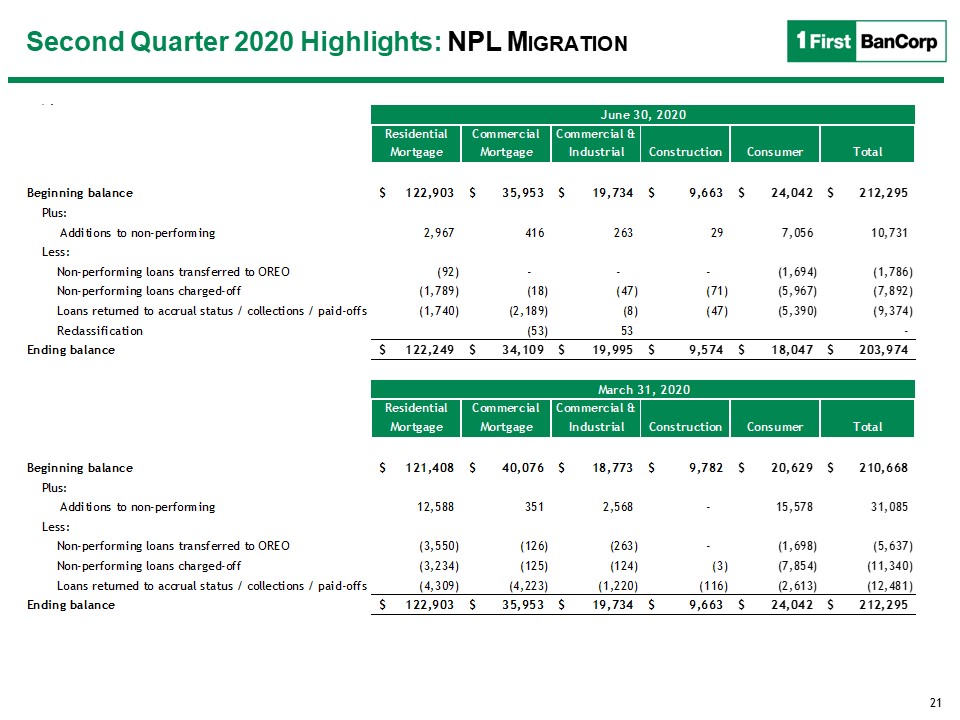
21 ($ in 000) Second Quarter 2020 Highlights: NPL Migration

22 Use of Non-GAAP Financial Measures Basis of PresentationUse of Non-GAAP Financial Measures This
presentation contains non-GAAP financial measures. Non-GAAP financial measures are used when management believes they will be helpful to an understanding of the Corporation’s results of operations or financial position. Where non-GAAP financial
measures are used, the comparable GAAP financial measure, as well as the reconciliation of the non-GAAP financial measure to the comparable GAAP financial measure, can be found in the text or in the attached tables to this earnings release. Any
analysis of these non-GAAP financial measures should be used only in conjunction with results presented in accordance with GAAP. Tangible Common Equity Ratio and Tangible Book Value per Common Share The tangible common equity ratio and tangible
book value per common share are non-GAAP financial measures generally used by the financial community to evaluate capital adequacy. Tangible common equity is total equity less preferred equity, goodwill, core deposit intangibles, and other
intangibles, such as the purchased credit card relationship intangible and the insurance customer relationship intangible. Tangible assets are total assets less goodwill, core deposit intangibles, and other intangibles, such as the purchased
credit card relationship intangible and the insurance customer relationship intangible. Management and many stock analysts use the tangible common equity ratio and tangible book value per common share in conjunction with more traditional bank
capital ratios to compare the capital adequacy of banking organizations with significant amounts of goodwill or other intangible assets, typically stemming from the use of the purchase method of accounting for mergers and acquisitions.
Accordingly, the Corporation believes that disclosures of these financial measures may be useful also to investors. Neither tangible common equity nor tangible assets, or the related measures should be considered in isolation or as a substitute
for stockholders’ equity, total assets, or any other measure calculated in accordance with GAAP. Moreover, the manner in which the Corporation calculates its tangible common equity, tangible assets, and any other related measures may differ
from that of other companies reporting measures with similar names.

23 Use of Non-GAAP Financial Measures Basis of PresentationUse of Non-GAAP Financial Measures This
presentation contains non-GAAP financial measures. Non-GAAP financial measures are used when management believes they will be helpful to an understanding of the Corporation’s results of operations or financial position. Where non-GAAP financial
measures are used, the comparable GAAP financial measure, as well as the reconciliation of the non-GAAP financial measure to the comparable GAAP financial measure, can be found in the text or in the attached tables to this earnings release. Any
analysis of these non-GAAP financial measures should be used only in conjunction with results presented in accordance with GAAP. Adjusted Pre-Tax, Pre-Provision IncomeAdjusted pre-tax, pre-provision income is a non-GAAP performance metric that
management uses and believes that investors may find useful in analyzing underlying performance trends, particularly in times of economic stress. Adjusted pre-tax, pre-provision income, as defined by management, represents net income (loss)
excluding income tax expense (benefit), the provision for loan and lease losses, as well as certain items that management believes are not reflective of core operating performance or that are not expected to reoccur with any regularity or
reoccur at uncertain times and amounts. This metric is income before income taxes adjusted to exclude the provision for loan and lease losses, gains or losses on sales of investment securities and impairments, and fair value adjustments on
derivatives. In addition, from time to time, earnings are adjusted also for items that management believes are not reflective of core operating performance or that are not expected to reoccur with any regularity or reoccur at uncertain times
and amounts.

24 Use of Non-GAAP Financial Measures Basis of PresentationUse of Non-GAAP Financial Measures This
presentation contains non-GAAP financial measures. Non-GAAP financial measures are used when management believes they will be helpful to an understanding of the Corporation’s results of operations or financial position. Where non-GAAP financial
measures are used, the comparable GAAP financial measure, as well as the reconciliation of the non-GAAP financial measure to the comparable GAAP financial measure, can be found in the text or in the attached tables to this earnings release. Any
analysis of these non-GAAP financial measures should be used only in conjunction with results presented in accordance with GAAP. The financial results include the following significant items that management believes are not reflective of core
operating performance, are not expected to reoccur with any regularity or may reoccur at uncertain times and in uncertain amounts (the “Special Items”):Quarter ended June 30, 2020A $5.0 million ($3.1 million after-tax) benefit resulting from
the final settlement of the Corporation’s business interruption insurance claim related to lost profits caused by Hurricanes Irma and Maria in 2017.Merger and restructuring costs of $2.9 million ($1.8 million after-tax) in connection with the
previously announced stock purchase agreement with Santander Holdings USA, Inc. relating to the Corporation’s acquisition of BSPR and related restructuring initiatives. Merger and restructuring costs in the second quarter of 2020 primarily
included consulting, legal, and other pre-conversion related efforts associated with the pending acquisition of BSPR.Costs of $3.0 million ($1.9 million after-tax) related to the COVID-19 pandemic response efforts, including approximately $1.7
million in bonuses paid to branch personnel and other essential employees for working during the pandemic, as well as other employee-related expenses such as expenses for the administration of COVID-19 tests and purchases of personal protective
equipment.A $0.2 million loss realized on sales of U.S. agencies MBS. The loss, realized at the tax-exempt international banking entity subsidiary, had no effect on the income tax expense recorded in the second quarter of 2020.

25 Use of Non-GAAP Financial Measures Basis of PresentationUse of Non-GAAP Financial Measures This
presentation contains non-GAAP financial measures. Non-GAAP financial measures are used when management believes they will be helpful to an understanding of the Corporation’s results of operations or financial position. Where non-GAAP financial
measures are used, the comparable GAAP financial measure, as well as the reconciliation of the non-GAAP financial measure to the comparable GAAP financial measure, can be found in the text or in the attached tables to this earnings release. Any
analysis of these non-GAAP financial measures should be used only in conjunction with results presented in accordance with GAAP. The financial results include the following significant items that management believes are not reflective of core
operating performance, are not expected to reoccur with any regularity or may reoccur at uncertain times and in uncertain amounts (the “Special Items”):Quarter ended March 31, 2020An $8.2 million gain on sales of approximately $275.6 million of
U.S. agencies MBS executed in the latter part of March. The gain, realized at the tax-exempt international banking entity subsidiary, had no effect on the income tax expense recorded in the first quarter of 2020.A $1.2 million ($0.7 million
after-tax) benefit resulting from insurance recoveries associated with hurricane-related expenses incurred primarily in the Puerto Rico region.Merger and restructuring costs of $0.8 million ($0.5 million after-tax) in connection with the
pending acquisition of BSPR and related restructuring initiatives. Costs of $0.4 million ($0.2 million after-tax) related to the COVID-19 pandemic response efforts, primarily costs related to additional cleaning and communications with
customers. Quarter ended June 30, 2019A $0.8 million ($0.5 million after-tax) benefit resulting from hurricane-related insurance recoveries related to impairments, repairs and maintenance costs incurred on facilities in the British Virgin
Islands.

26 Use of Non-GAAP Financial Measures Basis of PresentationUse of Non-GAAP Financial Measures This
presentation contains non-GAAP financial measures. Non-GAAP financial measures are used when management believes they will be helpful to an understanding of the Corporation’s results of operations or financial position. Where non-GAAP financial
measures are used, the comparable GAAP financial measure, as well as the reconciliation of the non-GAAP financial measure to the comparable GAAP financial measure, can be found in the text or in the attached tables to this earnings release. Any
analysis of these non-GAAP financial measures should be used only in conjunction with results presented in accordance with GAAP. The following table the reported net income to adjusted net income, a non-GAAP financial measure that excludes the
Special Items identified on prior pages as well as gains or losses on sales of investment securities and impairments:Adjusted net income (Non-GAAP)