Attached files
| file | filename |
|---|---|
| EX-99.1 - EXHIBIT 99.1 - TCF FINANCIAL CORP | tcf063020form8kexhibit991r.htm |
| 8-K - 8-K - TCF FINANCIAL CORP | tcf063020form8kearning.htm |
July 27, 2020 TCF Financial Corporation 2Q20 Earnings Presentation
Cautionary Statements for the Purposes of Safe Harbor Provisions of the Securities Litigation Reform Act Any statements contained in this presentation regarding the outlook for the Company's businesses and their respective markets, such as projections of future performance, targets, guidance, statements of the Company's plans and objectives, forecasts of market trends and other matters are forward-looking statements based on the Company's assumptions and beliefs. Such statements may be identified by such words or phrases as "will likely result," "are expected to," "will continue," "outlook," "will benefit," "is anticipated," "estimate," "project," "management believes" or similar expressions. These forward-looking statements are subject to certain risks and uncertainties that could cause actual results to differ materially from those discussed in such statements, and no assurance can be given that the results in any forward-looking statement will be achieved. For these statements, TCF claims the protection of the safe harbor for forward-looking statements contained in the Private Securities Litigation Reform Act of 1995. Any forward-looking statement speaks only as of the date on which it is made, and we disclaim any obligation to subsequently revise any forward-looking statement to reflect events or circumstances after such date or to reflect the occurrence of anticipated or unanticipated events. This presentation also contains forward-looking statements regarding TCF’s (formerly Chemical Financial Corporation) outlook or expectations with respect to the merger and integration with legacy TCF Financial Corporation. Examples of forward-looking statements include, but are not limited to, statements regarding outlook and expectations with respect to strategic and financial benefits of the merger, including the expected impact of the transaction on TCF’s future financial performance (including anticipated accretion to earnings per share, the tangible book value earn-back period and other operating and return metrics), the expected costs to be incurred in connection with the merger, and operational aspects of post-merger integration. Certain factors could cause the Company's future results to differ materially from those expressed or implied in any forward-looking statements contained herein. These factors include the factors discussed in Part I, Item 1A of this Annual Report on Form 10-K under the heading "Risk Factors" or otherwise disclosed in documents filed or furnished by the Company with or to the SEC after the filing of this Annual Report on Form 10-K, the factors discussed below, and any other cautionary statements, written or oral, which may be made or referred to in connection with any such forward- looking statements. Since it is not possible to foresee all such factors, these factors should not be considered as complete or exhaustive: macroeconomic and other challenges and uncertainties resulting from the COVID-19 pandemic, such as the extent and duration of the impact on public health, the U.S. and global economies, financial markets and consumer and corporate customers and clients, including economic activity, employment levels and market liquidity, as well as the various actions taken in response to the challenges and uncertainties by governments, central banks and others, including TCF; a failure to manage credit risk; cyber-security breaches involving us or third parties, hacking, denial of service, loss or theft of information, or other cyber-attacks that disrupt TCF's business operations or damage its reputation; adverse developments affecting TCF's branches, including supermarket branches; inability to successfully execute on TCF's growth strategy through acquisitions or expanding existing business relationships; adverse effects related to competition from traditional competitors, non-bank providers of financial services and new technologies; failure to keep pace with technological change, including with respect to customer demands or system upgrades; risks related to developing new products, markets or lines of business; risks related to TCF's loan origination and sales activity; lack of access to liquidity or raise capital that isn’t dilutive; adverse changes in monetary, fiscal or tax policies; litigation or government enforcement actions; heightened consumer protection, supervisory or regulatory practices or requirements; deficiencies in TCF's compliance programs or risk mitigation frameworks; dependence on accurate and complete information from customers and counterparties; the failure to attract and retain key employees; ineffective internal controls; soundness of other financial institutions and other counterparty risk, including the risk of default, operational disruptions, or diminished availability of counterparties who satisfy our credit quality requirements; inability to grow deposits, increase earnings and revenue, manage operating expenses, or pay and receive dividends; interruptions, systems failures information technology and telecommunications systems failures of third-party services; deficiencies in TCF's quantitative models; the effect of any negative publicity or reputational damage; technological or operational difficulties; changes in accounting standards or interpretations of existing standards; adverse federal, state or foreign tax assessments; and the effects of man-made and natural disasters, any of which may negatively affect our operations and/or our customers. Use of Non-GAAP Financial Measures Management uses the adjusted net income, adjusted diluted earnings per common share, adjusted ROAA, adjusted ROACE, ROATCE, adjusted ROATCE, adjusted efficiency ratio, adjusted net interest income, net interest margin (FTE), adjusted net interest margin (FTE), adjusted noninterest income, adjusted noninterest expense, tangible book value per common share, tangible common equity to tangible assets and the allowance for credit losses as percentage of total loans and leases, excluding PPP loans internally to measure performance and believes that these financial measures not recognized under generally accepted accounting principles in the United States ("GAAP") (i.e. non-GAAP) provide meaningful information to investors that will permit them to assess the Corporation's capital and ability to withstand unexpected market or economic conditions and to assess the performance of the Corporation in relation to other banking institutions on the same basis as that applied by management, analysts and banking regulators. TCF adjusts certain results to exclude merger-related expenses and notable items in addition to presenting net interest income and net interest margin (FTE) excluding purchase accounting accretion and amortization and the impact of PPP loans. Management believes these measures are useful to investors in understanding TCF's business and operating results. These non-GAAP financial measures are not defined by GAAP and other entities may calculate them differently than TCF does. Non-GAAP financial measures have inherent limitations and are not required to be uniformly applied. Although these non-GAAP financial measures are frequently used by stakeholders in the evaluation of a corporation, they have limitations as analytical tools and should not be considered in isolation or as a substitute for analyses of results as reported under GAAP. In particular, a measure of earnings that excludes selected items does not represent the amount that effectively accrues directly to shareholders. Reconciliations of non-GAAP financial measures to the most directly comparable GAAP financial measure may be found in the reconciliation tables included in this press release. 2
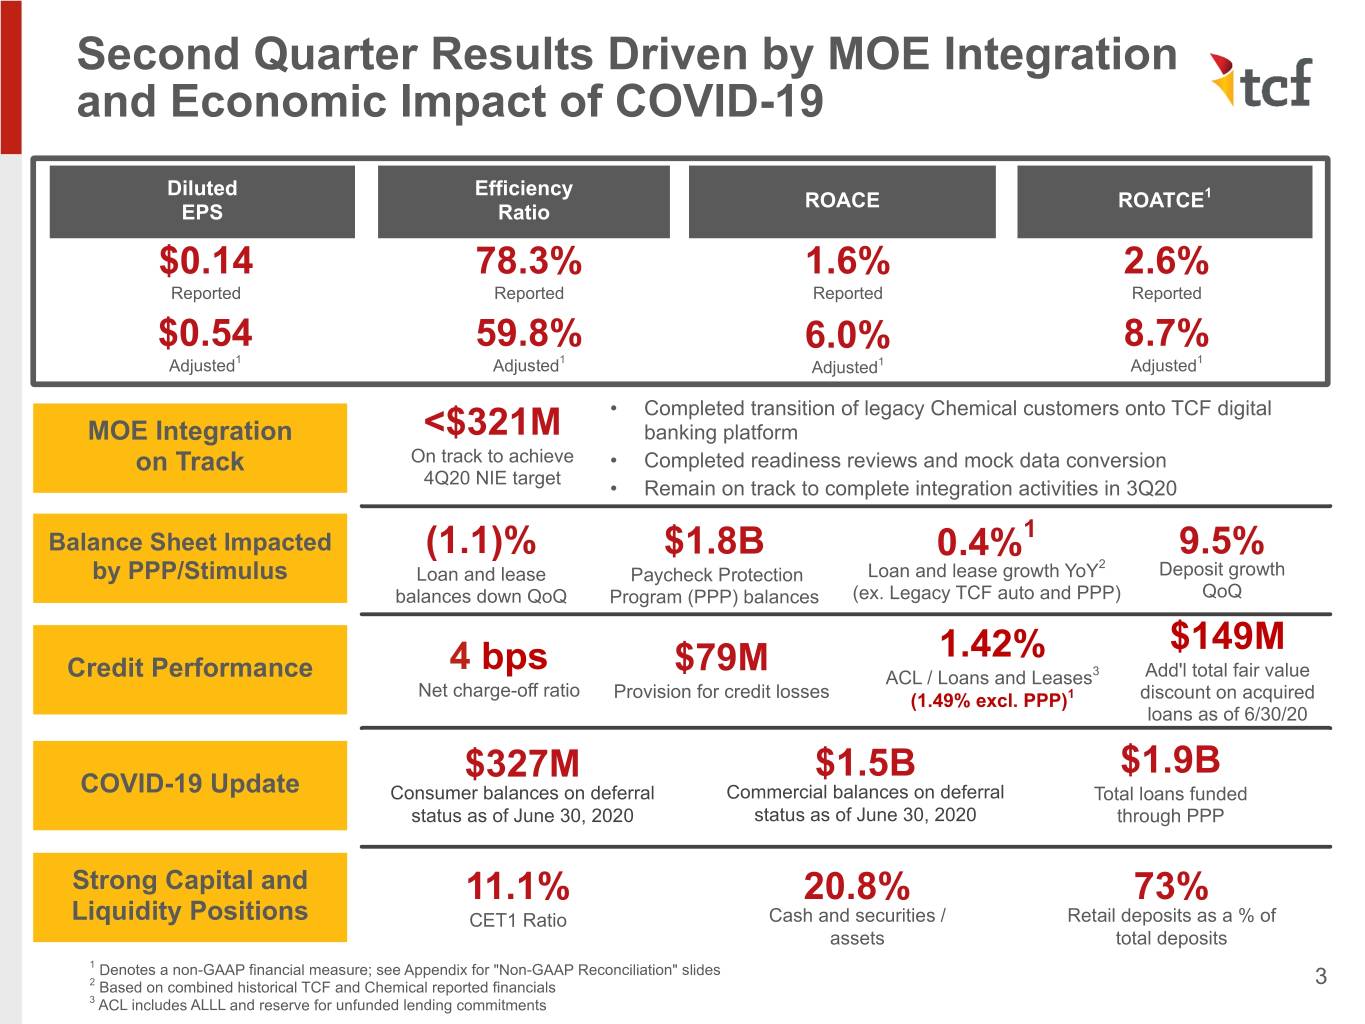
Second Quarter Results Driven by MOE Integration and Economic Impact of COVID-19 Diluted Efficiency ROACE ROATCE1 EPS Ratio $0.14 78.3% 1.6% 2.6% Reported Reported Reported Reported $0.54 59.8% 6.0% 8.7% Adjusted1 Adjusted1 Adjusted1 Adjusted1 • Completed transition of legacy Chemical customers onto TCF digital MOE Integration <$321M banking platform on Track On track to achieve • Completed readiness reviews and mock data conversion 4Q20 NIE target • Remain on track to complete integration activities in 3Q20 1 Balance Sheet Impacted (1.1)% $1.8B 0.4% 9.5% 2 by PPP/Stimulus Loan and lease Paycheck Protection Loan and lease growth YoY Deposit growth balances down QoQ Program (PPP) balances (ex. Legacy TCF auto and PPP) QoQ 1.42% $149M 4 bps $79M 3 Credit Performance ACL / Loans and Leases Add'l total fair value Net charge-off ratio 1 Provision for credit losses (1.49% excl. PPP) discount on acquired loans as of 6/30/20 $327M $1.5B $1.9B COVID-19 Update Consumer balances on deferral Commercial balances on deferral Total loans funded status as of June 30, 2020 status as of June 30, 2020 through PPP Strong Capital and 11.1% 20.8% 73% Liquidity Positions CET1 Ratio Cash and securities / Retail deposits as a % of assets total deposits 1 Denotes a non-GAAP financial measure; see Appendix for "Non-GAAP Reconciliation" slides 2 Based on combined historical TCF and Chemical reported financials 3 3 ACL includes ALLL and reserve for unfunded lending commitments
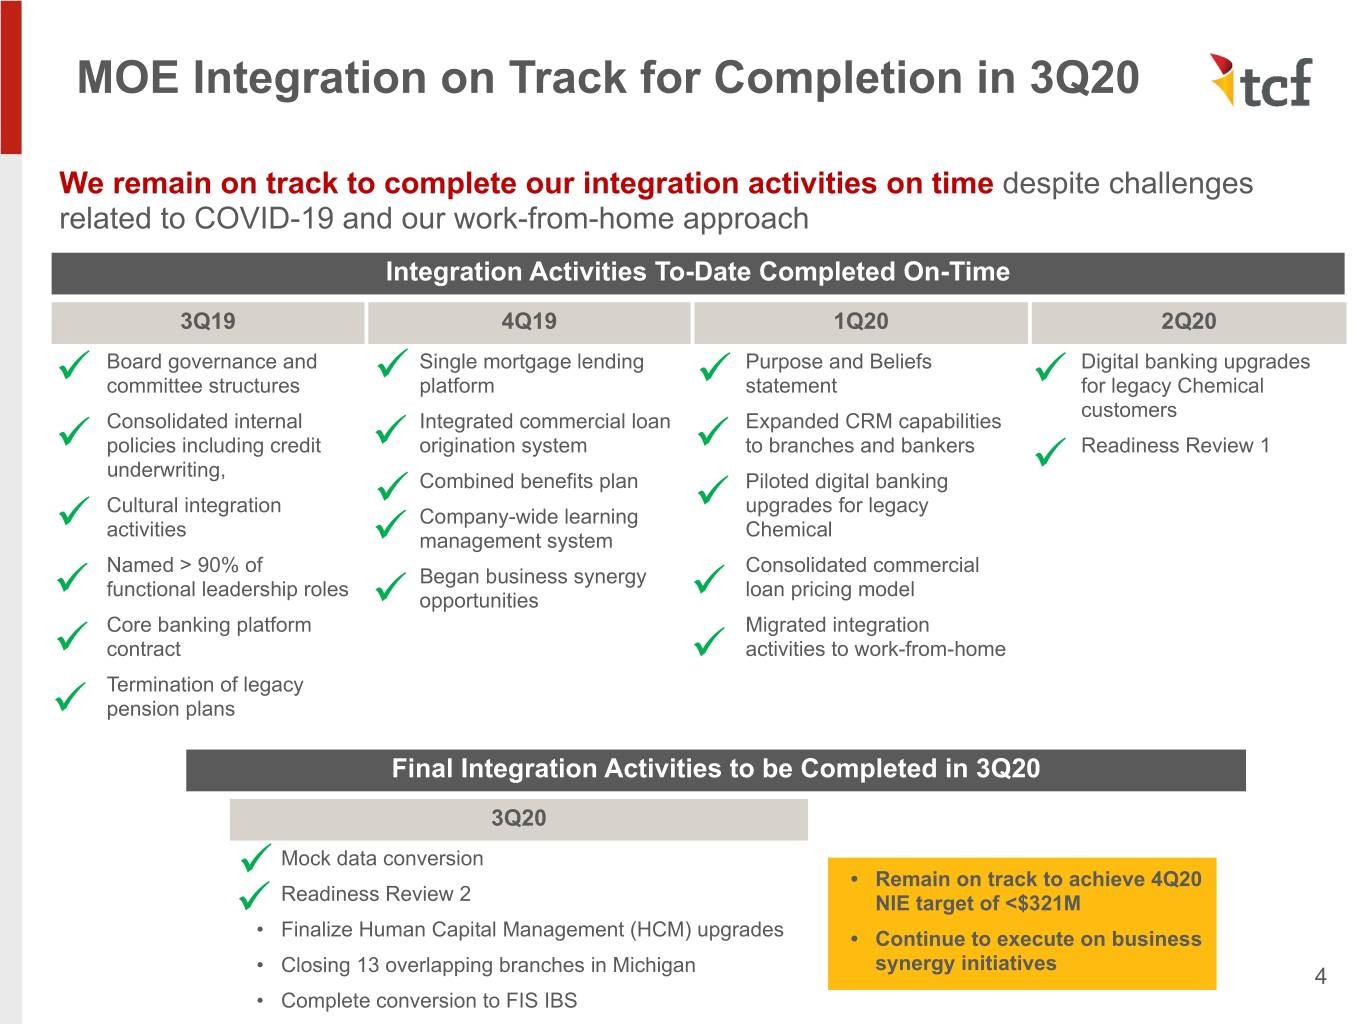
MOE Integration on Track for Completion in 3Q20 We remain on track to complete our integration activities on time despite challenges related to COVID-19 and our work-from-home approach Integration Activities To-Date Completed On-Time 3Q19 4Q19 1Q20 2Q20 ü Board governance and ü Single mortgage lending ü Purpose and Beliefs ü Digital banking upgrades committee structures platform statement for legacy Chemical customers ü Consolidated internal ü Integrated commercial loan ü Expanded CRM capabilities policies including credit origination system to branches and bankers ü Readiness Review 1 underwriting, ü Combined benefits plan ü Piloted digital banking Cultural integration upgrades for legacy ü Company-wide learning activities ü Chemical management system Named > 90% of Consolidated commercial ü Began business synergy ü functional leadership roles ü loan pricing model opportunities ü Core banking platform Migrated integration contract ü activities to work-from-home ü Termination of legacy pension plans Final Integration Activities to be Completed in 3Q20 3Q20 ü Mock data conversion • Remain on track to achieve 4Q20 ü Readiness Review 2 NIE target of <$321M • Finalize Human Capital Management (HCM) upgrades • Continue to execute on business • Closing 13 overlapping branches in Michigan synergy initiatives 4 • Complete conversion to FIS IBS
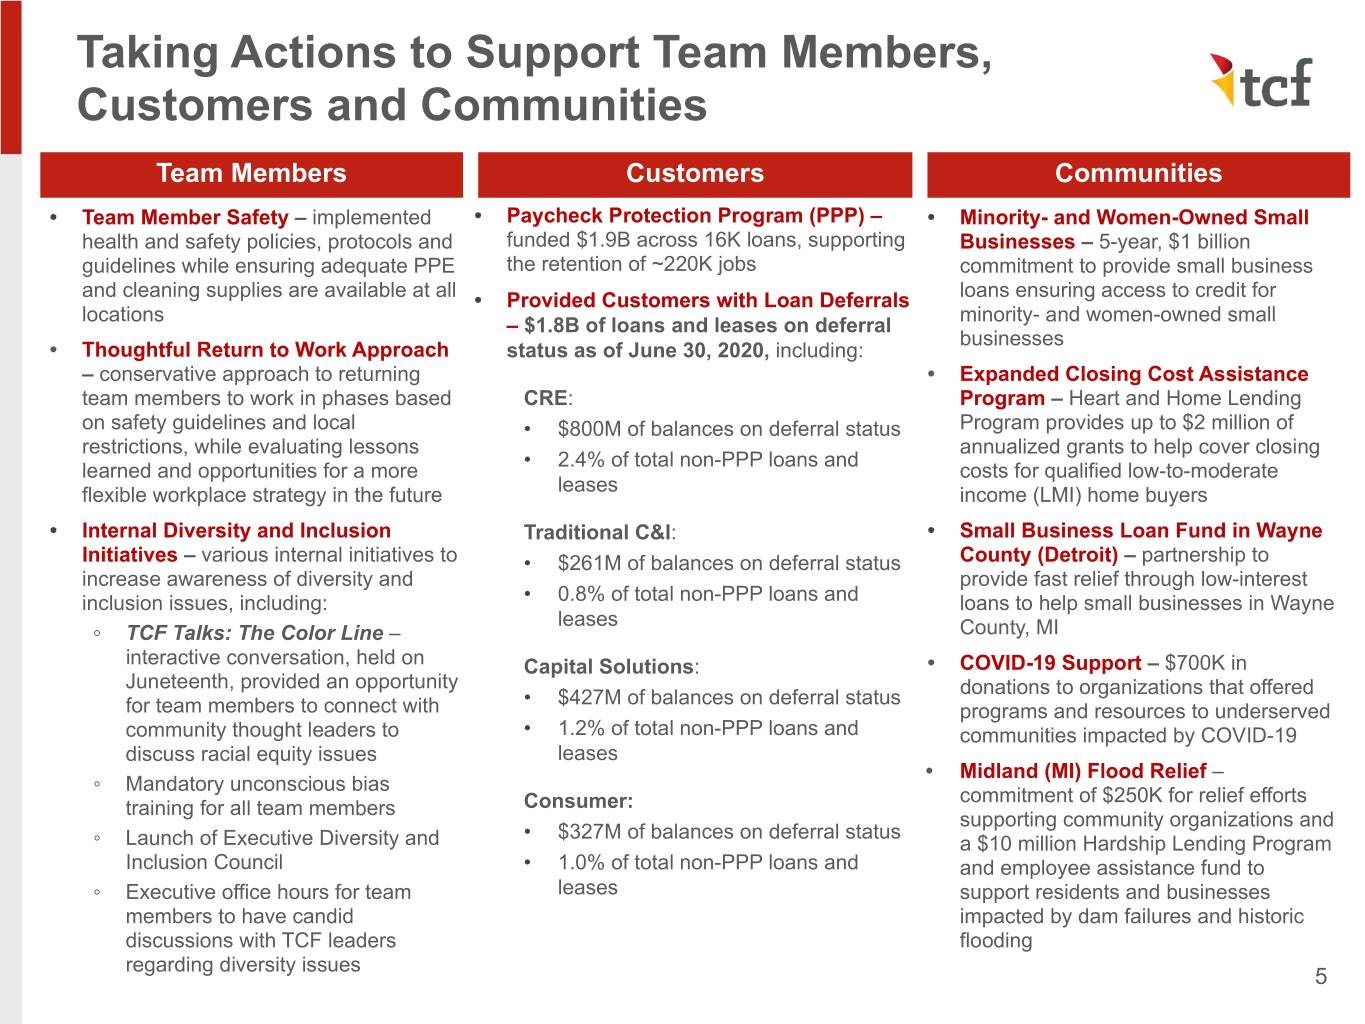
Taking Actions to Support Team Members, Customers and Communities Team Members Customers Communities • Team Member Safety – implemented • Paycheck Protection Program (PPP) – • Minority- and Women-Owned Small health and safety policies, protocols and funded $1.9B across 16K loans, supporting Businesses – 5-year, $1 billion guidelines while ensuring adequate PPE the retention of ~220K jobs commitment to provide small business and cleaning supplies are available at all • Provided Customers with Loan Deferrals loans ensuring access to credit for locations minority- and women-owned small – $1.8B of loans and leases on deferral businesses • Thoughtful Return to Work Approach status as of June 30, 2020, including: – conservative approach to returning • Expanded Closing Cost Assistance team members to work in phases based CRE: Program – Heart and Home Lending on safety guidelines and local • $800M of balances on deferral status Program provides up to $2 million of restrictions, while evaluating lessons annualized grants to help cover closing • 2.4% of total non-PPP loans and learned and opportunities for a more costs for qualified low-to-moderate flexible workplace strategy in the future leases income (LMI) home buyers • Internal Diversity and Inclusion Traditional C&I: • Small Business Loan Fund in Wayne Initiatives – various internal initiatives to • $261M of balances on deferral status County (Detroit) – partnership to increase awareness of diversity and provide fast relief through low-interest inclusion issues, including: • 0.8% of total non-PPP loans and loans to help small businesses in Wayne leases ◦ TCF Talks: The Color Line – County, MI interactive conversation, held on Capital Solutions: • COVID-19 Support – $700K in Juneteenth, provided an opportunity • $427M of balances on deferral status donations to organizations that offered for team members to connect with programs and resources to underserved community thought leaders to • 1.2% of total non-PPP loans and communities impacted by COVID-19 discuss racial equity issues leases • Midland (MI) Flood Relief – ◦ Mandatory unconscious bias commitment of $250K for relief efforts training for all team members Consumer: supporting community organizations and • $327M of balances on deferral status ◦ Launch of Executive Diversity and a $10 million Hardship Lending Program Inclusion Council • 1.0% of total non-PPP loans and and employee assistance fund to ◦ Executive office hours for team leases support residents and businesses members to have candid impacted by dam failures and historic discussions with TCF leaders flooding regarding diversity issues 5
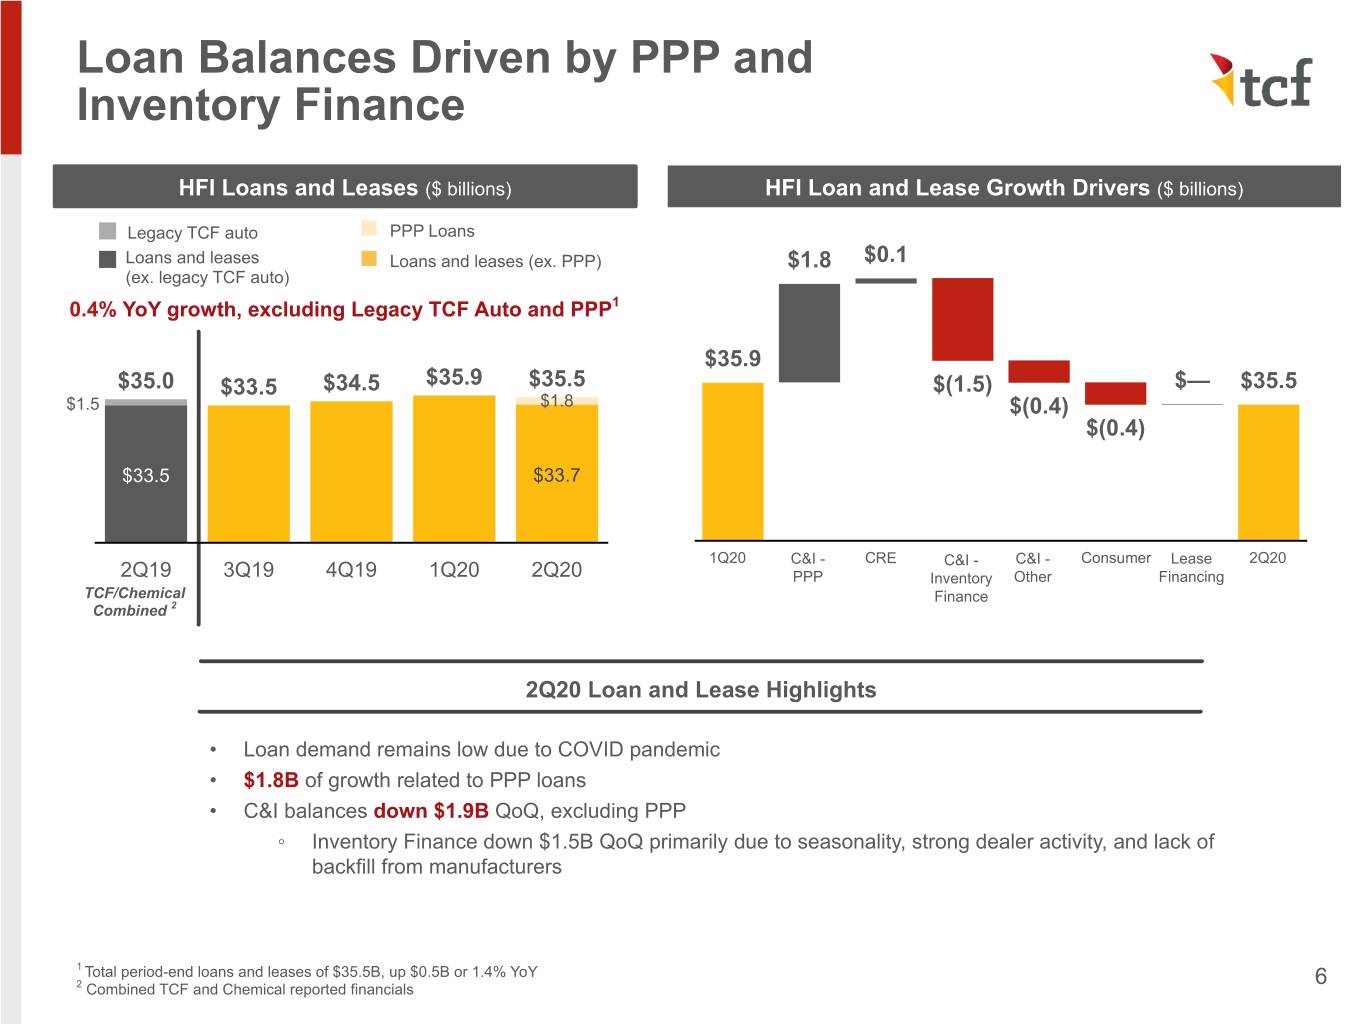
Loan Balances Driven by PPP and Inventory Finance HFI Loans and Leases ($ billions) HFI Loan and Lease Growth Drivers ($ billions) Legacy TCF auto PPP Loans Loans and leases Loans and leases (ex. PPP) $1.8 $0.1 (ex. legacy TCF auto) 0.4% YoY growth, excluding Legacy TCF Auto and PPP1 $35.9 $35.0 $33.5 $34.5 $35.9 $35.5 $(1.5) $— $35.5 $1.5 $1.8 $(0.4) $(0.4) $33.5 $33.7 1Q20 C&I - CRE C&I - C&I - Consumer Lease 2Q20 2Q19 3Q19 4Q19 1Q20 2Q20 PPP Inventory Other Financing TCF/Chemical Finance Combined 2 2Q20 Loan and Lease Highlights • Loan demand remains low due to COVID pandemic • $1.8B of growth related to PPP loans • C&I balances down $1.9B QoQ, excluding PPP ◦ Inventory Finance down $1.5B QoQ primarily due to seasonality, strong dealer activity, and lack of backfill from manufacturers 1 Total period-end loans and leases of $35.5B, up $0.5B or 1.4% YoY 6 2 Combined TCF and Chemical reported financials
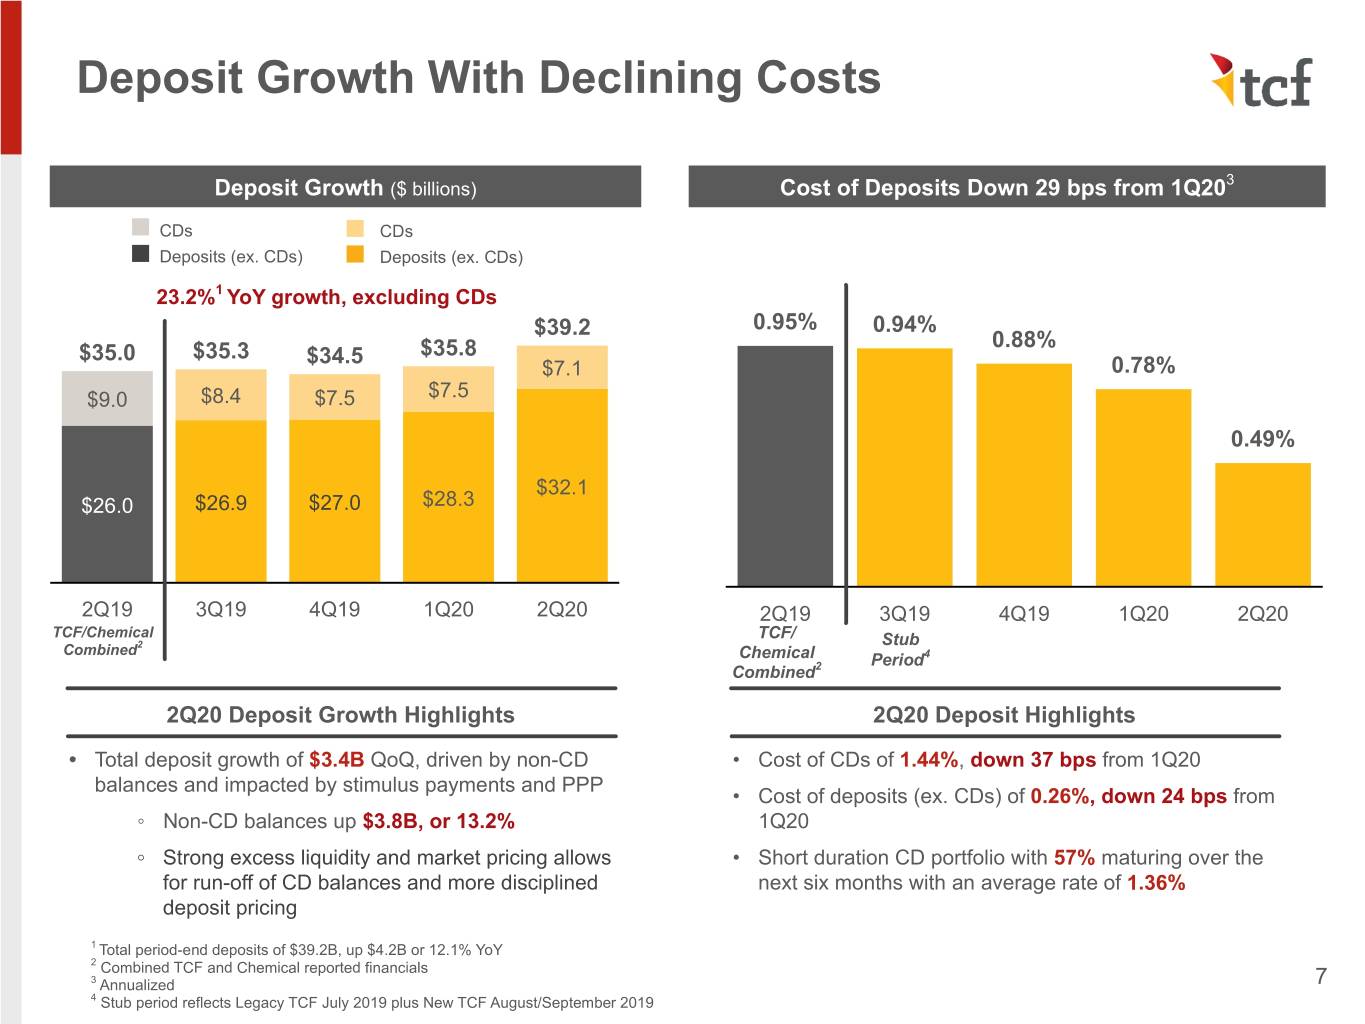
Deposit Growth With Declining Costs 3 Deposit Growth ($ billions) Cost of Deposits Down 29 bps from 1Q20 CDs CDs Deposits (ex. CDs) Deposits (ex. CDs) 23.2%1 YoY growth, excluding CDs $39.2 0.95% 0.94% 0.88% $35.0 $35.3 $34.5 $35.8 $7.1 0.78% $9.0 $8.4 $7.5 $7.5 0.49% $32.1 $26.0 $26.9 $27.0 $28.3 2Q19 3Q19 4Q19 1Q20 2Q20 2Q19 3Q19 4Q19 1Q20 2Q20 TCF/Chemical TCF/ Stub Combined2 Chemical Period4 Combined2 2Q20 Deposit Growth Highlights 2Q20 Deposit Highlights • Total deposit growth of $3.4B QoQ, driven by non-CD • Cost of CDs of 1.44%, down 37 bps from 1Q20 balances and impacted by stimulus payments and PPP • Cost of deposits (ex. CDs) of 0.26%, down 24 bps from ◦ Non-CD balances up $3.8B, or 13.2% 1Q20 ◦ Strong excess liquidity and market pricing allows • Short duration CD portfolio with 57% maturing over the for run-off of CD balances and more disciplined next six months with an average rate of 1.36% deposit pricing 1 Total period-end deposits of $39.2B, up $4.2B or 12.1% YoY 2 Combined TCF and Chemical reported financials 3 Annualized 7 4 Stub period reflects Legacy TCF July 2019 plus New TCF August/September 2019
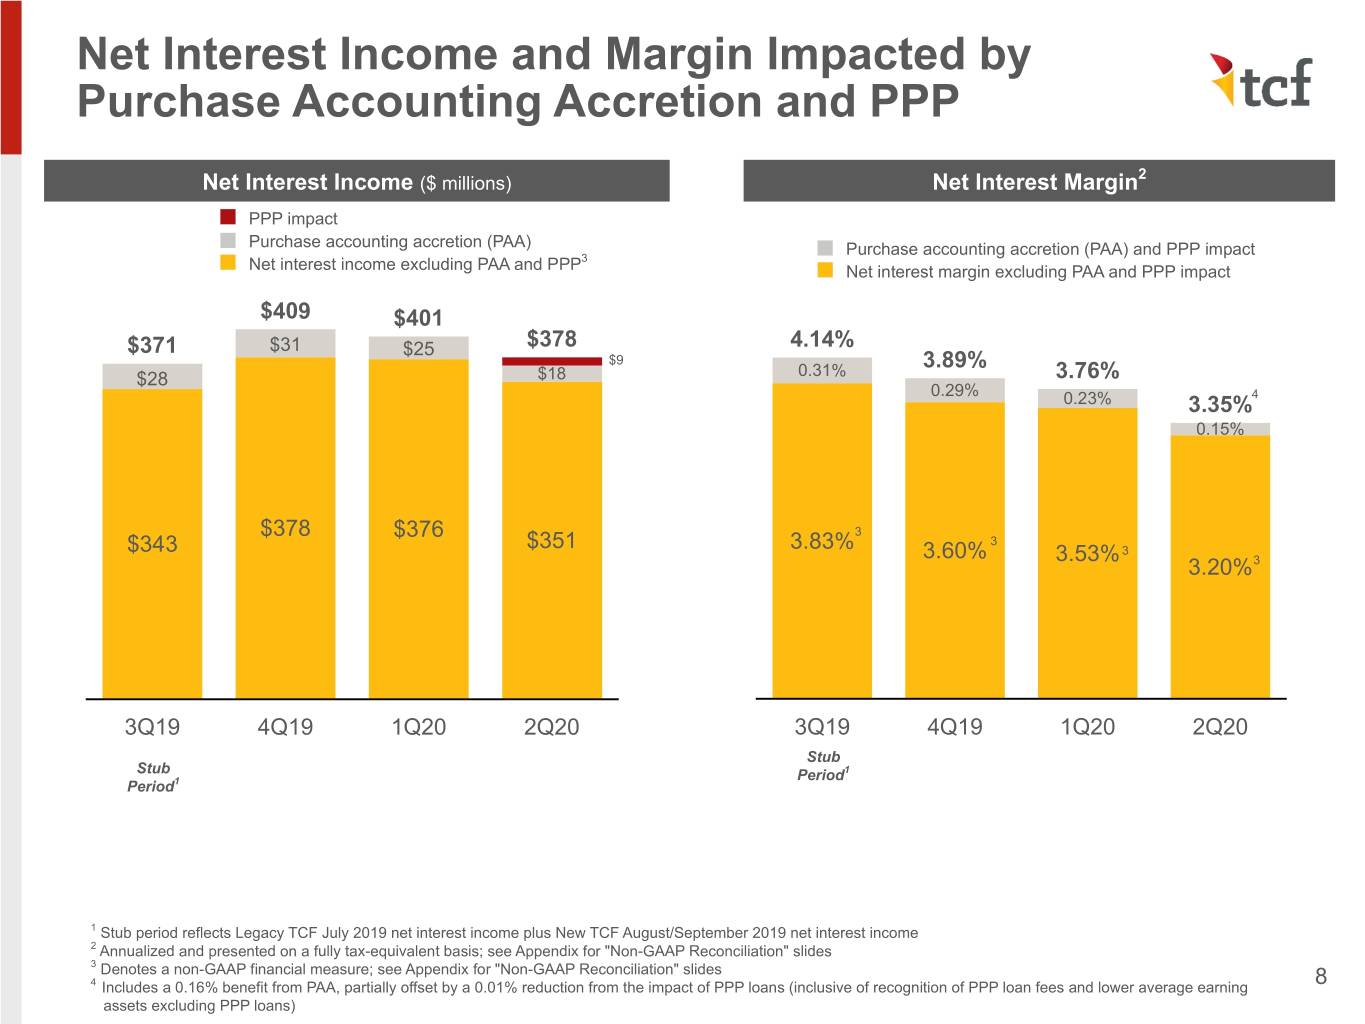
Net Interest Income and Margin Impacted by Purchase Accounting Accretion and PPP 2 Net Interest Income ($ millions) Net Interest Margin PPP impact Purchase accounting accretion (PAA) Purchase accounting accretion (PAA) and PPP impact 3 Net interest income excluding PAA and PPP Net interest margin excluding PAA and PPP impact $409 $401 $371 $31 $25 $378 4.14% $9 3.89% $28 $18 0.31% 3.76% 0.29% 0.23% 3.35%4 0.15% $378 $376 3 $351 3.83% 3 $343 3.60% 3.53% 3 3.20%3 3Q19 4Q19 1Q20 2Q20 3Q19 4Q19 1Q20 2Q20 Stub Stub Period1 Period1 1 Stub period reflects Legacy TCF July 2019 net interest income plus New TCF August/September 2019 net interest income 2 Annualized and presented on a fully tax-equivalent basis; see Appendix for "Non-GAAP Reconciliation" slides 3 Denotes a non-GAAP financial measure; see Appendix for "Non-GAAP Reconciliation" slides 4 Includes a 0.16% benefit from PAA, partially offset by a 0.01% reduction from the impact of PPP loans (inclusive of recognition of PPP loan fees and lower average earning 8 assets excluding PPP loans)
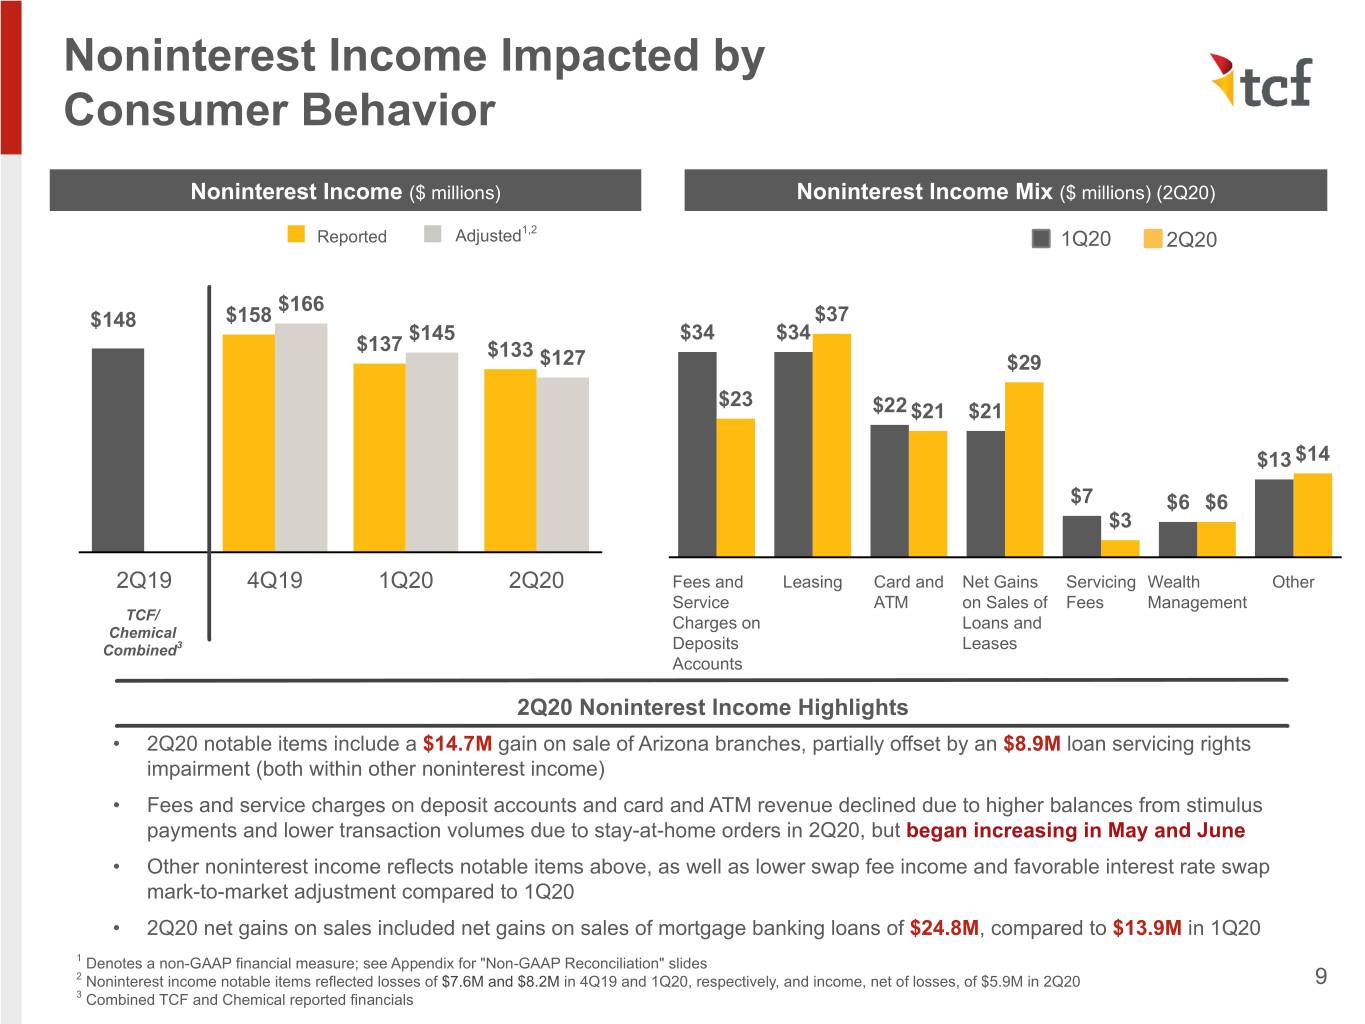
Noninterest Income Impacted by Consumer Behavior Noninterest Income ($ millions) Noninterest Income Mix ($ millions) (2Q20) 1,2 Reported Adjusted 1Q20 2Q20 $166 $148 $158 $37 $145 $34 $34 $137 $133 $127 $29 $23 $22 $21 $21 $13 $14 $7 $6 $6 $3 2Q19 4Q19 1Q20 2Q20 Fees and Leasing Card and Net Gains Servicing Wealth Other Service ATM on Sales of Fees Management TCF/ Charges on Loans and Chemical Combined3 Deposits Leases Accounts 2Q20 Noninterest Income Highlights • 2Q20 notable items include a $14.7M gain on sale of Arizona branches, partially offset by an $8.9M loan servicing rights impairment (both within other noninterest income) • Fees and service charges on deposit accounts and card and ATM revenue declined due to higher balances from stimulus payments and lower transaction volumes due to stay-at-home orders in 2Q20, but began increasing in May and June • Other noninterest income reflects notable items above, as well as lower swap fee income and favorable interest rate swap mark-to-market adjustment compared to 1Q20 • 2Q20 net gains on sales included net gains on sales of mortgage banking loans of $24.8M, compared to $13.9M in 1Q20 1 Denotes a non-GAAP financial measure; see Appendix for "Non-GAAP Reconciliation" slides 2 Noninterest income notable items reflected losses of $7.6M and $8.2M in 4Q19 and 1Q20, respectively, and income, net of losses, of $5.9M in 2Q20 9 3 Combined TCF and Chemical reported financials
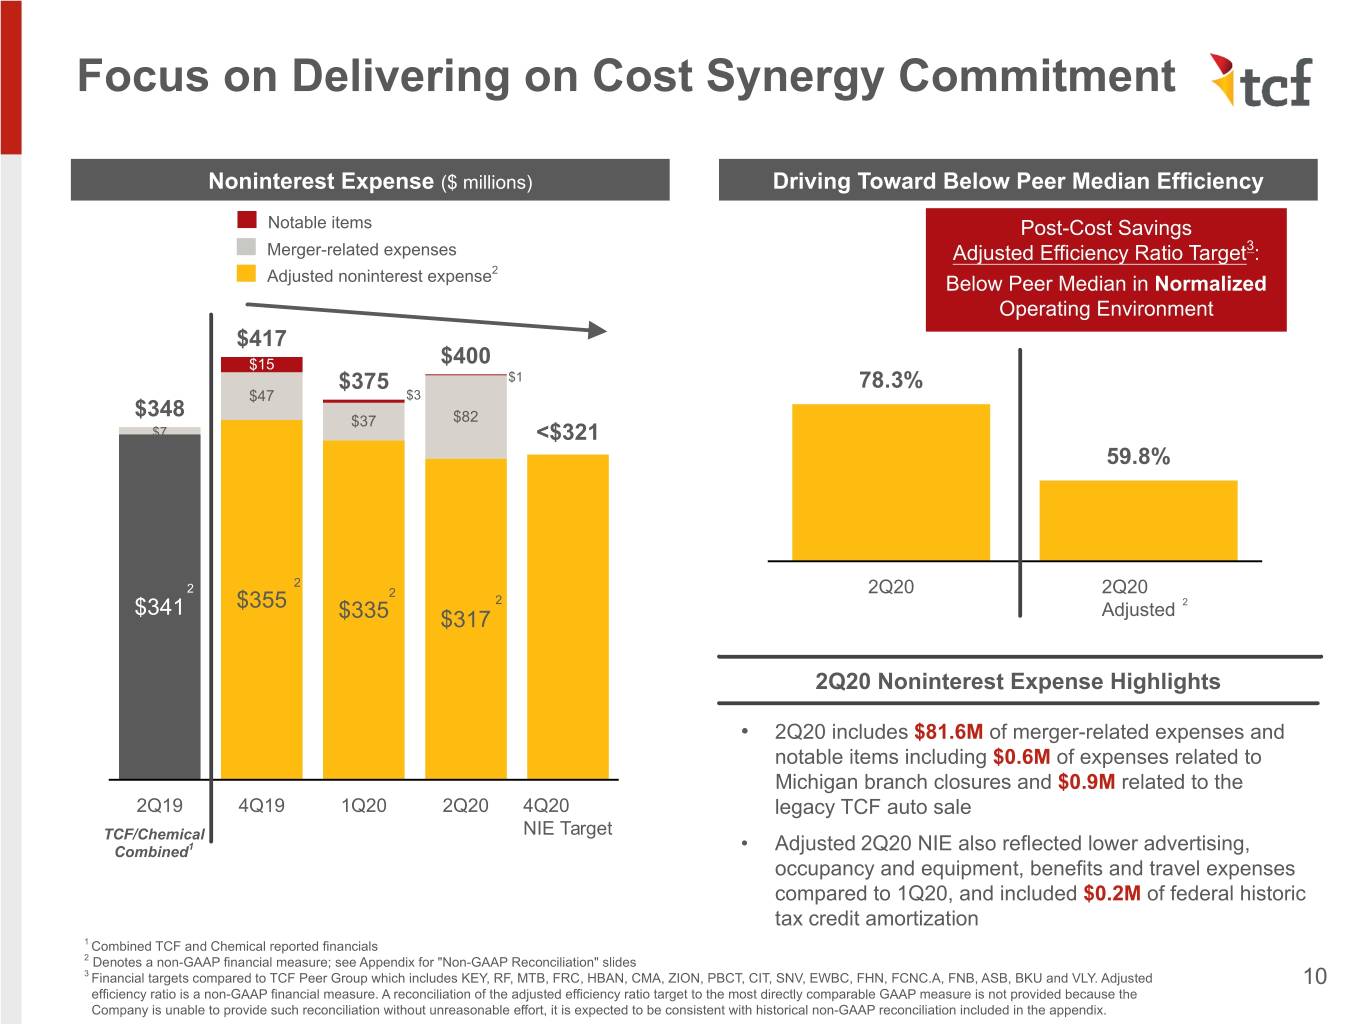
Focus on Delivering on Cost Synergy Commitment Noninterest Expense ($ millions) Driving Toward Below Peer Median Efficiency Notable items Post-Cost Savings Merger-related expenses Adjusted Efficiency Ratio Target3: 2 Adjusted noninterest expense Below Peer Median in Normalized Operating Environment $417 $15 $400 $375 $1 78.3% $47 $3 $348 $37 $82 $7 <$321 59.8% 2 2 2 2Q20 2Q20 $341 $355 2 2 $335 $317 Adjusted 2Q20 Noninterest Expense Highlights • 2Q20 includes $81.6M of merger-related expenses and notable items including $0.6M of expenses related to Michigan branch closures and $0.9M related to the 2Q19 4Q19 1Q20 2Q20 4Q20 legacy TCF auto sale TCF/Chemical NIE Target Combined1 • Adjusted 2Q20 NIE also reflected lower advertising, occupancy and equipment, benefits and travel expenses compared to 1Q20, and included $0.2M of federal historic tax credit amortization 1 Combined TCF and Chemical reported financials 2 Denotes a non-GAAP financial measure; see Appendix for "Non-GAAP Reconciliation" slides 3 Financial targets compared to TCF Peer Group which includes KEY, RF, MTB, FRC, HBAN, CMA, ZION, PBCT, CIT, SNV, EWBC, FHN, FCNC.A, FNB, ASB, BKU and VLY. Adjusted 10 efficiency ratio is a non-GAAP financial measure. A reconciliation of the adjusted efficiency ratio target to the most directly comparable GAAP measure is not provided because the Company is unable to provide such reconciliation without unreasonable effort, it is expected to be consistent with historical non-GAAP reconciliation included in the appendix.
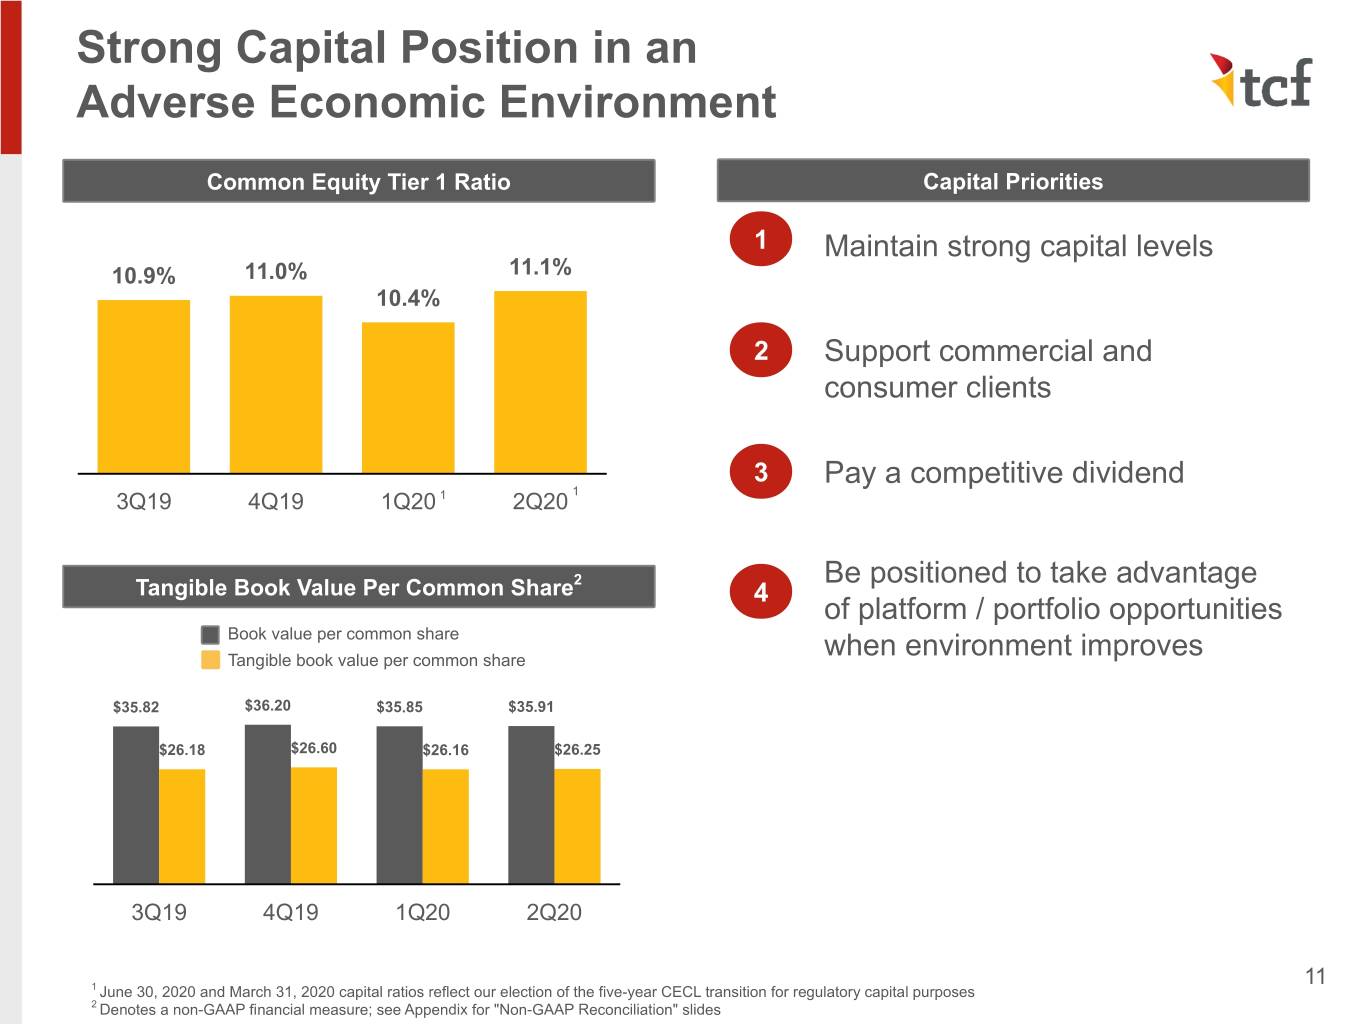
Strong Capital Position in an Adverse Economic Environment Common Equity Tier 1 Ratio Capital Priorities 1 Maintain strong capital levels 10.9% 11.0% 11.1% 10.4% 2 Support commercial and consumer clients 3 Pay a competitive dividend 3Q19 4Q19 1Q20 1 2Q20 1 2 Be positioned to take advantage Tangible Book Value Per Common Share 4 of platform / portfolio opportunities Book value per common share Tangible book value per common share when environment improves $35.82 $36.20 $35.85 $35.91 $26.18 $26.60 $26.16 $26.25 3Q19 4Q19 1Q20 2Q20 11 1 June 30, 2020 and March 31, 2020 capital ratios reflect our election of the five-year CECL transition for regulatory capital purposes 2 Denotes a non-GAAP financial measure; see Appendix for "Non-GAAP Reconciliation" slides
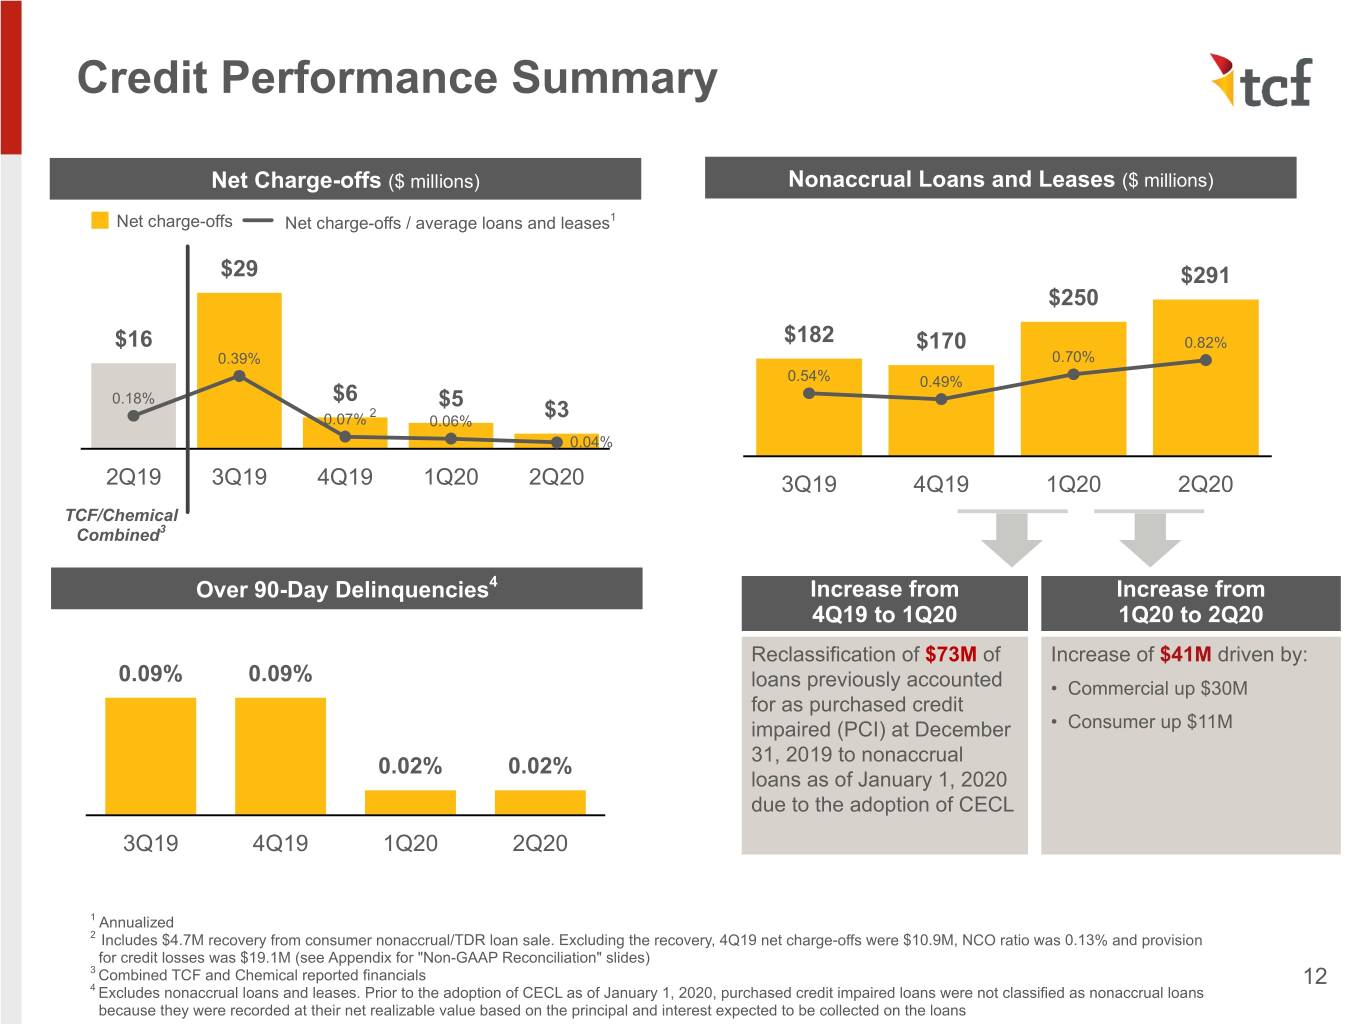
Credit Performance Summary Net Charge-offs ($ millions) Nonaccrual Loans and Leases ($ millions) Net charge-offs Net charge-offs / average loans and leases1 $29 $291 $250 $16 $182 $170 0.82% 0.39% 0.70% 0.54% 0.49% 0.18% $6 $5 2 0.07% 0.06% $3 0.04% 2Q19 3Q19 4Q19 1Q20 2Q20 3Q19 4Q19 1Q20 2Q20 TCF/Chemical Combined3 Over 90-Day Delinquencies4 Increase from Increase from 4Q19 to 1Q20 1Q20 to 2Q20 Reclassification of $73M of Increase of $41M driven by: 0.09% 0.09% loans previously accounted • Commercial up $30M for as purchased credit impaired (PCI) at December • Consumer up $11M 31, 2019 to nonaccrual 0.02% 0.02% loans as of January 1, 2020 due to the adoption of CECL 3Q19 4Q19 1Q20 2Q20 1 Annualized 2 Includes $4.7M recovery from consumer nonaccrual/TDR loan sale. Excluding the recovery, 4Q19 net charge-offs were $10.9M, NCO ratio was 0.13% and provision for credit losses was $19.1M (see Appendix for "Non-GAAP Reconciliation" slides) 3 Combined TCF and Chemical reported financials 12 4 Excludes nonaccrual loans and leases. Prior to the adoption of CECL as of January 1, 2020, purchased credit impaired loans were not classified as nonaccrual loans because they were recorded at their net realizable value based on the principal and interest expected to be collected on the loans
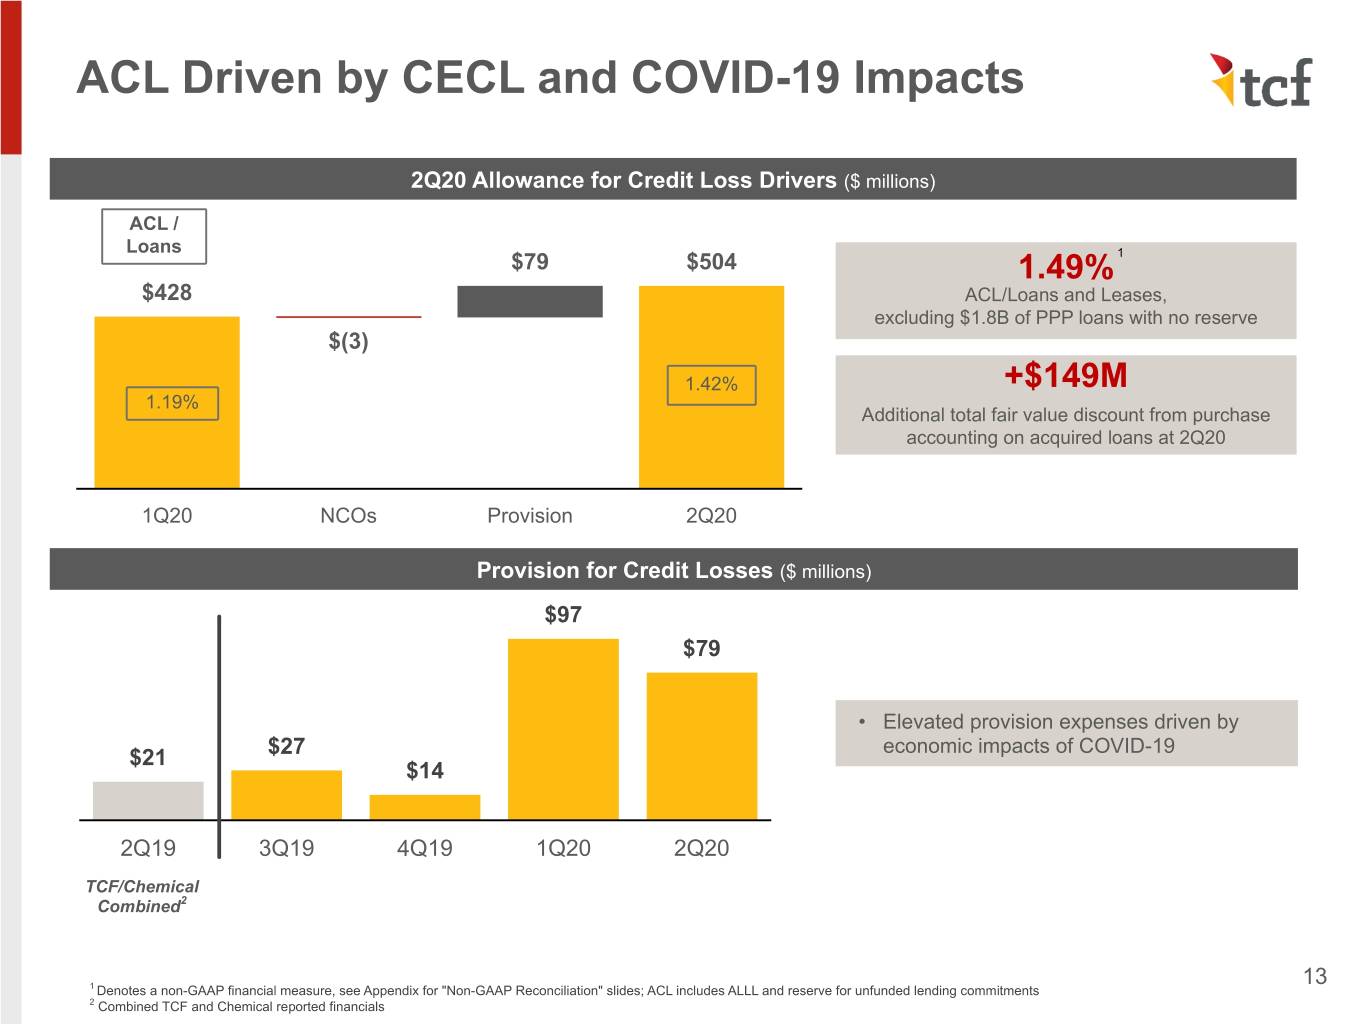
ACL Driven by CECL and COVID-19 Impacts 2Q20 Allowance for Credit Loss Drivers ($ millions) ACL / Loans $79 $504 1.49% 1 $428 ACL/Loans and Leases, excluding $1.8B of PPP loans with no reserve $(3) 1.42% +$149M 1.19% Additional total fair value discount from purchase accounting on acquired loans at 2Q20 1Q20 NCOs Provision 2Q20 Provision for Credit Losses ($ millions) $97 $79 • Elevated provision expenses driven by economic impacts of COVID-19 $21 $27 $14 2Q19 3Q19 4Q19 1Q20 2Q20 TCF/Chemical Combined2 13 1 Denotes a non-GAAP financial measure, see Appendix for "Non-GAAP Reconciliation" slides; ACL includes ALLL and reserve for unfunded lending commitments 2 Combined TCF and Chemical reported financials
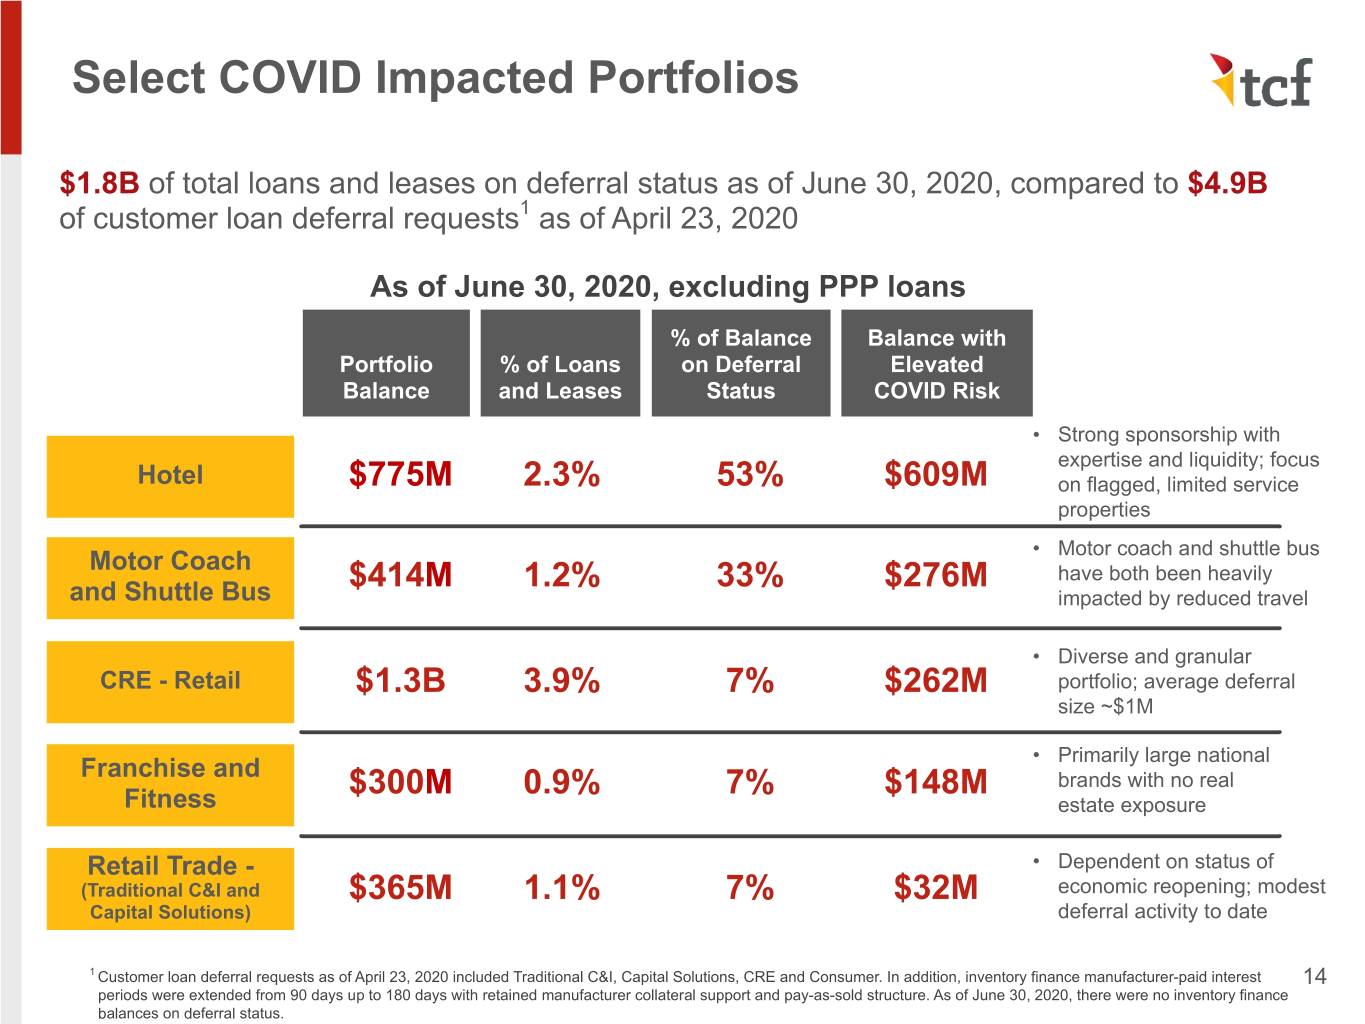
Select COVID Impacted Portfolios $1.8B of total loans and leases on deferral status as of June 30, 2020, compared to $4.9B of customer loan deferral requests1 as of April 23, 2020 As of June 30, 2020, excluding PPP loans % of Balance Balance with Portfolio % of Loans on Deferral Elevated Balance and Leases Status COVID Risk • Strong sponsorship with expertise and liquidity; focus Hotel $775M 2.3% 53% $609M on flagged, limited service properties Motor Coach • Motor coach and shuttle bus $414M 1.2% 33% $276M have both been heavily and Shuttle Bus impacted by reduced travel • Diverse and granular CRE - Retail $1.3B 3.9% 7% $262M portfolio; average deferral size ~$1M Franchise and • Primarily large national $300M 0.9% 7% $148M brands with no real Fitness estate exposure Retail Trade - • Dependent on status of (Traditional C&I and $365M 1.1% 7% $32M economic reopening; modest Capital Solutions) deferral activity to date 1 Customer loan deferral requests as of April 23, 2020 included Traditional C&I, Capital Solutions, CRE and Consumer. In addition, inventory finance manufacturer-paid interest 14 periods were extended from 90 days up to 180 days with retained manufacturer collateral support and pay-as-sold structure. As of June 30, 2020, there were no inventory finance balances on deferral status.
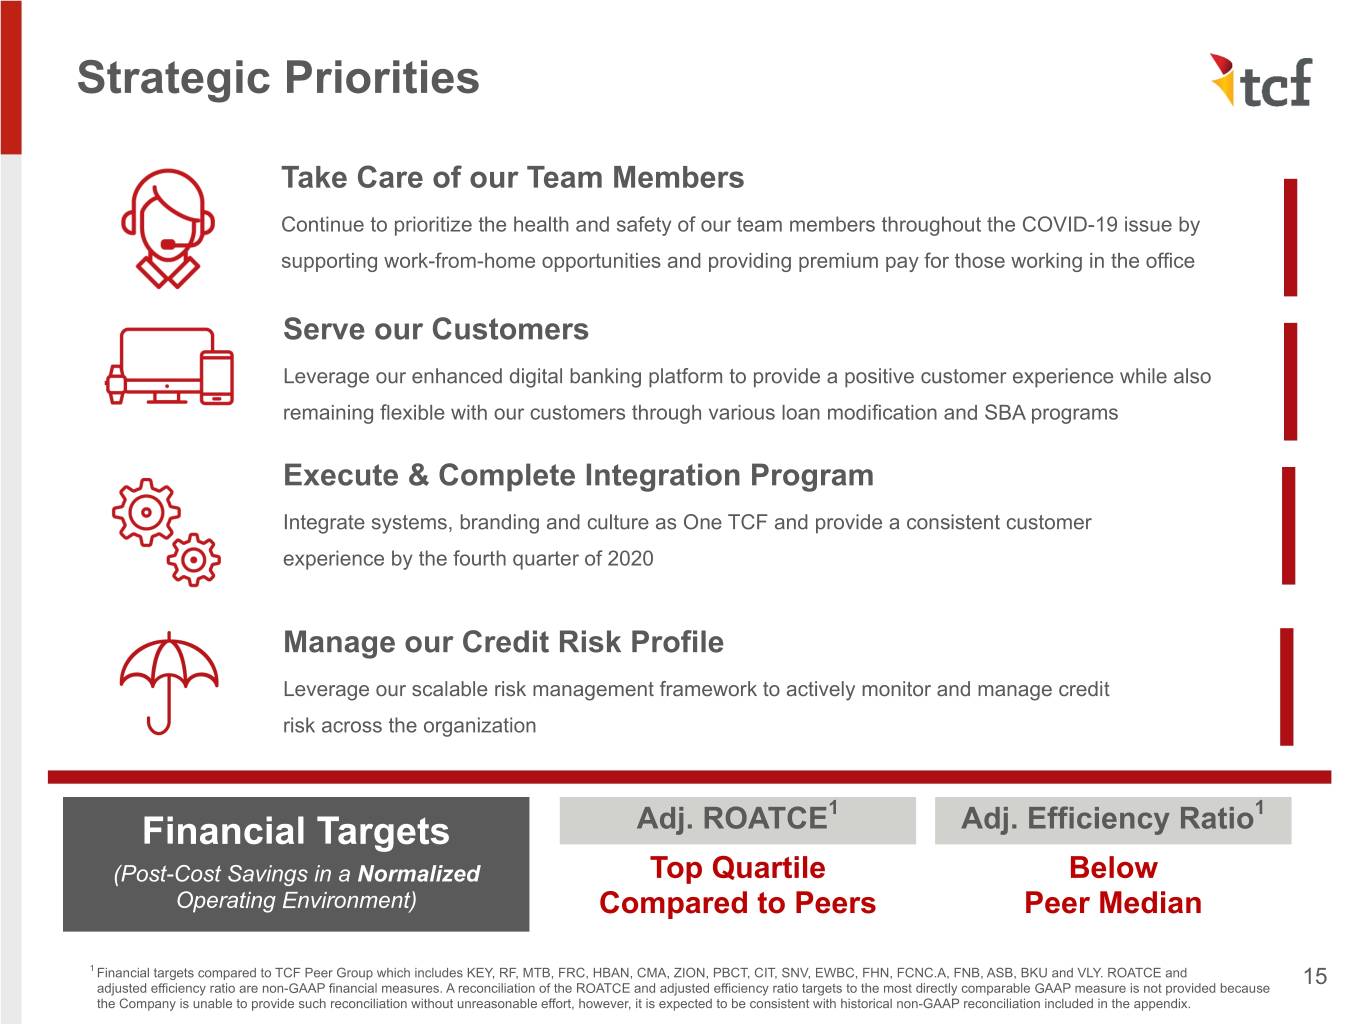
Strategic Priorities Take Care of our Team Members Continue to prioritize the health and safety of our team members throughout the COVID-19 issue by supporting work-from-home opportunities and providing premium pay for those working in the office Serve our Customers Leverage our enhanced digital banking platform to provide a positive customer experience while also remaining flexible with our customers through various loan modification and SBA programs Execute & Complete Integration Program Integrate systems, branding and culture as One TCF and provide a consistent customer experience by the fourth quarter of 2020 Manage our Credit Risk Profile Leverage our scalable risk management framework to actively monitor and manage credit risk across the organization 1 1 Financial Targets Adj. ROATCE Adj. Efficiency Ratio (Post-Cost Savings in a Normalized Top Quartile Below Operating Environment) Compared to Peers Peer Median 1 Financial targets compared to TCF Peer Group which includes KEY, RF, MTB, FRC, HBAN, CMA, ZION, PBCT, CIT, SNV, EWBC, FHN, FCNC.A, FNB, ASB, BKU and VLY. ROATCE and 15 adjusted efficiency ratio are non-GAAP financial measures. A reconciliation of the ROATCE and adjusted efficiency ratio targets to the most directly comparable GAAP measure is not provided because the Company is unable to provide such reconciliation without unreasonable effort, however, it is expected to be consistent with historical non-GAAP reconciliation included in the appendix.

Appendix
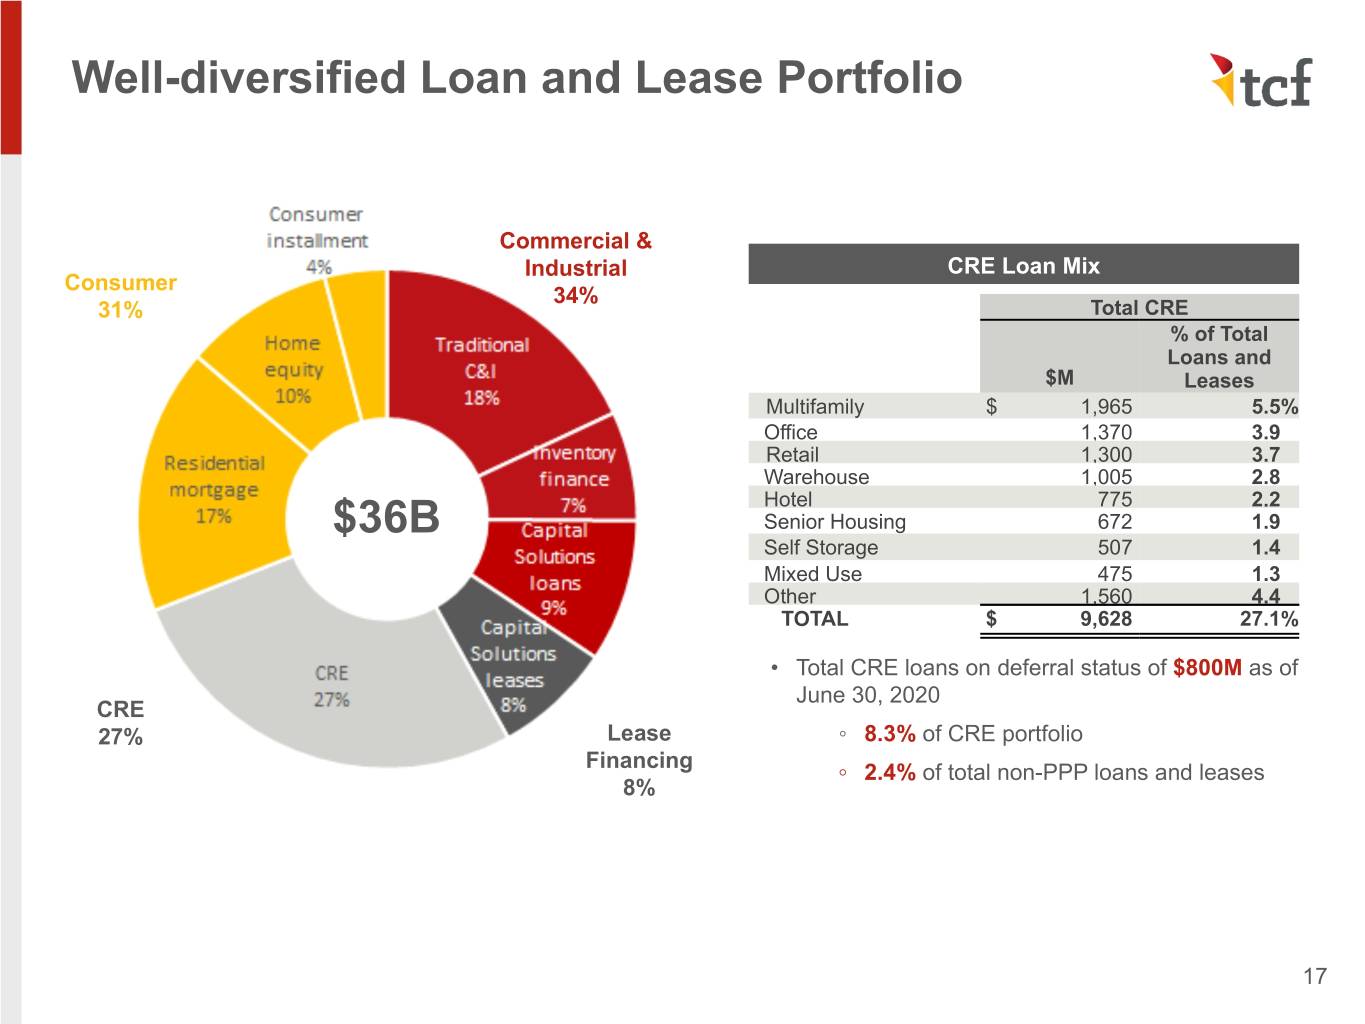
Well-diversified Loan and Lease Portfolio Commercial & Industrial CRE Loan Mix Consumer 34% 31% Total CRE % of Total Loans and $M Leases Multifamily $ 1,965 5.5% Office 1,370 3.9 Retail 1,300 3.7 Warehouse 1,005 2.8 Hotel 775 2.2 $36B Senior Housing 672 1.9 Self Storage 507 1.4 Mixed Use 475 1.3 Other 1,560 4.4 TOTAL $ 9,628 27.1% • Total CRE loans on deferral status of $800M as of June 30, 2020 CRE 27% Lease ◦ 8.3% of CRE portfolio Financing ◦ 2.4% of total non-PPP loans and leases 8% 17
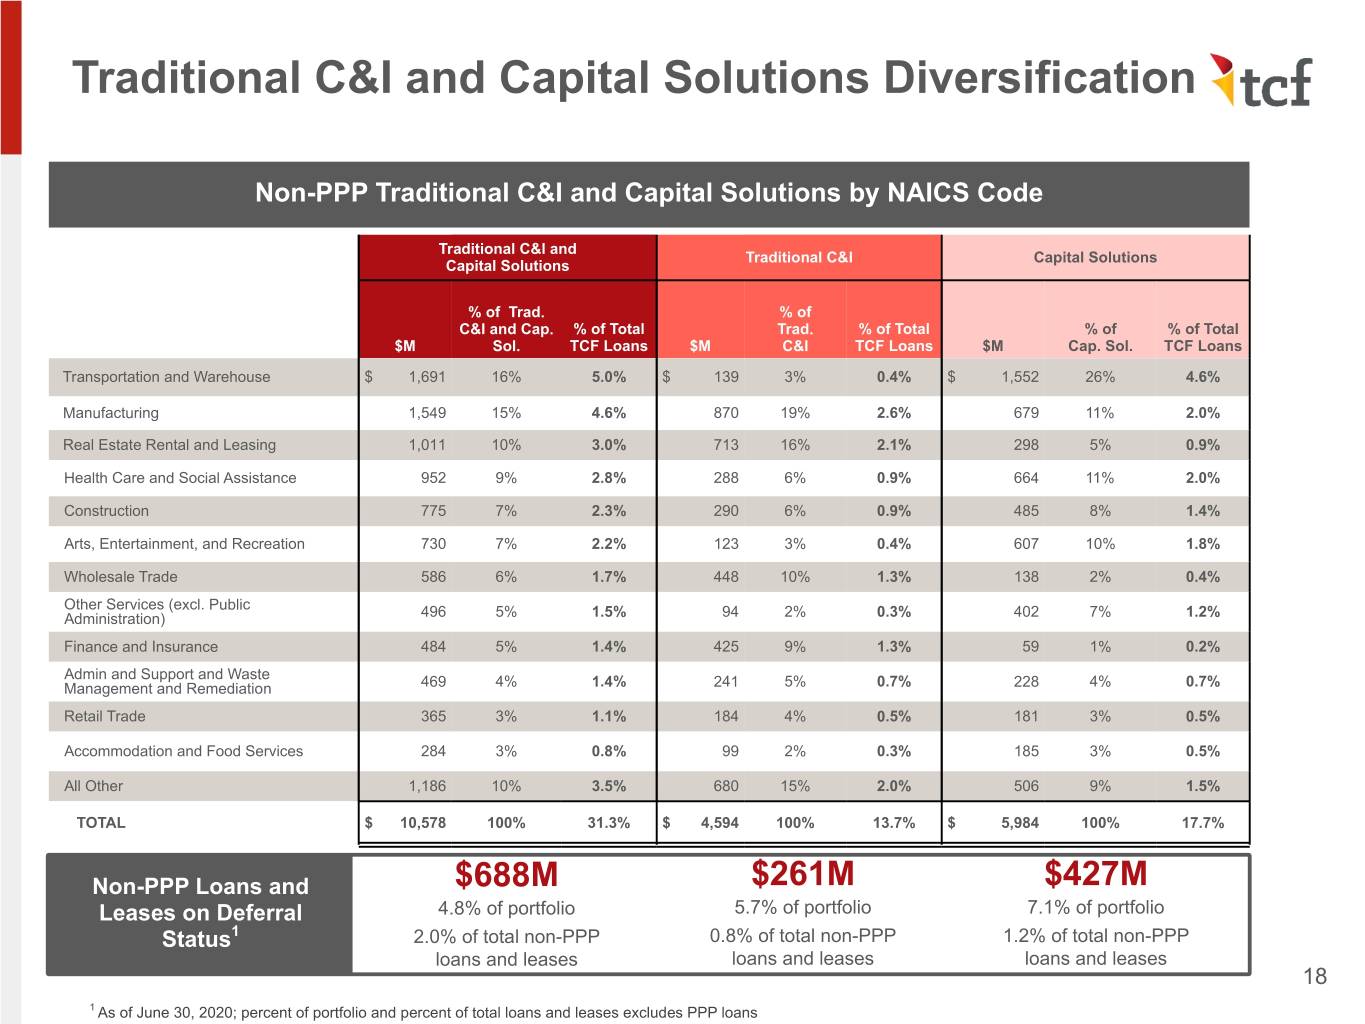
Traditional C&I and Capital Solutions Diversification Non-PPP Traditional C&I and Capital Solutions by NAICS Code Traditional C&I and Traditional C&I Capital Solutions Capital Solutions % of Trad. % of C&I and Cap. % of Total Trad. % of Total % of % of Total $M Sol. TCF Loans $M C&I TCF Loans $M Cap. Sol. TCF Loans Transportation and Warehouse $ 1,691 16% 5.0% $ 139 3% 0.4% $ 1,552 26% 4.6% Manufacturing 1,549 15% 4.6% 870 19% 2.6% 679 11% 2.0% Real Estate Rental and Leasing 1,011 10% 3.0% 713 16% 2.1% 298 5% 0.9% Health Care and Social Assistance 952 9% 2.8% 288 6% 0.9% 664 11% 2.0% Construction 775 7% 2.3% 290 6% 0.9% 485 8% 1.4% Arts, Entertainment, and Recreation 730 7% 2.2% 123 3% 0.4% 607 10% 1.8% Wholesale Trade 586 6% 1.7% 448 10% 1.3% 138 2% 0.4% Other Services (excl. Public Administration) 496 5% 1.5% 94 2% 0.3% 402 7% 1.2% Finance and Insurance 484 5% 1.4% 425 9% 1.3% 59 1% 0.2% Admin and Support and Waste Management and Remediation 469 4% 1.4% 241 5% 0.7% 228 4% 0.7% Retail Trade 365 3% 1.1% 184 4% 0.5% 181 3% 0.5% Accommodation and Food Services 284 3% 0.8% 99 2% 0.3% 185 3% 0.5% All Other 1,186 10% 3.5% 680 15% 2.0% 506 9% 1.5% TOTAL $ 10,578 100% 31.3% $ 4,594 100% 13.7% $ 5,984 100% 17.7% Non-PPP Loans and $688M $261M $427M Leases on Deferral 4.8% of portfolio 5.7% of portfolio 7.1% of portfolio Status1 2.0% of total non-PPP 0.8% of total non-PPP 1.2% of total non-PPP loans and leases loans and leases loans and leases 18 1 As of June 30, 2020; percent of portfolio and percent of total loans and leases excludes PPP loans
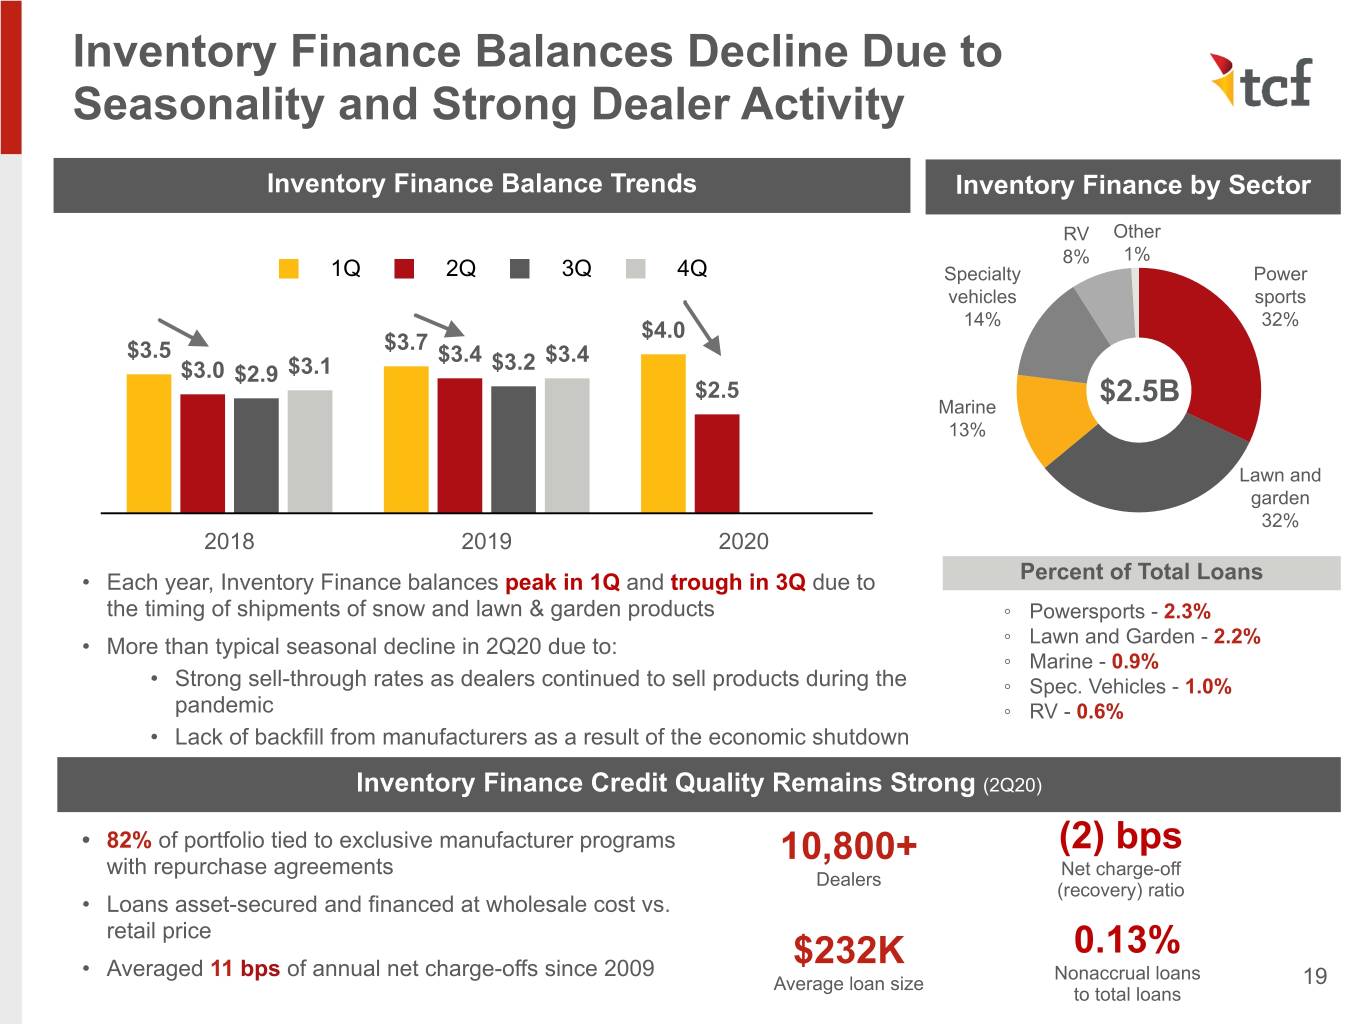
Inventory Finance Balances Decline Due to Seasonality and Strong Dealer Activity Inventory Finance Balance Trends Inventory Finance by Sector RV Other 8% 1% 1Q 2Q 3Q 4Q Specialty Power vehicles sports $4.0 14% 32% $3.5 $3.7 $3.4 $3.2 $3.4 $3.0 $2.9 $3.1 $2.5 $2.5B Marine 13% Lawn and garden 32% 2018 2019 2020 • Each year, Inventory Finance balances peak in 1Q and trough in 3Q due to Percent of Total Loans the timing of shipments of snow and lawn & garden products ◦ Powersports - 2.3% • More than typical seasonal decline in 2Q20 due to: ◦ Lawn and Garden - 2.2% ◦ Marine - 0.9% • Strong sell-through rates as dealers continued to sell products during the ◦ Spec. Vehicles - 1.0% pandemic ◦ RV - 0.6% • Lack of backfill from manufacturers as a result of the economic shutdown Inventory Finance Credit Quality Remains Strong (2Q20) • 82% of portfolio tied to exclusive manufacturer programs 10,800+ (2) bps with repurchase agreements Net charge-off Dealers (recovery) ratio • Loans asset-secured and financed at wholesale cost vs. retail price $232K 0.13% • Averaged 11 bps of annual net charge-offs since 2009 Nonaccrual loans Average loan size 19 to total loans
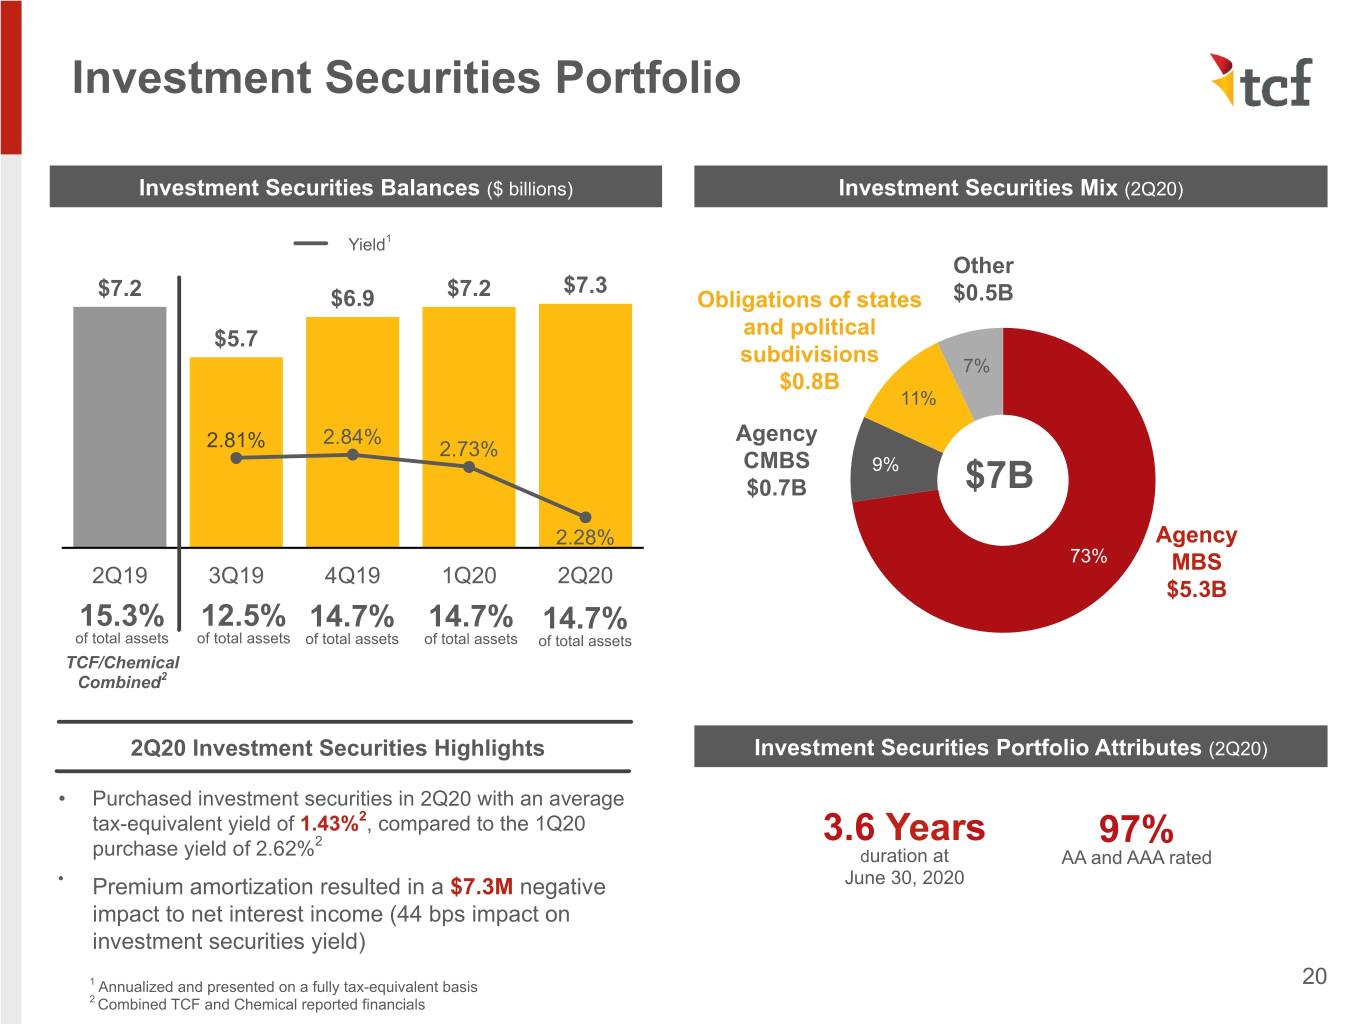
Investment Securities Portfolio Investment Securities Balances ($ billions) Investment Securities Mix (2Q20) Yield1 Other $7.3 $7.2 $6.9 $7.2 Obligations of states $0.5B and political $5.7 subdivisions 7% $0.8B 11% 2.84% Agency 2.81% 2.73% CMBS 9% $0.7B $7B 2.28% Agency 73% MBS 2Q19 3Q19 4Q19 1Q20 2Q20 $5.3B 15.3% 12.5% 14.7% 14.7% 14.7% of total assets of total assets of total assets of total assets of total assets TCF/Chemical Combined2 2Q20 Investment Securities Highlights Investment Securities Portfolio Attributes (2Q20) • Purchased investment securities in 2Q20 with an average tax-equivalent yield of 1.43%2, compared to the 1Q20 2 3.6 Years 97% purchase yield of 2.62% duration at AA and AAA rated • Premium amortization resulted in a $7.3M negative June 30, 2020 impact to net interest income (44 bps impact on investment securities yield) 1 Annualized and presented on a fully tax-equivalent basis 20 2 Combined TCF and Chemical reported financials
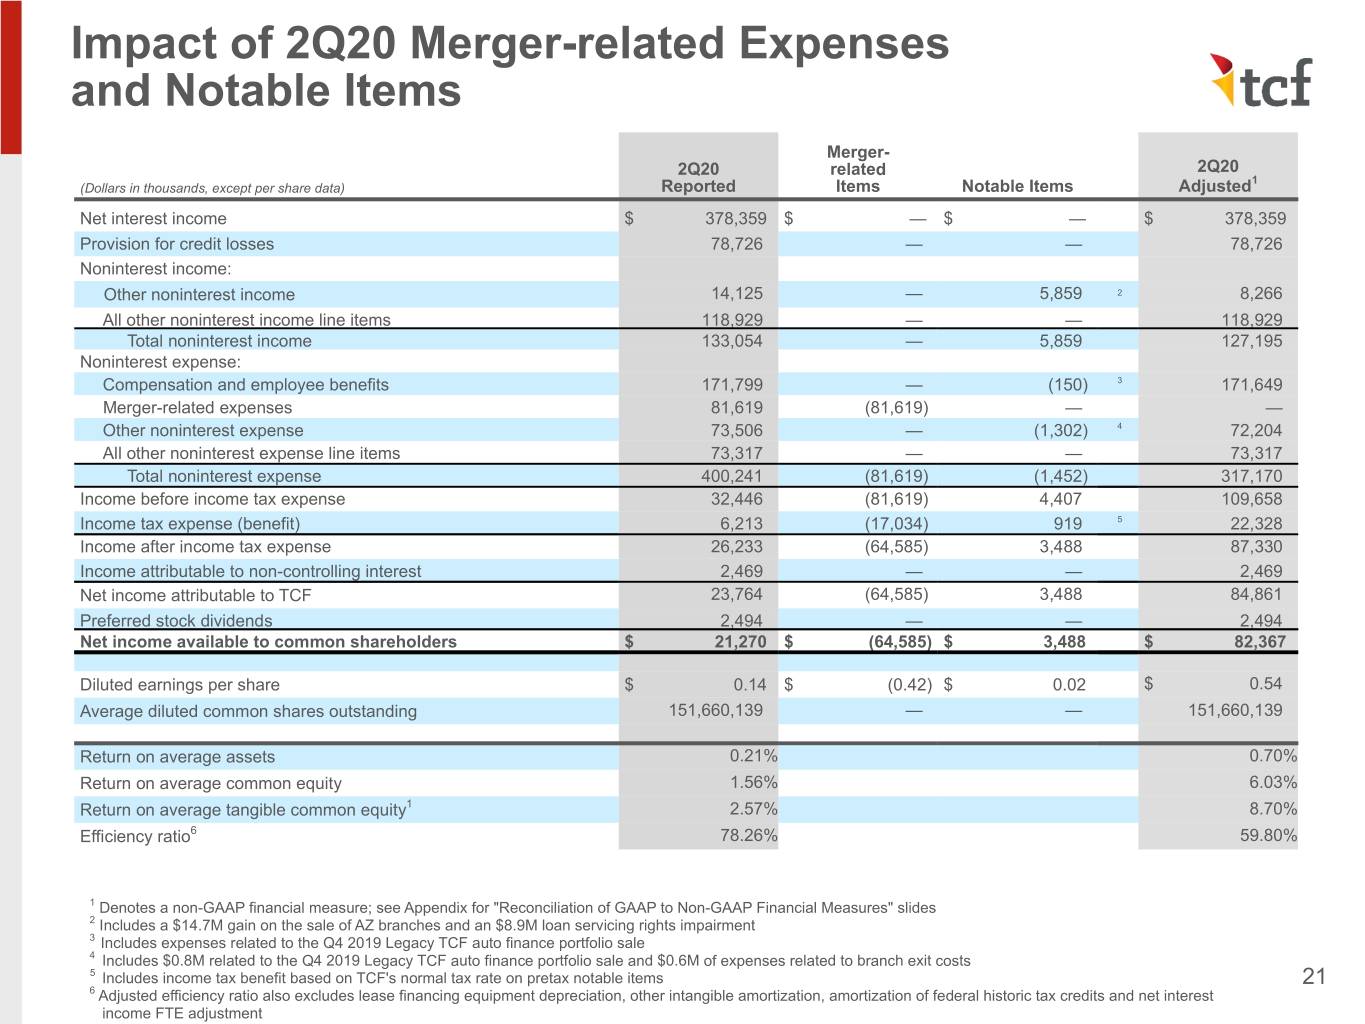
Impact of 2Q20 Merger-related Expenses and Notable Items Merger- 2Q20 related 2Q20 1 (Dollars in thousands, except per share data) Reported Items Notable Items Adjusted Net interest income $ 378,359 $ — $ — $ 378,359 Provision for credit losses 78,726 — — 78,726 Noninterest income: Other noninterest income 14,125 — 5,859 2 8,266 All other noninterest income line items 118,929 — — 118,929 Total noninterest income 133,054 — 5,859 127,195 Noninterest expense: Compensation and employee benefits 171,799 — (150) 3 171,649 Merger-related expenses 81,619 (81,619) — — Other noninterest expense 73,506 — (1,302) 4 72,204 All other noninterest expense line items 73,317 — — 73,317 Total noninterest expense 400,241 (81,619) (1,452) 317,170 Income before income tax expense 32,446 (81,619) 4,407 109,658 Income tax expense (benefit) 6,213 (17,034) 919 5 22,328 Income after income tax expense 26,233 (64,585) 3,488 87,330 Income attributable to non-controlling interest 2,469 — — 2,469 Net income attributable to TCF 23,764 (64,585) 3,488 84,861 Preferred stock dividends 2,494 — — 2,494 Net income available to common shareholders $ 21,270 $ (64,585) $ 3,488 $ 82,367 Diluted earnings per share $ 0.14 $ (0.42) $ 0.02 $ 0.54 Average diluted common shares outstanding 151,660,139 — — 151,660,139 Return on average assets 0.21% 0.70% Return on average common equity 1.56% 6.03% Return on average tangible common equity1 2.57% 8.70% Efficiency ratio6 78.26% 59.80% 1 Denotes a non-GAAP financial measure; see Appendix for "Reconciliation of GAAP to Non-GAAP Financial Measures" slides 2 Includes a $14.7M gain on the sale of AZ branches and an $8.9M loan servicing rights impairment 3 Includes expenses related to the Q4 2019 Legacy TCF auto finance portfolio sale 4 Includes $0.8M related to the Q4 2019 Legacy TCF auto finance portfolio sale and $0.6M of expenses related to branch exit costs 5 Includes income tax benefit based on TCF's normal tax rate on pretax notable items 21 6 Adjusted efficiency ratio also excludes lease financing equipment depreciation, other intangible amortization, amortization of federal historic tax credits and net interest income FTE adjustment
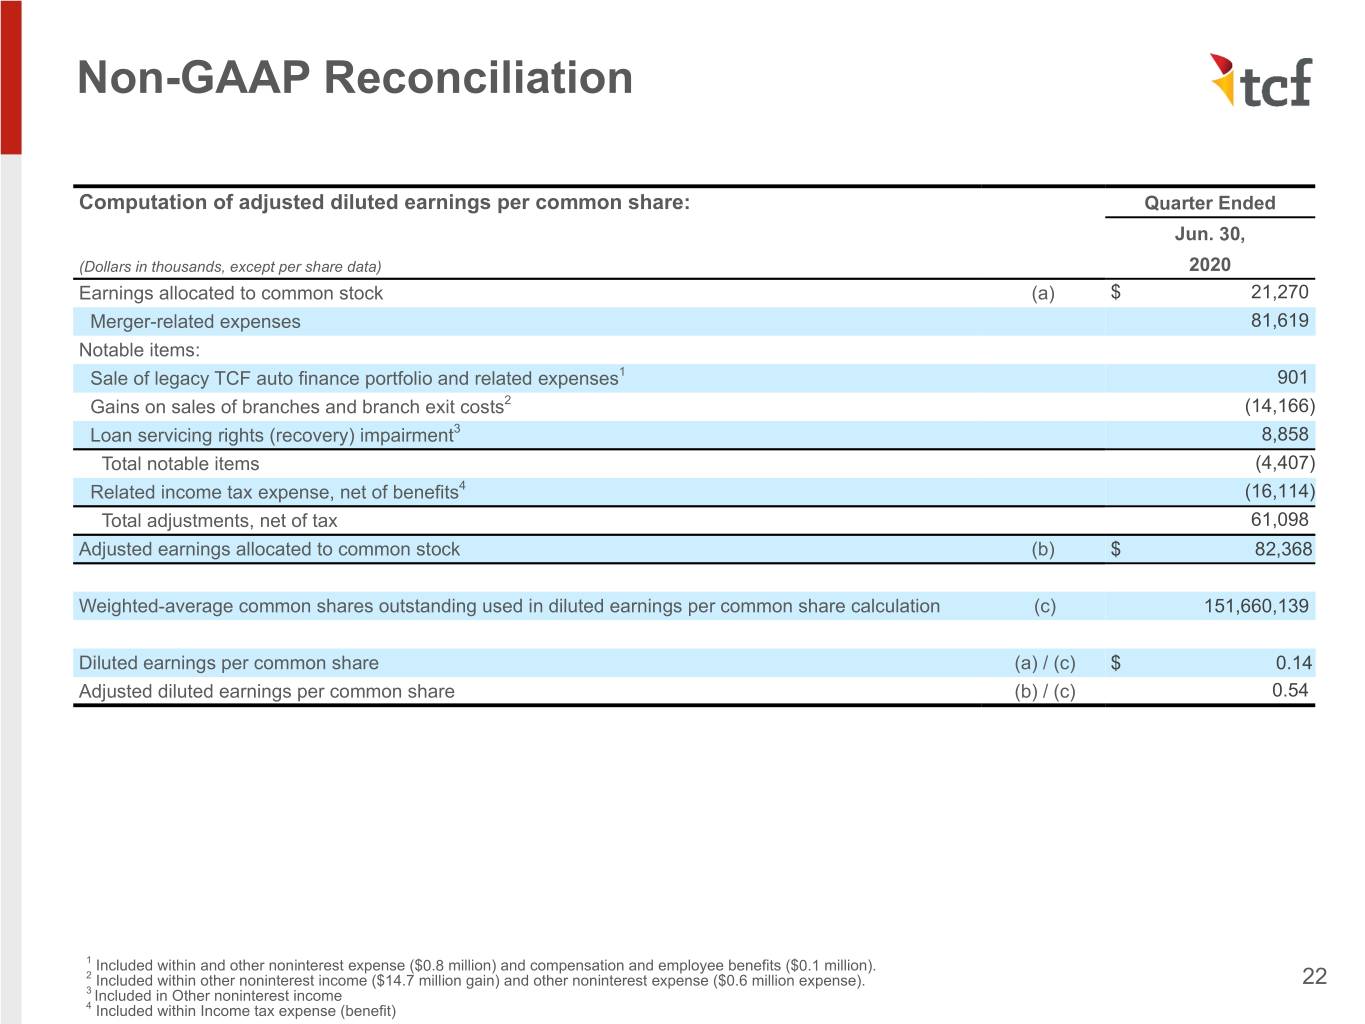
Non-GAAP Reconciliation Computation of adjusted diluted earnings per common share: Quarter Ended Jun. 30, (Dollars in thousands, except per share data) 2020 Earnings allocated to common stock (a) $ 21,270 Merger-related expenses 81,619 Notable items: Sale of legacy TCF auto finance portfolio and related expenses1 901 Gains on sales of branches and branch exit costs2 (14,166) Loan servicing rights (recovery) impairment3 8,858 Total notable items (4,407) Related income tax expense, net of benefits4 (16,114) Total adjustments, net of tax 61,098 Adjusted earnings allocated to common stock (b) $ 82,368 Weighted-average common shares outstanding used in diluted earnings per common share calculation (c) 151,660,139 Diluted earnings per common share (a) / (c) $ 0.14 Adjusted diluted earnings per common share (b) / (c) 0.54 1 Included within and other noninterest expense ($0.8 million) and compensation and employee benefits ($0.1 million). 2 Included within other noninterest income ($14.7 million gain) and other noninterest expense ($0.6 million expense). 22 3 Included in Other noninterest income 4 Included within Income tax expense (benefit)
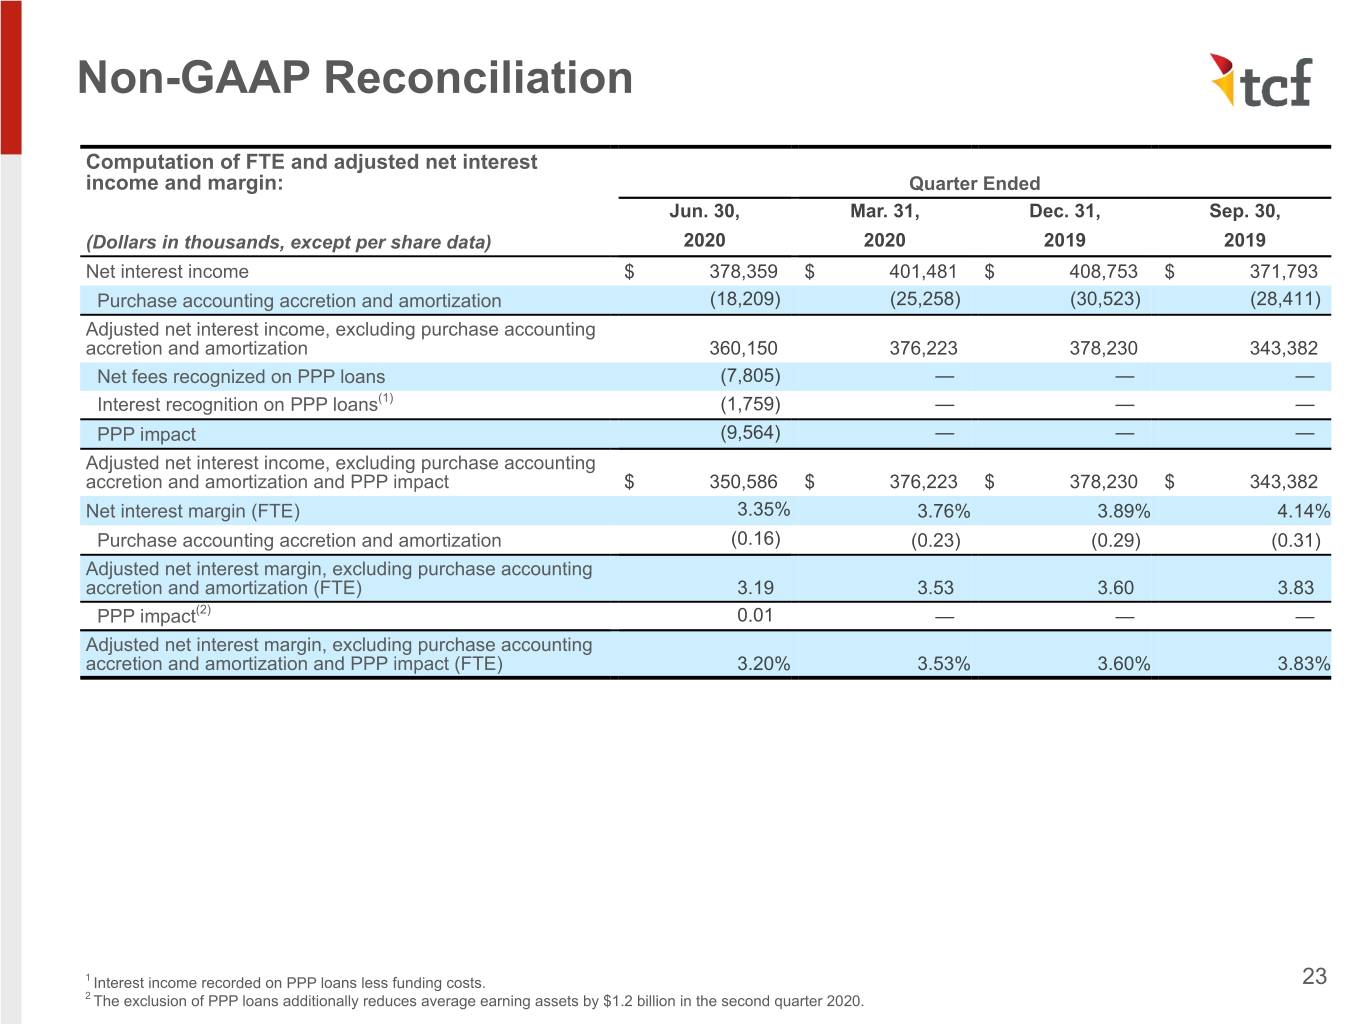
Non-GAAP Reconciliation Computation of FTE and adjusted net interest income and margin: Quarter Ended Jun. 30, Mar. 31, Dec. 31, Sep. 30, (Dollars in thousands, except per share data) 2020 2020 2019 2019 Net interest income $ 378,359 $ 401,481 $ 408,753 $ 371,793 Purchase accounting accretion and amortization (18,209) (25,258) (30,523) (28,411) Adjusted net interest income, excluding purchase accounting accretion and amortization 360,150 376,223 378,230 343,382 Net fees recognized on PPP loans (7,805) — — — Interest recognition on PPP loans(1) (1,759) — — — PPP impact (9,564) — — — Adjusted net interest income, excluding purchase accounting accretion and amortization and PPP impact $ 350,586 $ 376,223 $ 378,230 $ 343,382 Net interest margin (FTE) 3.35% 3.76% 3.89% 4.14% Purchase accounting accretion and amortization (0.16) (0.23) (0.29) (0.31) Adjusted net interest margin, excluding purchase accounting accretion and amortization (FTE) 3.19 3.53 3.60 3.83 PPP impact(2) 0.01 — — — Adjusted net interest margin, excluding purchase accounting accretion and amortization and PPP impact (FTE) 3.20% 3.53% 3.60% 3.83% 1 Interest income recorded on PPP loans less funding costs. 23 2 The exclusion of PPP loans additionally reduces average earning assets by $1.2 billion in the second quarter 2020.
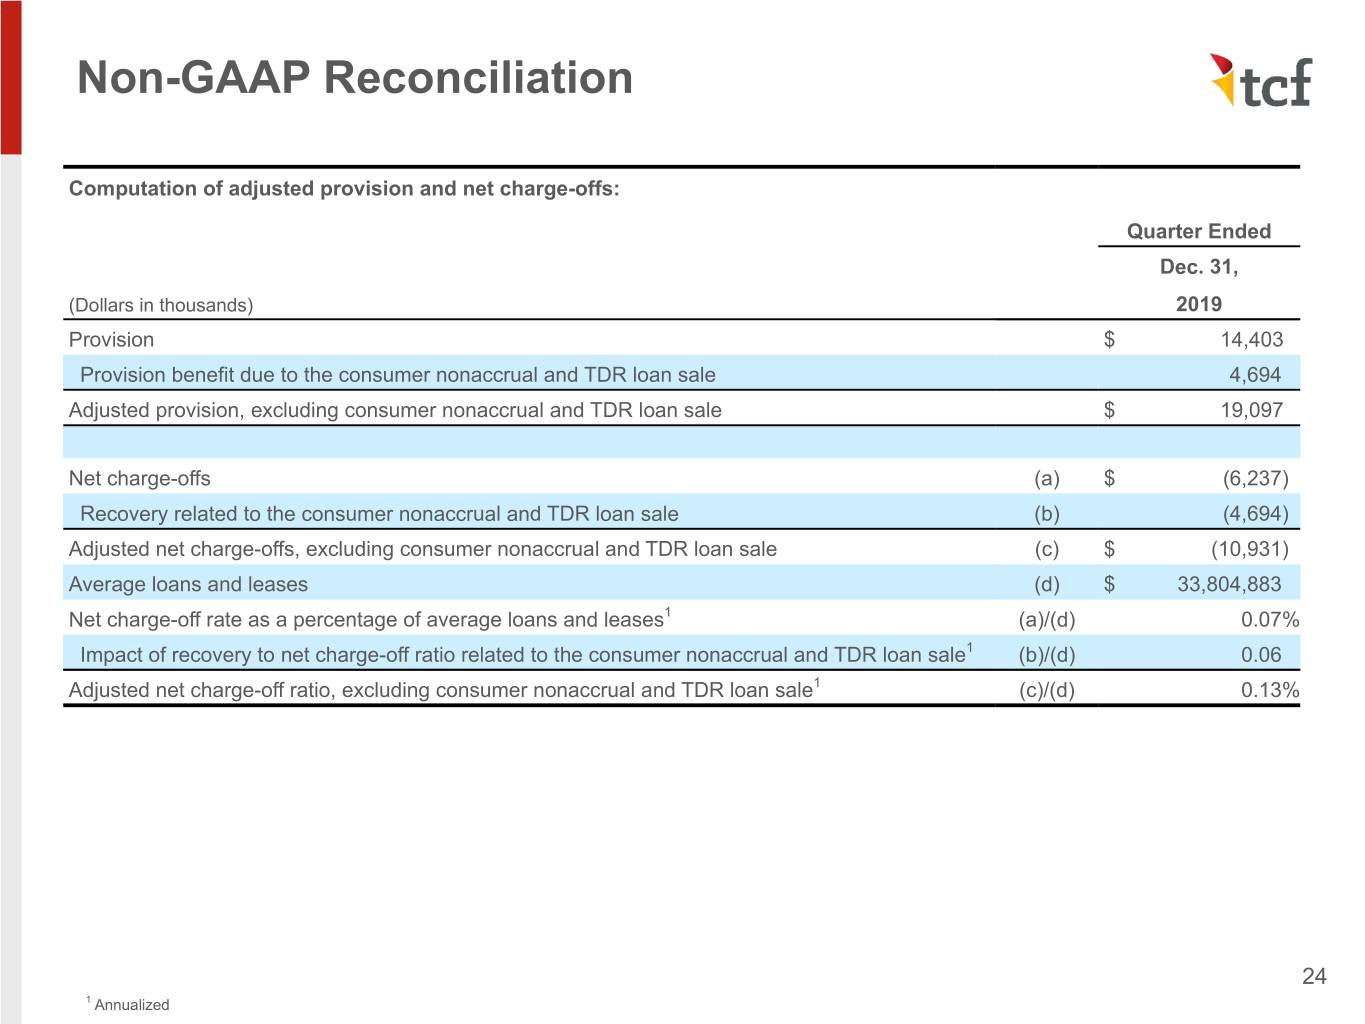
Non-GAAP Reconciliation Computation of adjusted provision and net charge-offs: Quarter Ended Dec. 31, (Dollars in thousands) 2019 Provision $ 14,403 Provision benefit due to the consumer nonaccrual and TDR loan sale 4,694 Adjusted provision, excluding consumer nonaccrual and TDR loan sale $ 19,097 Net charge-offs (a) $ (6,237) Recovery related to the consumer nonaccrual and TDR loan sale (b) (4,694) Adjusted net charge-offs, excluding consumer nonaccrual and TDR loan sale (c) $ (10,931) Average loans and leases (d) $ 33,804,883 Net charge-off rate as a percentage of average loans and leases1 (a)/(d) 0.07% Impact of recovery to net charge-off ratio related to the consumer nonaccrual and TDR loan sale1 (b)/(d) 0.06 Adjusted net charge-off ratio, excluding consumer nonaccrual and TDR loan sale1 (c)/(d) 0.13% 24 1 Annualized
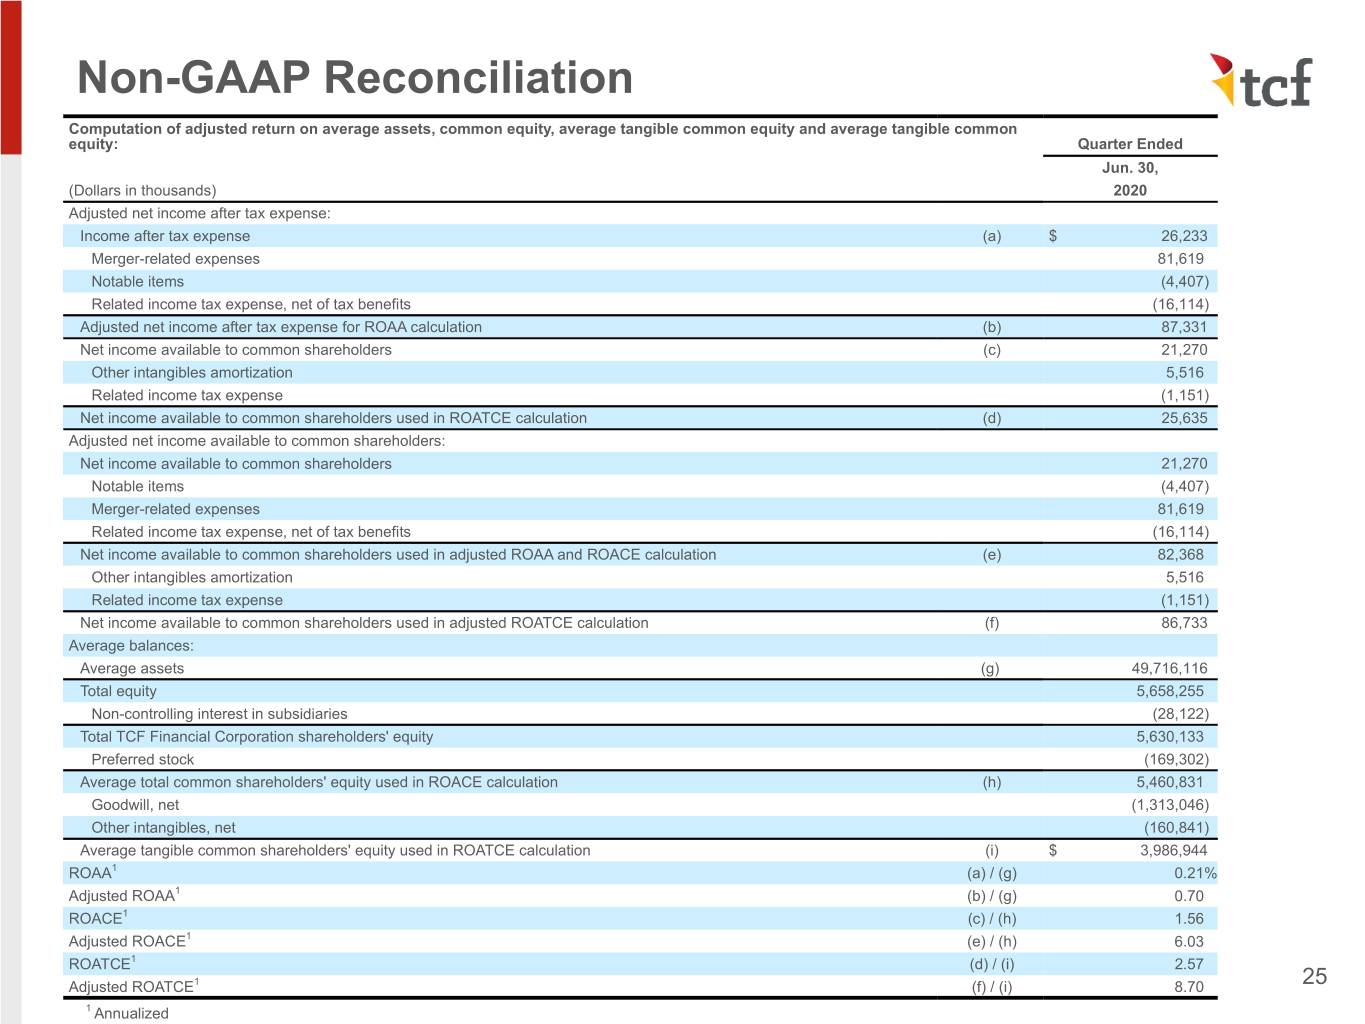
Non-GAAP Reconciliation Computation of adjusted return on average assets, common equity, average tangible common equity and average tangible common equity: Quarter Ended Jun. 30, (Dollars in thousands) 2020 Adjusted net income after tax expense: Income after tax expense (a) $ 26,233 Merger-related expenses 81,619 Notable items (4,407) Related income tax expense, net of tax benefits (16,114) Adjusted net income after tax expense for ROAA calculation (b) 87,331 Net income available to common shareholders (c) 21,270 Other intangibles amortization 5,516 Related income tax expense (1,151) Net income available to common shareholders used in ROATCE calculation (d) 25,635 Adjusted net income available to common shareholders: Net income available to common shareholders 21,270 Notable items (4,407) Merger-related expenses 81,619 Related income tax expense, net of tax benefits (16,114) Net income available to common shareholders used in adjusted ROAA and ROACE calculation (e) 82,368 Other intangibles amortization 5,516 Related income tax expense (1,151) Net income available to common shareholders used in adjusted ROATCE calculation (f) 86,733 Average balances: Average assets (g) 49,716,116 Total equity 5,658,255 Non-controlling interest in subsidiaries (28,122) Total TCF Financial Corporation shareholders' equity 5,630,133 Preferred stock (169,302) Average total common shareholders' equity used in ROACE calculation (h) 5,460,831 Goodwill, net (1,313,046) Other intangibles, net (160,841) Average tangible common shareholders' equity used in ROATCE calculation (i) $ 3,986,944 ROAA1 (a) / (g) 0.21% Adjusted ROAA1 (b) / (g) 0.70 ROACE1 (c) / (h) 1.56 Adjusted ROACE1 (e) / (h) 6.03 ROATCE1 (d) / (i) 2.57 Adjusted ROATCE1 (f) / (i) 8.70 25 1 Annualized
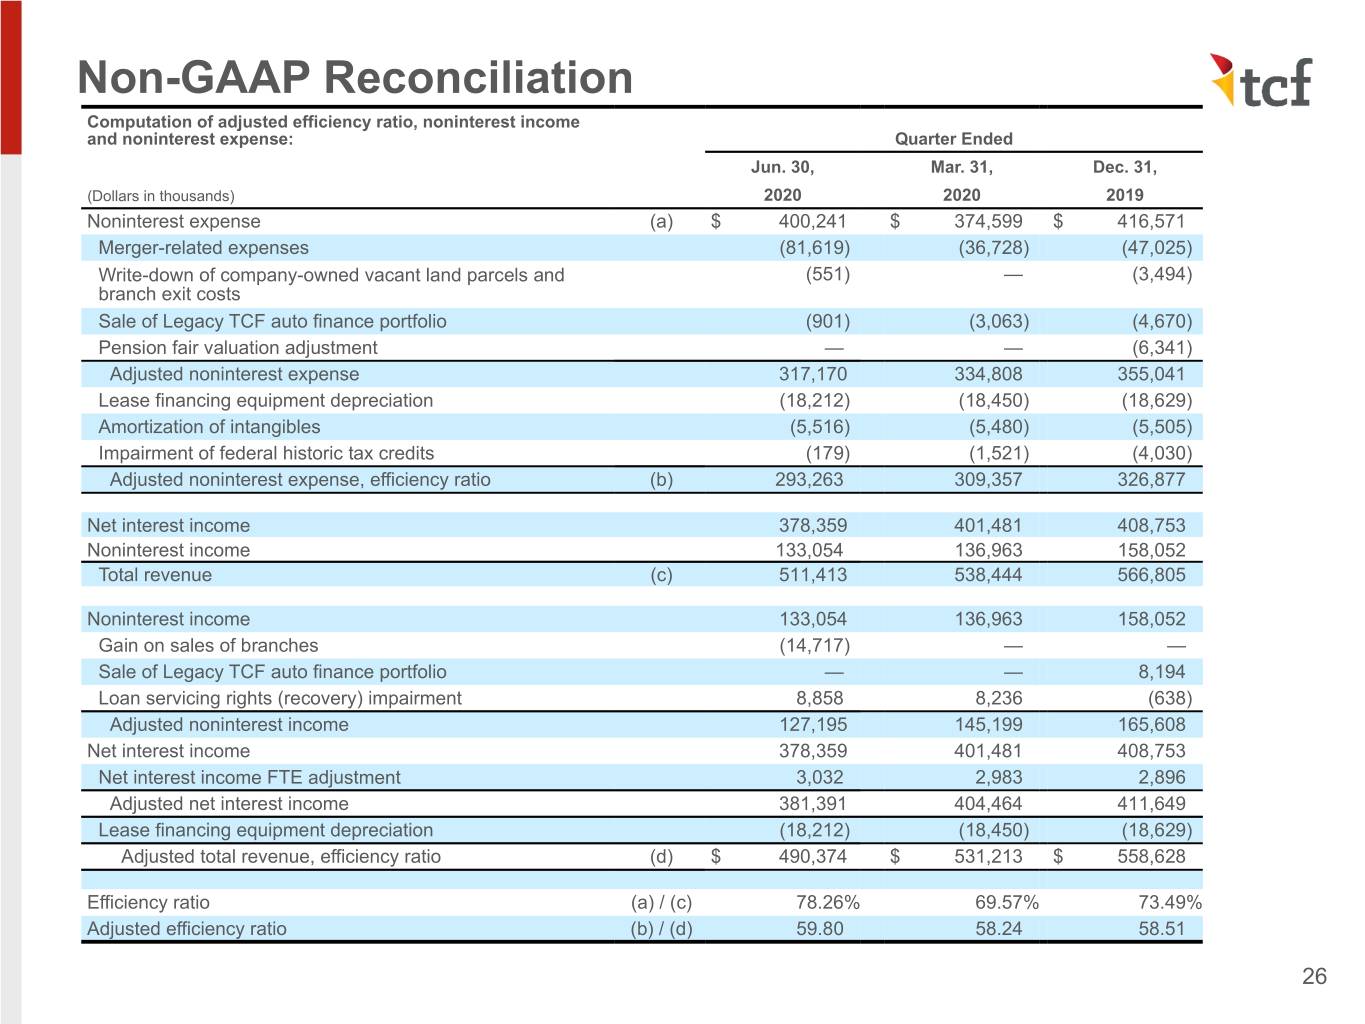
Non-GAAP Reconciliation Computation of adjusted efficiency ratio, noninterest income and noninterest expense: Quarter Ended Jun. 30, Mar. 31, Dec. 31, (Dollars in thousands) 2020 2020 2019 Noninterest expense (a) $ 400,241 $ 374,599 $ 416,571 Merger-related expenses (81,619) (36,728) (47,025) Write-down of company-owned vacant land parcels and (551) — (3,494) branch exit costs Sale of Legacy TCF auto finance portfolio (901) (3,063) (4,670) Pension fair valuation adjustment — — (6,341) Adjusted noninterest expense 317,170 334,808 355,041 Lease financing equipment depreciation (18,212) (18,450) (18,629) Amortization of intangibles (5,516) (5,480) (5,505) Impairment of federal historic tax credits (179) (1,521) (4,030) Adjusted noninterest expense, efficiency ratio (b) 293,263 309,357 326,877 Net interest income 378,359 401,481 408,753 Noninterest income 133,054 136,963 158,052 Total revenue (c) 511,413 538,444 566,805 Noninterest income 133,054 136,963 158,052 Gain on sales of branches (14,717) — — Sale of Legacy TCF auto finance portfolio — — 8,194 Loan servicing rights (recovery) impairment 8,858 8,236 (638) Adjusted noninterest income 127,195 145,199 165,608 Net interest income 378,359 401,481 408,753 Net interest income FTE adjustment 3,032 2,983 2,896 Adjusted net interest income 381,391 404,464 411,649 Lease financing equipment depreciation (18,212) (18,450) (18,629) Adjusted total revenue, efficiency ratio (d) $ 490,374 $ 531,213 $ 558,628 Efficiency ratio (a) / (c) 78.26% 69.57% 73.49% Adjusted efficiency ratio (b) / (d) 59.80 58.24 58.51 26
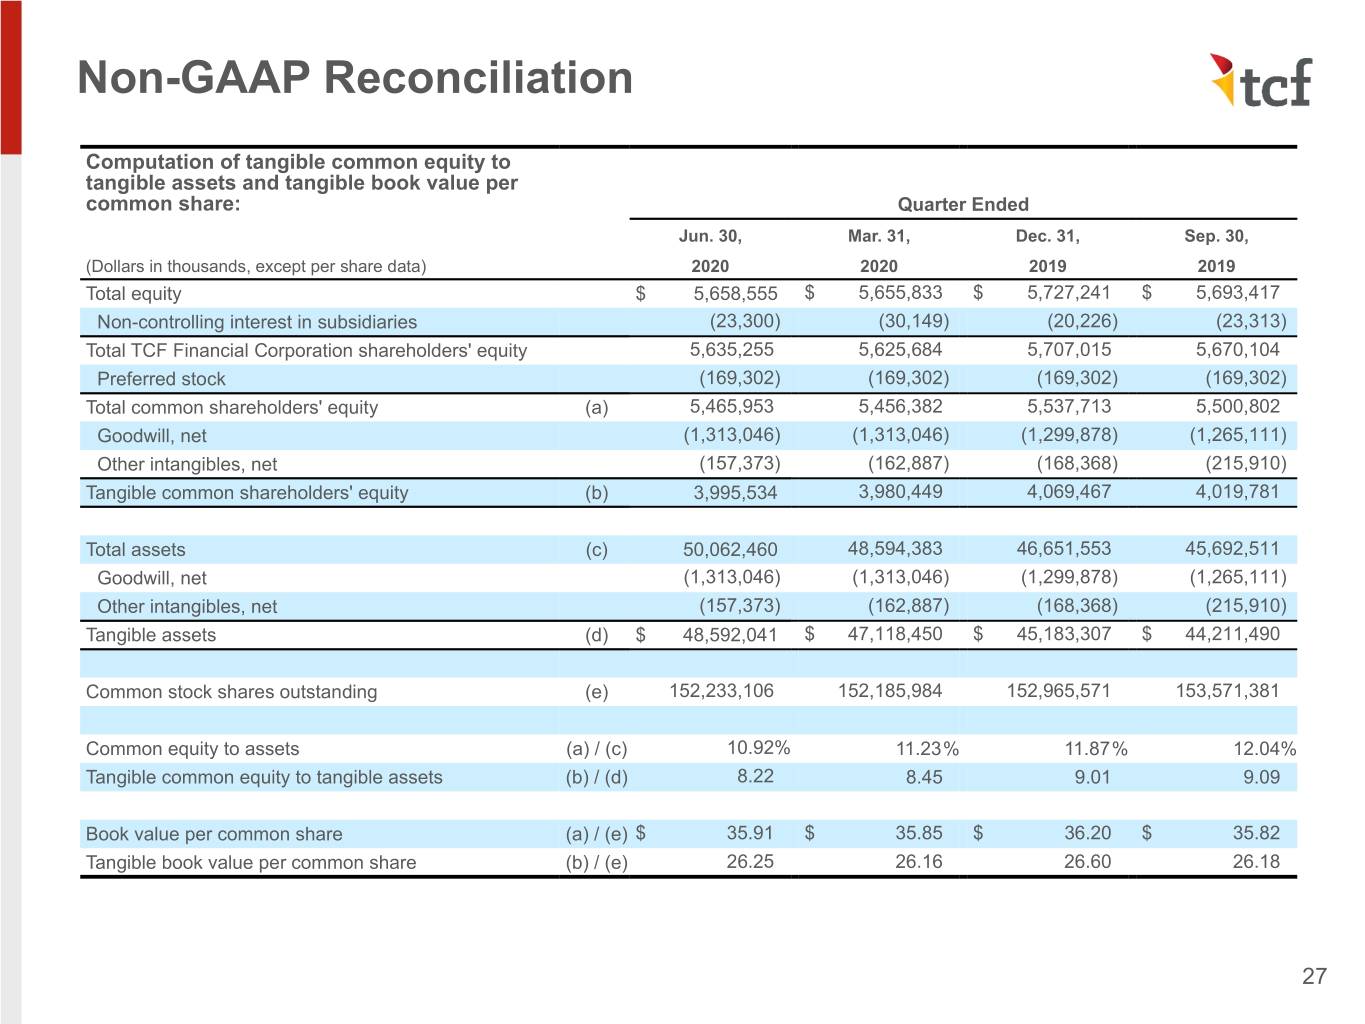
Non-GAAP Reconciliation Computation of tangible common equity to tangible assets and tangible book value per common share: Quarter Ended Jun. 30, Mar. 31, Dec. 31, Sep. 30, (Dollars in thousands, except per share data) 2020 2020 2019 2019 Total equity $ 5,658,555 $ 5,655,833 $ 5,727,241 $ 5,693,417 Non-controlling interest in subsidiaries (23,300) (30,149) (20,226) (23,313) Total TCF Financial Corporation shareholders' equity 5,635,255 5,625,684 5,707,015 5,670,104 Preferred stock (169,302) (169,302) (169,302) (169,302) Total common shareholders' equity (a) 5,465,953 5,456,382 5,537,713 5,500,802 Goodwill, net (1,313,046) (1,313,046) (1,299,878) (1,265,111) Other intangibles, net (157,373) (162,887) (168,368) (215,910) Tangible common shareholders' equity (b) 3,995,534 3,980,449 4,069,467 4,019,781 Total assets (c) 50,062,460 48,594,383 46,651,553 45,692,511 Goodwill, net (1,313,046) (1,313,046) (1,299,878) (1,265,111) Other intangibles, net (157,373) (162,887) (168,368) (215,910) Tangible assets (d) $ 48,592,041 $ 47,118,450 $ 45,183,307 $ 44,211,490 Common stock shares outstanding (e) 152,233,106 152,185,984 152,965,571 153,571,381 Common equity to assets (a) / (c) 10.92% 11.23% 11.87% 12.04% Tangible common equity to tangible assets (b) / (d) 8.22 8.45 9.01 9.09 Book value per common share (a) / (e) $ 35.91 $ 35.85 $ 36.20 $ 35.82 Tangible book value per common share (b) / (e) 26.25 26.16 26.60 26.18 27
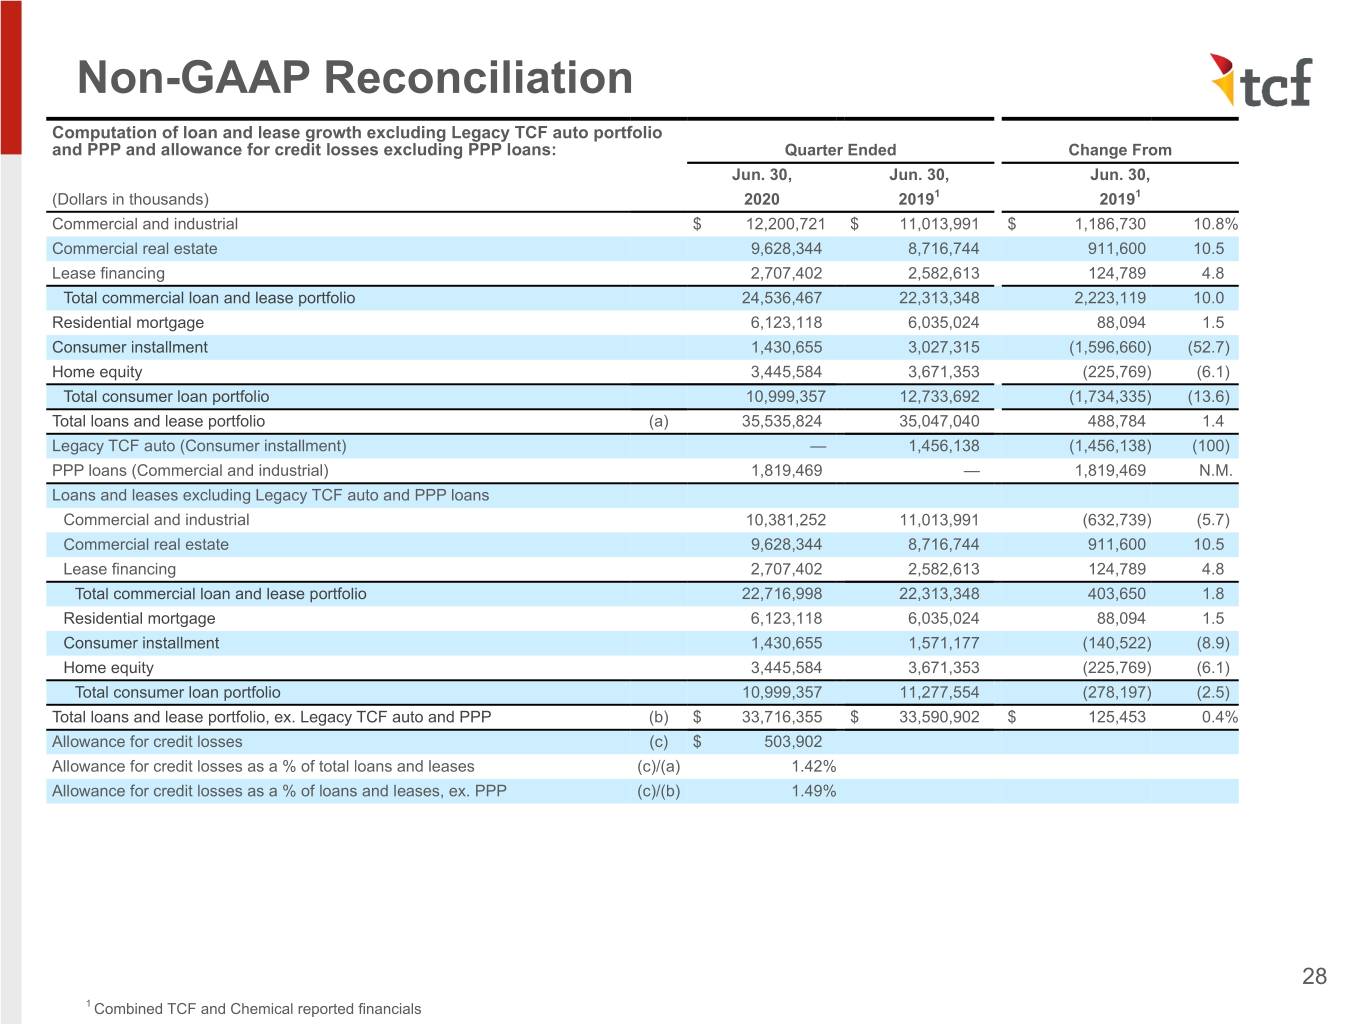
Non-GAAP Reconciliation Computation of loan and lease growth excluding Legacy TCF auto portfolio and PPP and allowance for credit losses excluding PPP loans: Quarter Ended Change From Jun. 30, Jun. 30, Jun. 30, (Dollars in thousands) 2020 20191 20191 Commercial and industrial $ 12,200,721 $ 11,013,991 $ 1,186,730 10.8% Commercial real estate 9,628,344 8,716,744 911,600 10.5 Lease financing 2,707,402 2,582,613 124,789 4.8 Total commercial loan and lease portfolio 24,536,467 22,313,348 2,223,119 10.0 Residential mortgage 6,123,118 6,035,024 88,094 1.5 Consumer installment 1,430,655 3,027,315 (1,596,660) (52.7) Home equity 3,445,584 3,671,353 (225,769) (6.1) Total consumer loan portfolio 10,999,357 12,733,692 (1,734,335) (13.6) Total loans and lease portfolio (a) 35,535,824 35,047,040 488,784 1.4 Legacy TCF auto (Consumer installment) — 1,456,138 (1,456,138) (100) PPP loans (Commercial and industrial) 1,819,469 — 1,819,469 N.M. Loans and leases excluding Legacy TCF auto and PPP loans Commercial and industrial 10,381,252 11,013,991 (632,739) (5.7) Commercial real estate 9,628,344 8,716,744 911,600 10.5 Lease financing 2,707,402 2,582,613 124,789 4.8 Total commercial loan and lease portfolio 22,716,998 22,313,348 403,650 1.8 Residential mortgage 6,123,118 6,035,024 88,094 1.5 Consumer installment 1,430,655 1,571,177 (140,522) (8.9) Home equity 3,445,584 3,671,353 (225,769) (6.1) Total consumer loan portfolio 10,999,357 11,277,554 (278,197) (2.5) Total loans and lease portfolio, ex. Legacy TCF auto and PPP (b) $ 33,716,355 $ 33,590,902 $ 125,453 0.4% Allowance for credit losses (c) $ 503,902 Allowance for credit losses as a % of total loans and leases (c)/(a) 1.42% Allowance for credit losses as a % of loans and leases, ex. PPP (c)/(b) 1.49% 28 1 Combined TCF and Chemical reported financials
