Attached files
| file | filename |
|---|---|
| EX-99.1 - EX-99.1 - Primis Financial Corp. | d48899dex991.htm |
| 8-K - 8-K - Primis Financial Corp. | sona-8k_20200727.htm |

NASDAQ|SONA Exhibit 99.2
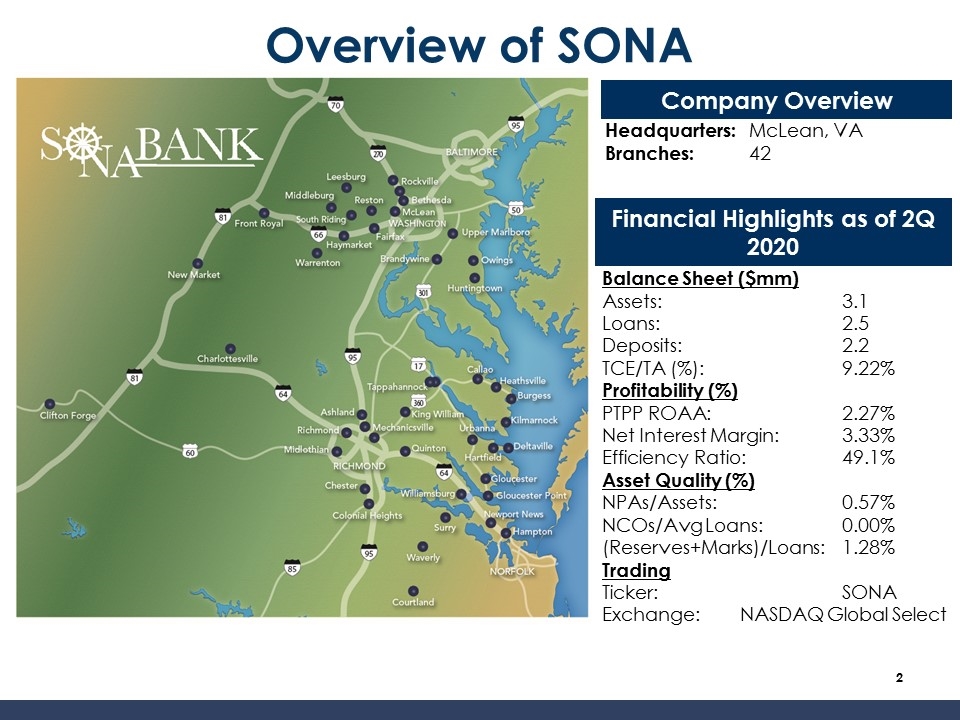
Overview of SONA Company Overview Financial Highlights as of 2Q 2020 Headquarters: McLean, VA Branches:42 Balance Sheet ($mm) Assets:3.1 Loans:2.5 Deposits:2.2 TCE/TA (%):9.22% Profitability (%) PTPP ROAA:2.27% Net Interest Margin:3.33% Efficiency Ratio:49.1% Asset Quality (%) NPAs/Assets:0.57% NCOs/Avg Loans: 0.00% (Reserves+Marks)/Loans:1.28% Trading Ticker:SONA Exchange: NASDAQ Global Select
Operating Highlights – 2Q 2020 Originated approx. 3,800 PPP loans totaling $335.6 million. Deferred PPP fees (net of expenses) of $10.6 million. Increased provision and built reserve for loan losses plus purchased marks to 1.28% of total loans (excluding PPP). Increased non-CD deposits to total deposits 71% compared to 59% at 2Q 2019. Cost of Deposits declined to 0.95% (over 45% compared to year end 2019 levels) Increased contribution from mortgage investment to $4.1 million. Increased PTPP income to $16.8 million or 2.27% of average assets (compared to 1.51% for 2019). Announced partnership with Tyler Stafford and Panacea that will increase long-term growth in assets and earnings per share focusing on medical professionals.
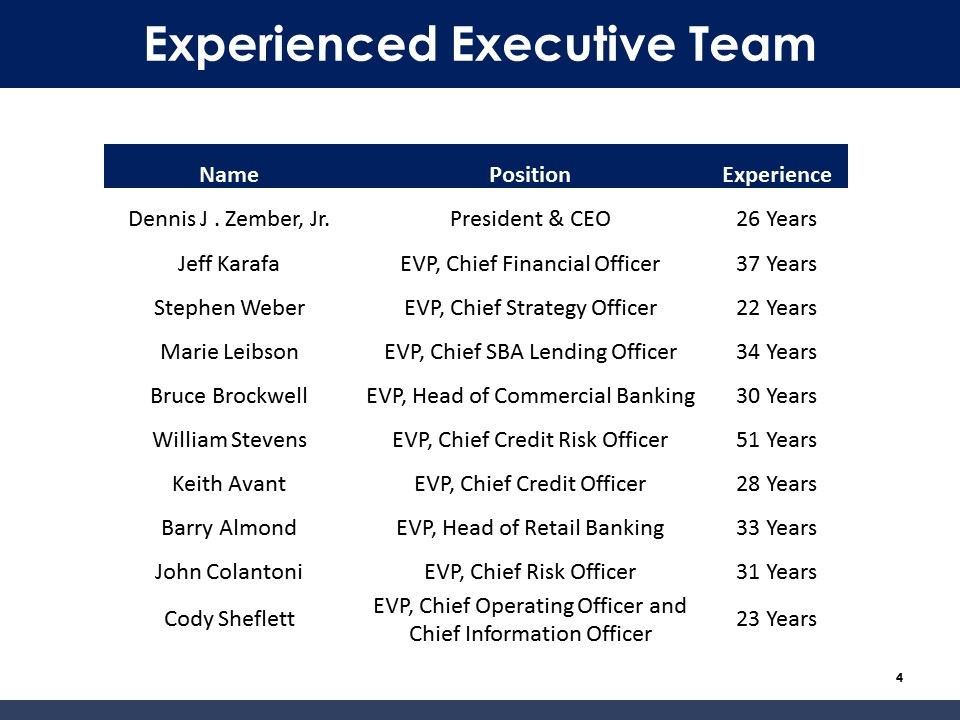
Experienced Executive Team Name Position Experience Dennis J . Zember, Jr. President & CEO 26 Years Jeff Karafa EVP, Chief Financial Officer 37 Years Stephen Weber EVP, Chief Strategy Officer 22 Years Marie Leibson EVP, Chief SBA Lending Officer 34 Years Bruce Brockwell EVP, Head of Commercial Banking 30 Years William Stevens EVP, Chief Credit Risk Officer 51 Years Keith Avant EVP, Chief Credit Officer 28 Years Barry Almond EVP, Head of Retail Banking 33 Years John Colantoni EVP, Chief Risk Officer 31 Years Cody Sheflett EVP, Chief Operating Officer and Chief Information Officer 23 Years
Operating & Strategic Focus Manage through the pandemic and resulting economic effects Aggressively managing and monitoring relationships and portfolios greater than $5 million (65% of total portfolio) Cautiously evaluating strategic opportunities for best short-term impact on capital and credit risk Improve the Operating Results of the Company Improve the deposit mix, focusing less on brokered and higher cost retail CDs, substantially lowering the Company’s cost of funds. Establish sales culture that focuses on and rewards growth in core deposits Position the Company for a more substantial growth rate in loans in 2021 through key hires in 2020. Diversify the Company’s LOB and non-interest income lines of business Greatly expand the Company’s mortgage opportunity and earnings contribution Increase the production and sales of Government guaranteed loans Capitalize on the Panacea opportunity to expand our technology and product offerings, improve our growth rates and demonstrate the creative and entrepreneurial energy to drive shareholder value long term.
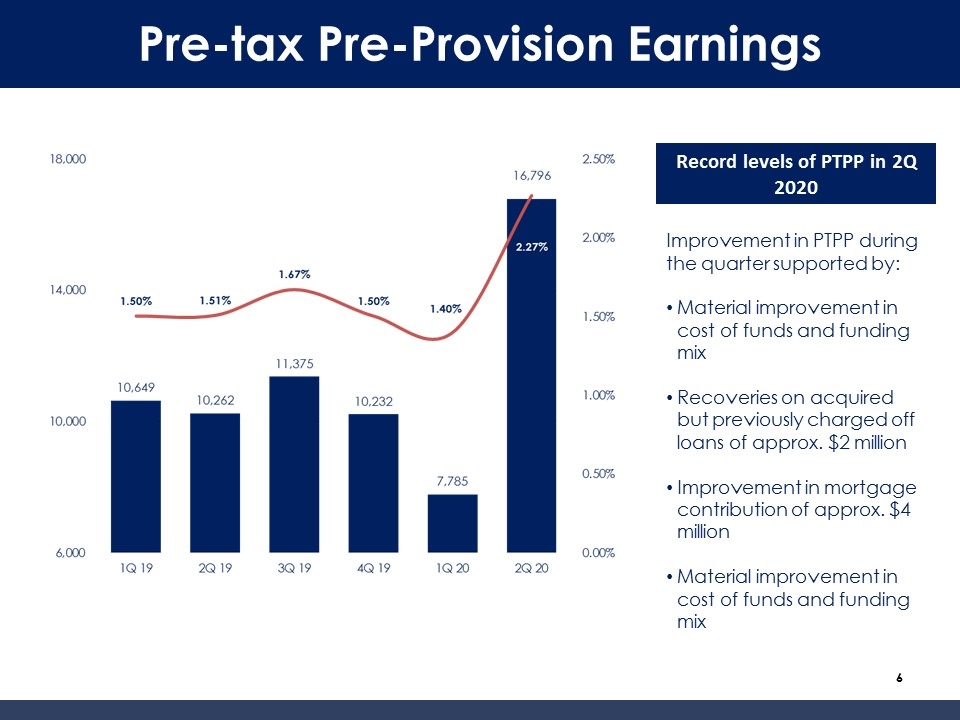
Pre-tax Pre-Provision Earnings Record levels of PTPP in 2Q 2020 Improvement in PTPP during the quarter supported by: Material improvement in cost of funds and funding mix Recoveries on acquired but previously charged off loans of approx. $2 million Improvement in mortgage contribution of approx. $4 million Material improvement in cost of funds and funding mix
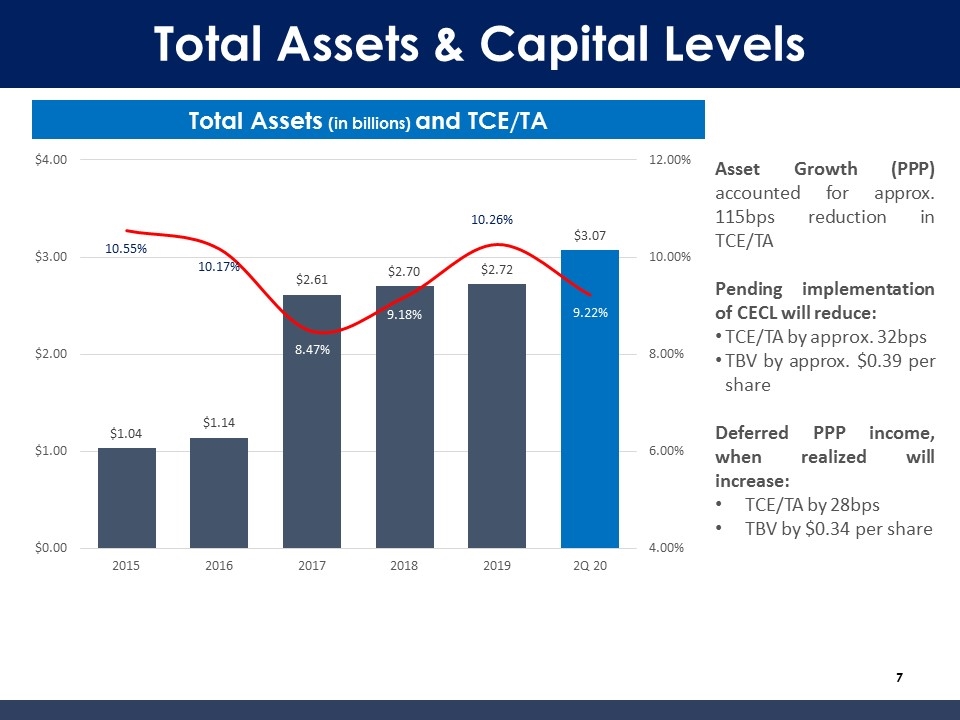
Total Assets & Capital Levels Asset Growth (PPP) accounted for approx. 115bps reduction in TCE/TA Pending implementation of CECL will reduce: TCE/TA by approx. 32bps TBV by approx. $0.39 per share Deferred PPP income, when realized will increase: TCE/TA by 28bps TBV by $0.34 per share Total Assets (in billions) and TCE/TA
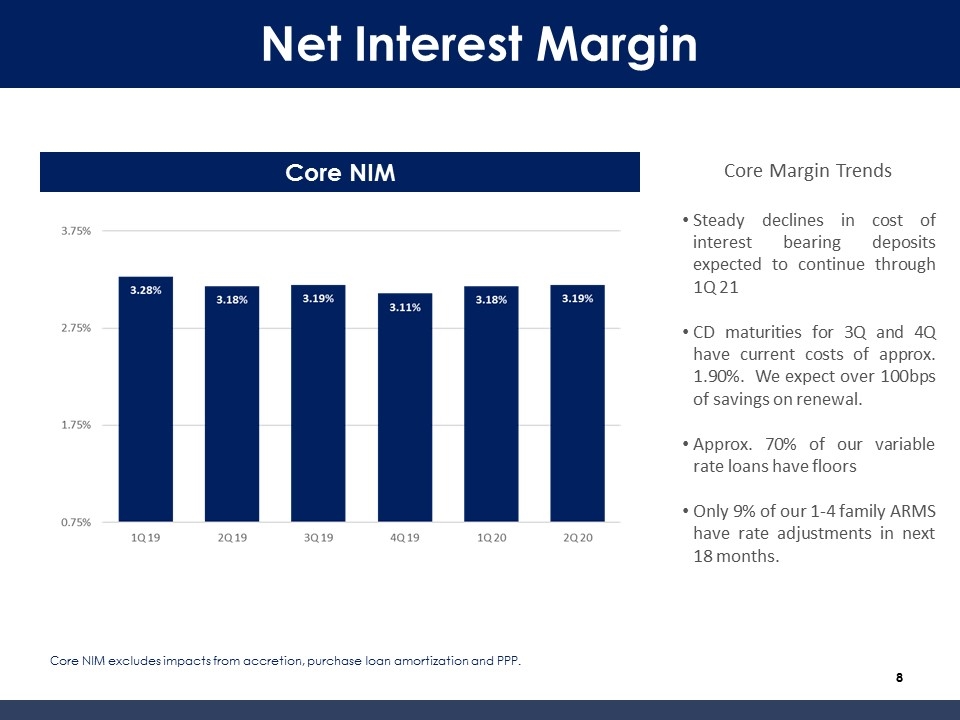
Net Interest Margin Core Margin Trends Steady declines in cost of interest bearing deposits expected to continue through 1Q 21 CD maturities for 3Q and 4Q have current costs of approx. 1.90%. We expect over 100bps of savings on renewal. Approx. 70% of our variable rate loans have floors Only 9% of our 1-4 family ARMS have rate adjustments in next 18 months. Core NIM Core NIM excludes impacts from accretion, purchase loan amortization and PPP.
Panacea Financial Why Sonabank? Why Panacea? Professional relationship between the principals goes back several years, operating styles amongst both sides are well known and appreciated. Sonabank’s management has past history building national lines of business that are accretive to value proposition, credit quality and operating ratios. Panacea’s idea and passion combined with practical, ground-level understanding of the banking and financial needs are uniquely interesting and timely. Financial Benefits for Sonabank Accretive to our long-term credit quality given our customer base and their credit trends Accretive to our long-term EPS growth rate with conservative growth and spread projections Accretive to our loan and deposit trends. Long-term deposit opportunity greatly eclipses the initial loan relationship with the medical professional. Ownership stake in the program assures Sonabank participates in more than just increases in spread income and balance sheet growth Cultural and Image Benefits for Sonabank Demonstrates the new creativity and vision management has for the future of building value Drives development of technology and logistics for banking services that is broadly lacking in the industry
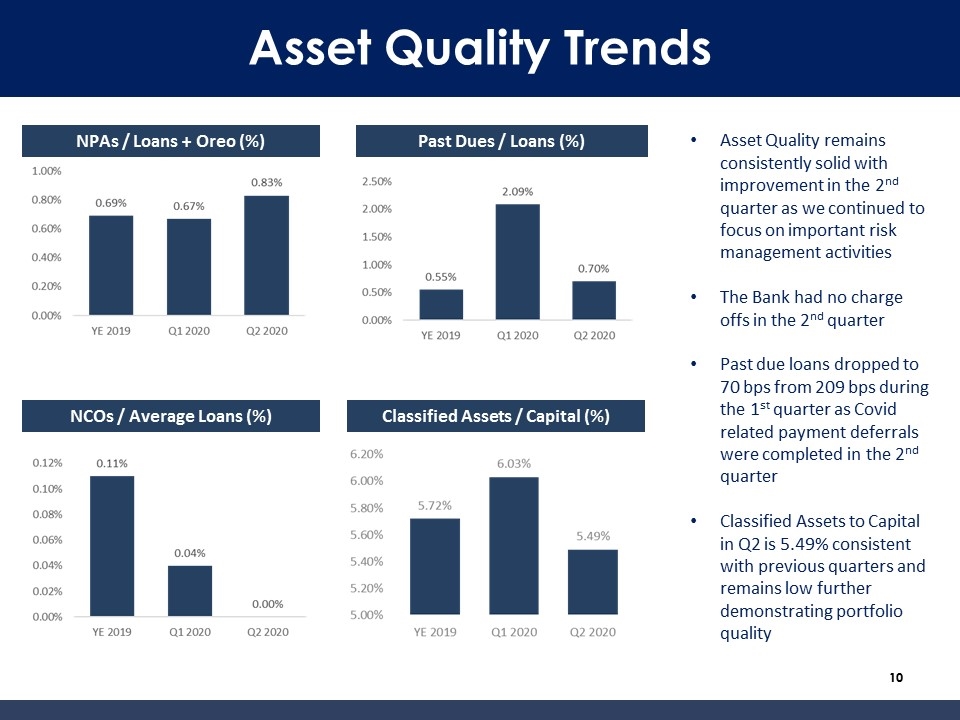
NPAs / Loans + Oreo (%) NCOs / Average Loans (%) Past Dues / Loans (%) Classified Assets / Capital (%) Asset Quality remains consistently solid with improvement in the 2nd quarter as we continued to focus on important risk management activities The Bank had no charge offs in the 2nd quarter Past due loans dropped to 70 bps from 209 bps during the 1st quarter as Covid related payment deferrals were completed in the 2nd quarter Classified Assets to Capital in Q2 is 5.49% consistent with previous quarters and remains low further demonstrating portfolio quality Asset Quality Trends
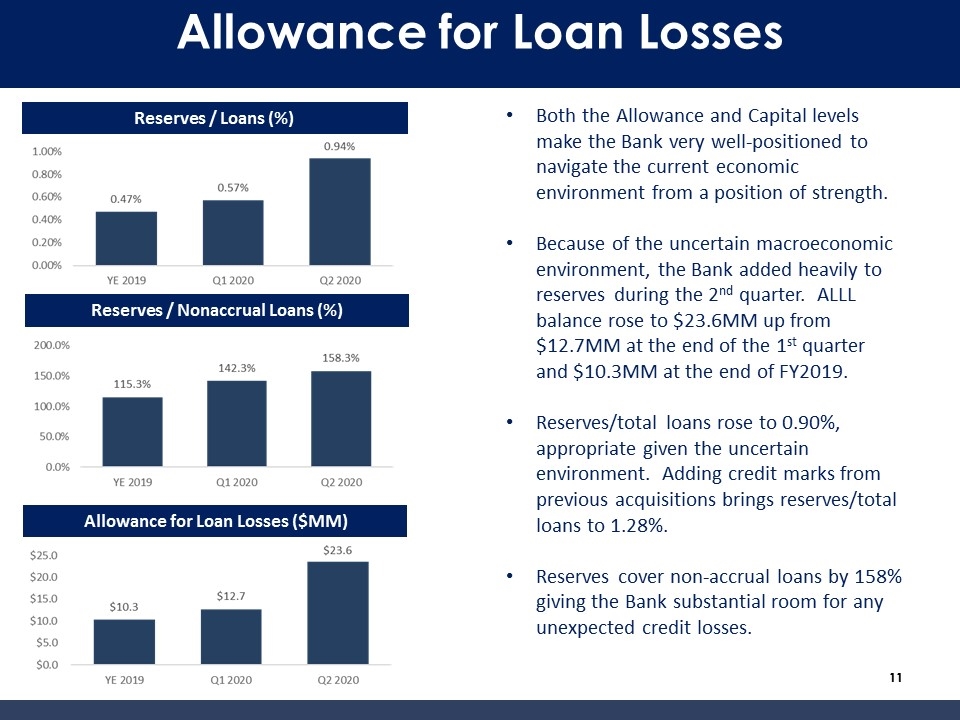
Reserves / Nonaccrual Loans (%) Allowance for Loan Losses ($MM) Reserves / Loans (%) Both the Allowance and Capital levels make the Bank very well-positioned to navigate the current economic environment from a position of strength. Because of the uncertain macroeconomic environment, the Bank added heavily to reserves during the 2nd quarter. ALLL balance rose to $23.6MM up from $12.7MM at the end of the 1st quarter and $10.3MM at the end of FY2019. Reserves/total loans rose to 0.90%, appropriate given the uncertain environment. Adding credit marks from previous acquisitions brings reserves/total loans to 1.28%. Reserves cover non-accrual loans by 158% giving the Bank substantial room for any unexpected credit losses. Allowance for Loan Losses
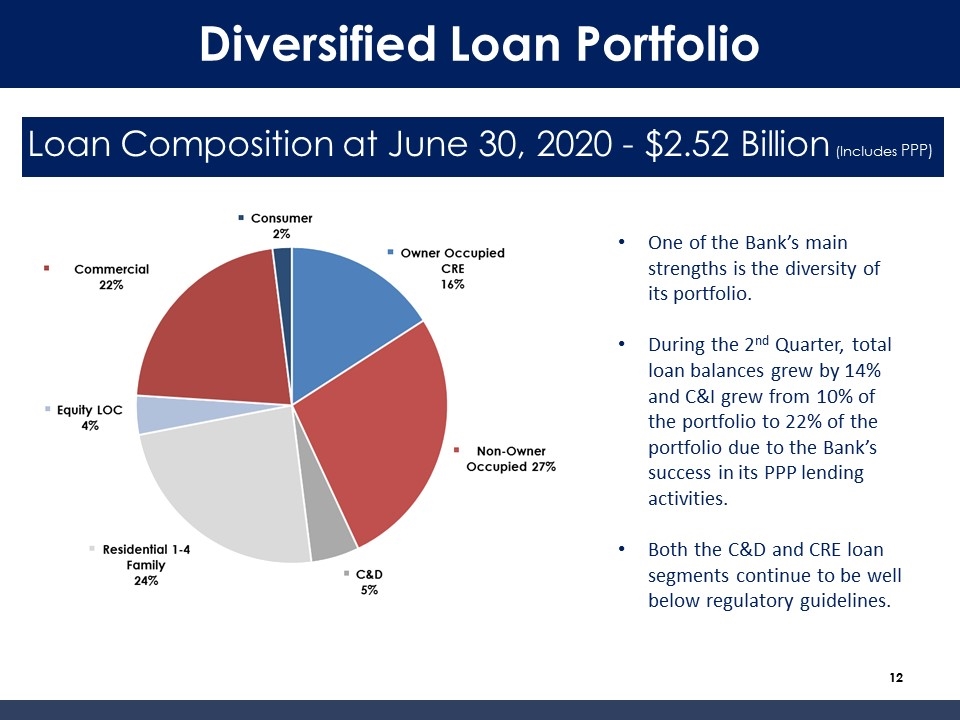
Diversified Loan Portfolio Loan Composition at June 30, 2020 - $2.52 Billion (Includes PPP) One of the Bank’s main strengths is the diversity of its portfolio. During the 2nd Quarter, total loan balances grew by 14% and C&I grew from 10% of the portfolio to 22% of the portfolio due to the Bank’s success in its PPP lending activities. Both the C&D and CRE loan segments continue to be well below regulatory guidelines.
