Attached files
| file | filename |
|---|---|
| EX-99.1 - EX-99.1 - HEARTLAND FINANCIAL USA INC | ex991q22020pressrelease.htm |
| 8-K - 8-K - HEARTLAND FINANCIAL USA INC | htlf-20200727.htm |

Heartland Financial USA, Inc. COVID-19 Credit Overview Commercial and Ag Portfolios 2nd Quarter 2020

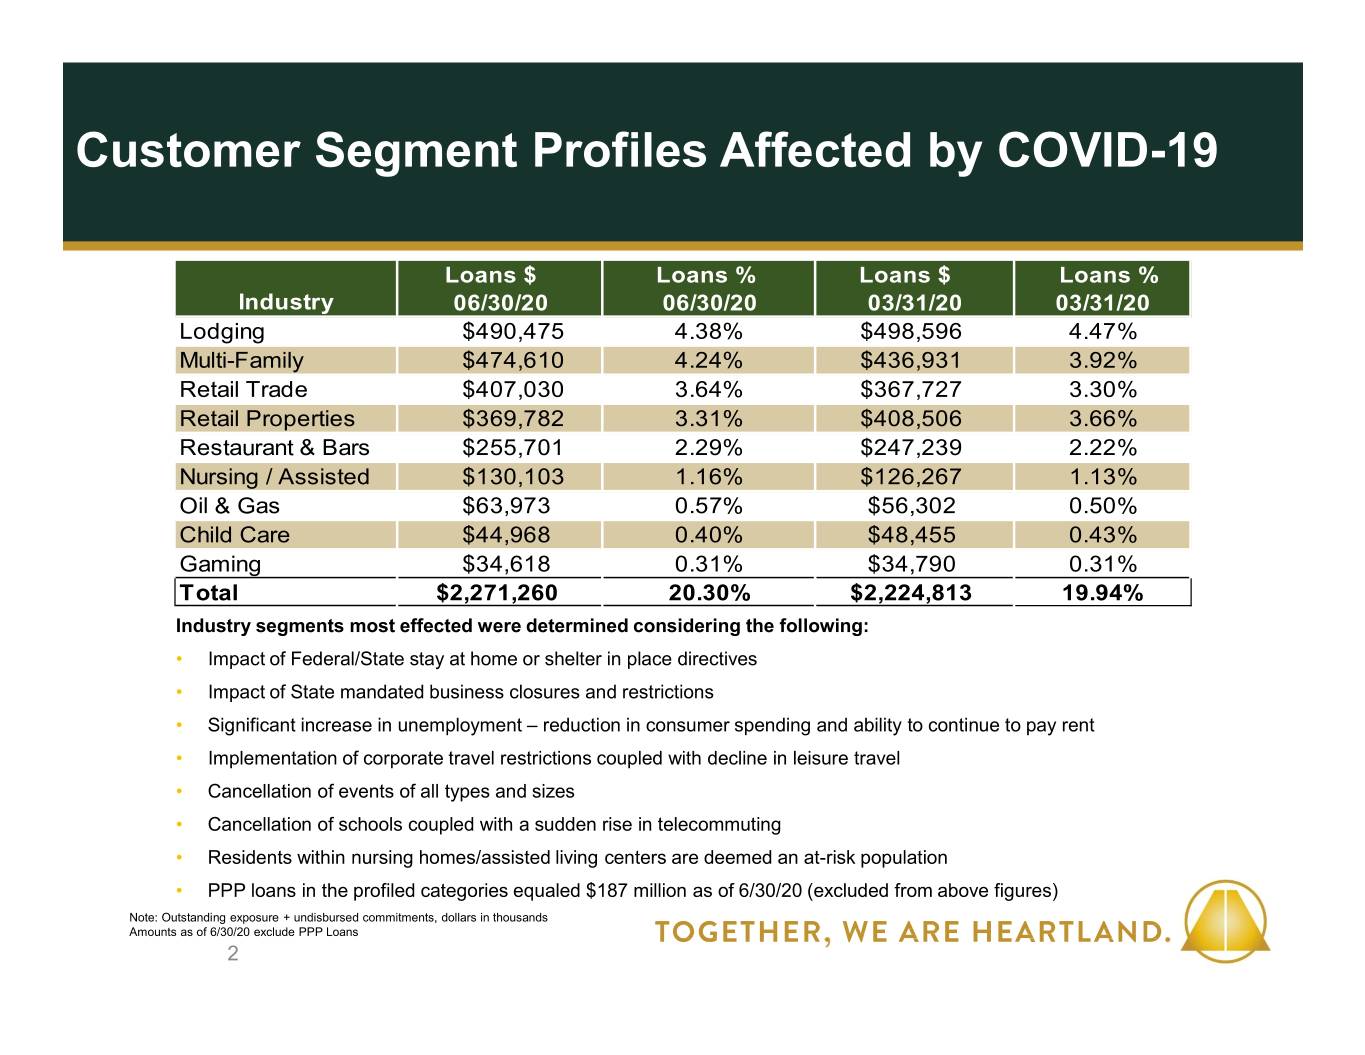
Customer Segment Profiles Affected by COVID-19 Loans $ Loans % Loans $ Loans % Industry 06/30/20 06/30/20 03/31/20 03/31/20 Lodging $490,475 4.38% $498,596 4.47% Multi-Family $474,610 4.24% $436,931 3.92% Retail Trade $407,030 3.64% $367,727 3.30% Retail Properties $369,782 3.31% $408,506 3.66% Restaurant & Bars $255,701 2.29% $247,239 2.22% Nursing / Assisted $130,103 1.16% $126,267 1.13% Oil & Gas $63,973 0.57% $56,302 0.50% Child Care $44,968 0.40% $48,455 0.43% Gaming $34,618 0.31% $34,790 0.31% Total $2,271,260 20.30% $2,224,813 19.94% Industry segments most effected were determined considering the following: • Impact of Federal/State stay at home or shelter in place directives • Impact of State mandated business closures and restrictions • Significant increase in unemployment – reduction in consumer spending and ability to continue to pay rent • Implementation of corporate travel restrictions coupled with decline in leisure travel • Cancellation of events of all types and sizes • Cancellation of schools coupled with a sudden rise in telecommuting • Residents within nursing homes/assisted living centers are deemed an at-risk population • PPP loans in the profiled categories equaled $187 million as of 6/30/20 (excluded from above figures) Note: Outstanding exposure + undisbursed commitments, dollars in thousands Amounts as of 6/30/20 exclude PPP Loans 2

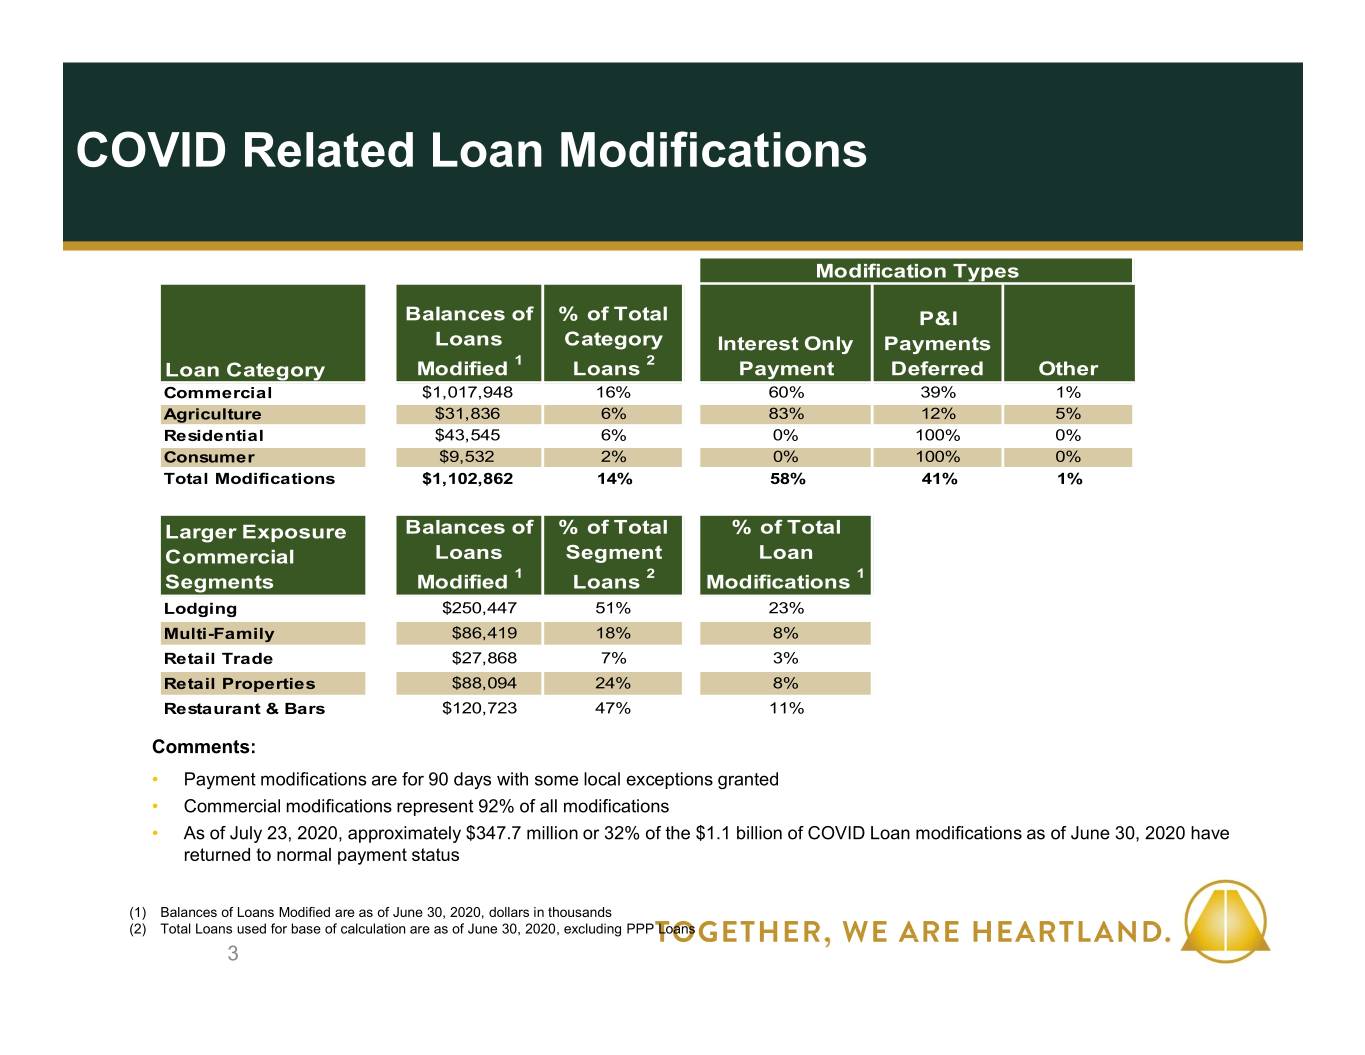
COVID Related Loan Modifications Modification Types Balances of % of Total P&I Loans Category Interest Only Payments 1 2 Loan Category Modified Loans Payment Deferred Other Commercial $1,017,948 16% 60% 39% 1% Agriculture $31,836 6% 83% 12% 5% Residential $43,545 6% 0% 100% 0% Consumer $9,532 2% 0% 100% 0% Total Modifications $1,102,862 14% 58% 41% 1% Larger Exposure Balances of % of Total % of Total Commercial Loans Segment Loan Segments Modified 1 Loans 2 Modifications 1 Lodging $250,447 51% 23% Multi-Family $86,419 18% 8% Retail Trade $27,868 7% 3% Retail Properties $88,094 24% 8% Restaurant & Bars $120,723 47% 11% Comments: • Payment modifications are for 90 days with some local exceptions granted • Commercial modifications represent 92% of all modifications • As of July 23, 2020, approximately $347.7 million or 32% of the $1.1 billion of COVID Loan modifications as of June 30, 2020 have returned to normal payment status (1) Balances of Loans Modified are as of June 30, 2020, dollars in thousands (2) Total Loans used for base of calculation are as of June 30, 2020, excluding PPP Loans 3

Lodging Portfolio Overview Lodging Portfolio Detail, 06/30/20 Portfolio Highlights • Pre-Covid Statistics: Outstanding Loans $425,374 Unfunded Commitments $65,101 • Analyzed population included loans with Total Portfolio $490,475 greater than $1 million in exposure and Average Exposure per Loan $2,568 represented 97.3% of total portfolio % of HTLF Exposure 4.38% • $174 million of analyzed population is under development with 55% drawn Geographic Distribution • 76% of exposure represents flagged Minnesota properties 1.5% Montana 1.7% Colorado • Disciplined underwriting 21.2% Arizona Kansas / Missouri – Weighted Average DSCR of 1.64 3.9% 10.0% – Weighted Average LTV of 70% New Mexico California 11.1% 10.2% • Exposure well dispersed across 11 state footprint Texas Wisconsin 7.7% • $250.5 million of loan modifications processed 13.0% Iowa as of 6/30/20 Illinois 12.1% 7.6% • $35.4 million have returned to regular payment schedules as of 7/23/20 Note: Dollars in thousands, excluding PPP Loans 4

Multi-Family Portfolio Overview Multi-Family Portfolio Detail, 06/30/20 Portfolio Highlights • Pre-Covid Statistics: Outstanding Loans $353,878 Unfunded Commitments $120,732 • Analyzed population included loans with Total Portfolio $474,610 greater than $1 million in exposure and Average Exposure per Loan $1,368 represented 77.4% of total portfolio % of HTLF Exposure 4.24% • Disciplined underwriting Geographic Distribution – Weighted average DSCR of 1.35 Montana – Weighed average of LTV of 65% 2.2% Minnesota • Exposure well dispersed across 11 state 3.0% Colorado Arizona footprint 23.4% 5.1% Kansas / Missouri 2.3% • Granular population - average loan amount of $1.4 million California New Mexico 8.4% 17.9% • $86.4 million of loan modifications processed as of 6/30/20 Texas 9.6% • $18.3 million have returned to regular payment Iowa Wisconsin schedules as of 7/23/20 Illinois 9.1% 10.4% 8.6% Note: Dollars in thousands, excluding PPP Loans 5

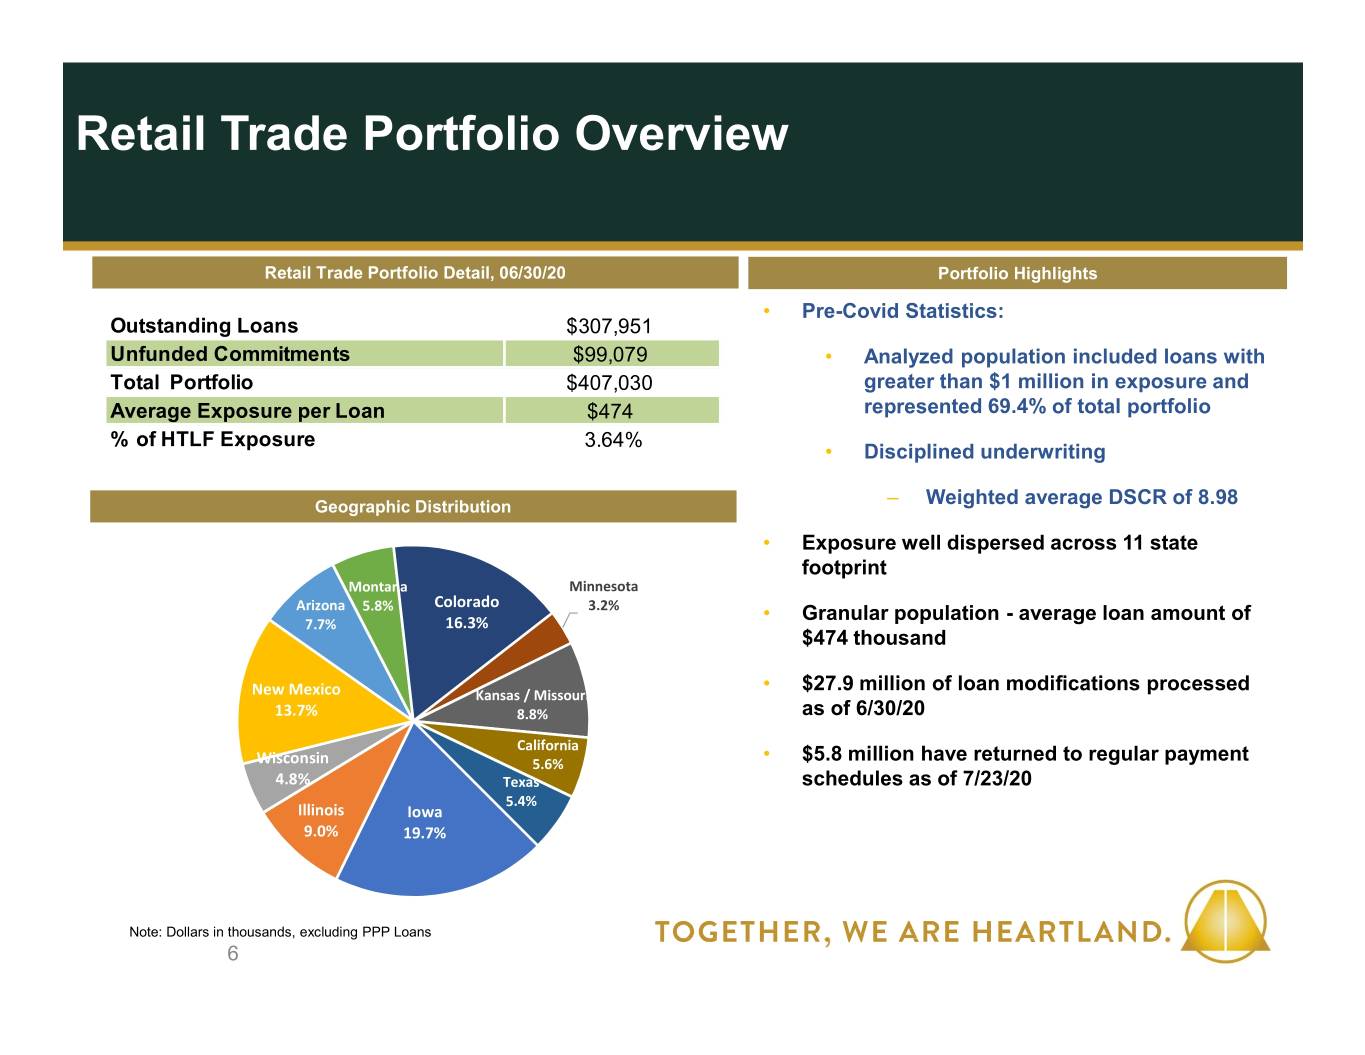
Retail Trade Portfolio Overview Retail Trade Portfolio Detail, 06/30/20 Portfolio Highlights • Pre-Covid Statistics: Outstanding Loans $307,951 Unfunded Commitments $99,079 • Analyzed population included loans with Total Portfolio $407,030 greater than $1 million in exposure and Average Exposure per Loan $474 represented 69.4% of total portfolio % of HTLF Exposure 3.64% • Disciplined underwriting Geographic Distribution – Weighted average DSCR of 8.98 • Exposure well dispersed across 11 state footprint Montana Minnesota Colorado Arizona 5.8% 3.2% • Granular population - average loan amount of 7.7% 16.3% $474 thousand • $27.9 million of loan modifications processed New Mexico Kansas / Missouri 13.7% 8.8% as of 6/30/20 California • $5.8 million have returned to regular payment Wisconsin 5.6% 4.8% Texas schedules as of 7/23/20 5.4% Illinois Iowa 9.0% 19.7% Note: Dollars in thousands, excluding PPP Loans 6

Retail Properties Portfolio Overview Retail Properties Portfolio Detail, 06/30/20 Portfolio Highlights Outstanding Loans $344,173 • Pre-Covid Statistics: Unfunded Commitments $25,609 • Analyzed population included loans with Total Portfolio $369,782 greater than $1 million in exposure and Average Exposure per Loan $1,091 represented 79.9% of total portfolio % of HTLF Exposure 3.31% • Disciplined underwriting Geographic Distribution – Weighted average DSCR of 1.89 – Weighted average LTV of 59% Minnesota 12.0% Colorado • Exposure well dispersed across 11 state Kansas / Missouri Montana 14.5% footprint 3.7% 7.8% Arizona • Average loan amount of $1.1 million 4.7% California 12.5% • $88.1 million of loan modifications processed to date as of 6/30/20 New Mexico Texas 7.4% 18.4% • $34.1 million have returned to regular payment Illinois 15.0% schedules as of 7/23/20 Iowa Wisconsin 1.9% 2.1% Note: Dollars in thousands, excluding PPP Loans 7

Restaurants & Bars Portfolio Overview Restaurants & Bars Portfolio Detail, 06/30/20 Portfolio Highlights Outstanding Loans $237,949 • Pre-Covid Statistics: Unfunded Commitments $17,752 • Analyzed population included loans with Total Portfolio $255,701 greater than $1 million in exposure and Average Exposure per Loan $386 represented 77.6% of total portfolio % of HTLF Exposure 2.29% • Disciplined underwriting Geographic Distribution – Weighted average DSCR of 2.46 Kansas / Missouri • 22% of analyzed exposure represents 3.0% franchised restaurants Montana Colorado Minnesota 1.2% 17.6% 5.7% • Exposure well dispersed across 11 state Arizona California footprint 4.7% 9.8% • Granular population - average loan amount of $386 thousand New Mexico Texas 17.5% 15.7% • $120.7 million of loan modifications processed as of 6/30/2020 Wisconsin Illinois 8.8% 10.7% • $50.7 million have returned to regular payment schedules as of 7/23/20 Iowa 5.3% Note: Dollars in thousands, excluding PPP Loans 8

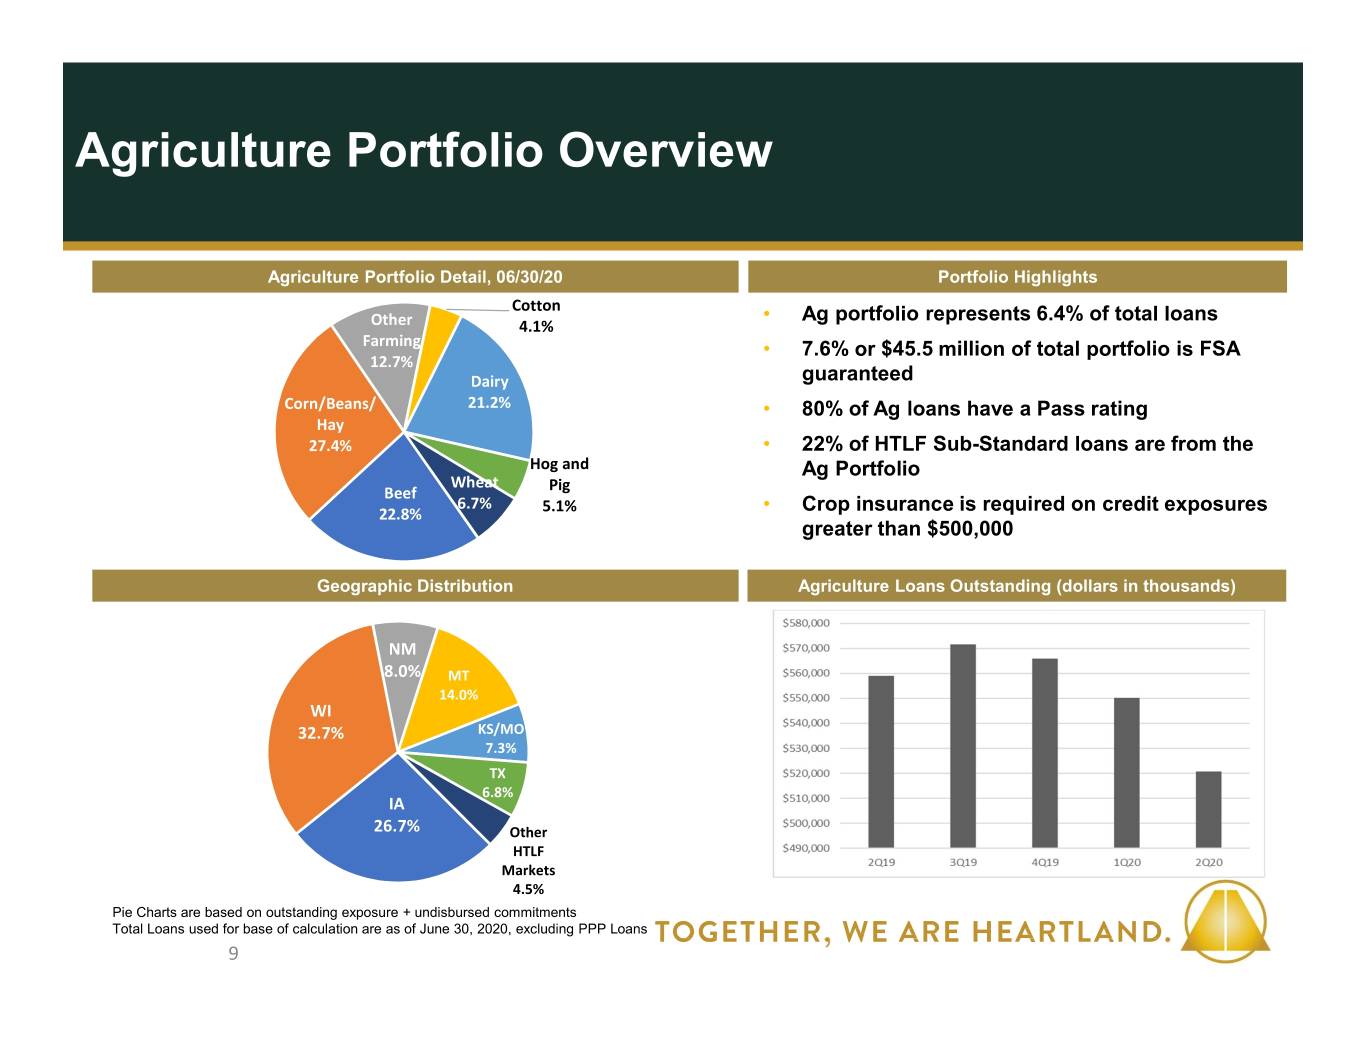
Agriculture Portfolio Overview Agriculture Portfolio Detail, 06/30/20 Portfolio Highlights Cotton • Ag portfolio represents 6.4% of total loans Other 4.1% Farming • 7.6% or $45.5 million of total portfolio is FSA 12.7% Dairy guaranteed Corn/Beans/ 21.2% • 80% of Ag loans have a Pass rating Hay 27.4% • 22% of HTLF Sub-Standard loans are from the Hog and Ag Portfolio Wheat Beef Pig 6.7% • Crop insurance is required on credit exposures 22.8% 5.1% greater than $500,000 Geographic Distribution Agriculture Loans Outstanding (dollars in thousands) NM 8.0% MT 14.0% WI 32.7% KS/MO 7.3% TX 6.8% IA 26.7% Other HTLF Markets 4.5% Pie Charts are based on outstanding exposure + undisbursed commitments Total Loans used for base of calculation are as of June 30, 2020, excluding PPP Loans 9

Construction Portfolio Overview Comments: . Well distributed over geographic footprint . Diversified by property type (1) Balances of Loans as of June 30, 2020
