Attached files
| file | filename |
|---|---|
| EX-99.1 - EXHIBIT 99.1 - COMMUNITY BANK SYSTEM, INC. | tm2025631d1_ex99-1.htm |
| 8-K - FORM 8-K - COMMUNITY BANK SYSTEM, INC. | tm2025631d1_8k.htm |
Exhibit 99.2

0 Q2 2020 EARNINGS RELEASE SUPPLEMENTAL INFORMATION
1 This presentation contains forward - looking statements within the meaning of the Private Securities Litigation Reform Act of 1995. These statements are based on the current beliefs and expectations of CBU’s management and are subject to significant risks and uncertainties. Actual results may differ from those set forth in the forward - looking statements. The following factors, among others, could cause the actual results of CBU’s operations to differ materially from its expectation s: the macroeconomic and other challenges and uncertainties related to the COVID - 19 pandemic, including the negative impacts and disruptions on public health, CBU’s corporate and consumer customers, the communities CBU serves, and the domestic and global economy, which may have an adverse effect on CBU’s business; current and future economic and market conditions, including the effects of declines in housing prices, high unemployment rates, U.S. fiscal debt, budget and tax matters, geopolitical matters, and any slowdown in global economic growth; fiscal and monetary policies of the Federal Reserve Board; the effect of changes in the level of checking or savings account deposits on CBU’s funding costs and net interest margin; future provisions for credit losses on loans and debt securities; changes in nonperforming assets; the effec t of a fall in stock market prices on CBU’s fee income businesses, including its employee benefit services, wealth management, and insurance businesses; the successful integration of operations of its acquisitions; competition; changes in legislation or regulatory requirements; and the timing for receiving regulatory approvals and completing pending transactions . For more information about factors that could cause actual results to differ materially from CBU’s expectations, refer to its reports filed with the Securities and Exchange Commission, including the discussion under “Risk Factors” in the Annual Report on Form 10 - K for the year ended December 31, 2019, and Quarterly Report on Form 10 - Q for the quarterly period ended March 31, 2020, which have been filed with the Securities and Exchange Commission and available on its website at www.sec.gov. Further, any forward - looking statement speaks only as of the date on which it is made, and CBU undertakes no obligation to update any forward - looking statement to reflect events or circumstances after the date on which the statement is made or to reflect the occurrence of unanticipated events. FORWARD LOOKING STATEMENT (unaudited)

2 July: Phase 4 (Monitor) Continue to monitor health data Second round of employees return to office Continue to monitor financial exposure June: Phase 3 (Resume) Branches begin to reopen First round of employees return to office Daily health surveys April/May: Phase 2 (Execute) Assessed return to work protocols Redeployed staff to assist with deferral & PPP efforts Assessed reopening of branch and other offices March: Phase 1 (Assess) Internal task force Modified Company operations Work from home Self quarantine policies Enhanced cleaning COMPANY RESPONSE TO COVID - 19 (unaudited)
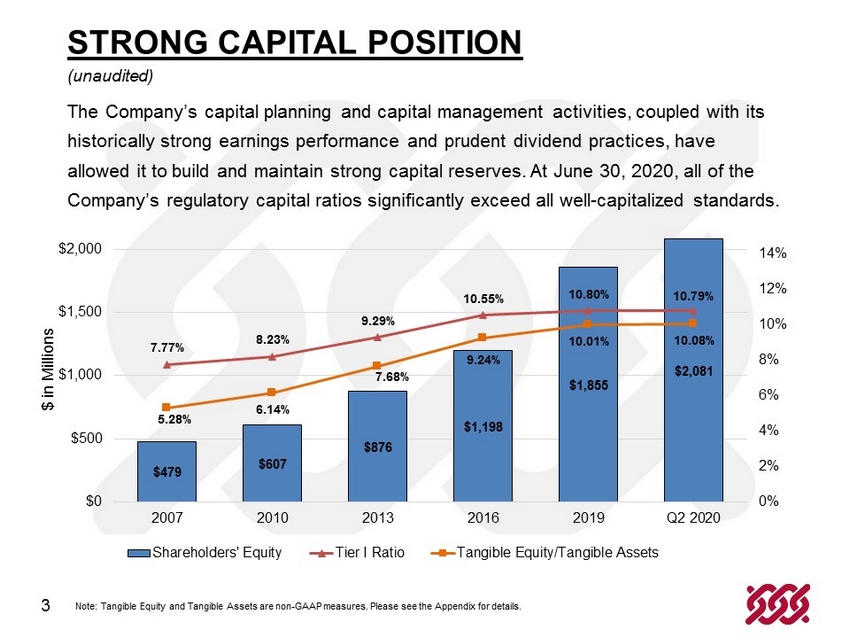
3 $479 $607 $876 $1,198 $1,855 $2,081 7.77% 8.23% 9.29% 10.55% 10.80% 10.79% 5.28% 6.14% 7.68% 9.24% 10.01% 10.08% 0% 2% 4% 6% 8% 10% 12% 14% $0 $500 $1,000 $1,500 $2,000 2007 2010 2013 2016 2019 Q2 2020 $ in Millions Shareholders' Equity Tier I Ratio Tangible Equity/Tangible Assets STRONG CAPITAL POSITION (unaudited) The Company’s capital planning and capital management activities, coupled with its historically strong earnings performance and prudent dividend practices, have allowed it to build and maintain strong capital reserves. At June 30, 2020, all of the Company’s regulatory capital ratios significantly exceed all well - capitalized standards. Note: Tangible Equity and Tangible Assets are non - GAAP measures. Please see the Appendix for details.
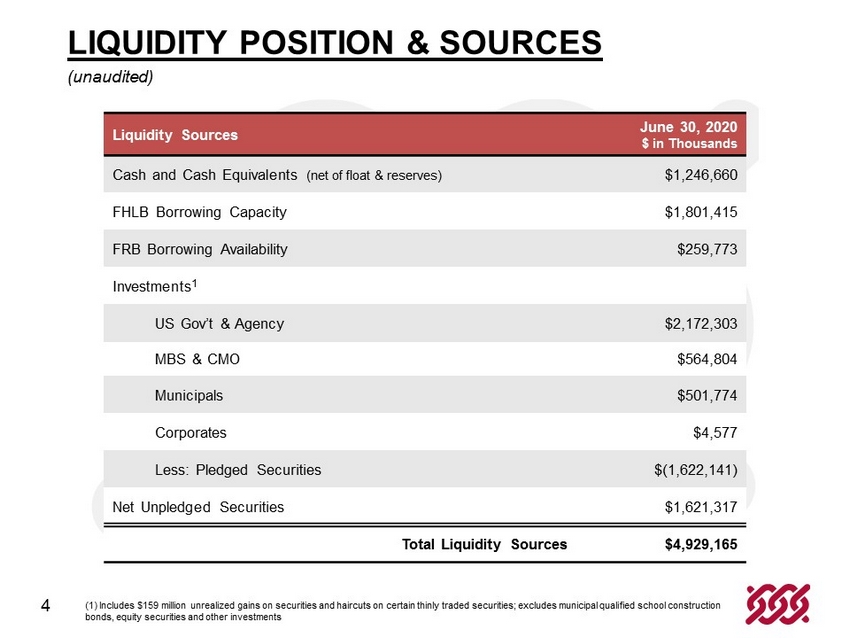
4 Liquidity Sources June 30, 2020 $ in Thousands Cash and Cash Equivalents (net of float & reserves) $1,246,660 FHLB Borrowing Capacity $1,801,415 FRB Borrowing Availability $259,773 Investments 1 US Gov’t & Agency $2,172,303 MBS & CMO $564,804 Municipals $501,774 Corporates $4,577 Less: Pledged Securities $(1,622,141) Net Unpledged Securities $1,621,317 Total Liquidity Sources $4,929,165 (1) Includes $159 million unrealized gains on securities and haircuts on certain thinly traded securities; excludes municipal qualified sc hoo l construction bonds, equity securities and other investments LIQUIDITY POSITION & SOURCES (unaudited)

5 $54.2 $57.5 $55.4 $55.4 $57.3 $1.03 $1.10 $1.06 $1.05 $1.08 $1.00 $1.02 $1.04 $1.06 $1.08 $1.10 $1.12 $45 $47 $49 $51 $53 $55 $57 $59 Q2 2019 Q3 2019 Q4 2019 Q1 2020 Q2 2020 PTPP EPS PTPP Net Revenue, $ in Millions Adjusted pre-tax, pre-provision net revenue Adjusted PTPP EPS SOLID EARNINGS TREND (unaudited) The Company believes that adjusted pre - tax, pre - provision (“PTPP”) net revenue is a valuable metric for measuring relative performance, especially during times of increased provision for credit losses. The Company’s second quarter 2020 adjusted PTPP net revenue per share was up $0.05 or 4.9% over the second quarter of 2019. Note: Adjusted pre - tax, pre - provision (“PTPP”) net revenue is a non - GAAP measure. Please see the Appendix for details.
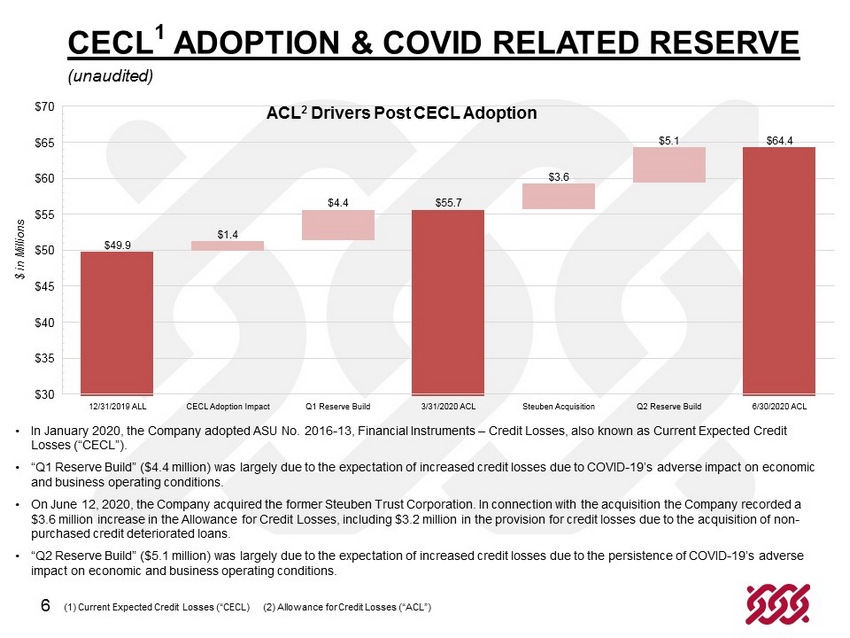
6 CECL 1 ADOPTION & COVID RELATED RESERVE (unaudited) • In January 2020, the Company adopted ASU No. 2016 - 13, Financial Instruments – Credit Losses, also known as Current Expected Credit Losses (“CECL ”). • “Q1 Reserve Build” ($4.4 million) was largely due to the expectation of increased credit losses due to COVID - 19’s adverse impact on economic and business operating conditions. • On June 12, 2020, the Company acquired the former Steuben Trust Corporation. In connection with the acquisition the Company r eco rded a $3.6 million increase in the Allowance for Credit Losses, including $3.2 million in the provision for credit losses due to th e a cquisition of non - purchased credit deteriorated loans. • “Q2 Reserve Build” ($5.1 million) was largely due to the expectation of increased credit losses due to the persistence of COV ID - 19’s adverse impact on economic and business operating conditions. (1) Current Expected Credit Losses (“CECL) (2) Allowance for Credit Losses (“ACL”) ACL 2 Drivers Post CECL Adoption
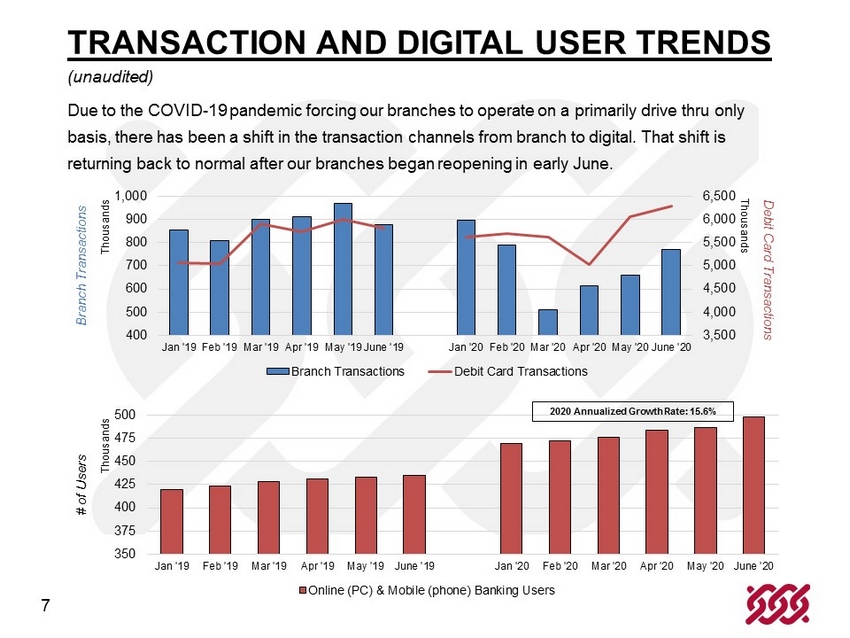
7 350 375 400 425 450 475 500 Jan '19 Feb '19 Mar '19 Apr '19 May '19 June '19 Jan '20 Feb '20 Mar '20 Apr '20 May '20 June '20 # of Users Thousands Online (PC) & Mobile (phone) Banking Users TRANSACTION AND DIGITAL USER TRENDS (unaudited) Due to the COVID - 19 pandemic forcing our branches to operate on a primarily drive thru only basis, there has been a shift in the transaction channels from branch to digital. That shift is returning back to normal after our branches began reopening in early June. 3,500 4,000 4,500 5,000 5,500 6,000 6,500 400 500 600 700 800 900 1,000 Jan '19 Feb '19 Mar '19 Apr '19 May '19 June '19 Jan '20 Feb '20 Mar '20 Apr '20 May '20 June '20 Debit Card Transactions Thousands Branch Transactions Thousands Branch Transactions Debit Card Transactions 2020 Annualized Growth Rate: 15.6%
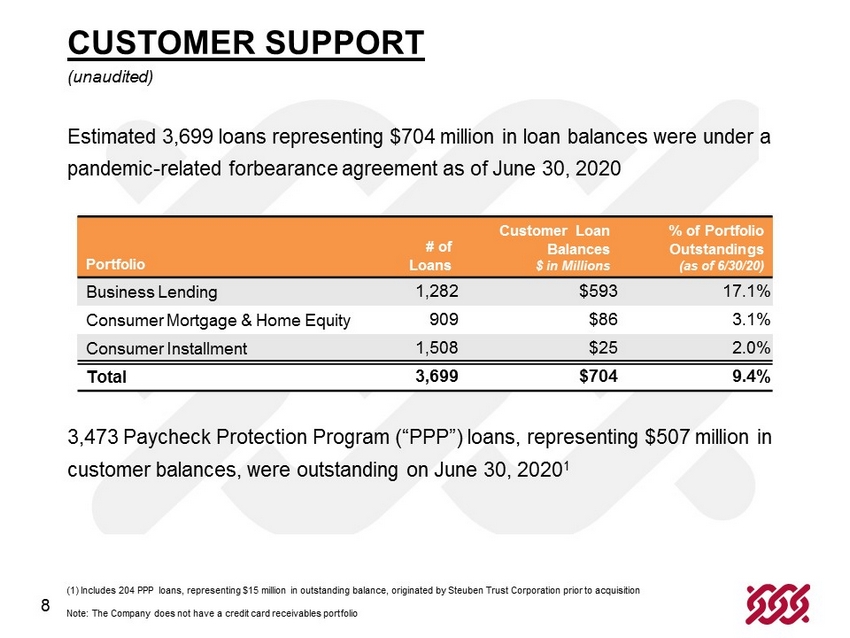
8 Estimated 3,699 loans representing $704 million in loan balances were under a pandemic - related forbearance agreement as of June 30, 2020 3,473 Paycheck Protection Program (“PPP”) loans, representing $507 million in customer balances, were outstanding on June 30, 2020 1 Portfolio # of Loans Customer Loan Balances $ in Millions % of P ortfolio Outstandings (as of 6/30/20) Business Lending 1,282 $593 17.1% Consumer Mortgage & Home Equity 909 $86 3.1% Consumer Installment 1,508 $25 2.0% Total 3,699 $704 9.4% (1) Includes 204 PPP loans, representing $15 million in outstanding balance, originated by Steuben Trust Corporation prior to ac quisition Note: The Company does not have a credit card receivables portfolio CUSTOMER SUPPORT (unaudited)
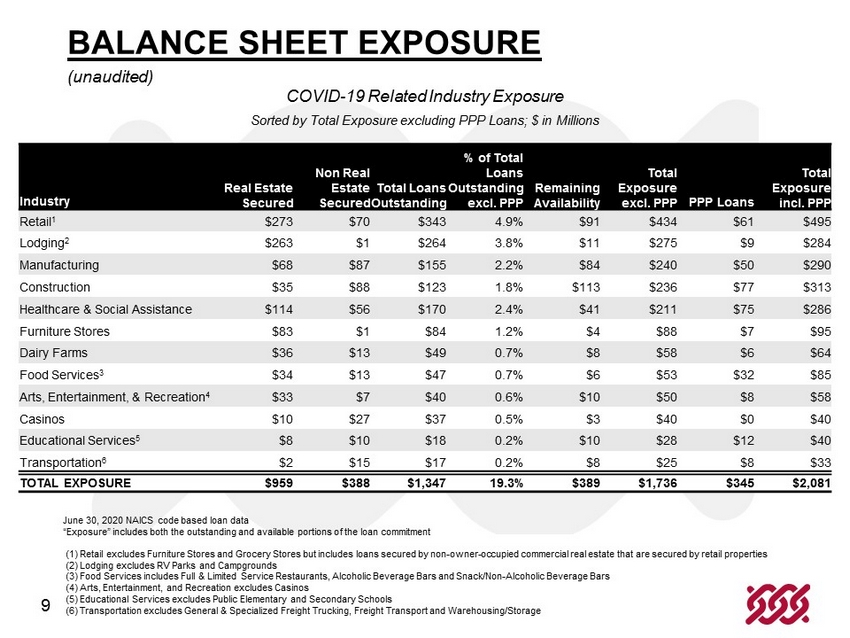
9 COVID - 19 Related Industry Exposure Sorted by Total Exposure excluding PPP Loans; $ in Millions June 30, 2020 NAICS code based loan data “Exposure” includes both the outstanding and available portions of the loan commitment (1) Retail excludes Furniture Stores and Grocery Stores but includes loans secured by non - owner - occupied commercial real estate that are secured by retail properties (2) Lodging excludes RV Parks and Campgrounds (3) Food Services includes Full & Limited Service Restaurants, Alcoholic Beverage Bars and Snack/Non - Alcoholic Beverage Bars (4) Arts, Entertainment, and Recreation excludes Casinos (5) Educational Services excludes Public Elementary and Secondary Schools (6) Transportation excludes General & Specialized Freight Trucking, Freight Transport and Warehousing/Storage Industry Real Estate Secured Non Real Estate Secured Total Loans Outstanding % of Total Loans Outstanding excl. PPP Remaining Availability Total Exposure excl. PPP PPP Loans Total Exposure incl. PPP Retail 1 $273 $70 $343 4.9% $91 $434 $61 $495 Lodging 2 $263 $1 $ 264 3.8% $11 $275 $9 $284 Manufacturing $68 $87 $ 155 2.2% $84 $240 $50 $290 Construction $35 $88 $123 1.8% $113 $236 $77 $313 Healthcare & Social Assistance $ 114 $56 $ 170 2.4% $41 $211 $75 $286 Furniture Stores $83 $1 $84 1.2% $4 $88 $7 $95 Dairy Farms $36 $13 $49 0.7% $8 $58 $6 $64 Food Services 3 $34 $13 $ 47 0.7% $6 $53 $32 $85 Arts, Entertainment, & Recreation 4 $33 $7 $40 0.6% $10 $50 $8 $58 Casinos $10 $27 $ 37 0.5% $3 $40 $0 $40 Educational Services 5 $8 $10 $ 18 0.2% $10 $ 28 $12 $40 Transportation 6 $2 $15 $17 0.2% $8 $25 $8 $33 TOTAL EXPOSURE $ 959 $388 $1,347 19.3% $389 $1,736 $345 $2,081 BALANCE SHEET EXPOSURE (unaudited)

10 Non - Owner Occupied CRE 34% New & Used Car Dealers 17% Auto Parts & Accessories 8% RV, Boat & Other Recreational 5% Building Materials & Garden Supplies 15% Gasoline & Service Stations 6% Health & Personal Care Stores 4% Miscellaneous Retail 4% All Other Retail 7% Motor Vehicles & Parts Dealer 30% • The retail portfolio contains 1,019 loans representing a total exposure of $434.4 million • Average outstanding balance of $337 thousand and an average exposure of $426 thousand • 7 total loan relationships with a current exposure greater than $10 million • No single loan customer exposure greater than $15 million • $34.4 million in vehicle floor plan loan exposure, $14.3 million outstanding and $20.1 million available • Approximately 33% of the retail portfolio balance had a forbearance agreement in place on June 30 th RETAIL PORTFOLIO (unaudited) Sector # of Loans Outstandin g Balance Remaining Availability Total Exposure Non - Owner Occupied CRE 119 $146.4 $0 $146.4 Motor Vehicle Parts & Dealers 233 $91.1 $39.3 $130.4 Building & Garden Supplies 166 $43.4 $21.4 $64.8 Gasoline & Service Stations 67 $25.8 $2.5 $28.3 Health & Personal Care 33 $1.4 $17.0 $18.4 Miscellaneous Retail 190 $9.4 $6.2 $15.6 All Other Retail 211 $25.5 $5.0 $30.5 Total Retail Sector 1,019 $343.0 $91.4 $434.4 June 30, 2020 NAICS code based loan data; excludes Paycheck Protection Program (“PPP”) loans “Exposure” includes both the outstanding and available portions of the loan commitment Retail excludes Furniture Stores and Grocery Stores but includes loans secured by non - owner - occupied commercial real estate that are secured by retail properties Retail Portfolio $ in Millions
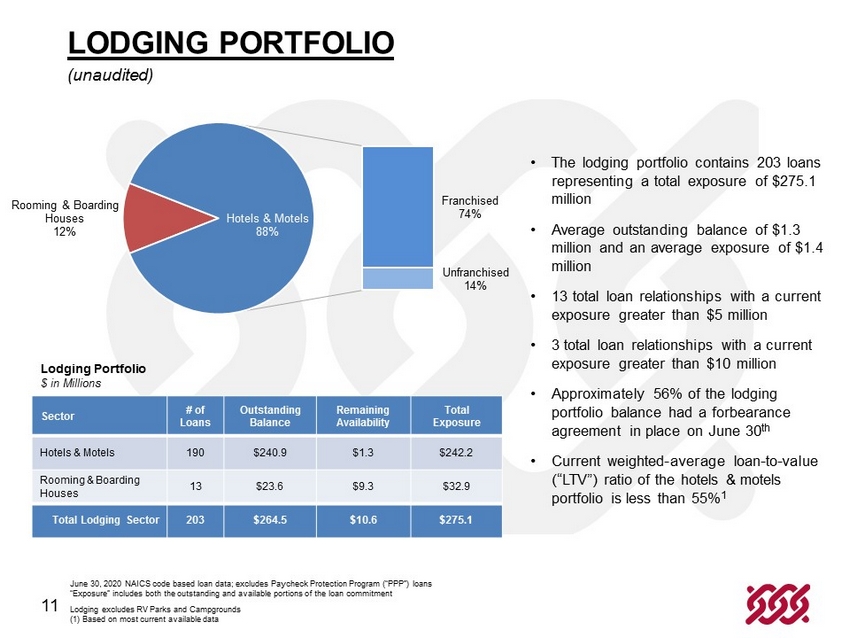
11 Franchised 74% Unfranchised 14% Rooming & Boarding Houses 12% Hotels & Motels 88% • The lodging portfolio contains 203 loans representing a total exposure of $275.1 million • Average outstanding balance of $1.3 million and an average exposure of $1.4 million • 13 total loan relationships with a current exposure greater than $5 million • 3 total loan relationships with a current exposure greater than $10 million • Approximately 56% of the lodging portfolio balance had a forbearance agreement in place on June 30 th • Current weighted - average loan - to - value (“LTV”) ratio of the hotels & motels portfolio is less than 55% 1 LODGING PORTFOLIO (unaudited) Sector # of Loans Outstandin g Balance Remaining Availability Total Exposure Hotels & Motels 190 $240.9 $1.3 $242.2 Rooming & Boarding Houses 13 $23.6 $9.3 $32.9 Total Lodging Sector 203 $264.5 $10.6 $275.1 June 30, 2020 NAICS code based loan data; excludes Paycheck Protection Program (“PPP”) loans “Exposure” includes both the outstanding and available portions of the loan commitment Lodging excludes RV Parks and Campgrounds (1) Based on most current available data Lodging Portfolio $ in Millions
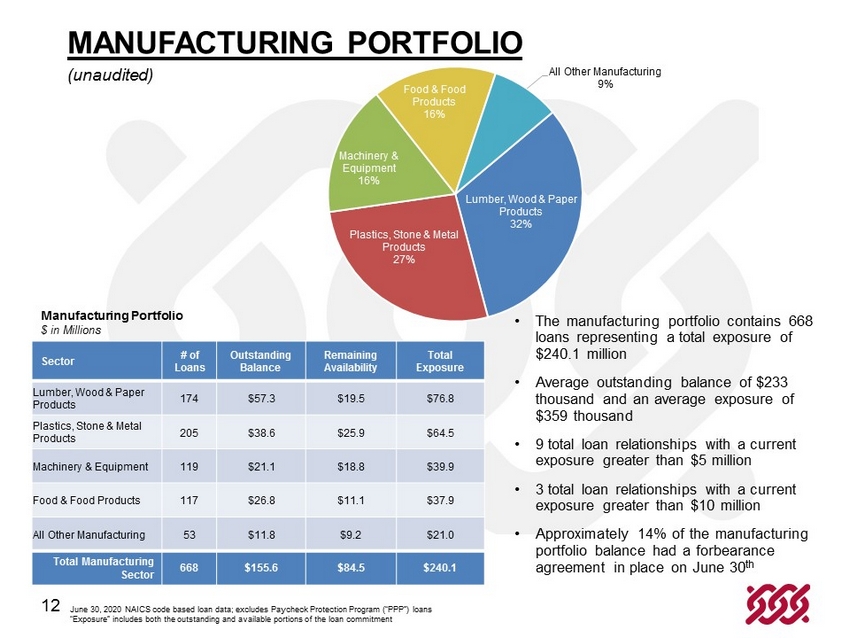
12 Lumber, Wood & Paper Products 32% Plastics, Stone & Metal Products 27% Machinery & Equipment 16% Food & Food Products 16% All Other Manufacturing 9% • The manufacturing portfolio contains 668 loans representing a total exposure of $240.1 million • Average outstanding balance of $233 thousand and an average exposure of $359 thousand • 9 total loan relationships with a current exposure greater than $5 million • 3 total loan relationships with a current exposure greater than $10 million • Approximately 14% of the manufacturing portfolio balance had a forbearance agreement in place on June 30 th MANUFACTURING PORTFOLIO (unaudited) Sector # of Loans Outstandin g Balance Remaining Availability Total Exposure Lumber, Wood & Paper Products 174 $57.3 $19.5 $76.8 Plastics, Stone & Metal Products 205 $38.6 $25.9 $64.5 Machinery & Equipment 119 $21.1 $18.8 $39.9 Food & Food Products 117 $26.8 $11.1 $37.9 All Other Manufacturing 53 $11.8 $9.2 $21.0 Total Manufacturing Sector 668 $155.6 $84.5 $240.1 June 30, 2020 NAICS code based loan data; excludes Paycheck Protection Program (“PPP”) loans “Exposure” includes both the outstanding and available portions of the loan commitment Manufacturing Portfolio $ in Millions
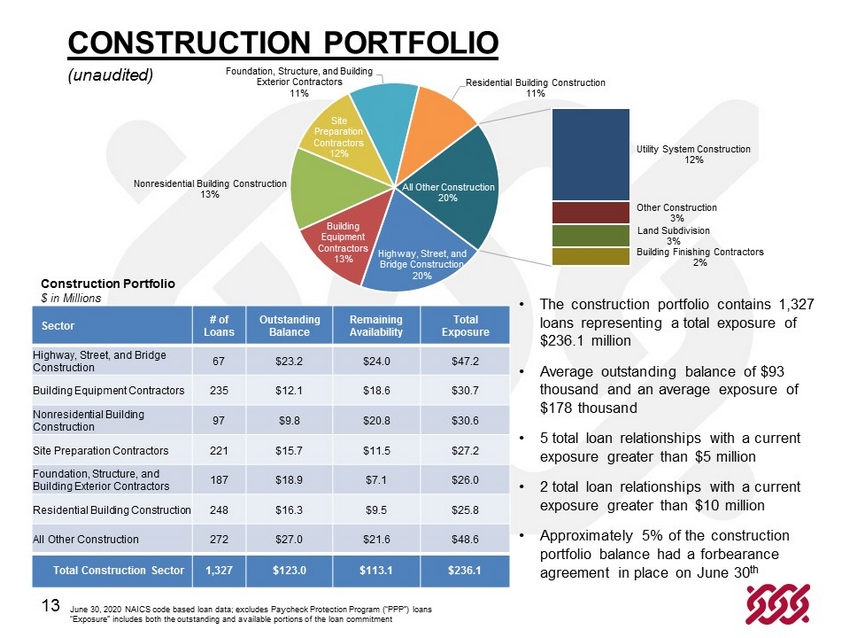
13 Highway, Street, and Bridge Construction 20% Building Equipment Contractors 13% Nonresidential Building Construction 13% Site Preparation Contractors 12% Foundation, Structure, and Building Exterior Contractors 11% Residential Building Construction 11% Utility System Construction 12% Other Construction 3% Land Subdivision 3% Building Finishing Contractors 2% All Other Construction 20% • The construction portfolio contains 1,327 loans representing a total exposure of $236.1 million • Average outstanding balance of $93 thousand and an average exposure of $178 thousand • 5 total loan relationships with a current exposure greater than $ 5 million • 2 total loan relationships with a current exposure greater than $10 million • Approximately 5 % of the construction portfolio balance had a forbearance agreement in place on June 30 th CONSTRUCTION PORTFOLIO (unaudited) Sector # of Loans Outstandin g Balance Remaining Availability Total Exposure Highway, Street, and Bridge Construction 67 $23.2 $24.0 $47.2 Building Equipment Contractors 235 $12.1 $18.6 $30.7 Nonresidential Building Construction 97 $9.8 $20.8 $30.6 Site Preparation Contractors 221 $15.7 $11.5 $27.2 Foundation, Structure, and Building Exterior Contractors 187 $18.9 $7.1 $26.0 Residential Building Construction 248 $16.3 $9.5 $25.8 All Other Construction 272 $27.0 $21.6 $48.6 Total Construction Sector 1,327 $123.0 $113.1 $236.1 June 30, 2020 NAICS code based loan data; excludes Paycheck Protection Program (“PPP”) loans “Exposure” includes both the outstanding and available portions of the loan commitment Construction Portfolio $ in Millions
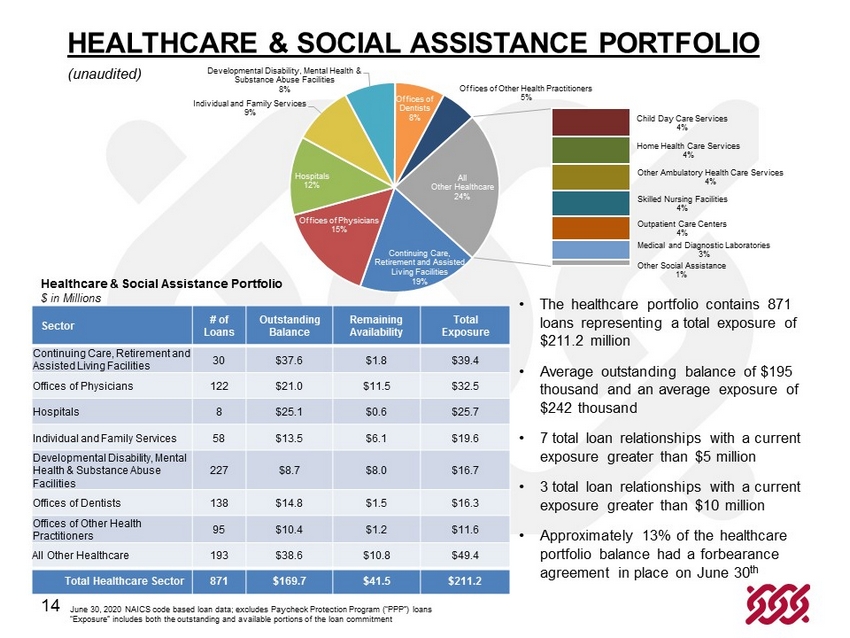
14 Continuing Care, Retirement and Assisted Living Facilities 19% Offices of Physicians 15% Hospitals 12% Individual and Family Services 9% Developmental Disability, Mental Health & Substance Abuse Facilities 8% Offices of Dentists 8% Offices of Other Health Practitioners 5% Child Day Care Services 4% Home Health Care Services 4% Other Ambulatory Health Care Services 4% Skilled Nursing Facilities 4% Outpatient Care Centers 4% Medical and Diagnostic Laboratories 3% Other Social Assistance 1% All Other Healthcare 24% • The healthcare portfolio contains 871 loans representing a total exposure of $211.2 million • Average outstanding balance of $195 thousand and an average exposure of $242 thousand • 7 total loan relationships with a current exposure greater than $ 5 million • 3 total loan relationships with a current exposure greater than $10 million • Approximately 13% of the healthcare portfolio balance had a forbearance agreement in place on June 30 th HEALTHCARE & SOCIAL ASSISTANCE PORTFOLIO (unaudited) Sector # of Loans Outstandin g Balance Remaining Availability Total Exposure Continuing Care, Retirement and Assisted Living Facilities 30 $37.6 $1.8 $39.4 Offices of Physicians 122 $21.0 $11.5 $32.5 Hospitals 8 $25.1 $0.6 $25.7 Individual and Family Services 58 $13.5 $6.1 $19.6 Developmental Disability, Mental Health & Substance Abuse Facilities 227 $8.7 $8.0 $16.7 Offices of Dentists 138 $14.8 $1.5 $16.3 Offices of Other Health Practitioners 95 $10.4 $1.2 $11.6 All Other Healthcare 193 $38.6 $10.8 $49.4 Total Healthcare Sector 871 $169.7 $41.5 $211.2 June 30, 2020 NAICS code based loan data; excludes Paycheck Protection Program (“PPP”) loans “Exposure” includes both the outstanding and available portions of the loan commitment Healthcare & Social Assistance Portfolio $ in Millions
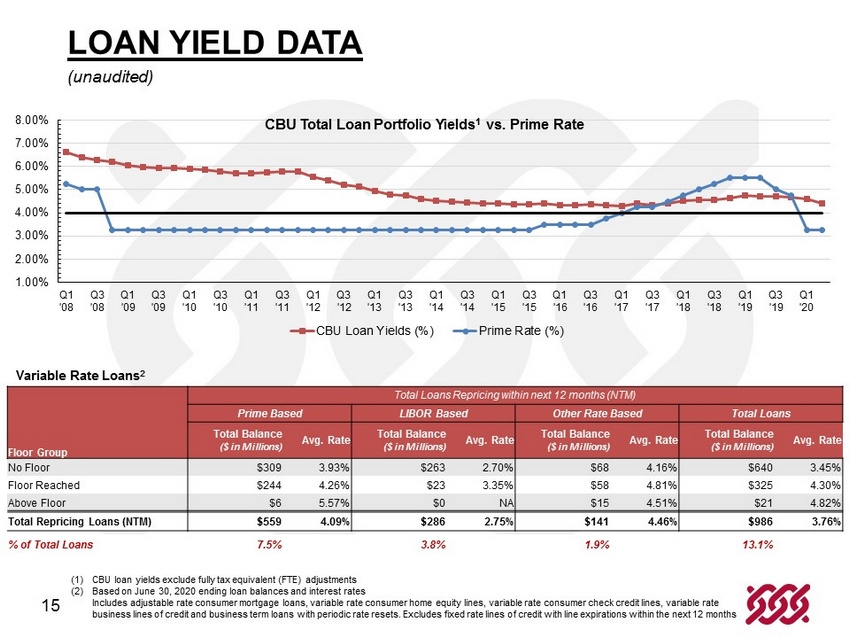
15 (1) CBU loan yields exclude fully tax equivalent (FTE) adjustments (2) Based on June 30, 2020 ending loan balances and interest rates Includes adjustable rate consumer mortgage loans, variable rate consumer home equity lines, variable rate consumer check cred it lines, variable rate business lines of credit and business term loans with periodic rate resets. Excludes fixed rate lines of credit with line exp ira tions within the next 12 months 1.00% 2.00% 3.00% 4.00% 5.00% 6.00% 7.00% 8.00% Q1 '08 Q3 '08 Q1 '09 Q3 '09 Q1 '10 Q3 '10 Q1 '11 Q3 '11 Q1 '12 Q3 '12 Q1 '13 Q3 '13 Q1 '14 Q3 '14 Q1 '15 Q3 '15 Q1 '16 Q3 '16 Q1 '17 Q3 '17 Q1 '18 Q3 '18 Q1 '19 Q3 '19 Q1 '20 CBU Total Loan Portfolio Yields 1 vs. Prime Rate CBU Loan Yields (%) Prime Rate (%) Variable Rate Loans 2 Total Loans Repricing within next 12 months (NTM) Prime Based LIBOR Based Other Rate Based Total Loans Floor Group Total Balance ($ in Millions ) Avg. Rate Total Balance ($ in Millions ) Avg. Rate Total Balance ($ in Millions ) Avg. Rate Total Balance ($ in Millions ) Avg. Rate No Floor $309 3.93% $263 2.70% $ 68 4.16% $ 640 3.45% Floor Reached $244 4.26% $23 3.35% $58 4.81% $ 325 4.30% Above Floor $6 5.57% $0 NA $15 4.51% $21 4.82% Total Repricing Loans (NTM) $ 559 4.09% $286 2.75% $ 141 4.46% $ 986 3.76% % of Total Loans 7.5% 3.8% 1.9% 13.1% LOAN YIELD DATA (unaudited)
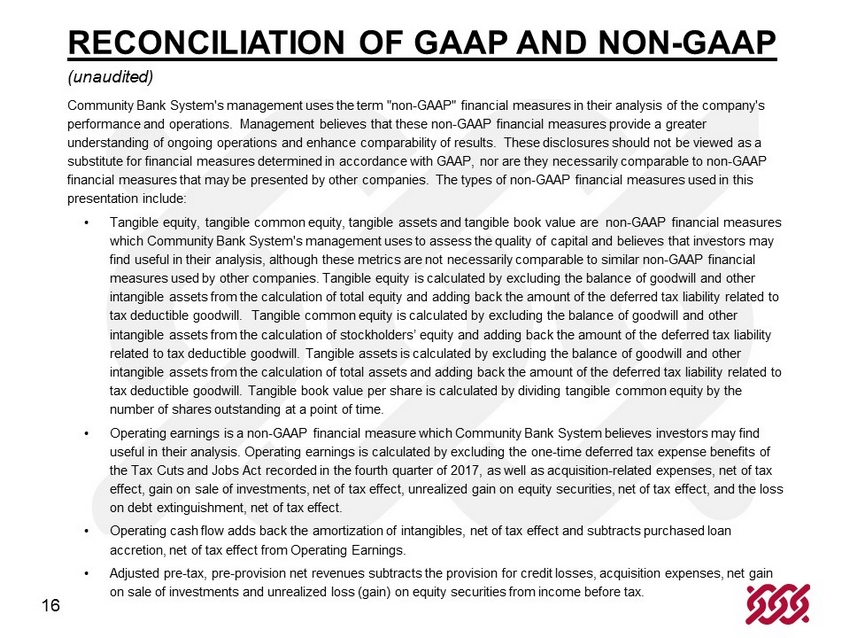
16 Community Bank System's management uses the term "non - GAAP" financial measures in their analysis of the company's performance and operations. Management believes that these non - GAAP financial measures provide a greater understanding of ongoing operations and enhance comparability of results. These disclosures should not be viewed as a substitute for financial measures determined in accordance with GAAP, nor are they necessarily comparable to non - GAAP financial measures that may be presented by other companies. The types of non - GAAP financial measures used in this presentation include : • Tangible equity, tangible common equity, tangible assets and tangible book value are non - GAAP financial measures which Community Bank System's management uses to assess the quality of capital and believes that investors may find useful in their analysis, although these metrics are not necessarily comparable to similar non - GAAP financial measures used by other companies. Tangible equity is calculated by excluding the balance of goodwill and other intangible assets from the calculation of total equity and adding back the amount of the deferred tax liability related to tax deductible goodwill. Tangible common equity is calculated by excluding the balance of goodwill and other intangible assets from the calculation of stockholders’ equity and adding back the amount of the deferred tax liability related to tax deductible goodwill. Tangible assets is calculated by excluding the balance of goodwill and other intangible assets from the calculation of total assets and adding back the amount of the deferred tax liability related to tax deductible goodwill. Tangible book value per share is calculated by dividing tangible common equity by the number of shares outstanding at a point of time. • Operating earnings is a non - GAAP financial measure which Community Bank System believes investors may find useful in their analysis. Operating earnings is calculated by excluding the one - time deferred tax expense benefits of the Tax Cuts and Jobs Act recorded in the fourth quarter of 2017, as well as acquisition - related expenses, net of tax effect, gain on sale of investments, net of tax effect, unrealized gain on equity securities, net of tax effect, and the loss on debt extinguishment, net of tax effect. • Operating cash flow adds back the amortization of intangibles, net of tax effect and subtracts purchased loan accretion , net of tax effect from Operating Earnings . • Adjusted pre - tax, pre - provision net revenues subtracts the provision for credit losses, acquisition expenses, net gain on sale of investments and unrealized loss (gain) on equity securities from income before tax. RECONCILIATION OF GAAP AND NON - GAAP (unaudited)
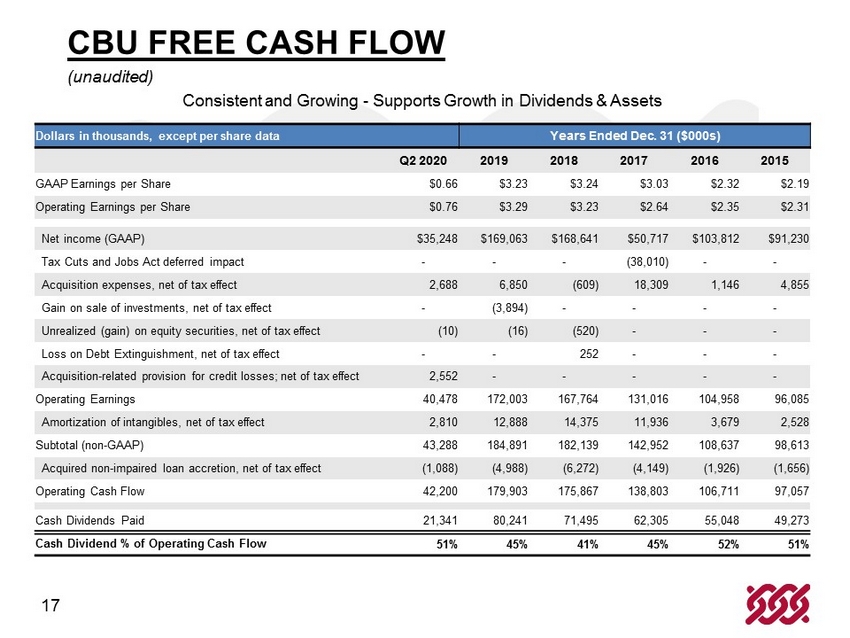
17 Consistent and Growing - Supports Growth in Dividends & Assets Dollars in thousands, except per share data Years Ended Dec. 31 ($000s) Q2 2020 2019 2018 2017 2016 2015 GAAP Earnings per Share $0.66 $3.23 $3.24 $3.03 $2.32 $2.19 Operating Earning s per Share $0.76 $3.29 $3.23 $2.64 $2.35 $2.31 Net income (GAAP) $35,248 $169,063 $168,641 $50,717 $103,812 $91,230 Tax Cuts and Jobs Act deferred impact - - - (38,010) - - Acquisition expenses, net of tax effect 2,688 6,850 (609) 18,309 1,146 4,855 Gain on sale of investments, net of tax effect - (3,894) - - - - Unrealized (gain) on equity securities, net of tax effect (10) (16) (520) - - - Loss on Debt Extinguishment, net of tax effect - - 252 - - - Acquisition - related provision for credit losses; net of tax effect 2,552 - - - - - Operating Earnings 40,478 172,003 167,764 131,016 104,958 96,085 Amortization of intangibles, net of tax effect 2,810 12,888 14,375 11,936 3,679 2,528 Subtotal (non - GAAP) 43,288 184,891 182,139 142,952 108,637 98,613 Acquired non - impaired loan accretion, net of tax effect (1,088) (4,988) (6,272) (4,149) (1,926) (1,656) Operating Cash Flow 42,200 179,903 175,867 138,803 106,711 97,057 Cash Dividends Paid 21,341 80,241 71,495 62,305 55,048 49,273 Cash Dividend % of Operating Cash Flow 51% 45% 41% 45% 52% 51% CBU FREE CASH FLOW (unaudited)
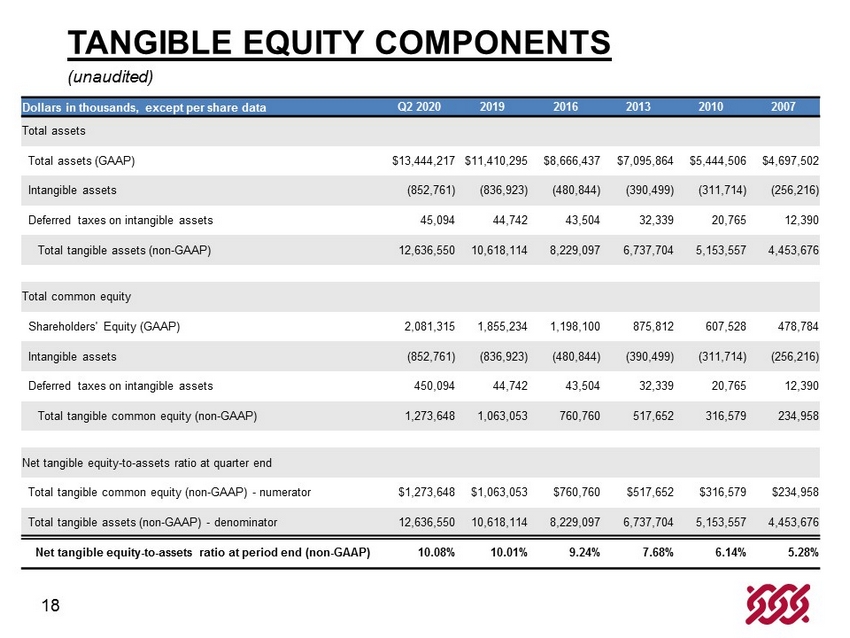
18 Dollars in thousands, except per share data Q2 2020 2019 2016 2013 2010 2007 Total assets Total assets (GAAP) $ 13,444,217 $11,410,295 $8,666,437 $7,095,864 $5,444,506 $4,697,502 Intangible assets ( 852,761) (836,923) (480,844) (390,499) (311,714) (256,216) Deferred taxes on intangible assets 45,094 44,742 43,504 32,339 20,765 12,390 Total tangible assets (non - GAAP) 12,636,550 10,618,114 8,229,097 6,737,704 5,153,557 4,453,676 Total common equity Shareholders' Equity (GAAP) 2,081,315 1,855,234 1,198,100 875,812 607,528 478,784 Intangible assets (852,761) (836,923) (480,844) (390,499) (311,714) (256,216) Deferred taxes on intangible assets 450,094 44,742 43,504 32,339 20,765 12,390 Total tangible common equity (non - GAAP) 1,273,648 1,063,053 760,760 517,652 316,579 234,958 Net tangible equity - to - assets ratio at quarter end Total tangible common equity (non - GAAP) - numerator $ 1,273,648 $1,063,053 $760,760 $517,652 $316,579 $234,958 Total tangible assets (non - GAAP) - denominator 12,636,550 10,618,114 8,229,097 6,737,704 5,153,557 4,453,676 Net tangible equity - to - assets ratio at period end (non - GAAP) 10.08 % 10.01% 9.24% 7.68% 6.14% 5.28% TANGIBLE EQUITY COMPONENTS (unaudited)
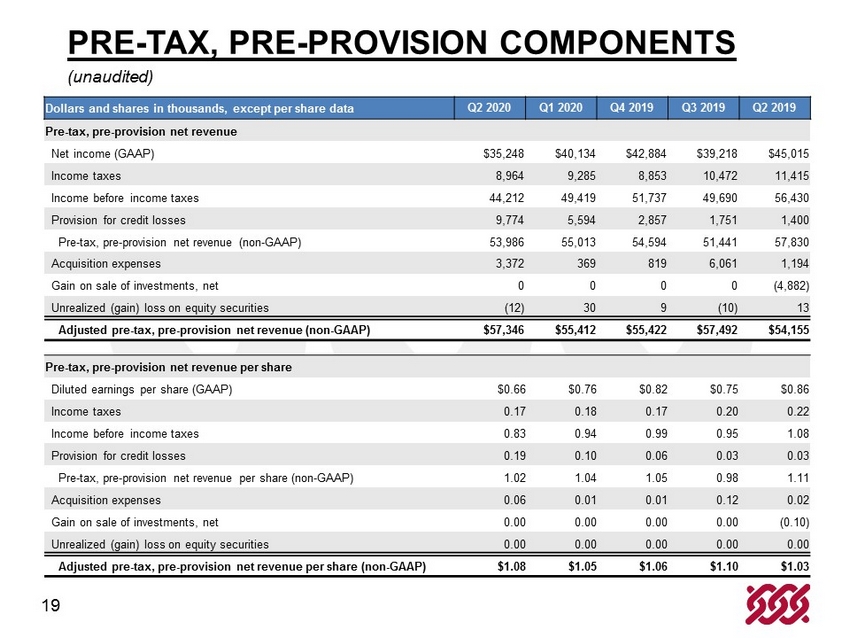
19 Dollars and shares in thousands, except per share data Q2 2020 Q1 2020 Q4 2019 Q3 2019 Q2 2019 Pre - tax, pre - provision net revenue Net income (GAAP) $35,248 $40,134 $42,884 $39,218 $45,015 Income taxes 8,964 9,285 8,853 10,472 11,415 Income before income taxes 44,212 49,419 51,737 49,690 56,430 Provision for credit losses 9,774 5,594 2,857 1,751 1,400 Pre - tax, pre - provision net revenue (non - GAAP) 53,986 55,013 54,594 51,441 57,830 Acquisition expenses 3,372 369 819 6,061 1,194 Gain on sale of investments, net 0 0 0 0 (4,882) Unrealized (gain) loss on equity securities (12) 30 9 (10) 13 Adjusted pre - tax, pre - provision net revenue (non - GAAP) $57,346 $55,412 $55,422 $57,492 $54,155 Pre - tax, pre - provision net revenue per share Diluted earnings per share (GAAP) $0.66 $0.76 $0.82 $0.75 $0.86 Income taxes 0.17 0.18 0.17 0.20 0.22 Income before income taxes 0.83 0.94 0.99 0.95 1.08 Provision for credit losses 0.19 0.10 0.06 0.03 0.03 Pre - tax, pre - provision net revenue per share (non - GAAP) 1.02 1.04 1.05 0.98 1.11 Acquisition expenses 0.06 0.01 0.01 0.12 0.02 Gain on sale of investments, net 0.00 0.00 0.00 0.00 (0.10) Unrealized (gain) loss on equity securities 0.00 0.00 0.00 0.00 0.00 Adjusted pre - tax, pre - provision net revenue per share (non - GAAP) $1.08 $1.05 $1.06 $1.10 $1.03 PRE - TAX, PRE - PROVISION COMPONENTS (unaudited)

Investor Relations Contact Mr. Joseph E. Sutaris EVP & Chief Financial Officer Joseph.Sutaris@cbna.com (315) 445 - 7396