Attached files
| file | filename |
|---|---|
| 8-K - FORM 8-K - FVCBankcorp, Inc. | tm2025535d1_8k.htm |
Exhibit 99.1
PRESS RELEASE
For further information, contact:
David W. Pijor, Chairman and Chief Executive Officer
Phone: (703) 436-3802
Email: dpijor@fvcbank.com
Patricia A. Ferrick, President
Phone: (703) 436-3822
Email: pferrick@fvcbank.com
FOR IMMEDIATE RELEASE – July 23, 2020
FVCBankcorp, Inc. Announces
Second Quarter 2020 Earnings
Fairfax, VA-FVCBankcorp, Inc. (NASDAQ:FVCB) (the “Company”) today reported second quarter 2020 net income of $2.9 million, or $0.21 diluted earnings per share, compared to $4.1 million, or $0.28 diluted earnings per share, for the quarter ended June 30, 2019, the decrease in net income primarily a result of increased provision for loan losses totaling $1.8 million recorded during the second quarter of 2020 and one-time branch closure costs of $676 thousand. Net revenues, which includes net interest income plus noninterest income, for the three months ended June 30, 2020 were $13.4 million, an increase of $472 thousand, from $12.9 million for the year ago quarter ended June 30, 2019. For the six months ended June 30, 2020, the Company reported net income of $6.6 million, or $0.46 diluted earnings per share, compared to $8.0 million or $0.54 diluted earnings per share, for the same period of 2019, the decrease in net income attributable to an increase in loan loss provisioning of $2.8 million year-over-year and $676 thousand in one-time branch closure costs. Net revenues for the six months ended June 30, 2020 were $26.3 million, an increase of $875 thousand, from $25.4 million for the six months ended June 30, 2019.
Certain non-operating items impacted the financial results for the quarter and year to date periods reported above. During the second quarter of 2020, the Company decided to close two branch office locations. Because of the COVID-19 pandemic, more clients have transitioned to the Company’s electronic banking products, reducing the need to have physical branch locations to serve its customers. The operating leases and leasehold improvements written off as a result of closing these locations totaled $676 thousand pre-tax ($534 thousand after tax). As the branches will not close until early fourth quarter 2020, the Company does not anticipate cost savings until that time. Annual cost savings for the closure of these locations related to occupancy expense is expected to be approximately $350 thousand. Other savings of approximately $250 thousand include salaries and benefits expense as the employees for each of these locations will be filling current vacant positions within the Company, reducing the need to hire additional personnel. The Company is proactively working with those customers impacted by these branch closures to minimize their business interruption.
The Company believes the reporting of non-generally accepted accounting principles (“non-GAAP”) earnings to exclude branch closing impairment charges, gains on sales of securities, and merger and acquisition expenses are more reflective of the Company’s operating performance (“Operating Earnings”). Operating Earnings for the three months ended June 30, 2020 were $3.4 million, or $0.25 diluted earnings per share, compared to $4.1 million, or $0.28 diluted earnings per share for the three months ended June 30, 2019. Operating Earnings for the six months ended June 30, 2020 were $7.1 million, or $0.50 diluted earnings per share, compared to $8.1 million, or $0.55 diluted earnings per share for the six months ended June 30, 2019. As mentioned previously, both the three and six month periods ended June 30, 2020 have been impacted by elevated provision for loan losses expense.
Second Quarter Selected Highlights
| · | Increased Pre-Tax Pre-Provision Income. For the three months ended June 30, 2020 and 2019, pre-tax pre-provision income was $6.1 million and $5.6 million, respectively, an increase of $426 thousand or 7.6%. On a linked quarter basis, pre-tax pre-provision income was $5.6 million for the three months ended March 31, 2020. Pre-tax pre-provision return on average assets for the three months ended June 30, 2020 and 2019 were 1.41% and 1.56%, respectively. For the six months ended June 30, 2020 and 2019, pre-tax pre-provision income were $11.7 million and $11.2 million, respectively, an increase of $429 thousand. A reconciliation of pre-tax pre-provision, a non-GAAP financial measure, can be found in the tables below. |
| · | Reduced Levels of Past Due and Nonperforming loans. Loans past due 30 days or more totaled $3.3 million at June 30, 2020, of which $1.4 million are over 90 days past due. Past due loans at June 30, 2020 reflect a decrease of $11.4 million from $14.7 million at December 31, 2019 and a decrease of $13.1 million from $16.3 million at March 31, 2020. Nonperforming loans and loans past due 90 days or more and still accruing were $8.5 million, or 0.48% of total assets, at June 30, 2020, compared to $10.7 million, or 0.70% of total assets at December 31, 2019, and $8.9 million, or 0.56% of total assets, at March 31, 2020. |
| · | Responsiveness to Customers During COVID-19 Pandemic. Initially, total loans with payment deferrals comprising approximately 24.4% of the total loan portfolio, or $360.2 million, were made as a result of the Company’s goal to help customers with COVID-19 related financial issues. At July 20, 2020, approximately 18.5% of the total loan portfolio, or $273.6 million, continue under COVID-19 deferrals. For 90-day payment deferrals that have matured to date, approximately 9% have been approved for a second 90-day payment deferral. In addition, the Company originated 755 loans totaling $169.4 million in the U.S. Small Business Administration’s (“SBA”) Paycheck Protection Program (“PPP”) net of deferred fees and costs during the second quarter of 2020. Of the 755 PPP loans originated, 226 loans were originated to new customers of the Company’s subsidiary bank, FVCBank, and represent future deposit and loan growth opportunities. The Company has net deferred fees of $4.6 million related to PPP loans which are being recognized in interest income over the remaining lives of the PPP loans, or sooner, upon PPP loan forgiveness or repayment. |
| · | Strong Core Deposit Growth. Core deposits, which excludes wholesale deposits, increased $233.3 million, to $1.42 billion at June 30, 2020, an increase of 19.7%, from December 31, 2019. Noninterest-bearing deposits represent 31.2% of the core deposit base at June 30, 2020. |
| · | Increased Net Interest Income. Net interest income increased $324 thousand to $12.7 million for the second quarter of 2020, compared to $12.4 million for the same 2019 period. Compared to the first quarter of 2020, net interest income increased $484 thousand. Net interest margin decreased 43 basis points to 3.16% for the quarter ended June 30, 2020 compared to 3.59% for the quarter ended June 30, 2019. Excluding the impact of PPP loans, which was 4 basis points, and excluding excess liquidity, which was 11 basis points, during the second quarter of 2020, net interest margin for the three months ended June 30, 2020 would have been 3.31%. |
| · | Increased Provision for Loan Losses. As a result of the current economic conditions related to COVID-19, the Company recorded a provision for loan losses of $1.8 million during the second quarter of 2020, compared to $1.1 million at March 31, 2020, increasing the allowance for loan losses to total loans, excluding PPP loans, 11 basis points to 0.99% at June 30, 2020. Compared to the year ago quarter, provision for loan losses increased $1.2 million. The Company increased reserves for loans identified as pandemic impacted and payment deferred loans and separately and appropriately reserved for possible future losses on the overall portfolio that may be incurred based on qualitative economic data. |
| · | Well-Capitalized Bank. The capital ratios at FVCbank remain at a well-capitalized level at June 30, 2020 with a leverage ratio of 11.05%. |
| · | Improved Efficiency Ratio. Efficiency ratio, excluding the one-time branch closure charges mentioned above and gains on sales of securities recorded during the first quarter of 2020, for the three months ended June 30, 2020 was 54.7%, an improvement from 56.3% for the quarter ended March 31, 2020. |
“Our focus this past quarter has been to help our existing and new customers’ businesses persist during the COVID-19 pandemic while managing our credit risk exposure. We were flexible with customers with our initial loan payment deferral programs. We are seeing customers resume contractual payments and believe this will continue as businesses open up and government stimulus such as PPP provides support to their businesses. We believe we have appropriately reserved for potential losses in our loan portfolio and have a capital position that will continue to support the Bank as we weather this storm. I want to thank our employees who have worked under some of the most difficult circumstances, helping our customers through such unprecedented times and assisting new customers in our community who needed bank support,” stated David W. Pijor, Chairman and CEO.
COVID-19 Pandemic Impact to Loan Portfolio
As a result of the COVID-19 pandemic, the Company implemented loan payment deferral programs to allow customers who were required to close or reduce business operations to defer loan principal and interest payments primarily for 90 days. During the second quarter of 2020, the Company modified 277 loans for a total outstanding principal balance of $360.2 million, or 24.4% of the total loan portfolio. At July 20, 2020, loans modified reduced to 218 loans for a total outstanding principal balance of $273.6 million, or 18.5% of the total loan portfolio. For those commercial real estate loans with approved payment deferrals, these loans are collateralized and well secured. The table below shows the number of loans modified and not modified and their respective outstanding loan balances by asset class, excluding PPP loans.
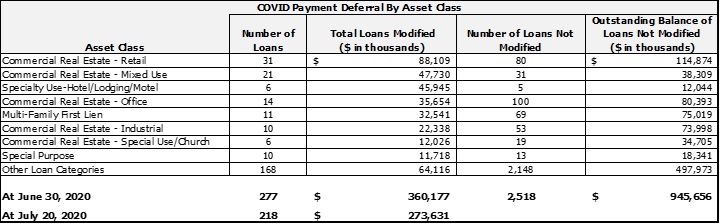
The Company is closely and proactively monitoring the effects of the pandemic on its loan and deposit customers and is focused on assessing risks within the loan portfolio and working with customers to minimize losses. The Company considers pandemic impacted loans to include commercial real estate loans to hotels, churches, and certain retail and special purpose asset classes. During its assessment of the allowance for loan losses, the Company addressed the credit risks associated with these pandemic impacted segments and those loans that have requested payment deferrals.
The Company believes that as a result of its conservative underwriting discipline at loan origination coupled with the active dialogue the Company has had with its borrowers, the Company has the ability and necessary flexibility to assist its customers through this pandemic.
Balance Sheet
Total assets increased to $1.78 billion at June 30, 2020 compared to $1.54 billion at December 31, 2019, an increase of $243.9 million, or 15.9%. Year-over-year, total assets increased $296.5 million, or 20.0% from $1.48 billion at June 30, 2019.
Loans receivable, net of deferred fees, totaled $1.48 billion at June 30, 2020, compared to $1.27 billion at December 31, 2019, an increase of $207.6 million, or 16.3%, and compared to $1.23 billion at June 30, 2019, a year-over-year increase of $243.7 million, or 19.8%. PPP loans originated and funded, net of fees, totaled $169.4 million during the quarter assisting both existing and new clients. During the second quarter of 2020, loan originations, excluding PPP loans, totaled approximately $82.5 million, of which $46.7 million funded during the quarter. While commercial & industrial loans decreased $9.0 million during the first six months of 2020, PPP loans to this segment totaled approximately $93.3 million. On April 1, 2020, the Company reclassified its consumer unsecured loans held for sale portfolio to held for investment at the lower of cost or market as the market for these types of loans receded due to current economic conditions. This portfolio totaled $8.8 million at June 30, 2020, compared to $11.2 million at December 31, 2019.
Investment securities decreased $19.5 million to $122.1 million at June 30, 2020, compared to $141.6 million at December 31, 2019. The Company sold $10.1 million in mortgage-backed securities available-for-sale, recording gains of $97 thousand during the first quarter of 2020. Year-over-year, investment securities decreased $14.2 million, or 10.4%, from $136.2 million at June 30, 2019.
Total deposits increased to $1.52 billion at June 30, 2020 compared to $1.29 billion at December 31, 2019, an increase of $233.3 million, or 18.2%. Year-over-year, total deposits increased $249.7 million, or 19.7%, from $1.27 billion at June 30, 2019. Core deposits, which represent total deposits less wholesale deposits, increased $233.3 million, or 19.7%, to $1.42 billion at June 30, 2020 compared to $1.19 billion at December 31, 2019, and increased $231.9 million, or 19.5% from $1.19 billion at June 30, 2019. The increase in core deposits reflects a combination of deposits from remaining PPP funds and new customer relationships as well as growth in existing customer accounts. Wholesale deposits totaled $100.0 million, or 6.6% of total deposits at June 30, 2020, a decrease of $24.5 million from March 31, 2020. Noninterest-bearing deposits increased $136.2 million, or 44.5%, to $442.4 million at June 30, 2020 from $306.2 million at December 31, 2019, and represented 29.1% of total deposits, or 31.2% of core deposits, at June 30, 2020.
Income Statement
Net income for the three months ended June 30, 2020 was $2.8 million, compared to $4.1 million for the same period of 2019, and $3.7 million for the quarter ended March 31, 2020. For the six months ended June 30, 2020, net income was $6.6 million, compared to $8.0 million for the same period of 2019. Both the three and six months’ periods of 2020 were impacted by increased provision for loan losses and the aforementioned branch closing impairment charges.
Net interest income totaled $12.7 million, an increase of $324 thousand, for the quarter ended June 30, 2020, compared to the year ago quarter, and increased by $484 thousand, or 4%, compared to the first quarter of 2020, a result of significant decreases in the cost of deposits. Interest expense on deposits decreased $1.0 million for the three months ended June 30, 2020 compared to the same period of 2019, and decreased $1.0 million compared to the three months ended March 31, 2020. The impact to interest income from the accretion of loan marks on acquired loans was $126 thousand and $352 thousand for the three months ended June 30, 2020 and 2019, respectively. In addition, net interest income for the three months ended June 30, 2020 benefited from PPP loan origination, which contributed $801 thousand to interest income. For the six months ended June 30, 2020 and 2019, net interest income was $24.9 million and $24.1 million, respectively, an increase of $771 thousand.
The Company’s net interest margin decreased 43 basis points to 3.16% for the quarter ended June 30, 2020 compared to 3.59% for the quarter ended June 30, 2019, impacted by the decreases in the targeted fed funds rate of 225 basis points over the past 12 months. On a linked quarter basis, net interest margin decreased 21 basis points from 3.37% for the three months ended March 31, 2020. The average yield for the loan portfolio for the second quarter of 2020 was 4.52% (excluding PPP loans) compared to 5.24% for the year ago quarter, and 4.88% for the quarter ended March 31, 2020. The Company’s variable rate portfolio makes up approximately 49% of the total portfolio, and of those variable rate loans that have rate floors, substantially all have hit their rate floors. Cost of deposits, which include noninterest-bearing deposits, for the second quarter of 2020 was 0.87%, compared to 1.36% for the second quarter of 2019, a decrease of 49 basis points, primarily as a result of the Company having aggressively decreased its deposit rates during the second quarter in order to offset the repricing of the variable rate loan portfolio.
Noninterest income totaled $687 thousand and $539 thousand for the quarters ended June 30, 2020 and 2019, respectively. Fee income from loans was $46 thousand, for the quarter ended June 30, 2020 compared to $53 thousand for the same period of 2019. Service charges on deposit accounts and other fee income totaled $223 thousand for the second quarter of 2020, compared to $229 thousand from the year ago quarter. Income from bank-owned life insurance increased $172 thousand to $282 thousand for the three months ended June 30, 2020 compared to $110 thousand for the same period of 2019, primarily as a result of purchasing additional policies during 2019. Noninterest income for the year-to-date period ended June 30, 2020 was $1.4 million, compared to $1.3 million for the 2019 year-to-date period, an increase of $104 thousand, or 8%, which was primarily driven by an increase in income from bank-owned life insurance.
Noninterest expense totaled $8.0 million for the quarter ended June 30, 2020, compared to $7.3 million for the same three-month period of 2019. Excluding the impairment charge on branch closings, noninterest expense for the three months ended June 30, 2020 would have been $7.3 million. On a linked quarter basis, noninterest expense, excluding impairment charges, increased $113 thousand from the three months ended March 31, 2020. This increase was primarily related to planned upgrades in the Company’s network infrastructure. For the six months ended June 30, 2020 and 2019, noninterest expense, excluding impairment charges, was $14.5 million and $14.2 million, respectively. The Company continues its efforts to maintain or reduce certain expenses where possible.
The efficiency ratio, excluding impairment charges, for the quarter ended June 30, 2020 was 54.7%, a decrease from 56.2% for the year ago quarter and a decrease from 56.3% for the three months ended March 31, 2020. The efficiency ratios for the six months ended June 30, 2020 and 2019, excluding impairment charges were 54.4% and 55.5%, respectively.
The Company recorded a provision for income taxes of $754 thousand for the three months ended June 30, 2020, compared to $1.0 million for the same period of 2019. The effective tax rates for the three months ended June 30, 2020 and 2019 were 20.8% and 20.4%, respectively. The effective tax rates for the 2020 and 2019 periods presented are less than the Company’s combined federal and state statutory rate of 21.5% primarily because of discrete tax benefits recorded as a result of exercises of nonqualified stock options. For the six months ended June 30, 2020 and 2019, provision for income taxes was $1.7 million and $2.2 million, respectively.
Asset Quality
The Company recorded a provision for loan losses of $1.8 million for the three months ended June 30, 2020, compared to $505 thousand for the year ago quarter. The increase in the provision for loan losses for the three months ended June 30, 2020 is primarily related to growth in the loan portfolio and increases in qualitative factors related to the economic uncertainties caused by the COVID-19 pandemic. The Company is not required to implement the provisions of the current expected credit losses accounting standard until January 1, 2023, and is continuing to account for the allowance for loans losses under the incurred loss model. Provision for loan losses for the six months ended June 30, 2020 and 2019 were $2.8 million and $1.0 million, respectively.
The allowance for loan losses to total loans, excluding PPP loans, was 0.99% at June 30, 2020, compared to 0.81% at December 31, 2019. The allowance for loan losses to total loans on the Company’s originated loan portfolio, excluding PPP loans and excluding acquired loans, was 1.05% at June 30, 2020. Net charge-offs recorded during the second quarter of 2020 were primarily related to overdrawn consumer accounts.
Nonperforming loans and loans 90 days or more past due at June 30, 2020 totaled $8.5 million, or 0.48% of total assets. This compares to $10.7 million in nonperforming loans and loans 90 days or more past due at December 31, 2019, or 0.70% of total assets. All of the Company’s nonperforming loans are secured and have specific reserves totaling $364 thousand, representing the expected losses associated with those loans. The Company has one troubled debt restructuring at June 30, 2020 totaling $99 thousand which is a consumer residential loan. Nonperforming assets (including other real estate owned) to total assets was 0.69% at June 30, 2020 compared to 0.95% for December 31, 2019.
About FVCBankcorp, Inc.
FVCBankcorp, Inc. is the holding company for FVCbank, a wholly-owned subsidiary that commenced operations in November 2007. FVCbank is a $1.78 billion asset-sized Virginia-chartered community bank serving the banking needs of commercial businesses, nonprofit organizations, professional service entities, their owners and employees located in the greater Baltimore and Washington D.C., metropolitan areas. FVCbank is based in Fairfax, Virginia, and has 11 full-service offices in Arlington, Ashburn, Fairfax, Manassas, Reston and Springfield, Virginia, Washington D.C., and Baltimore, Bethesda, Rockville and Silver Spring, Maryland.
For more information on the Company’s selected financial information, please visit the Investor Relations page of FVCBankcorp, Inc.’s website, www.fvcbank.com.
Caution about Forward-Looking Statements
This press release contains forward-looking statements within the meaning of the Private Securities Litigation Reform Act of 1995. These statements include, but are not limited, statements of goals, intentions, and expectations as to future trends, plans, events or results of the Company’s operations and policies and regarding general economic conditions. In some cases, forward-looking statements can be identified by use of words such as “may,” “will,” “anticipates,” “believes,” “expects,” “plans,” “estimates,” “potential,” “continue,” “should,” and similar words or phrases. These statements are based upon current and anticipated economic conditions, nationally and in the Company’s market, interest rates and interest rate policy, competitive factors, and other conditions which by their nature, are not susceptible to accurate forecast and are subject to significant uncertainty. Because of these uncertainties and the assumptions on which this discussion and the forward-looking statements are based, actual future operations and results in the future may differ materially from those indicated herein. These forward-looking statements are based on current beliefs that involve significant risks, uncertainties, and assumptions. Factors that could cause the Company’s actual results to differ materially from those indicated in these forward-looking statements, include, but are not limited to, the risk factors and other cautionary language included in the Company’s Annual Report on Form 10-K for the year ended December 31, 2019 and in other periodic and current reports filed with the Securities and Exchange Commission. Because of these uncertainties and the assumptions on which the forward-looking statements are based, actual operations and results in the future may differ materially from those indicated herein. Readers are cautioned against placing undue reliance on any such forward-looking statements. The Company’s past results are not necessarily indicative of future performance.
###
FVCBankcorp, Inc.
Selected Financial Data
(Dollars in thousands, except share data and per share data)
(Unaudited)
| For the Three Months Ended June 30, | For the Six Months Ended June 30, | For the Three Months Ended | ||||||||||||||||||||||
| 2020 | 2019 | 2020 | 2019 | 3/31/2020 | 12/31/2019 | |||||||||||||||||||
| Selected Balances | ||||||||||||||||||||||||
| Total assets | $ | 1,781,149 | $ | 1,484,600 | $ | 1,602,611 | $ | 1,537,295 | ||||||||||||||||
| Total investment securities | 128,690 | 141,611 | 133,586 | 147,606 | ||||||||||||||||||||
| Loans held for sale | - - | - - | 9,640 | 11,198 | ||||||||||||||||||||
| Total loans, net of deferred fees | 1,478,120 | 1,234,372 | 1,282,142 | 1,270,526 | ||||||||||||||||||||
| Allowance for loan losses | (12,894 | ) | (9,996 | ) | (11,226 | ) | (10,231 | ) | ||||||||||||||||
| Total deposits | 1,519,036 | 1,269,374 | 1,344,044 | 1,285,722 | ||||||||||||||||||||
| Subordinated debt | 24,527 | 24,447 | 24,507 | 24,487 | ||||||||||||||||||||
| Other borrowings | 25,000 | - - | 25,000 | 25,000 | ||||||||||||||||||||
| Total stockholders’ equity | 180,652 | 170,163 | 177,688 | 179,078 | ||||||||||||||||||||
| Summary Results of Operations | ||||||||||||||||||||||||
| Interest income | $ | 16,281 | $ | 16,990 | $ | 33,212 | $ | 32,950 | $ | 16,931 | $ | 16,777 | ||||||||||||
| Interest expense | 3,586 | 4,619 | 8,306 | 8,815 | 4,720 | 4,941 | ||||||||||||||||||
| Net interest income | 12,695 | 12,371 | 24,906 | 24,135 | 12,211 | 11,836 | ||||||||||||||||||
| Provision for loan losses | 1,750 | 505 | 2,816 | 1,020 | 1,066 | 465 | ||||||||||||||||||
| Net interest income after provision for loan losses | 10,945 | 11,866 | 22,090 | 23,115 | 11,145 | 11,371 | ||||||||||||||||||
| Noninterest income - loan fees, service charges and other | 405 | 429 | 1,170 | 1,062 | 764 | 485 | ||||||||||||||||||
| Noninterest income - bank owned life insurance | 282 | 110 | 565 | 215 | 283 | 249 | ||||||||||||||||||
| Noninterest income - gain (loss) on sales of securities available-for-sale | - - | - - | 97 | - - | 97 | - - | ||||||||||||||||||
| Noninterest income - gain (loss) on loans held for sale | - - | - - | (451 | ) | - - | (451 | ) | (145 | ) | |||||||||||||||
| Noninterest expense | 7,998 | 7,276 | 15,207 | 14,180 | 7,209 | 7,334 | ||||||||||||||||||
| Income before taxes | 3,634 | 5,129 | 8,167 | 10,212 | 4,629 | 4,626 | ||||||||||||||||||
| Income tax expense | 754 | 1,044 | 1,651 | 2,201 | 896 | 902 | ||||||||||||||||||
| Net income | 2,880 | 4,085 | 6,516 | 8,011 | 3,733 | 3,724 | ||||||||||||||||||
| Per Share Data | ||||||||||||||||||||||||
| Net income, basic | $ | 0.21 | $ | 0.30 | $ | 0.49 | $ | 0.58 | $ | 0.27 | $ | 0.27 | ||||||||||||
| Net income, diluted | $ | 0.21 | $ | 0.28 | $ | 0.46 | $ | 0.54 | $ | 0.26 | $ | 0.25 | ||||||||||||
| Book value | $ | 13.42 | $ | 12.30 | $ | 13.21 | $ | 12.88 | ||||||||||||||||
| Tangible book value (1) | $ | 12.79 | $ | 11.70 | $ | 12.57 | $ | 12.26 | ||||||||||||||||
| Shares outstanding | 13,459,317 | 13,839,772 | 13,451,678 | 13,902,067 | ||||||||||||||||||||
| Selected Ratios | ||||||||||||||||||||||||
| Net interest margin (2) | 3.16 | % | 3.59 | % | 3.26 | % | 3.62 | % | 3.37 | % | 3.28 | % | ||||||||||||
| Return on average assets (2) | 0.67 | % | 1.13 | % | 0.80 | % | 1.14 | % | 0.96 | % | 0.98 | % | ||||||||||||
| Return on average equity (2) | 6.41 | % | 9.78 | % | 7.24 | % | 9.76 | % | 8.29 | % | 8.39 | % | ||||||||||||
| Efficiency (3) | 59.77 | % | 56.36 | % | 58.06 | % | 55.80 | % | 55.87 | % | 59.03 | % | ||||||||||||
| Loans, net of deferred fees to total deposits | 97.31 | % | 97.24 | % | 95.39 | % | 98.82 | % | ||||||||||||||||
| Noninterest-bearing deposits to total deposits | 29.13 | % | 21.33 | % | 21.41 | % | 23.82 | % | ||||||||||||||||
| Reconciliation of Net Income (GAAP) to Operating Earnings (Non-GAAP) (4) | ||||||||||||||||||||||||
| Net income (from above) | $ | 2,880 | $ | 4,085 | $ | 6,516 | $ | 8,011 | $ | 3,733 | $ | 3,724 | ||||||||||||
| Add: Merger and acquisition expense | - - | 16 | - - | 83 | - - | - - | ||||||||||||||||||
| Add: Impairment on branch closures | 676 | - - | 676 | - - | - - | - - | ||||||||||||||||||
| Subtract: Gains on sales of securities available-for-sale | - - | - - | (97 | ) | - - | (97 | ) | - - | ||||||||||||||||
| Less: provision for income taxes associated with non-GAAP adjustments | (142 | ) | (4 | ) | (122 | ) | (19 | ) | 20 | - - | ||||||||||||||
| Net income, as adjusted | $ | 3,414 | $ | 4,097 | $ | 6,973 | $ | 8,075 | $ | 3,656 | $ | 3,724 | ||||||||||||
| Net income, diluted, on an operating basis | $ | 0.25 | $ | 0.28 | $ | 0.50 | $ | 0.55 | $ | 0.25 | $ | 0.25 | ||||||||||||
| Return on average assets (non-GAAP operating earnings) | 0.79 | % | 1.13 | % | 0.86 | % | 1.15 | % | 0.94 | % | 0.98 | % | ||||||||||||
| Return on average equity (non-GAAP operating earnings) | 7.60 | % | 9.81 | % | 7.86 | % | 9.84 | % | 8.12 | % | 8.64 | % | ||||||||||||
| Efficiency ratio (non-GAAP operating earnings) (3) | 54.72 | % | 56.24 | % | 54.35 | % | 55.47 | % | 56.29 | % | 58.35 | % | ||||||||||||
| Capital Ratios - Bank | ||||||||||||||||||||||||
| Tangible common equity (to tangible assets) | 9.71 | % | 10.97 | % | 10.61 | % | 11.15 | % | ||||||||||||||||
| Tier 1 leverage (to average assets) | 11.05 | % | 12.10 | % | 12.06 | % | 12.15 | % | ||||||||||||||||
| Asset Quality | ||||||||||||||||||||||||
| Nonperforming loans and loans 90+ past due | $ | 8,493 | $ | 9,989 | $ | 8,896 | $ | 10,725 | ||||||||||||||||
| Performing troubled debt restructurings (TDRs) | 99 | - - | - - | - - | ||||||||||||||||||||
| Other real estate owned | 3,866 | 3,866 | 3,866 | 3,866 | ||||||||||||||||||||
| Nonperforming loans and loans 90+ past due to total assets (excl. TDRs) | 0.48 | % | 0.67 | % | 0.56 | % | 0.70 | % | ||||||||||||||||
| Nonperforming assets to total assets | 0.69 | % | 0.93 | % | 0.80 | % | 0.95 | % | ||||||||||||||||
| Nonperforming assets (including TDRs) to total assets | 0.70 | % | 0.93 | % | 0.80 | % | 0.95 | % | ||||||||||||||||
| Allowance for loan losses to loans | 0.87 | % | 0.81 | % | 0.88 | % | 0.81 | % | ||||||||||||||||
| Allowance for loan losses to nonperforming loans | 151.82 | % | 100.07 | % | 126.19 | % | 95.39 | % | ||||||||||||||||
| Net charge-offs | $ | 82 | $ | 20 | $ | 153 | $ | 182 | $ | 71 | $ | 303 | ||||||||||||
| Net charge-offs to average loans (2) | 0.02 | % | 0.01 | % | 0.02 | % | 0.03 | % | 0.02 | % | 0.10 | % | ||||||||||||
| Selected Average Balances | ||||||||||||||||||||||||
| Total assets | $ | 1,721,612 | $ | 1,444,588 | $ | 1,636,284 | $ | 1,399,949 | $ | 1,550,958 | $ | 1,514,124 | ||||||||||||
| Total earning assets | 1,615,125 | 1,384,516 | 1,536,659 | 1,346,110 | 1,458,308 | 1,430,397 | ||||||||||||||||||
| Total loans, net of deferred fees | 1,415,383 | 1,207,933 | 1,347,021 | 1,173,134 | 1,281,969 | 1,234,183 | ||||||||||||||||||
| Total deposits | 1,459,834 | 1,228,595 | 1,370,263 | 1,188,841 | 1,280,693 | 1,270,821 | ||||||||||||||||||
| Other Data | ||||||||||||||||||||||||
| Noninterest-bearing deposits | $ | 442,443 | $ | 270,711 | $ | 287,801 | $ | 306,235 | ||||||||||||||||
| Interest-bearing checking, savings and money market | 655,959 | 596,701 | 581,005 | 525,138 | ||||||||||||||||||||
| Time deposits | 320,628 | 319,740 | 350,712 | 354,362 | ||||||||||||||||||||
| Wholesale deposits | 100,006 | 82,222 | 124,526 | 99,987 | ||||||||||||||||||||
| (1) Non-GAAP Reconciliation | ||||||||||||||||||||||||
| For the Period Ended June 30, | ||||||||||||||||||||||||
| (Dollars in thousands, except per share data) | 2020 | 2019 | ||||||||||||||||||||||
| Total stockholders’ equity | $ | 180,652 | $ | 170,163 | ||||||||||||||||||||
| Less: goodwill and intangibles, net | (8,525 | ) | (8,223 | ) | ||||||||||||||||||||
| Tangible Common Equity | $ | 172,127 | $ | 161,940 | ||||||||||||||||||||
| Book value per common share | $ | 13.42 | $ | 12.30 | ||||||||||||||||||||
| Less: intangible book value per common share | (0.63 | ) | (0.60 | ) | ||||||||||||||||||||
| Tangible book value per common share | $ | 12.79 | $ | 11.70 | ||||||||||||||||||||
(2) Annualized.
(3) Efficiency ratio is calculated as noninterest expense divided by the sum of net interest income and noninterest income. On a non-GAAP operating basis, the Company excludes gains (losses) on sales of investment securities.
(4) Some of the financial measures discussed throughout the press release are "non-GAAP financial measures." In accordance with SEC rules, the Company classifies a financial measure as being a non-GAAP financial measure if that financial measure excludes or includes amounts, or is subject to adjustments that have the effect of excluding or including amounts, that are included or excluded, as the case may be, in the most directly comparable measure calculated and presented in accordance with GAAP in our statements of income, balance sheets or statements of cash flows.
FVCBankcorp, Inc.
Summary Consolidated Statements of Condition
(Dollars in thousands)
(Unaudited)
| % Change | % Change | |||||||||||||||||||||||
| Current | From | |||||||||||||||||||||||
| 6/30/2020 | 3/31/2020 | Quarter | 12/31/2019 | 6/30/2019 | Year Ago | |||||||||||||||||||
| Cash and due from banks | $ | 25,613 | $ | 23,158 | 10.6 | % | $ | 14,916 | $ | 15,201 | 68.5 | % | ||||||||||||
| Interest-bearing deposits at other financial institutions | 64,989 | 62,402 | 4.1 | % | 18,226 | 29,149 | 123.0 | % | ||||||||||||||||
| Investment securities | 122,082 | 126,978 | -3.9 | % | 141,589 | 136,232 | -10.4 | % | ||||||||||||||||
| Restricted stock, at cost | 6,608 | 6,608 | 0.0 | % | 6,017 | 5,379 | 22.8 | % | ||||||||||||||||
| Loans held for sale, at fair value | - - | 9,640 | -100.0 | % | 11,198 | - - | 0.0 | % | ||||||||||||||||
| Loans, net of fees: | ||||||||||||||||||||||||
| Commercial real estate | 779,036 | 763,767 | 2.0 | % | 747,993 | 662,173 | 17.6 | % | ||||||||||||||||
| Commercial and industrial | 105,957 | 106,302 | -0.3 | % | 114,924 | 134,466 | -21.2 | % | ||||||||||||||||
| Paycheck protection program | 169,425 | - - | 100.0 | % | - - | - - | 100.0 | % | ||||||||||||||||
| Commercial construction | 227,746 | 220,798 | 3.1 | % | 214,949 | 217,105 | 4.9 | % | ||||||||||||||||
| Consumer real estate | 177,366 | 180,977 | -2.0 | % | 181,369 | 196,114 | -9.6 | % | ||||||||||||||||
| Consumer nonresidential | 18,590 | 10,298 | 80.5 | % | 11,291 | 24,514 | -24.2 | % | ||||||||||||||||
| Total loans, net of fees | 1,478,120 | 1,282,142 | 15.3 | % | 1,270,526 | 1,234,372 | 19.7 | % | ||||||||||||||||
| Allowance for loan losses | (12,894 | ) | (11,226 | ) | 14.9 | % | (10,231 | ) | (9,996 | ) | 29.0 | % | ||||||||||||
| Loans, net | 1,465,226 | 1,270,916 | 15.3 | % | 1,260,295 | 1,224,376 | 19.7 | % | ||||||||||||||||
| Premises and equipment, net | 1,818 | 2,090 | -13.0 | % | 2,084 | 2,049 | -11.3 | % | ||||||||||||||||
| Goodwill and intangibles, net | 8,525 | 8,612 | -1.0 | % | 8,689 | 8,223 | 3.7 | % | ||||||||||||||||
| Bank owned life insurance (BOLI) | 37,633 | 37,352 | 0.8 | % | 37,069 | 26,621 | 41.4 | % | ||||||||||||||||
| Other real estate owned | 3,866 | 3,866 | 0.0 | % | 3,866 | 3,866 | 0.0 | % | ||||||||||||||||
| Other assets | 44,789 | 50,989 | -12.2 | % | 33,346 | 33,504 | 33.7 | % | ||||||||||||||||
| Total Assets | $ | 1,781,149 | $ | 1,602,611 | 11.1 | % | $ | 1,537,295 | $ | 1,484,600 | 20.0 | % | ||||||||||||
| Deposits: | ||||||||||||||||||||||||
| Noninterest-bearing | $ | 442,443 | $ | 287,801 | 53.7 | % | $ | 306,235 | $ | 270,711 | 63.4 | % | ||||||||||||
| Interest-bearing checking | 387,683 | 309,458 | 25.3 | % | 302,755 | 301,319 | 28.7 | % | ||||||||||||||||
| Savings and money market | 268,276 | 271,547 | -1.2 | % | 222,383 | 295,382 | -9.2 | % | ||||||||||||||||
| Time deposits | 320,628 | 350,712 | -8.6 | % | 354,362 | 319,740 | 0.3 | % | ||||||||||||||||
| Wholesale deposits | 100,006 | 124,526 | -19.7 | % | 99,987 | 82,222 | 21.6 | % | ||||||||||||||||
| Total deposits | 1,519,036 | 1,344,044 | 13.0 | % | 1,285,722 | 1,269,374 | 19.7 | % | ||||||||||||||||
| Other borrowed funds | 25,000 | 25,000 | 0.0 | % | 25,000 | - - | 100.0 | % | ||||||||||||||||
| Subordinated notes, net of issuance costs | 24,527 | 24,507 | 0.1 | % | 24,487 | 24,447 | 0.3 | % | ||||||||||||||||
| Other liabilities | 31,934 | 31,372 | 1.8 | % | 23,008 | 20,616 | 54.9 | % | ||||||||||||||||
| Stockholders’ equity | 180,652 | 177,688 | 1.7 | % | 179,078 | 170,163 | 6.2 | % | ||||||||||||||||
| Total Liabilities & Stockholders' Equity | $ | 1,781,149 | $ | 1,602,611 | 11.1 | % | $ | 1,537,295 | $ | 1,484,600 | 20.0 | % | ||||||||||||
FVCBankcorp, Inc.
Summary Consolidated Income Statements
(In thousands, except per share data)
(Unaudited)
| For the Three Months Ended | ||||||||||||||||||||
| % Change | % Change | |||||||||||||||||||
| Current | From | |||||||||||||||||||
| 6/30/2020 | 3/31/2020 | Quarter | 6/30/2019 | Year Ago | ||||||||||||||||
| Net interest income | $ | 12,695 | $ | 12,211 | 4.0 | % | $ | 12,371 | 2.6 | % | ||||||||||
| Provision for loan losses | 1,750 | 1,066 | 64.2 | % | 505 | 246.5 | % | |||||||||||||
| Net interest income after provision for loan losses | 10,945 | 11,145 | -1.8 | % | 11,866 | -7.8 | % | |||||||||||||
| Noninterest income: | ||||||||||||||||||||
| Fees on loans | 46 | 396 | -88.4 | % | 53 | -13.2 | % | |||||||||||||
| Service charges on deposit accounts | 223 | 239 | -6.7 | % | 229 | -2.6 | % | |||||||||||||
| Gain on sale of securities available-for-sale | - - | 97 | -100.0 | % | - - | 0.0 | % | |||||||||||||
| Loss on loans held for sale | - - | (451 | ) | -100.0 | % | - - | 0.0 | % | ||||||||||||
| BOLI income | 282 | 283 | -0.4 | % | 110 | 156.4 | % | |||||||||||||
| Other fee income | 136 | 129 | 5.4 | % | 147 | -7.5 | % | |||||||||||||
| Total noninterest income | 687 | 693 | -0.9 | % | 539 | 27.5 | % | |||||||||||||
| Noninterest expense: | ||||||||||||||||||||
| Salaries and employee benefits | 3,982 | 4,028 | -1.1 | % | 4,245 | -6.2 | % | |||||||||||||
| Occupancy and equipment expense | 859 | 855 | 0.5 | % | 873 | -1.6 | % | |||||||||||||
| Data processing and network administration | 494 | 434 | 13.8 | % | 343 | 44.0 | % | |||||||||||||
| State franchise taxes | 466 | 466 | 0.0 | % | 426 | 9.4 | % | |||||||||||||
| Professional fees | 207 | 225 | -8.0 | % | 274 | -24.5 | % | |||||||||||||
| Merger and acquisition expense | - - | - - | 0.0 | % | 16 | -100.0 | % | |||||||||||||
| Impairment on branch closures | 676 | - - | 100.0 | % | - - | 100.0 | % | |||||||||||||
| Other operating expense | 1,314 | 1,201 | 9.4 | % | 1,099 | 19.6 | % | |||||||||||||
| Total noninterest expense | 7,998 | 7,209 | 10.9 | % | 7,276 | 9.9 | % | |||||||||||||
| Net income before income taxes | 3,634 | 4,629 | -21.5 | % | 5,129 | -29.1 | % | |||||||||||||
| Income tax expense | 754 | 896 | -15.8 | % | 1,044 | -27.8 | % | |||||||||||||
| Net Income | $ | 2,880 | $ | 3,733 | -22.9 | % | $ | 4,085 | -29.5 | % | ||||||||||
| Earnings per share - basic | $ | 0.21 | $ | 0.27 | -21.1 | % | $ | 0.30 | -27.7 | % | ||||||||||
| Earnings per share - diluted | $ | 0.21 | $ | 0.26 | -19.1 | % | $ | 0.28 | -25.0 | % | ||||||||||
| Weighted-average common shares outstanding - basic | 13,455,053 | 13,751,768 | 13,802,712 | |||||||||||||||||
| Weighted-average common shares outstanding - diluted | 13,924,239 | 14,595,447 | 14,817,462 | |||||||||||||||||
| Reconciliation of Net Income (GAAP) to Operating Earnings (Non-GAAP): | ||||||||||||||||||||
| GAAP net income reported above | $ | 2,880 | $ | 3,733 | $ | 4,085 | ||||||||||||||
| Add: Merger and acquisition expense | - - | - - | 16 | |||||||||||||||||
| Add: Impairment loss | 676 | - - | - - | |||||||||||||||||
| Subtract: Gain on sales of securities available-for-sale | - - | (97 | ) | - - | ||||||||||||||||
| Subtract: provision for income taxes associated with non-GAAP adjustments | (142 | ) | 20 | (4 | ) | |||||||||||||||
| Net Income, excluding above merger and acquisition charges | $ | 3,414 | $ | 3,656 | $ | 4,097 | ||||||||||||||
| Earnings per share - basic (excluding Non-GAAP items) | $ | 0.25 | $ | 0.27 | $ | 0.30 | ||||||||||||||
| Earnings per share - diluted (excluding Non-GAAP items) | $ | 0.25 | $ | 0.25 | $ | 0.28 | ||||||||||||||
| Return on average assets (non-GAAP operating earnings) | 0.79 | % | 0.94 | % | 1.13 | % | ||||||||||||||
| Return on average equity (non-GAAP operating earnings) | 7.60 | % | 8.12 | % | 9.81 | % | ||||||||||||||
| Efficiency ratio (non-GAAP operating earnings) | 54.72 | % | 56.29 | % | 56.24 | % | ||||||||||||||
| Reconciliation of Net Income (GAAP) to Pre-Tax Pre-Provision Income (Non-GAAP): | ||||||||||||||||||||
| GAAP net income reported above | $ | 2,880 | $ | 3,733 | $ | 4,085 | ||||||||||||||
| Add: Provision for loan losses | 1,750 | 1,066 | 505 | |||||||||||||||||
| Add: Impairment losses | 676 | - - | - - | |||||||||||||||||
| Subtract: Gain on sales of securities available-for-sale | - - | (97 | ) | - - | ||||||||||||||||
| Add: Income tax expense | 754 | 896 | 1,044 | |||||||||||||||||
| Pre-tax pre-provision income | $ | 6,060 | $ | 5,598 | $ | 5,634 | ||||||||||||||
| Earnings per share - basic (excluding Non-GAAP items) | $ | 0.45 | $ | 0.41 | $ | 0.41 | ||||||||||||||
| Earnings per share - diluted (excluding Non-GAAP items) | $ | 0.44 | $ | 0.38 | $ | 0.38 | ||||||||||||||
| Return on average assets (non-GAAP operating earnings) | 1.41 | % | 1.44 | % | 1.56 | % | ||||||||||||||
| Return on average equity (non-GAAP operating earnings) | 13.49 | % | 12.43 | % | 13.49 | % | ||||||||||||||
FVCBankcorp, Inc.
Summary Consolidated Income Statements
(In thousands, except per share data)
(Unaudited)
| For the Six Months Ended | ||||||||||||
| % Change | ||||||||||||
| From | ||||||||||||
| 6/30/2020 | 6/30/2019 | Year Ago | ||||||||||
| Net interest income | $ | 24,906 | $ | 24,135 | 3.2 | % | ||||||
| Provision for loan losses | 2,816 | 1,020 | 176.1 | % | ||||||||
| Net interest income after provision for loan losses | 22,090 | 23,115 | -4.4 | % | ||||||||
| Noninterest income: | ||||||||||||
| Fees on loans | 442 | 400 | 10.5 | % | ||||||||
| Service charges on deposit accounts | 463 | 411 | 12.7 | % | ||||||||
| Gain on sale of securities available-for-sale | 97 | - - | 100.0 | % | ||||||||
| Loss on loans held for sale | (451 | ) | - - | 100.0 | % | |||||||
| BOLI income | 565 | 215 | 162.8 | % | ||||||||
| Other fee income | 265 | 251 | 5.6 | % | ||||||||
| Total noninterest income | 1,381 | 1,277 | 8.1 | % | ||||||||
| Noninterest expense: | ||||||||||||
| Salaries and employee benefits | 8,010 | 8,183 | -2.1 | % | ||||||||
| Occupancy and equipment expense | 1,715 | 1,700 | 0.9 | % | ||||||||
| Data processing and network administration | 928 | 782 | 18.7 | % | ||||||||
| State franchise taxes | 932 | 848 | 9.9 | % | ||||||||
| Professional fees | 432 | 404 | 6.9 | % | ||||||||
| Merger and acquisition expense | - - | 83 | -100.0 | % | ||||||||
| Impairment on branch closures | 676 | - - | 100.0 | % | ||||||||
| Other operating expense | 2,514 | 2,180 | 15.3 | % | ||||||||
| Total noninterest expense | 15,207 | 14,180 | 7.2 | % | ||||||||
| Net income before income taxes | 8,264 | 10,212 | -19.1 | % | ||||||||
| Income tax expense | 1,651 | 2,201 | -25.0 | % | ||||||||
| Net Income | $ | 6,613 | $ | 8,011 | -17.5 | % | ||||||
| Earnings per share - basic | $ | 0.49 | $ | 0.58 | -16.3 | % | ||||||
| Earnings per share - diluted | $ | 0.46 | $ | 0.54 | -14.3 | % | ||||||
| Weighted-average common shares outstanding - basic | 13,603,411 | 13,763,472 | ||||||||||
| Weighted-average common shares outstanding - diluted | 14,259,843 | 14,798,708 | ||||||||||
| Reconciliation of Net Income (GAAP) to Operating Earnings (Non-GAAP): | ||||||||||||
| GAAP net income reported above | $ | 6,613 | $ | 8,011 | ||||||||
| Add: Merger and acquisition expense | - - | 83 | ||||||||||
| Add: Impairment loss | 676 | - - | ||||||||||
| Subtract: Gain on sales of securities available-for-sale | (97 | ) | - - | |||||||||
| Subtract: provision for income taxes associated with non-GAAP adjustments | (122 | ) | (19 | ) | ||||||||
| Net Income, excluding above merger and acquisition charges | $ | 7,070 | $ | 8,075 | ||||||||
| Earnings per share - basic (excluding merger and acquisition charges) | $ | 0.52 | $ | 0.59 | ||||||||
| Earnings per share - diluted (excluding merger and acquisition charges) | $ | 0.50 | $ | 0.55 | ||||||||
| Return on average assets (non-GAAP operating earnings) | 0.86 | % | 1.15 | % | ||||||||
| Return on average equity (non-GAAP operating earnings) | 7.86 | % | 9.84 | % | ||||||||
| Efficiency ratio (non-GAAP operating earnings) | 54.35 | % | 55.47 | % | ||||||||
| Reconciliation of Net Income (GAAP) to Pre-Tax Pre-Provision Income (Non-GAAP): | ||||||||||||
| GAAP net income reported above | $ | 6,613 | $ | 8,011 | ||||||||
| Add: Provision for loan losses | 2,816 | 1,020 | ||||||||||
| Add: Impairment losses | 676 | - - | ||||||||||
| Subtract: Gain on sales of securities available-for-sale | (97 | ) | - - | |||||||||
| Add: Income tax expense | 1,651 | 2,201 | ||||||||||
| Pre-tax pre-provision income | $ | 11,659 | $ | 11,232 | ||||||||
| Earnings per share - basic (excluding Non-GAAP items) | $ | 0.86 | $ | 0.82 | ||||||||
| Earnings per share - diluted (excluding Non-GAAP items) | $ | 0.82 | $ | 0.76 | ||||||||
| Return on average assets (non-GAAP operating earnings) | 1.43 | % | 1.60 | % | ||||||||
| Return on average equity (non-GAAP operating earnings) | 12.96 | % | 13.68 | % | ||||||||
FVCBankcorp, Inc.
Average Statements of Condition and Yields on Earning Assets and Interest-Bearing Liabilities
(Dollars in thousands)
(Unaudited)
| For the Three Months Ended | ||||||||||||||||||||||||
| 6/30/2020 | 3/31/2020 | 6/30/2019 | ||||||||||||||||||||||
| Average Balance | Average Yield | Average Balance | Average Yield | Average Balance | Average Yield | |||||||||||||||||||
| Interest-earning assets: | ||||||||||||||||||||||||
| Loans receivable, net of fees (1) | ||||||||||||||||||||||||
| Commercial real estate (2) | $ | 844,774 | 4.37 | % | $ | 832,545 | 4.77 | % | $ | 717,248 | 4.86 | % | ||||||||||||
| Commercial and industrial | 103,226 | 4.99 | % | 110,186 | 5.70 | % | 135,335 | 6.07 | % | |||||||||||||||
| Paycheck protection program | 121,843 | 2.63 | % | - - | 0.0 | % | - - | 0.0 | % | |||||||||||||||
| Commercial construction | 222,685 | 4.65 | % | 220,104 | 5.09 | % | 198,927 | 5.71 | % | |||||||||||||||
| Consumer real estate | 103,335 | 4.47 | % | 108,454 | 4.53 | % | 129,605 | 5.25 | % | |||||||||||||||
| Consumer nonresidential | 19,520 | 7.37 | % | 10,680 | 4.81 | % | 26,818 | 7.70 | % | |||||||||||||||
| Total loans | 1,415,383 | 4.36 | % | 1,281,969 | 4.88 | % | 1,207,933 | 5.24 | % | |||||||||||||||
| Investment securities (3)(4) | 128,797 | 2.65 | % | 143,634 | 2.70 | % | 144,056 | 2.73 | % | |||||||||||||||
| Loans held for sale, at fair value | - - | 0.0 | % | 10,492 | 8.99 | % | - - | 0.0 | % | |||||||||||||||
| Interest-bearing deposits at other financial institutions | 70,945 | 0.12 | % | 22,213 | 1.48 | % | 32,527 | 2.39 | % | |||||||||||||||
| Total interest-earning assets | 1,615,125 | 4.03 | % | 1,458,308 | 4.65 | % | 1,384,516 | 4.91 | % | |||||||||||||||
| Non-interest earning assets: | ||||||||||||||||||||||||
| Cash and due from banks | 19,645 | 13,431 | 7,597 | |||||||||||||||||||||
| Premises and equipment, net | 2,050 | 1,941 | 2,152 | |||||||||||||||||||||
| Accrued interest and other assets | 96,362 | 87,560 | 60,016 | |||||||||||||||||||||
| Allowance for loan losses | (11,570 | ) | (10,282 | ) | (9,693 | ) | ||||||||||||||||||
| Total Assets | $ | 1,721,612 | $ | 1,550,958 | $ | 1,444,588 | ||||||||||||||||||
| Interest-bearing liabilities: | ||||||||||||||||||||||||
| Interest checking | $ | 341,081 | 0.70 | % | $ | 273,976 | 1.29 | % | $ | 301,132 | 1.28 | % | ||||||||||||
| Savings and money market | 263,588 | 0.66 | % | 227,497 | 1.12 | % | 275,129 | 1.54 | % | |||||||||||||||
| Time deposits | 321,775 | 2.15 | % | 353,809 | 2.35 | % | 299,551 | 2.17 | % | |||||||||||||||
| Wholesale deposits | 132,072 | 1.23 | % | 121,047 | 1.92 | % | 88,064 | 2.52 | % | |||||||||||||||
| Total interest-bearing deposits | 1,058,516 | 1.20 | % | 976,329 | 1.72 | % | 963,876 | 1.74 | % | |||||||||||||||
| Other borrowed funds | 25,000 | 0.50 | % | 39,141 | 1.53 | % | 4,754 | 2.65 | % | |||||||||||||||
| Subordinated notes, net of issuance costs | 24,514 | 6.48 | % | 24,494 | 6.49 | % | 24,434 | 6.48 | % | |||||||||||||||
| Total interest-bearing liabilities | 1,108,030 | 1.30 | % | 1,039,964 | 1.83 | % | 993,064 | 1.87 | % | |||||||||||||||
| Noninterest-bearing liabilities: | ||||||||||||||||||||||||
| Noninterest-bearing deposits | 401,318 | 304,364 | 264,719 | |||||||||||||||||||||
| Other liabilities | 32,585 | 26,476 | 19,776 | |||||||||||||||||||||
| Stockholders’ equity | 179,679 | 180,154 | 167,029 | |||||||||||||||||||||
| Total Liabilities and Stockholders' Equity | $ | 1,721,612 | $ | 1,550,958 | $ | 1,444,588 | ||||||||||||||||||
| Net Interest Margin | 3.16 | % | 3.37 | % | 3.59 | % | ||||||||||||||||||
| (1) | Non-accrual loans are included in average balances. |
| (2) | Includes loans for residential 1-4 trust investment purposes totaling $75.0 million, $75.3 million and $71.2 million at June 30, 2020, March 31, 2020 and June 30, 2019, respectively. These loans are reported as Consumer Real Estate on the summary balance sheet. |
| (3) | The average yields for investment securities are reported on a fully taxable-equivalent basis at a rate of 21% . |
| (4) | The average balances for investment securities includes restricted stock. |
FVCBankcorp, Inc.
Average Statements of Condition and Yields on Earning Assets and Interest-Bearing Liabilities
(Dollars in thousands)
(Unaudited)
| For the Six Months Ended | ||||||||||||||||
| 6/30/2020 | 6/30/2019 | |||||||||||||||
| Average | Average | Average | Average | |||||||||||||
| Balance | Yield | Balance | Yield | |||||||||||||
| Interest-earning assets: | ||||||||||||||||
| Loans receivable, net of fees (1) | ||||||||||||||||
| Commercial real estate (2) | $ | 838,660 | 4.57 | % | $ | 698,363 | 4.79 | % | ||||||||
| Commercial and industrial | 106,705 | 5.36 | % | 135,070 | 6.35 | % | ||||||||||
| Paycheck protection program | 60,921 | 2.63 | % | - - | 0.0 | % | ||||||||||
| Commercial construction | 221,395 | 4.87 | % | 179,014 | 5.71 | % | ||||||||||
| Consumer real estate | 105,895 | 4.50 | % | 131,760 | 5.25 | % | ||||||||||
| Consumer nonresidential | 13,445 | 7.26 | % | 28,927 | 7.64 | % | ||||||||||
| Total loans | 1,347,021 | 4.61 | % | 1,173,134 | 5.23 | % | ||||||||||
| Investment securities (3)(4) | 136,160 | 2.68 | % | 144,082 | 2.72 | % | ||||||||||
| Loans held for sale, at fair value | 6,899 | 6.84 | % | - - | 0.0 | % | ||||||||||
| Interest-bearing deposits at other financial institutions | 46,579 | 0.44 | % | 28,894 | 2.20 | % | ||||||||||
| Total interest-earning assets | 1,536,659 | 4.32 | % | 1,346,110 | 4.90 | % | ||||||||||
| Non-interest earning assets: | ||||||||||||||||
| Cash and due from banks | 16,537 | 6,707 | ||||||||||||||
| Premises and equipment, net | 1,996 | 2,223 | ||||||||||||||
| Accrued interest and other assets | 92,018 | 54,284 | ||||||||||||||
| Allowance for loan losses | (10,926 | ) | (9,375 | ) | ||||||||||||
| Total Assets | $ | 1,636,284 | $ | 1,399,949 | ||||||||||||
| Interest-bearing liabilities: | ||||||||||||||||
| Interest checking | $ | 307,528 | 0.97 | % | $ | 298,585 | 1.28 | % | ||||||||
| Savings and money market | 245,542 | 0.88 | % | 255,636 | 1.51 | % | ||||||||||
| Time deposits | 337,792 | 2.27 | % | 303,643 | 2.07 | % | ||||||||||
| Wholesale deposits | 126,560 | 1.57 | % | 81,459 | 2.49 | % | ||||||||||
| Total interest-bearing deposits | 1,017,422 | 1.45 | % | 939,323 | 1.70 | % | ||||||||||
| Other borrowed funds | 32,071 | 1.14 | % | 7,015 | 2.67 | % | ||||||||||
| Subordinated notes, net of issuance costs | 24,504 | 6.48 | % | 24,424 | 6.52 | % | ||||||||||
| Total interest-bearing liabilities | 1,073,997 | 1.56 | % | 970,762 | 1.83 | % | ||||||||||
| Noninterest-bearing liabilities: | ||||||||||||||||
| Noninterest-bearing deposits | 352,841 | 249,518 | ||||||||||||||
| Other liabilities | 29,529 | 15,498 | ||||||||||||||
| Stockholders’ equity | 179,917 | 164,171 | ||||||||||||||
| Total Liabilities and Stockholders' Equity | $ | 1,636,284 | $ | 1,399,949 | ||||||||||||
| Net Interest Margin | 3.26 | % | 3.62 | % | ||||||||||||
| (1) | Non-accrual loans are included in average balances. |
| (2) | Includes loans for residential 1-4 trust investment purposes totaling $75.0 million and $71.2 million at June 30, 2020 and June 30, 2019, respectively. These loans are reported as Consumer Real Estate on the summary balance sheet. |
| (3) | The average yields for investment securities are reported on a fully taxable-equivalent basis at a rate of 21%. |
| (4) | The average balances for investment securities includes restricted stock. |